Embed Size (px)
Citation preview

HR Metrics Catalogue

Table of Contents Employee Census
Headcount ........................................................................................................................................................................................................ 1 Gender Ratio .................................................................................................................................................................................................... 3 Ethnic Diversity Ratio .................................................................................................................................................................................... 5 Age Ratio ........................................................................................................................................................................................................... 7 Job Type Census ............................................................................................................................................................................................. 9 Employee Benefit Participation ............................................................................................................................................................... 11
Basic Ratios
Salary Rollup Metric ..................................................................................................................................................................................... 13 Average Salary Metric ................................................................................................................................................................................. 15 Turnover Ratio ............................................................................................................................................................................................... 17 Tenure ............................................................................................................................................................................................................... 19 Performance Metrics ................................................................................................................................................................................... 21 Open Requisitions ........................................................................................................................................................................................ 23
Advanced Ratios
Span of Control ............................................................................................................................................................................................. 25 Key Employee Identifier ............................................................................................................................................................................. 27 Succession Planning Report ..................................................................................................................................................................... 29 Employee Surveys Ratios ........................................................................................................................................................................... 31 Training ............................................................................................................................................................................................................ 33

Introduction
As an HR Professional, you know that understanding your workforce empowers your organisation to make business decisions. Tabular HR reports are often difficult to interpret and are equally difficult to maintain. OrgPlus Enterprise gives you a new, powerful visual way to digest workforce information.
OrgPlus Enterprise not only provides you with a tool to navigate your organisational structure but also provides you with a Workforce Intelligence platform. The first step to using OrgPlus Enterprise as a Workforce Intelligence platform is to define a set of key metrics that allow you to measure the overall state and performance of your workforce.
The HumanConcepts Professional Services Team will help you define your metrics views and to visualise and track them using OrgPlus Enterprise. We look forward to working with you and hope you will find this reference guide a useful starting point toward analysing and improving the performance of your workforce.
Sincerely,
Alan Gillette,
Director of Professional Services

Implementation Checklist After reviewing this guide, use the following checklist to select the metrics of interest to you.
Employee Census
Headcount - EC001
Gender Ratio - EC002
Ethnic Diversity Ratio - EC003
Age Ratio - EC004
Job Type Census - EC005
Employee Benefit Participation - EC006
Basic Ratios
Salary Rollup - BR001
Average Salary by Job Code - BR002
Turnover Ratio - BR003
Tenure - BR004
Performance - BR005
Open Requisitions - BR006
Advanced Ratios
Span of Control - AR001
Key Employees - AR002
Retirement Planning - AR003
Employee Surveys - AR004
Training - AR005
Other Ratios
If you are interested in other metrics, please list them below.

w
x
z
y
Headcount
Gender Ratio
Ethnic Diversity Ratio
Age Ratio
Job Type Census
Employee Benefit Participation
Chapter 1: Employee Census
© 2006 HumanConcepts 1
CHAPTER 1
Headcount
R E F E R E N C E N U M B E R : EC001
Description
Headcount calculation is one of the most basic organisational metrics that answers a simple question; how many employees are there in any branch of my organisation?
Business Case
Headcount is used for internal management and financial reports, as well as external reporting. Headcount calculations form the basis of many other workforce and company performance ratios, such as Turnover, Cost to Manage and HR Ratios, among others.
Required Data
None
Samples

2 © 2006 HumanConcepts
CHAPTER 1
Implementation Considerations
There are many considerations that can be taken into account when defining the headcount calculation. In fact, multiple headcount metrics may be desirable. Some metrics are listed below. Your HumanConcepts Professional Services Consultant can work with you to define calculations that take into account the available data and your business needs.
Headcount by Employee Status
Example: Active, Leave of Absence (LOA), Separated, Retired
Most organisations only include active employees (including employees on LOA) in their Headcount calculations. Although Retired and Separated employees are sometimes active in HRMS and ERP systems, in order to present an accurate picture of the workforce, these employees are normally excluded from Headcount calculations.
Headcount by Employee Type
Example: Full-time, Part-time, Contractor, On-site vendor
Most organisations exclude non-permanent staff, such as on-shore and off-shore contractors and on-site vendors from Headcount calculations. Organisations that rely heavily on on-shore contract staff may choose to run separate headcount reports to highlight the number of people who are on temporary assignments, as well as their distribution across departments and divisions.
Headcount by Employee Location
Example: California, United States, Western Region
Headcount by Locations reports are very useful in visualising the distribution of your employees, and are often required by government regulations. These reports can also be used to evaluate if the employees are located in places that most benefit the execution of the organisation’s priorities.
Notes

© 2006 HumanConcepts 3
CHAPTER 1
Gender Ratio
R E F E R E N C E N U M B E R : EC002
Description
Gender Ratio displays information about the organisation’s gender composition. Gender Ratio is commonly calculated by Division, Department, Location and Job Type.
Business Case
Gender Ratio helps HR Professionals understand workforce composition in various business units and across multiple locations and job types. Gender Ratio calculation is used to monitor hiring practices and is critical in validating that compensation is allocated in a gender-neutral way. In addition to helping companies comply with Equal Opportunity Employment laws and monitor employment practices to limit potential exposure to litigation, the Gender Ratio can help HR Professionals and line managers define programs that will benefit the greatest number of employees.
Required Data
Gender Example: Male, Female, Not disclosed
Samples
4 © 2006 HumanConcepts
CHAPTER 1
Implementation Considerations
There are many considerations that can be taken into account when defining the gender ratio calculation. In fact, multiple gender ratio metrics may be desirable. Some metrics are listed below. Your HumanConcepts Professional Services Consultant can work with you to define calculations that take into account the available data and your business needs.
Division, Department
Example: Automotive, Marketing
Most organisations report Gender Ratios separately for each department, division or business unit. Separate calculations facilitate cross-department comparisons and make it easier to spot trends.
Location
Example: Factory #65, San Francisco Office
Most organisations include Location information in their Gender Ratio reporting. Hiring conditions may differ depending on the location, especially internationally, and it may only be useful to compare Gender Ratio to other departments or divisions operating in similar regulatory and cultural environments. Location information can be very important for organisations that operate retail stores, movie theatres or other businesses characterised by multiple branches that are very similar. Absent a compelling reason, branch offices in similar locations should have similar Gender Ratios.
Job Type
Example: Engineering Manager, Customer Service Associate
Most organisations include Job Type (or Job Code) information in their Gender Ratio reporting. Comparing Gender Ratios for similar Job Types and functions at different divisions or business units should yield a similar proportion of men to women. Significant unexplained differences in the ratio of men to women at similar departments within different business units could indicate systemic problems that should be remedied.
Notes

© 2006 HumanConcepts 5
CHAPTER 1
Ethnic Diversity Ratio
R E F E R E N C E N U M B E R : EC003
Description
Ethnic Diversity Ratio displays information about the organisation’s ethnic composition. Ethnic Diversity is commonly calculated at an aggregate level (White vs. Minority) and a detail level (% White, % Asian, % Hispanic) for each department, division and location.
Business Case
Ethnic Diversity Ratio helps HR Professionals understand workforce composition in various business units and across multiple locations and job types. Ethnic Diversity calculation is used to monitor hiring practices and is critical in validating that hiring, compensation and promotions are blind with respect to ethnicity.
Some jurisdictions in the United States and many foreign countries require minimum representation for certain minorities – the Ethnic Diversity Ratio can help your organisation comply with these rules. The Ethnic Diversity Ratio can be also be used to compare your organisation to industry peers.
Required Data
Ethnicity Example: White, Asian, Black, Hispanic
Samples

6 © 2006 HumanConcepts
CHAPTER 1
Implementation Considerations
There are many considerations that can be taken into account when defining the ethnic diversity calculation. In fact, multiple ethnic diversity metrics may be desirable. Some metrics are listed below. Your HumanConcepts Professional Services Consultant can work with you to define calculations that take into account the available data and your business needs.
Division, Department
Example: Automotive, Marketing
Most organisations calculate the Ethnicity Diversity Ratio separately for each department, division and location. Separate calculations facilitate cross-department comparisons and make it easier to spot developing trends.
Location
Example: Store #2659, Boston Office
Location information is usually included in Ethnic Diversity Ratio reporting. Demographics often differ depending on the location, especially internationally, and it may only be useful to compare the Ethnic Diversity Ratio for departments and divisions that operate in similar environments. Large organisations in similar lines of business operating in the same area should have similar Ethnic Diversity Ratios.
Job Type
Example: Engineering Manager, Customer Service Associate
Most organisations include Job Type (or Job Code) information in their Ethnic Diversity Ratio reporting. Comparing Ethnic Diversity Ratios for similar positions in similar functions at different divisions or business units should yield similar proportion of whites to minorities. Absent a compelling reason, significant differences in the ratio of whites to minorities among different business units could indicate systemic problems that should be remedied.
Promotion Rate
Example: Promoted from Accountant to Sr. Accountant
HR Professionals should compare promotion rates for employees with different ethnic backgrounds. Holding all other factors that affect promotions constant, promotion rates should be blind with respect to ethnicity.
Notes

© 2006 HumanConcepts 7
CHAPTER 1
Age Ratio
R E F E R E N C E N U M B E R : EC004
Description
Age Ratio displays aggregate information about the age composition of the company. Age Ratio is normally reported by division, department and location. It is often useful to report the Age Ratio in ranges (ranges can differ by industry and regulatory environment).
Business Case
HR Professionals can use the organisation’s Age Ratio as one data point in defining programs that would be of benefit to most employees. For example, organisations with a young workforce may offer a tuition reimbursement program. Companies that operate overseas and in regulated industries may be required to maintain specific age ratios, especially as they relate to employees eligible for retirement. The Age Ratio may be combined with the Promotion, Performance and Salary information to validate that all departments, divisions and locations comply with Equal Employment Opportunity regulations.
Required Data
Employee Age or Birth date Example: 26, 52, 71, January 17, 1956
Samples

8 © 2006 HumanConcepts
CHAPTER 1
Implementation Considerations
There are many considerations that can be taken into account when defining the age ratio calculation. In fact, multiple age ratio metrics may be desirable. Some metrics are listed below. Your HumanConcepts Professional Services Consultant can work with you to define calculations that take into account the available data and your business needs.
Age Range
Example: Under 18, 19-25. 26-45, over 46
Most organisations report employee age in aggregate and as a range. Although ranges that are most useful differ by industry, most organisations, at a minimum, report the following ranges:
Under 18 – Many jurisdictions prohibit employing persons who are under the age of 18.
19-21 – Special regulations might apply to employees between the ages of 19-21.
Over 45 – Employees who are over 45 may be protected by employment statutes.
Department, Division, Area
Example: Finance, Consumer Products Division, California
Large companies with operations in multiple locations might want to tailor employee benefit programs by division, department and location. Age Ratio, in conjunction with other employee census information, may make it easier to create programs that will be of greatest benefit to most employees.
Notes
© 2006 HumanConcepts 9
CHAPTER 1
Job Type Census
R E F E R E N C E N U M B E R : EC005
Description
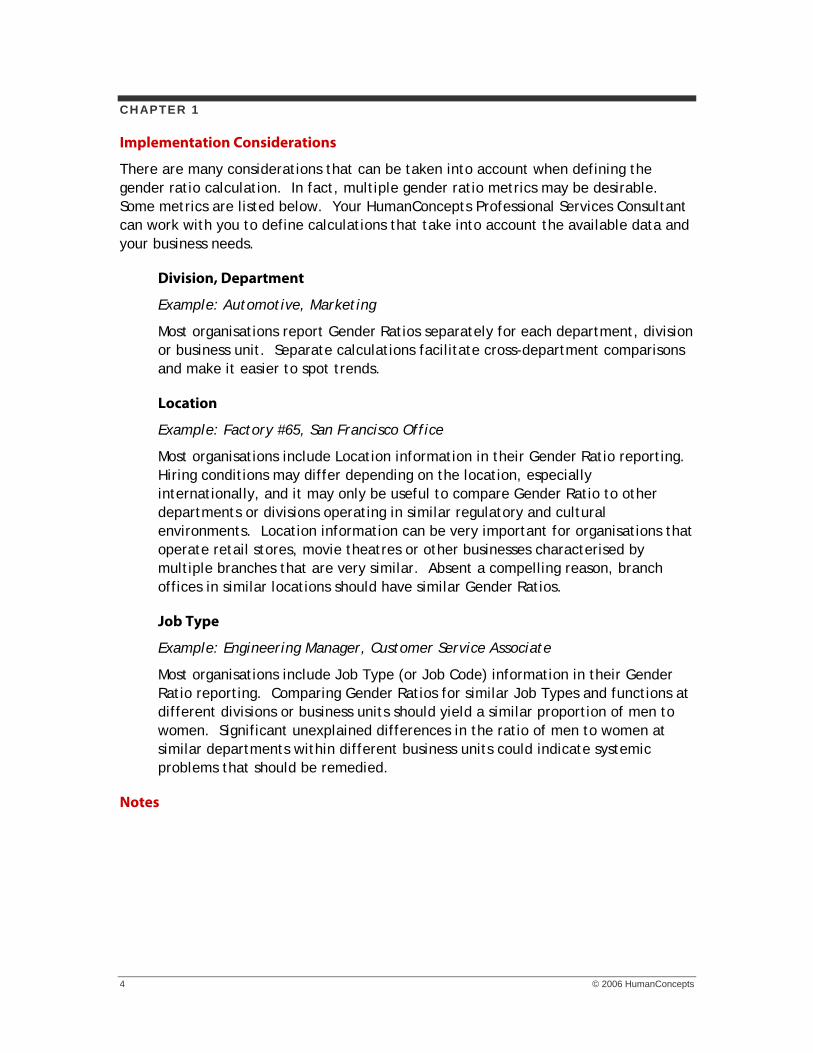
Job Type (or Job Code) Census metrics report the number of employees by area of expertise or skill-set. For example, a Job Code Census would report how many accountants the organisation employs by listing accountants who work in Corporate Finance, as well as those who may work for IT, HR and in other divisions.
Business Case
Job Type reporting adds an important dimension to headcount reports. While headcount reports display the number of people in each department, Job Type Census reporting breaks down departmental barriers to count employees based on their skill set, irrespective of what department they work for. For example, the HR department may have a team of business analysts who have a similar skill set to that of analysts who work in IT. Similarly, each division could have its own team of accountants that supplement the work that is done in the Corporate Headquarters. Job Type Census can be analysed to see if economies of scale could be gained from centralising certain functions, or on the contrary, distributed to the divisions.
Required Data
Job Type Code Example: Accounting, Engineering, AC001
Samples

10 © 2006 HumanConcepts
CHAPTER 1
Implementation Considerations
There are many considerations that can be taken into account when defining the job type census calculation. In fact, multiple job type census metrics may be desirable. Some metrics are listed below. Your HumanConcepts Professional Services Consultant can work with you to define calculations that take into account the available data and your business needs.
Location
Most organisations report Job Type Census information regionally and globally. Global reporting will provide holistic information about the company, but depending on how the company is structured, may not be immediately actionable if remote offices are largely independent of the Headquarters. Regional reporting may be immediately actionable, as it is often easier to combine or split functions if employees do not need to be relocated. Relying exclusively on regional reports, however, may yield sub-optimal results, as some redundant positions may remain in remote offices.
Division
It is useful to report Job Type Census data by Division, as it is often easier to analyse and action change separately in each division. Reporting Census information by Division also allows cross-division and industry peer comparisons.
Notes

© 2006 HumanConcepts 11
CHAPTER 1
Employee Benefit Participation
R E F E R E N C E N U M B E R : EC006
Description
Employee Benefit Participation charts display information about the programs that employees signed up for. This metric is usually reported for each individual employee as well as at a department, division and area level.
Business Case
Employee Benefit Participation charts are used by line managers to review employee benefit selections, and potentially recommend or highlight additional programs that might be of benefit to the employee. HR Professionals can use aggregate benefit participation information to do periodic benefit package reviews and recommend changes to under-subscribed programs.
Required Data
Retirement Plan Participation Example: 401K, Company Matching – 2%
Medical Plan Participation Example: Medical Only
ESPP Plan Participation Yes, 10% gross salary
Samples

12 © 2006 HumanConcepts
CHAPTER 1
Implementation Considerations
There are many considerations that can be taken into account when defining the employee benefit calculation. In fact, multiple employee benefit metrics may be desirable. Some metrics are listed below. Your HumanConcepts Professional Services Consultant can work with you to define calculations that take into account the available data and your business needs.
Medical, Life Insurance, Retirement Benefits
Most organisations report individual and aggregate benefit participation for all common employee benefits, such as medical, dental and vision coverage, optional life insurance coverage and retirement plan participation.
Employee Stock Purchase Plan, Tuition Reimbursement
Example: ESPP – 10% of gross salary, Finance Course – 2 units, Community College
In addition to reporting information on common benefit plans, many organisations also report participation in optional plans, which may only be available to tenured employees, or employees at a certain job grade level. Common plans include Employee Stock Purchase Plans (ESPP) and Tuition Reimbursement. Given visibility into the participation data, line managers can encourage employees to participate in plans that the employee would benefit most from.
Department, Division, Area
Example: Finance, Consumer Products Division, California
Reporting benefit participation by department, division or area often provides important insights into the organisation. Low subscription rates may mean that employees at a given location do not find a benefit valuable, or know little about it. In ether case, HR Professionals can re-evaluate the program and potentially replace it with one that is less expensive, or more attractive to employees.
Notes

Salary Rollup
Average Salary by Job Code
Turnover Ratio
Tenure
Performance
Open requisitions
Chapter 2: Basic Ratios

© 2006 HumanConcepts 13
CHAPTER 2
Salary Rollup Metric R E F E R E N C E N U M B E R : BR001
Description
Salary Rollup Metric summarises employee salary expense by company, division and department. Salary rollup is usually reported separately for employees and long-term contractors and is further broken out into direct salary, bonuses and other compensation line items that compose employee total compensation.
Business Case
The cost of human capital is normally the largest single expense item for most companies, and it is critical that executive management and line managers have visibility into their employee compensation budgets and current commitments. Salary Rollup Metric forms the basis of many other reports and calculations, such as Cost to Manage, Performance to Budget, Product Line Profitability and many others.
Required Data
Annual Salary Example: $56,000; £47,000
Samples
14 © 2006 HumanConcepts
CHAPTER 2
Implementation Considerations
There are many considerations that can be taken into account when defining the salary rollup calculation. In fact, multiple salary rollup metrics may be desirable. Some metrics are listed below. Your HumanConcepts Professional Services Consultant can work with you to define calculations that take into account the available data and your business needs.
Employee Type
Example: Full-time, Part-time, Contractor
Salary rollup is normally reported separately for full-time employees and contractors. This break-down makes it easier for line managers and executive management to gauge the level of reliance on contractors and total cost to the business.
Total Employee Compensation
Example: Salary, Bonus, Stock Options, Vacation
Employee salary is just one part of the compensation package that each employee receives. Total employee compensation is a more meaningful measure of employee cost, as it includes other cash benefits, such as cash bonuses, benefits, tuition reimbursement, etc. Some companies also choose to include non-cash benefits, such as stock options and vacation days, in their employee total compensation calculation.
Notes

© 2006 HumanConcepts 15
CHAPTER 2
Average Salary Metric
R E F E R E N C E N U M B E R : BR002
Description
Average Salary Metric communicates average salaries for specific departments or Job Types, and allows meaningful comparisons of employees who work for different divisions or at different locations.
Business Case
The Average Salary Metric makes it easier to analyse comparative salaries across different regions and business units and recommend guidelines on salary changes. This metric helps to answer a simple question: are we paying a certain group of employees in New York more than we are paying employees with a similar skillset in San Francisco?
Average Salary Metric is also a stepping stone to more sophisticated salary analysis, such as statistical analysis of salaries, their range and standard deviation, which are extremely useful for larger companies.
Required Data
Annual Salary Example: $56,000; £47,000
OrgPlus products will calculate average salary automatically.
Samples

16 © 2006 HumanConcepts
CHAPTER 2
Implementation Considerations
There are many considerations that can be taken into account when defining the average salary calculation. In fact, multiple average salary metrics may be desirable. Some metrics are listed below. Your HumanConcepts Professional Services Consultant can work with you to define calculations that take into account the available data and your business needs.
Job Type
Example: Full-time, Part-time, Contractor
Average Salary Metric is most useful when it is reported by Job Type, as it gives HR Professionals the option of comparing people with similar skill-sets across multiple regions and business units, as well as against industry averages. This metric also enables periodic reviews of salaries for competitiveness, and makes it easier to adjust salaries equitably to cost of living changes.
Salary Range
Example: $29,500-$62,000
Larger organisations often analyse salaries by Job Type and Range. A small range would indicate that most people with a similar skillset are paid about the same amount of money. A large range would indicate that people with similar skill-sets have very different salaries. A large range within the same Job Type could indicate that some employees are either under-paid or over-paid with respect to their peers.
Notes

© 2006 HumanConcepts 17
CHAPTER 2
Turnover Ratio
R E F E R E N C E N U M B E R : BR003
Description
Turnover Ratio calculates turnover by division, department, manager and job role/function. Voluntary separation and involuntary separation are reported separately.
Business Case
Turnover Ratios for different departments, divisions and managers can be compared internally to assess management effectiveness and overall organisational health. Turnover Ratios for different job roles and functions can be compared to that of industry peers to assess the company's competitive position.
Required Data
Employment Start Date Example: 3-12-2001
Employment End Date Example: 7-24-2005
Samples

18 © 2006 HumanConcepts
CHAPTER 2
Implementation Considerations
There are many considerations that can be taken into account when defining the turnover ratio calculation. In fact, multiple turnover ratio metrics may be desirable. Some metrics are listed below. Your HumanConcepts Professional Services Consultant can work with you to define calculations that take into account the available data and your business needs.
Division, Department, Manager
Example: Aerospace Division, Supply Chain Department, John Smith
Turnover Ratios become significantly more useful if turnover numbers can be associated with a Division, Department or Manager. This level of granularity makes it easier to analyse the data and create programs that could affect the rate of turnover. Turnover Rate is a significant measure of Senior Management performance; thus, most companies choose to report this metric in a way that relates directly to individuals managing particular departments or divisions.
Job Role, Job Function
Example: Manager, Business Analysis
Job Role and Job Function information make it easier to compare turnover rates for same or similar roles at different divisions, departments or geographies. Companies that have standardised Job Role and Job Function names can take advantage of research reports that show average turnover for similar positions in a given industry or geography.
Separation Reason
Example: Voluntary, Involuntary
Turnover is usually reported as voluntary or involuntary. Some companies also track involuntary separation as individual actions or layoffs. Review of voluntary separation calculation is especially important for high-performing employees and Executives.
Employment Status
This data is necessary to distinguish between employees who left the company and those who moved to other positions or retired.
Notes

© 2006 HumanConcepts 19
CHAPTER 2
Tenure
R E F E R E N C E N U M B E R : BR004
Description
The Tenure Metric communicates how long an employee has been employed by the organisation. Tenure can be reported by total length of employment with the company or by length of employment in each position occupied by the employee.
Business Case
Individual Tenure Metrics are important in assessing employee performance with respect to peers as well as eligibility for promotion and certain benefits. Aggregate Tenure Metrics are a measure of employee satisfaction with the organisation and/or their direct supervisors. Aggregate Tenure Metrics can also be compared with Tenure Metrics for industry peers to assess the company’s competitive standing with potential employees.
Required Data
Employment Start Date Example: 12-3-2001 or years with the company
Samples

20 © 2006 HumanConcepts
CHAPTER 2
Implementation Considerations
There are many considerations that can be taken into account when defining the tenure calculation. In fact, multiple tenure metrics may be desirable. Some metrics are listed below. Your HumanConcepts Professional Services Consultant can work with you to define calculations that take into account the available data and your business needs.
Individual Tenure by Position
Example: Sr. Engineer – 18 months, Manager – 4 months
Most companies report individual employee tenure not only as a total number of months spent with the company, but also broken out by the number of months spent in every position that the employee has occupied. This additional granularity makes it easier for managers to assess employee eligibility for promotions, position rotation as well as tenure-related benefits, plan matching, tuition reimbursement, leaves of absence, etc.
Average Tenure by Job Role/Job Type
Example: Accounting Function – 36 months, Engineering – 44 months
In addition to reporting individual tenure, most companies also monitor average employee tenure by Job Role or Job Type. This information can highlight out-of-range conditions, such as unexpectedly low tenure in a particular department, or tenure that is significantly lower than that of an industry peer. High turnover, if not aggressively managed, can lead to poor employee morale and poor employee performance.
Notes
© 2006 HumanConcepts 21
CHAPTER 2
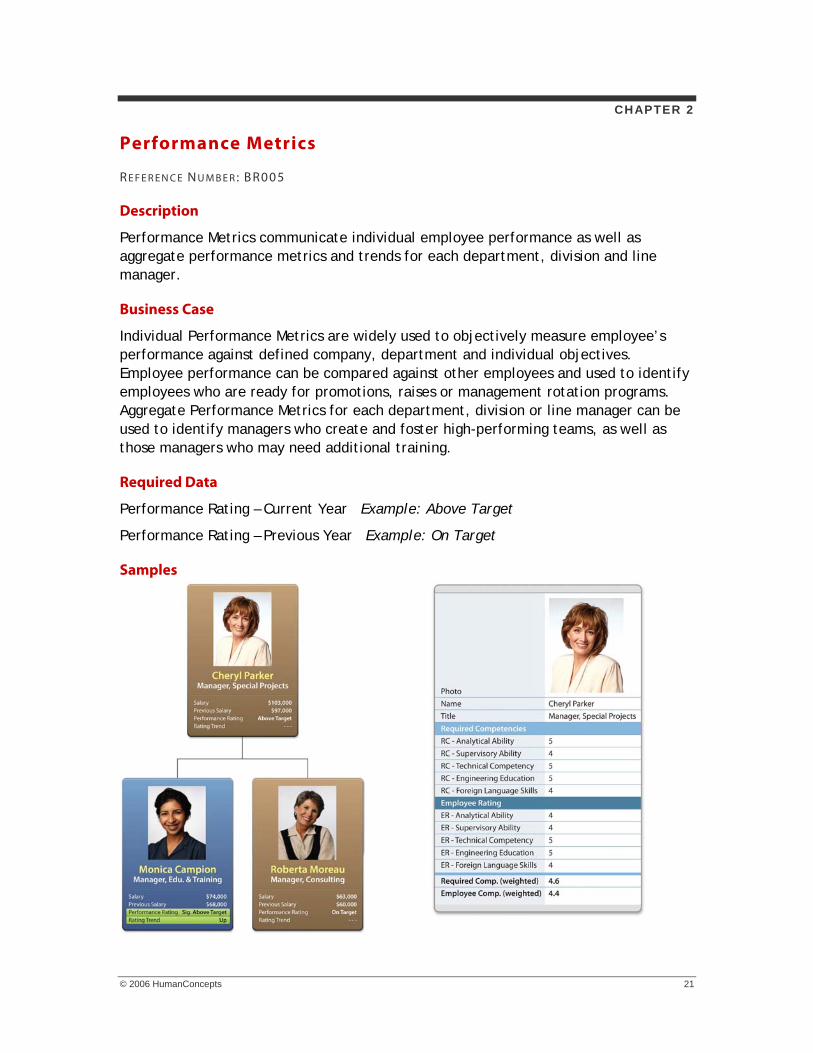
Performance Metrics
R E F E R E N C E N U M B E R : BR005
Description
Performance Metrics communicate individual employee performance as well as aggregate performance metrics and trends for each department, division and line manager.
Business Case
Individual Performance Metrics are widely used to objectively measure employee’s performance against defined company, department and individual objectives. Employee performance can be compared against other employees and used to identify employees who are ready for promotions, raises or management rotation programs. Aggregate Performance Metrics for each department, division or line manager can be used to identify managers who create and foster high-performing teams, as well as those managers who may need additional training.
Required Data
Performance Rating – Current Year Example: Above Target
Performance Rating – Previous Year Example: On Target
Samples

22 © 2006 HumanConcepts
CHAPTER 2
Implementation Considerations
There are many considerations that can be taken into account when defining the performance metric calculation. In fact, multiple performance metrics may be desirable. Some metrics are listed below. Your HumanConcepts Professional Services Consultant can work with you to define calculations that take into account the available data and your business needs.
Performance Trend
Example: Up, Down, Flat
Most organisations capture performance data for multiple periods (quarters or years) so that they can identify employees who are consistent performers, as well as those whose performance varies from period to period. Trend information is also useful in identifying employees whose performance has improved as a result of training or job rotation, and those who have performed consistently poorly, irrespective of additional training.
Competency
Example: Communications Skills – 4, Technical Skills - 3
Most organisations define competencies (or skills) that employees at each level should be graded on. Scores on each individual competency are combined into a final performance metric, such as Below Target, On Target or Above Target. Including detailed competency information on individual performance reports helps line managers and HR Professionals recommend appropriate training courses or job assignments that will enhance the employee’s performance and help that employee improve a specific skill set.
Notes

© 2006 HumanConcepts 23
CHAPTER 2
Open Requisitions (Vacancies)
R E F E R E N C E N U M B E R : BR006
Description
Open Requisitions reports show how many positions are open in each department, division or area. Most organisations report two categories of open requisitions: Approved and unapproved.
Business Case
Accurate open requisitions reporting serves many purposes. Employees who are looking to change positions will find it easier to find a new position without having to leave the company. Managers can use open requisitions charts to find internal employees who are qualified to fill those roles, at least temporarily. HR Professionals can see if a particular department has a lot of unfilled positions and fine-tune its recruitment effort to bring in more qualified candidates for to fill those positions. Finance departments can use these charts to accurately forecast the cost of employee compensation. Executives use open requisitions reporting to monitor hiring trends and to help align new initiatives and projects to divisions or departments that are best able to absorb additional work.
Required Data
Position Status Field Example: Filled, Vacant
Requisition Status Example: Approved, Not Approved
Samples
24 © 2006 HumanConcepts
CHAPTER 2
Implementation Considerations
There are many considerations that can be taken into account when defining the vacancy calculation. In fact, multiple vacancy metrics may be desirable. Some metrics are listed below. Your HumanConcepts Professional Services Consultant can work with you to define calculations that take into account the available data and your business needs.
Requisition Status
Example: Approved, Pending, Not Approved
Most organisations capture and report requisition status, such as approved, pending or not approved. Although only approved requisitions demand immediate action, pending and un-approved requisitions could indicate where the true need for resources is, and may act as a predictor of delayed projects or weaker performance at a departmental or divisional level.
Open Requisitions by Level
Example: Store Manager – 28, Store Associate – 278
Reporting open requisitions by level provides HR professionals with a strategic insight into the organisation. It is often more important to know that there is a disproportionately high number of mangers who are resigning than to know exactly who the hiring manager is and the salary range for a position.
Notes

Span of Control
Key Employees
Retirement Planning
Employee Surveys
Training
Chapter 3: Advanced Ratios

© 2006 HumanConcepts 25
CHAPTER 3
Span of Control R E F E R E N C E N U M B E R : AR001
Description
Span of Control measures the number of direct reports for each manager. Individual Span of Control metrics are reported for each manager at Executive and Senior Management levels; Span of Control is reported as an average at the Line Manager level.
Business Case
Span of Control is used to assess the organisational structure and optimise the number of direct reports by level of management and functional area. Too many direct reports at Executive or Senior Management levels could complicate communication and lengthen response time for critical decisions; it could also indicate that a company is under-managed. Too few direct reports could indicate that a particular department or division is top-heavy.
Required Data
Valid Hierarchy (OrgPlus products can calculate Span of Control automatically if a valid hierarchy exists.)
Samples
26 © 2006 HumanConcepts
CHAPTER 3
Implementation Considerations
There are many considerations that can be taken into account when defining the span of control calculation. In fact, multiple span of control metrics may be desirable. Some metrics are listed below. Your HumanConcepts Professional Services Consultant can work with you to define calculations that take into account the available data and your business needs.
Job Grade, Title
Example: Grade 24, Executive Vice President
Reporting Span of Control by Job Grade or Title will make it easier to analyse and optimise the organisation's management structure. As recommended Span of Control values generally differ by level of management, analysing Span of Control values as an average for a particular level will yield numbers that can be compared with other divisions or industry peers.
Department, Function
Example: IT Operations, Supply Chain
Recommended Span of Control values generally differ by Department or Job Function. For example, one manager can oversee 25 call center associates, but not 25 engineers. Including this information in the metric calculation will allow HR professionals to compare Span of Control values of impacted departments to similar departments in other divisions or to industry peers.
Notes

© 2006 HumanConcepts 27
CHAPTER 3
Key Employee Identifier
R E F E R E N C E N U M B E R : AR002
Description
Key Employee Identifier marks employees who are critical to the organisation as a whole or a particular department, division or project. Some organisations only mark certain Executives as Key Employees, while others use the key employee concept to identify influential and knowledge workers throughout the organisation.
Business Case
Identifying key employees in your organisation enables effective succession and retirement planning by focusing the HR professional’s time on finding and grooming successors for employees who are critical to the enterprise. Identifying key employees at the departmental level not only helps line managers prepare contingency plans for employees that are critical to the success of their departments and but can also facilitate cross-training efforts and foster a culture of knowledge sharing.
Required Data
Key Employee Field
Samples
28 © 2006 HumanConcepts
CHAPTER 3
Implementation Considerations
There are many considerations that can be taken into account when defining the key employee identifier calculation. In fact, multiple key employee identifier metrics may be desirable. Some metrics are listed below. Your HumanConcepts Professional Services Consultant can work with you to define calculations that take into account the available data and your business needs.
Reason Code
Example: Aerodynamics Expert, Patent Holder for a critical assembly.
Most organisations capture and report the reason why an employee has been marked as a “Key Employee.” This information is usually not captured for Executives, but is almost always captured for critical employees at the individual contributor and line manager level. Capturing and reporting a reason (usually a skill-set) makes it easier for managers to identify potential successors for this position and provides aggregate information to HR as to which skillsets are considered critical or under-represented among current employees.
Notes
© 2006 HumanConcepts 29
CHAPTER 3
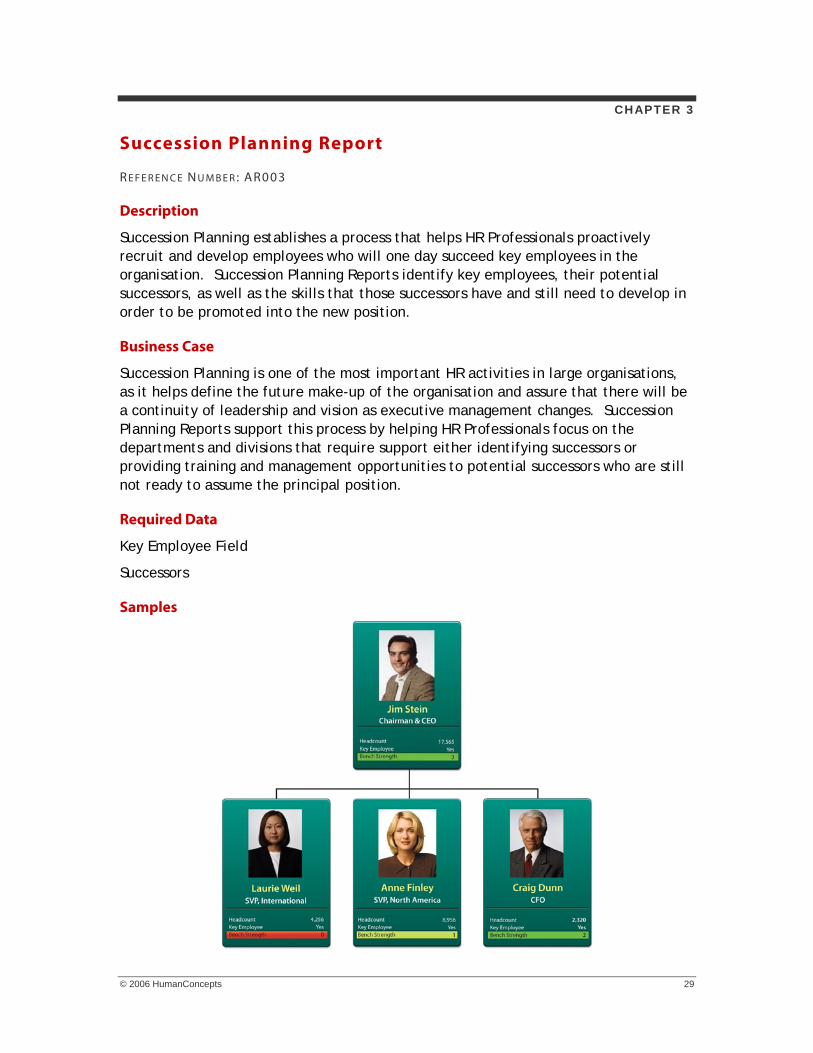
Succession Planning Report
R E F E R E N C E N U M B E R : AR003
Description
Succession Planning establishes a process that helps HR Professionals proactively recruit and develop employees who will one day succeed key employees in the organisation. Succession Planning Reports identify key employees, their potential successors, as well as the skills that those successors have and still need to develop in order to be promoted into the new position.
Business Case
Succession Planning is one of the most important HR activities in large organisations, as it helps define the future make-up of the organisation and assure that there will be a continuity of leadership and vision as executive management changes. Succession Planning Reports support this process by helping HR Professionals focus on the departments and divisions that require support either identifying successors or providing training and management opportunities to potential successors who are still not ready to assume the principal position.
Required Data
Key Employee Field
Successors
Samples

30 © 2006 HumanConcepts
CHAPTER 3
Implementation Considerations
There are many considerations that can be taken into account when defining the succession planning report. In fact, multiple succession planning reports may be desirable. Some metrics are listed below. Your HumanConcepts Professional Services Consultant can work with you to define calculations that take into account the available data and your business needs
Key Employees
Example: SVP, Product Design; Database Administrator, Online Store.
Most organisations identify key employees and their successors at the executive level, but fail to bring the process down to the senior management level, where employee turnover is often higher, as is specialised industry and product knowledge. Leading organisations have begun the process of extending succession planning processes to lower levels in the organisation in an effort to stem the loss of critical knowledge in the event that senior managers leave.
Bench Strength
Example: 1, 2, 3 – number of identified successors who are ready
Bench strength communicates how many successors have been identified for each key employee (position), and whether those employees are ready to assume the position. Most organisations include the bench strength metric in their succession planning reporting. Larger organisations prefer to maintain bench strength of 2-3 people per key position. Smaller organisations usually find it difficult to identify more than 1-2 successors for a position.
Competencies
Example: Product Knowledge, technology patent-holder
Most organisations identify required competencies for each key position and grade potential successors against these competencies. Successors are considered ready when they have achieved a minimum required level of competency. Common examples include an ability to lead a large or diverse team, an ability to communicate a vision for the product or an ability to negotiate contracts with key vendors and customers.
Notes

© 2006 HumanConcepts 31
CHAPTER 3
Employee Surveys Ratios
R E F E R E N C E N U M B E R : AR004
Description
Employee Survey Ratios are intended to answer questions about employee morale, commitment and overall satisfaction with their jobs and management.
Business Case
Being able to accurately gauge employee satisfaction is critical for organisations that operate in highly competitive or rapidly growing industries. Employee satisfaction is one of the most accurate predictors of employee performance and the organisation’s progress towards its goals. Employees who are not satisfied with their jobs or management are more likely to leave, and are much less likely to perform well. Most organisations gather employee satisfaction information through surveys, but only few best-practice organisations combine survey results with salary, performance and other directory data to get a unified look into the organisation.
Required Data
Employee Survey
Samples

32 © 2006 HumanConcepts
CHAPTER 3
Implementation Considerations
There are many considerations that can be taken into account when defining the employee survey ratio calculation. In fact, multiple employee survey metrics may be desirable. Some metrics are listed below. Your HumanConcepts Professional Services Consultant can work with you to define calculations that take into account the available data and your business needs
Salary, Performance, Training Information
Although most organisations analyse their survey data, few combine it with other data about employees to understand why employees are not satisfied with their jobs, or what the organisation could do to change employee perception of the organisation or their management. OrgPlus products make it easy to combine such disparate information into a common view.
360 Degree Review
One common source of employee survey data is the 360 Degree Review. These reviews typically hold a substantial amount of statistical data about managerial performance, and can be combined with other employee information to yield actionable insight into HR program performance and employee response to benefit programs, such as tuition reimbursement, management training, skip level and open door policies, etc.
Notes

© 2006 HumanConcepts 33
CHAPTER 3
Training
R E F E R E N C E N U M B E R : AR005
Description
Training ratio communicates the ratio of employees who are fully trained to employees who require additional training in order to reach full productivity. Most organisations report training ratio by required courses, optional courses and employee utilisation of tuition reimbursement programs, if available.
Business Case
HR Professionals use training statistics, as reported by line managers and employees themselves, to plan course offering and programs designed to teach employees the skills that they need to perform their jobs. Line managers can use training statistics to remind employees that training is required (or available) and to reward employees who have taken advantage of optional training and tuition reimbursement programs. HR Professionals can use training metrics in conjunction with training cost information and employee performance metrics to establish training ROI (Return on Investment) and fine-tune the training program.
Required Data
Required Training Courses
Optional Training Courses
Samples

34 © 2006 HumanConcepts
CHAPTER 3
Implementation Considerations
There are many considerations that can be taken into account when defining the training calculation. In fact, multiple training metrics may be desirable. Some metrics are listed below. Your HumanConcepts Professional Services Consultant can work with you to define calculations that take into account the available data and your business needs
Advanced Courses, Optional Courses
Most organisations report training information for each employee, as well as aggregate information by department, division and location. Individual training information usually segregates data on required courses and optional courses. While accurate reporting on who completed the required coursework can help HR enforce compliance with internal mandates, optional course completion reporting can help line managers evaluate their employees and make additional training recommendations.
Employee Performance
Example: On Target, Above Target, Below Target
Many managers prefer to view training information in conjunction with employee performance ratings. These metrics complement each other in signaling to the manager that an employee may be underperforming due to lack of training or by indicating that certain courses help improve performance better than others.
Notes

Organise. Visualise. Strategise.
Corporate Headquarters3 Harbor Drive, Suite 200Sausalito, CA 94965USA
HumanConcepts UK Ltd10 Blenheim CourtExeter, DevonEX2 8 PWUnited Kingdom
HumanConcepts DeutschlandCasinostrasse 647877 WillichGermany
Tel: 1 (415) 332-3030Fax: 1 (415) 332-1010
Tel: +44 (0) 1392 823023Fax: +44 (0) 1392 829159
Tel: +49 (0) 2154-889763Fax: +49 (0) 2154-889765
http://www.orgplus.com http://www.orgplus.co.uk http://www.orgplus.de
Copyright © HumanConcepts 2000-2006. All rights reserved. OrgPlus is a registered trademark of HumanConcepts. All other trademarks are acknowledged.
Email Addresses:[email protected]@[email protected]
Email Addresses:[email protected]@orgplus.co.uk
Email Address:[email protected]@orgplus.de