Embed Size (px)
Citation preview
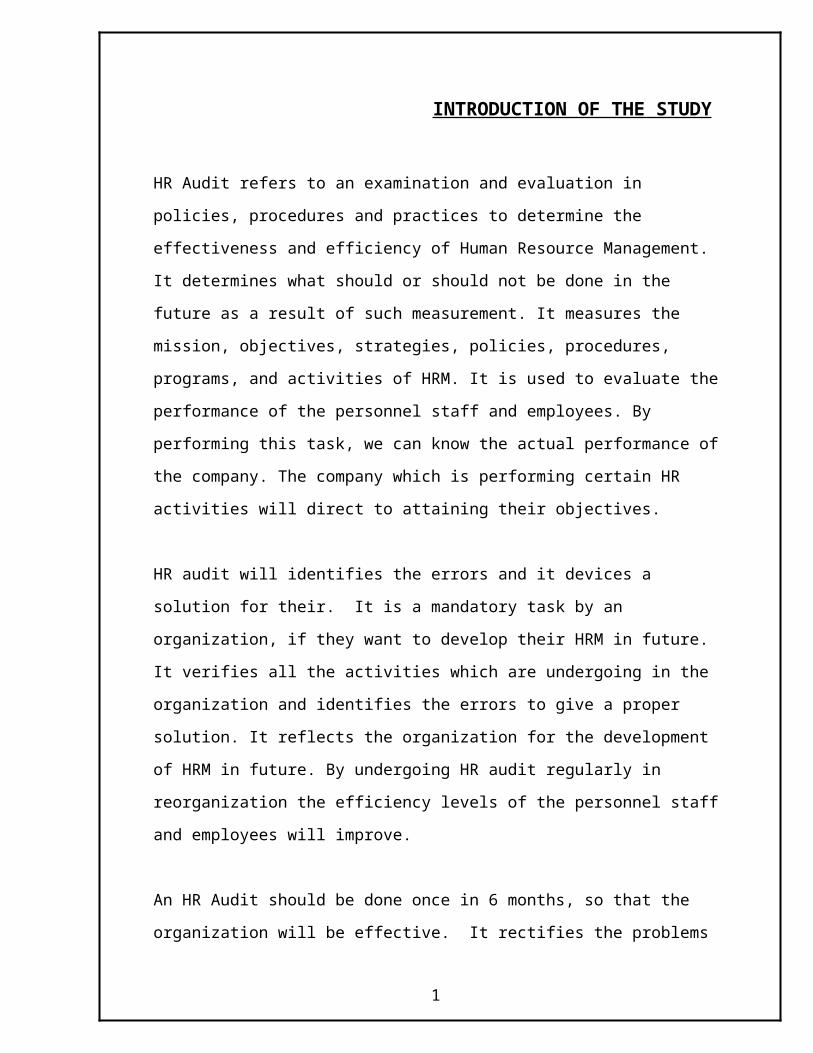
INTRODUCTION OF THE STUDY
HR Audit refers to an examination and evaluation in policies, procedures and practices
to determine the effectiveness and efficiency of Human Resource Management. It
determines what should or should not be done in the future as a result of such
measurement. It measures the mission, objectives, strategies, policies, procedures,
programs, and activities of HRM. It is used to evaluate the performance of the personnel
staff and employees. By performing this task, we can know the actual performance of
the company. The company which is performing certain HR activities will direct to
attaining their objectives.
HR audit will identifies the errors and it devices a solution for their. It is a mandatory
task by an organization, if they want to develop their HRM in future. It verifies all the
activities which are undergoing in the organization and identifies the errors to give a
proper solution. It reflects the organization for the development of HRM in future. By
undergoing HR audit regularly in reorganization the efficiency levels of the personnel
staff and employees will improve.
An HR Audit should be done once in 6 months, so that the organization will be
effective. It rectifies the problems and errors which have been arrived in the
organization. It certainly reduces the errors and makes an effective HRM. My personal
reason for taking this project is by doing HR Audit we can know the overall
performance of the organization. It clearly explains the things “what should be or
should not be done, what are the things should (or) should not be done for attaining
development in both employee and managerial point of view.
HR Audit is very important task to know their efficiency of HR Activities. Among all
the topics of HRM, HR Audit plays a vital role in the organization. The reasons for
taking this project are
1
1. It evaluates the performance of personnel staff and employees. It determines the
performance of the employees. From the basis of there results, we can do
Performance Appraisal.
2. It rectifies the problems (or) errors arise in the organization and the employees
need motivation to develop themselves. What type of motivation can be known
by making HR Audit.
3. HR Audit examines the entire HR department and all HR Activities. So, we can
gain knowledge of all the activities undergone.
4. HR Audit is involved with all the HR Departments, so we can know the levels of
employee job satisfaction levels by making interaction with them through
questionnaire.
So, HR Audit is linked with all the necessary HR Activities. By selecting one topic (or)
HR Activities, we can gain knowledge about that topic itself. But, by doing HR audit
we can gain knowledge about all the HR Activities.
HR Audit results in gaining the overall knowledge of HRM in the organization. It is
very important for the organization to know their efficiently of HRM. It results to gain
knowledge from the manager and managee’s point of view. HR Audit is a mixture of all
HR activities in every point of view. By making HR Audit, we can know about whole
HRM briefly rather than going for taking one topic and know about that.
2
NEED
The need of the audit is to reveal the strengths and weaknesses of the organization to
solve their problems. This audit helps us to know the opinions of the employees towards
the organization in which they are working. The organization can identify and solve the
problem of the employees to achieve their goals. By studying this topic, we can know
the overall knowledge about HRM in an organization.
OBJECTIVES OF THE STUDY
To evaluate the strengths and weaknesses of the organization.
To identify and finding the solutions for the occurrence of the problems by the
employees.
To know the opinions of the employees towards organization.
To gain knowledge from the manager and managee’s point of view
To gain the overall knowledge of Human Resource Management of an
organization.
SCOPE OF THE STUDY
Employees play a vital role in determining the scope of the study. It gives a broader
way to understand Human Resource Management and gives tremendous knowledge
about all elements. It relates to each and every element in HRM and determines the way
to do in the organization. It also provides scope to understand the environmental
conditions in the organization. The study depends upon the opinions of the employees
working in the organization. There is no guarantee that the employees are determining
the accurate or exact opinions in the questionnaire. If they mislead us, the whole study
may become inaccurate. The scope of the study mainly depends upon the opinions of
the employees who are working in the organization.
3
RESEARCH METHODOLOGY:
Research is essentially an investigation, a recording and analysis of evidence for the
purpose of gaining knowledge.
Research Design:
“A research design is simply the frame work or plan for a study that is used as a guide
in collecting and analyzing the data. It is blue print that is followed in completing a
study.”
Research design can be thought of as the structure of research – it is the ‘glue’ that
holds all of the elements in a research project together.
Data collection:
The task of data collection begins after a research problem has been defined and
research design/plan chalked out. While deciding about the method of data collection to
be used for the study, the researcher should keep in mind two types of data viz., primary
data and secondary data.
Primary data are those which are collected afresh and for the first time.
Secondary data are those which have already been collected by someone else.
Sources of data:
Sources of data are 2 types.
1. Primary data sources.
2. Secondary data sources.
4
1. Primary data sources:
In primary data collection, we collect the data ourselves using methods such as
interviews and questionnaires. The key point here is that the data we collect is unique to
us and our research. Primary data is the data which is collected by the researcher
directly from his own observations and experiences. For example, if the researcher
conducts a survey for the collected data then it is known as Primary data.
Primary data are those data which are collected for the first time, taking a sample,
representing a population.
There are many methods of collecting primary data and the main methods include,
a. Questionnaire.
b. Interviews.
c. Observation.
d. Schedules.
e. Survey.
Questionnaires:
In this project questionnaire method is used to collect the data. Questionnaire refers to
forms filled in by respondents alone. This method can be adopted for the entire
population or sampled sectors. Questionnaires may be used to collect regular data or
infrequent routine data, and data for specialized studies.
In order to maximize return rates, questionnaires should be designed to be as simple and
clear as possible.
Questionnaires, like interviews, can contain either structured questions with blanks to
be filled in, multiple choice questions, or they can contain open-ended questions where
5
the respondent is encouraged to reply at length and choose their own focus to some
extent.
A questionnaire is a series of questions asked to individuals to obtain statistically useful
information about a given topic.
Questionnaires are a valuable method of collecting a wide range of information from a
large number of individuals, often referred to as respondents. Adequate questionnaire
construction is critical to the success of a survey. Inappropriate questions, incorrect
ordering of questions, incorrect scaling, or bad questionnaire format can make the
survey valueless, as it may not accurately reflect the views and opinions of the
participants. A useful method for checking a questionnaire and making sure it is
accurately capturing the intended information is to pretest among a smaller subset of
target respondents.
Closed-Ended Questions:
In this project closed-ended questions are used.
A closed-ended question is a form of question which can normally be answered using a
simple "yes" or "no", a specific simple piece of information, or a selection from
multiple choices.
Closed-ended questions limit respondents' answers to the survey. The participants are
allowed to choose from either a pre-existing set of dichotomous answers, such as
yes/no, true/false, or multiple choice with an option for "other" to be filled in, or
ranking scale response options. The most common of the ranking scale questions is
called the Likert scale question. This kind of question asks the respondents to look at a
statement and then "rank" this statement according to the degree to which they agree ("I
strongly agree, I somewhat agree, I have no opinion, I somewhat disagree, I strongly
disagree").There are 5 basic types of closed-ended questions: Multiple-choice;
Categorical; Likert-scale; Numerical; and Ordinal. Closed-ended questions provide
primarily quantitative data, and are frequently used in confirmatory research.
6
Multiple Choice
Use a multiple-choice question when you want your respondents to choose the best
possible answer among all options presented.
Categorical
Use a categorical question when the possible answers are categories, and the respondent
must belong to one category
Likert-Scale
Use a Likert-scale question when you are trying to determine respondents’ attitudes or
feelings about something.Likerts scale has 5 points.
1 being not very important, 5 being extremely important.
Ordinal
Sometimes you may want your respondents to rank order their responses. A ranking
indicates the importance assigned by a participant to an attitudinal object.
Numerical
When the answer must be a number, ask a numerical question.
2. Secondary data sources:
Secondary sources of information may be divided into two categories.
Internal sources:
Data that originate within the firm for which the research is being conducted are internal
data.
7
External sources:
Which are generally published and are available in different forms and from different
sources.
The main sources of external secondary data are,
Libraries:
Researcher first attends libraries to find out relevant data pertaining to research.
Management institutes, research institutes, banks, insurance companies, public utility
companies and manufacturing units have maintained adequate libraries.
Literature:
A great amount of secondary data is available from literature, particularly literature on
marketing subjects. Consultations of this literature may provide proper guidance
pertaining to publication, which can be used from time to time.
Government departments:
Different government departments have different data, which are not available in
libraries. But these are very useful for understanding various aspects of the economy.
The researchers can utilize them for the purposes of their researchers.
Commercial data:
There are several institutions and companies, which purchase and sell marketing
information and data. Some of the companies are solely engaged in marketing research.
They collect information and data directly from field surveys. Some such companies
collect and process the secondary data and supply them to their subscribers.
8
Sampling:
Data collection from the subset of population is called ‘sampling.’ It is the process of
obtaining information about an entire population by examining only a part of it.
Sampling is that part of statistical practice concerned with the selection of an unbiased
or random subset of individual observations within a population of individuals intended
to yield some knowledge about the population of concern, especially for the purposes of
making predictions based on statistical inference. Sampling is an important aspect of
data collection.
Advantages of sampling:
The cost is lower.
Data collection is faster.
Since the data set is smaller it is possible to ensure homogeneity and to improve
the accuracy and quality of the data.
Sampling is the act, process, or technique of selecting a suitable sample, or a
representative part of a population for the purpose of determining parameters or
characteristics of the whole population.
A simple random sample:
The simplest form of random sampling is called simple random sampling. It is most
popular technique. A simple random sample is obtained by choosing elementary units in
search a way that each unit in the population has an equal chance of being selected. A
simple random sample is free from sampling bias.
9
Sample size:
Sample size can be determined by various constraints. In general, sample size depends
on the nature of the analysis to be performed, the desired precision of the estimates one
wishes to achieve, the kind and number of comparisons that will be made, the number
of variables that have to be examined simultaneously and how heterogeneous a universe
is sampled.
Deciding on a sample size for qualitative inquiry can be even more difficult than
quantitative because there are no definite rules to be followed. It will depend on what
you want to know, the purpose of the inquiry, what is at stake, what will be useful, what
will have credibility and what can be done with available time and resources. With
fixed resources which are always the case, you can choose to study one specific
phenomenon in depth with a smaller sample size or a bigger sample size when seeking
breadth. In purposeful sampling, the sample should be judged on the basis of the
purpose and rationale for each study and the sampling strategy used to achieve the
studies purpose. Questionnaire has been distributed to 120 members and we received
answers from 95 members.
The sample size here is 95.
Tool:
The tool which is used in this project is ‘Percentage tool.’
Number of respondents/Sample size (100)
10
LIMITATIONS OF STUDY
The audit information may or may not be accurate. Though the information
gathered from the employees who are working in the organization may or may not
reveal the truth. There is a chance of gathering false information.
Time taking element depends upon the employees working in the organization. If
they permit us our work concludes shortly. Otherwise, it may move for a long
period of time
The actual environment of organization cannot be known and the employees
won’t reveal them us.
The actual problems occurring by the employees cannot be identified. We can’t
find the solution to them.
If they provide inaccurate information, our findings and suggestions will not be used for
the organization and for us also
11
INDUSTRY PROFILE
CEMENT INDUSTRY
In the most general sense of the word, cement is a binder, a substance which sets and
hardens independently, and can bind other materials together. The word "cement" traces
to the Romans, who used the term "opus caementicium" to describe masonry which
resembled concrete and was made from crushed rock with burnt lime as binder. The
volcanic ash and pulverized brick additives which were added to the burnt lime to
obtain a hydraulic binder were later referred to as cementum, cimentum, cäment and
cement.
Cement used in construction is characterized as hydraulic or non-hydraulic. Hydraulic
cements (e.g. Portland cement) harden because of chemical reactions that do not involve
"drying out"; they can harden even underwater or when constantly exposed to wet
weather. The chemical reaction that results when the dry cement powder is mixed with
water produces hydrates that are not water-soluble. Non-hydraulic cements (e.g. lime
and gypsum plaster) must be kept dry in order to gain strength.
The most important use of cement is the production of mortar and concrete—the
bonding of natural or artificial aggregates to form a strong building material which is
durable in the face of normal environmental effects.
Concrete should not be confused with cement because the term cement refers only to
the dry powder substance used to bind the aggregate materials of concrete. Upon the
addition of water and/or additives the cement mixture is referred to as concrete,
especially if aggregates have been added.
India, being the second largest cement producer in the world after China with a total
capacity of 151.2 Million Tones (MT), has got a huge cement industry. With the
government of India giving boost to various infrastructure projects, housing facilities
and road networks, the cement industry in India is currently growing at an enviable
pace. More growth in the Indian cement industry is expected in the coming years. It is
12
also predicted that the cement production in India would rise to 236.16 MT in FY11. It's
also expected to rise to 262.61 MT in FY12.
The cement industry in India is dominated by around 20 companies, which account for
almost 70% of the total cement production in India. In the present year, the Indian
cement companies have produced 11 MT cement during April-September 2009. It took
the total cement production in FY09 to 231 MT.
India is the world's second largest producer of cement with total capacity of 219 million
tonnes (MT) at the end of FY 2009, according to the Cement Manufacturer’s
Association.
According to the Cement Manufacturer’s Association, cement despatches during 2009-
10 were 159.43 million tonnes (MT) increasing by 12 per cent over 142.23 in 2008-09.
Cement production during 2009-10 was 160.31 MT an increase of 12.37 per cent over
142.65 MT in 2008-09.
Moreover, the government’s continued thrust on infrastructure will help the key
building material to maintain an annual growth of 9-10 per cent in 2010, according to
India’s largest cement company, ACC.
In January 2010, rating agency Fitch predicted that the country will add about 50
million tonne cement capacity in 2010, taking the total to around 300 million tonne.
New Investments
Cement and gypsum products have received cumulative foreign direct investment (FDI)
of US$ 1.71 billion between April 2000 and February 2010, according to the
Department of Industrial Policy and Promotion
In January 2010, Swiss cement company Holcim announced plans to invest US$
1 billion for setting up 2-3 greenfield manufacturing plants in India in the next
five years. The expansion will take the company’s total cement-making capacity
to 60 mtpa (million tonnes per annum) from 50 mtpa currently.
13
Jaiprakash Associates Ltd will invest US$ 984.1 million to take its cement
manufacturing capacity from 20 mtpa to 33 mtpa by 2012.
Madras Cements Ltd is planning to invest US$ 178.4 million to increase the
manufacturing capacity of its Ariyalur plant in Tamil Nadu to 4.5 MT from 2
MT by April 2011.
Monnet Ispat & Energy (MIEL) will set up cement plants in Chhattisgarh and
Gujarat with an investment of about US$ 527.9 million. Work on the two plants
will begin in the October-December quarter under a new division of the
company to be christened Monnet Cement.
Ambuja Cements, the country’s third-largest cement maker, plans to spend
around US$ 756.3 million to expand its capacity to 24 mtpa from the current 19
mtpa by year-end to meet strong demand from the infrastructure sector.
Mergers and Acquisitions (M&As)
Dalmia Cement has increased its stake in OCL India to 45.4 per cent from 21.7
per cent at an investment of US$ 38.24 million as part of its plan to expand its
footprint in eastern India.
In April 2010, French cement maker Vicat bought 51 per cent in Bharathi
Cement.
Ultratech Cement, the country’s second-largest cement maker and a part of
Aditya Birla group is acquiring Dubai-based ETA Star Cement for an enterprise
value of US$ 382.1 million.
Government Initiatives
Government initiatives in the infrastructure sector, coupled with the housing sector
boom and urban development, continue being the main drivers of growth for the Indian
cement industry.
Increased infrastructure spending has been a key focus area. In the Union
Budget 2010-11, US$ 37.4 billion has been provided for infrastructure
development.
14
The government has also increased budgetary allocation for roads by 13 per cent
to US$ 4.3 billion.
Industry Background
The history of the cement industry in India dates back to the 1889 when a Kolkata-
based company started manufacturing cement from Argillaceous. But the industry
started getting the organized shape in the early 1900s. In 1914, India Cement Company
Ltd was established in Porbandar with a capacity of 10,000 tons and production of 1000
installed. The World War I gave the first initial thrust to the cement industry in India
and the industry started growing at a fast rate in terms of production, manufacturing
units, and installed capacity. This stage was referred to as the Nascent Stage of Indian
Cement Industry. In 1927, Concrete Association of India was set up to create public
awareness on the utility of cement as well as to propagate cement consumption.
The cement industry in India saw the price and distribution control system in the year
1956, established to ensure fair price model for consumers as well as manufacturers.
Later in 1977, government authorized new manufacturing units (as well as existing
units going for capacity enhancement) to put a higher price tag for their products. A
couple of years later, government introduced a three-tier pricing system with different
pricing on cement produced in high, medium and low cost plants.
Cement industry, in any country, plays a major role in the growth of the nation. Cement
industry in India was under full control and supervision of the government. However, it
got relief at a large extent after the economic reform. But government interference,
especially in the pricing, is still evident in India. In spite of being the second largest
cement producer in the world, India falls in the list of lowest per capita consumption of
cement with 125 kg. The reason behind this is the poor rural people who mostly live in
mud huts and cannot afford to have the commodity. Despite the fact, the demand and
supply of cement in India has grown up. In a fast developing economy like India, there
is always large possibility of expansion of cement industry.
15
History of the origin of cement
Early uses
It is uncertain where it was first discovered that a combination of hydrated non-
hydraulic lime and a pozzolan produces a hydraulic mixture (see also: Pozzolanic
reaction), but concrete made from such mixtures was first used on a large scale by
Roman engineers.They used both natural pozzolans (trass or pumice) and artificial
pozzolans (ground brick or pottery) in these concretes. Many excellent examples of
structures made from these concretes are still standing, notably the huge monolithic
dome of the Pantheon in Rome and the massive Baths of Caracalla The vast system of
Roman aqueducts also made extensive use of hydraulic cement. The use of structural
concrete disappeared in medieval Europe, although weak pozzolanic concretes
continued to be used as a core fill in stone walls and columns.
Modern cement
Modern hydraulic cements began to be developed from the start of the Industrial
Revolution (around 1800), driven by three main needs:
Hydraulic renders for finishing brick buildings in wet climates
Hydraulic mortars for masonry construction of harbor works etc., in contact with
sea water.
Development of strong concretes.
In Britain particularly, good quality building stone became ever more expensive during
a period of rapid growth, and it became a common practice to construct prestige
buildings from the new industrial bricks, and to finish them with a stucco to imitate
stone. Hydraulic limes were favored for this, but the need for a fast set time encouraged
the development of new cements. Most famous was Parker's "Roman cement.” This was
developed by James Parker in the 1780s, and finally patented in 1796.
16
It was, in fact, nothing like any material used by the Romans, but was a "Natural
cement" made by burning septaria - nodules that are found in certain clay deposits, and
that contain both clay minerals and calcium carbonate. The burnt nodules were ground
to a fine powder. This product, made into a mortar with sand, set in 5–15 minutes. The
success of"Roman Cement" led other manufacturers to develop rival products by
burning artificial mixtures of clay and chalk.
John Smeaton made an important contribution to the development of cements when he
was planning the construction of the third Eddystone Lighthouse (1755-9) in the
English Channel. He needed a hydraulic mortar that would set and develop some
strength in the twelve hour period between successive high tides. He performed an
exhaustive market research on the available hydraulic limes, visiting their production
sites, and noted that the "hydraulicity" of the lime was directly related to the clay
content of the limestone from which it was made. Smeaton was a civil engineer by
profession, and took the idea no further. Apparently unaware of Smeaton's work, the
same principle was identified by Louis Vicat in the first decade of the nineteenth
century. Vicat went on to devise a method of combining chalk and clay into an intimate
mixture, and, burning this, produced an "artificial cement" in 1817. James Frost,
working in Britain, produced what he called "British cement" in a similar manner
around the same time, but did not obtain a patent until 1822. In 1824, Joseph Aspdin
patented a similar material, which he called Portland cement, because the render made
from it was in color similar to the prestigious Portland stone.
All the above products could not compete with lime/pozzolan concretes because of fast-
setting (giving insufficient time for placement) and low early strengths (requiring a
delay of many weeks before formwork could be removed). Hydraulic limes, "natural"
cements and "artificial" cements all rely upon their belite content for strength
development. Belite develops strength slowly. Because they were burned at
temperatures below 1250 °C, they contained no alite, which is responsible for early
strength in modern cements. The first cement to consistently contain alite was made by
17
Joseph Aspdin's son William in the early 1840s. This was what we call today "modern"
Portland cement. Because of the air of mystery with which William Aspdin surrounded
his product, others (e.g. Vicat and I C Johnson) have claimed precedence in this
invention, but recent analysis of both his concrete and raw cement have shown that
William Aspdin's product made at Northfleet, Kent was a true alite-based cement.
However, Aspdin's methods were "rule-of-thumb": Vicat is responsible for establishing
the chemical basis of these cements, and Johnson established the importance of
sintering the mix in the kiln.
William Aspdin's innovation was counter-intuitive for manufacturers of "artificial
cements", because they required more lime in the mix (a problem for his father),
because they required a much higher kiln temperature (and therefore more fuel) and
because the resulting clinker was very hard and rapidly wore down the millstones which
were the only available grinding technology of the time. Manufacturing costs were
therefore considerably higher, but the product set reasonably slowly and developed
strength quickly, thus opening up a market for use in concrete. The use of concrete in
construction grew rapidly from 1850 onwards, and was soon the dominant use for
cements. Thus Portland cement began its predominant role.
Types of modern cement
Portland cement
Cement is made by heating limestone (calcium carbonate), with small quantities of
other materials (such as clay) to 1450°C in a kiln, in a process known as calcination,
whereby a molecule of carbon dioxide is liberated from the calcium carbonate to form
calcium oxide, or quicklime, which is then blended with the other materials that have
been included in the mix. The resulting hard substance, called 'clinker', is then ground
with a small amount of gypsum into a powder to make 'Ordinary Portland Cement', the
most commonly used type of cement (often referred to as OPC).
Portland cement is a basic ingredient of concrete, mortar and most non-speciality grout.
The most common use for Portland cement is in the production of concrete. Concrete is
18
a composite material consisting of aggregate (gravel and sand), cement, and water. As a
construction material, concrete can be cast in almost any shape desired, and once
hardened, can become a structural (load bearing) element. Portland cement may be gray
or white.
Portland cement blends
These are often available as inter-ground mixtures from cement manufacturers, but
similar formulations are often also mixed from the ground components at the concrete
mixing plant.
Portland blast furnace cement contains up to 70% ground granulated blast furnace
slag, with the rest Portland clinker and a little gypsum. All compositions produce high
ultimate strength, but as slag content is increased, early strength is reduced, while
sulfate resistance increases and heat evolution diminishes. Used as an economic
alternative to Portland sulfate-resisting and low-heat cements.
Portland fly ash cement contains up to 30% fly ash. The fly ash is pozzolanic, so that
ultimate strength is maintained. Because fly ash addition allows lower concrete water
content, early strength can also be maintained. Where good quality cheap fly ash is
available, this can be an economic alternative to ordinary Portland cement.
Portland pozzolan cement includes fly ash cement, since fly ash is a pozzolan, but also
includes cements made from other natural or artificial pozzolans. In countries where
volcanic ashes are available (e.g. Italy, Chile, Mexico, the Philippines) these cements
are often the most common form in use.
Portland silica fume cement. Addition of silica fume can yield exceptionally high
strengths, and cements containing 5-20% silica fume are occasionally produced.
However, silica fume is more usually added to Portland cement at the concrete mixer.
Masonry cements are used for preparing bricklaying mortars and stuccos, and must not
be used in concrete. They are usually complex proprietary formulations containing
19
Portland clinker and a number of other ingredients that may include limestone, hydrated
lime, air entrainers, retarders, waterproofers and coloring agents. They are formulated to
yield workable mortars that allow rapid and consistent masonry work. Subtle variations
of Masonry cement in the US are Plastic Cements and Stucco Cements. These are
designed to produce controlled bond with masonry blocks.
Expansive cements contain, in addition to Portland clinker, expansive clinkers (usually
sulfoaluminate clinkers), and are designed to offset the effects of drying shrinkage that
is normally encountered with hydraulic cements. This allows large floor slabs (up to 60
m square) to be prepared without contraction joints.
White blended cements may be made using white clinker and white supplementary
materials such as high-purity metakaolin.
Colored cements are used for decorative purposes. In some standards, the addition of
pigments to produce "colored Portland cement" is allowed. In other standards (e.g.
ASTM), pigments are not allowed constituents of Portland cement, and colored cements
are sold as "blended hydraulic cements".
Very finely ground cements are made from mixtures of cement with sand or with slag
or other pozzolan type minerals which are extremely finely ground together. Such
cements can have the same physical characteristics as normal cement but with 50% less
cement particularly due to their increased surface area for the chemical reaction. Even
with intensive grinding they can use up to 50% less energy to fabricate than ordinary
Portland cements.
Non-Portland hydraulic cements
Pozzolan-lime cements. Mixtures of ground pozzolan and lime are the cements used by
the Romans, and are to be found in Roman structures still standing (e.g. the Pantheon in
Rome). They develop strength slowly, but their ultimate strength can be very high. The
hydration products that produce strength are essentially the same as those produced by
Portland cement.
20
Slag-lime cements. Ground granulated blast furnace slag is not hydraulic on its own,
but is "activated" by addition of alkalis, most economically using lime. They are similar
to pozzolan lime cements in their properties. Only granulated slag (i.e. water-quenched,
glassy slag) is effective as a cement component.
Super sulfated cements. These contain about 80% ground granulated blast furnace
slag, 15% gypsum or anhydrite and a little Portland clinker or lime as an activator. They
produce strength by formation of ettringite, with strength growth similar to a slow
Portland cement. They exhibit good resistance to aggressive agents, including sulfate.
Calcium aluminate cements are hydraulic cements made primarily from limestone and
bauxite. The active ingredients are monocalcium aluminate CaAl2O4 (CaO · Al2O3 or
CA in Cement chemist notation, CCN) and mayenite Ca12Al14O33 (12 CaO · 7 Al2O3 , or
C12A7 in CCN). Strength forms by hydration to calcium aluminate hydrates. They are
well-adapted for use in refractory (high-temperature resistant) concretes, e.g. for
furnace linings.
Calcium sulfoaluminate cements are made from clinkers that include ye'elimite
(Ca4(AlO2)6SO4 or C4A3 in Cement chemist's notation) as a primary phase. They are
used in expansive cements, in ultra-high early strength cements, and in "low-energy"
cements. Hydration produces ettringite, and specialized physical properties (such as
expansion or rapid reaction) are obtained by adjustment of the availability of calcium
and sulfate ions. Their use as a low-energy alternative to Portland cement has been
pioneered in China, where several million tonnes per year are produced. Energy
requirements are lower because of the lower kiln temperatures required for reaction, and
the lower amount of limestone (which must be endothermically decarbonated) in the
mix. In addition, the lower limestone content and lower fuel consumption leads to a CO2
emission around half that associated with Portland clinker. However, SO2 emissions are
usually significantly higher.
21
"Natural" Cements correspond to certain cements of the pre-Portland era, produced by
burning argillaceous limestones at moderate temperatures. The level of clay
components in the limestone (around 30-35%) is such that large amounts of belite (the
low-early strength, high-late strength mineral in Portland cement) are formed without
the formation of excessive amounts of free lime. As with any natural material, such
cements have highly variable properties.
Geopolymer cements are made from mixtures of water-soluble alkali metal silicates
and aluminosilicate mineral powders such as fly ash and metakaolin.
The setting of cement
Cement sets when mixed with water by way of a complex series of chemical reactions
still only partly understood. The different constituents slowly crystallise and the
interlocking of their crystals gives to cement its strength. Carbon dioxide is slowly
absorbed to convert the portlandite (Ca(OH)2) into insoluble calcium carbonate. After
the initial setting, immersion in warm water will speed up setting. In Portland cement,
gypsum is added as a compound preventing cement flash setting.
Environmental and social impacts
Cement manufacture causes environmental impacts at all stages of the process. These
include emissions of airborne pollution in the form of dust, gases, noise and vibration
when operating machinery and during blasting in quarries, and damage to countryside
from quarrying. Equipment to reduce dust emissions during quarrying and manufacture
of cement is widely used, and equipment to trap and separate exhaust gases are coming
into increased use. Environmental protection also includes the re-integration of quarries
into the countryside after they have been closed down by returning them to nature or re-
cultivating them.
22
CO2 emissions
Cement manufacturing releases CO2 in the atmosphere both directly when calcium
carbonate is heated, producing lime and carbon dioxide, and also indirectly through the
use of energy, particularly if the energy is sourced from fossil fuels. The cement
industry produces about 5% of global man-made CO2 emissions, of which 50% is from
the chemical process, and 40% from burning fuel. The amount of CO2 emitted by the
cement industry is nearly 900 kg of CO2 for every 1000 kg of cement produced.
In certain applications, lime mortar, reabsorbs the CO2 chemically released in its
manufacture, and has a lower energy requirement in production. Newly developed
cement types from Novacem and Eco-cement can absorb carbon dioxide from ambient
air during hardening.
Fuels and raw materials
A cement plant consumes 3 to 6 GJ of fuel per tonne of clinker produced, depending on
the raw materials and the process used. Most cement kilns today use coal and petroleum
coke as primary fuels, and to a lesser extent natural gas and fuel oil. Selected waste and
by-products with recoverable calorific value can be used as fuels in a cement kiln,
replacing a portion of conventional fossil fuels, like coal, if they meet strict
specifications. Selected waste and by-products containing useful minerals such as
calcium, silica, alumina, and iron can be used as raw materials in the kiln, replacing raw
materials such as clay, shale, and limestone. Because some materials have both useful
mineral content and recoverable calorific value, the distinction between alternative fuels
and raw materials is not always clear. For example, sewage sludge has a low but
significant calorific value, and burns to give ash containing minerals useful in the
clinker matrix.
23
COMPANY PROFILE
Sagar Cements Limited (SCL) is a Company of 25 Years standing, engaged in
manufacture of Cement at its Plant in Mattampally, Nalgonda District, Andhra Pradesh.
The first directors of the company are:
1. Mr. K. I. VidyaSagar, I.A.S. (Retd.)
2. Mrs. Leela VidyaSagar
3. Mr. Vijay Kumar Baldawa
The Board of Directors of the company is:
1. Mr.S.Srinivas Reddy
2. Mr.S.Anand Reddy
The Company is managed by a Board, whose members are highly competent and well
known. The Senior Management team consists of highly qualified Professionals with
rich experience in the area of their Specialization.
The Company employs modern technology in each of its process of manufacture at its
Plant and has adopted progressive manufacturing practices, whether it relates to
maintaining high standards of quality of its products or development of its highly
valued human resources or the need to keep the pollution to the barest minimum.
The Company manufactures various varieties of cement like Ordinary Portland Cement
(OPC) of 53 grade, 43 grade, Portland Pozzalona Cement (PPC) and Sulphate Resistant
Cement (SRC) to suit different needs of customers and all these products are being sold
under the Brand Name “Sagar” which has already become popular in Andhra Pradesh,
has now found its acceptance among the customers in the neighboring States as well.
24
The Company has a strong committed marketing network comprising various layers
like Distributors, Dealers, C&F Agents, all of whom are served by dedicated marketing
personnel. The Company has a well-designed Organizational Structure and the roles and
responsibilities of each of its personnel have been well defined. The Company believes
in the importance of development of Human Resources as a valuable asset and is
endeavoring to enhance its value by organizing various need based in-house training
programmes and encouraging their participation in the external programmes sponsored
by various institutions of repute.
Sagar Cements has a consistent Profit track record and, except for a few years when it
was either executing its expansion plans or the industry as a whole was undergoing a
difficult period, it has been declaring dividend at reasonable percentages.
The company’s Shares are listed on Hyderabad and Bombay Stock Exchanges, where
they are actively traded.
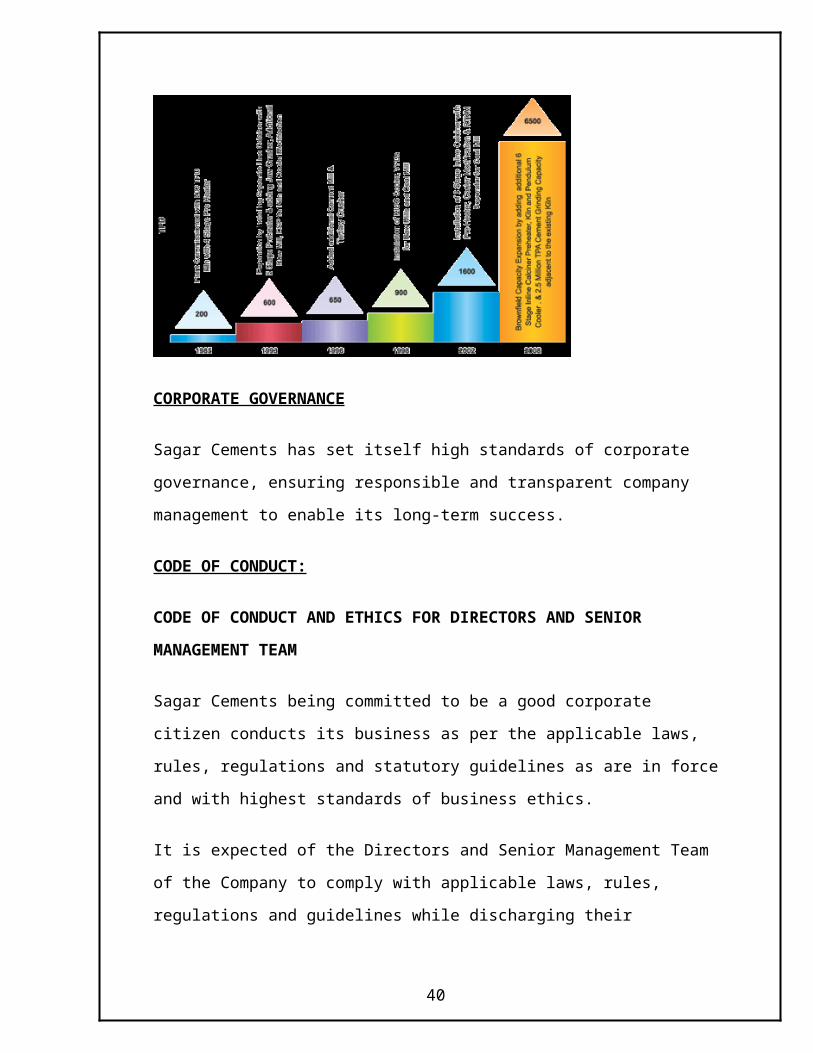
The Company which started its operation with a Cement capacity of 66000 TPA has
gradually increased it to the level of 2.35 MTPA, while its Clinker capacity has also
witnessed a significant increase from 66000 TPA in 1982 to present level of 2.10
MTPA.
VISION
To provide foundations for society’s future
MISSION
To be the India's most respected and attractive company in our industry - creating value
for all our stakeholders
25
GROUP
Sagar is well diversified group serving various sectors of the economy. The group
constitutes of
Sagar Cements Limited - Production of Cement & Clinker
Amareswari Cements Limited - Production of Cement & Clinker
Sagar Power Limited - Production of Hydel Power
Panchavati Polyfibers - Production of PP Fabric / Woven Sacks for Cements
RV Consulting - Consulting for setting Cement Plants
Sagarsoft (India) limited - www.sagarsoft.in- Software Services for global
clients
HISTORY
CORPORATE GOVERNANCE
26
Sagar Cements has set itself high standards of corporate governance, ensuring
responsible and transparent company management to enable its long-term success.
CODE OF CONDUCT:
CODE OF CONDUCT AND ETHICS FOR DIRECTORS AND SENIOR
MANAGEMENT TEAM
Sagar Cements being committed to be a good corporate citizen conducts its business as
per the applicable laws, rules, regulations and statutory guidelines as are in force and
with highest standards of business ethics.
It is expected of the Directors and Senior Management Team of the Company to comply
with applicable laws, rules, regulations and guidelines while discharging their
respective roles and to promote honesty in the process apart from abiding themselves by
the policies and procedures laid down for the conduct of the business. The accounts of
the Company will be maintained in a fare and accurate manner in accordance with the
relevant accounting and financial reporting standards.
CONFLICTS OF INTEREST
A conflict situation is deemed to arise directly or indirectly when:
• It is difficult to exercise an independent judgment of the company's interest;
• A Director or a member of the Senior Management Team accepts any personal
benefits or gifts or entertainment beyond the customary level either by himself or
through his family as a result of his position in the company from any person / company
with which the company may have business dealings;
• A Director or a member of the Senior Management Team engages in any other
business activity that detracts his ability to devote appropriate time and attention to his
responsibilities to the company;
27
• There exists a significant ownership interest with any supplier, customer or competitor
of the company
• There is any employment relationship between a Director or a member of the Senior
Management Team with any supplier, customer, business associate or competitor of the
company.
While it is expected of a member of the Board and the Senior Management Team to
avoid generally the situations where the 'conflicts of interest' can be deemed to exit, in
case of unavoidable conflict of interest, he should disclose all facts and circumstances
thereof to the Board of Directors or any officer nominated for this purpose by the Board
and a prior written approval should be obtained.
FINANCIAL REPORTING AND RECORDS
As the professional and ethical conduct in the matter of financial affairs is essential for
the proper functioning of the company, the officers and employees engaged in the
finance functions should act with honesty and integrity. The person’s in-charge of
finance and accounting function should prepare and maintain company’s accounts fairly
and accurately in accordance with generally accepted guidelines, principles, standards,
laws and regulations applicable to the company. Internal accounting and audit
procedures shall fairly and accurately reflect all of the company's business transactions
and disposition of assets. There shall be no willful omissions of the company
transactions from the books and records. Any willful material misrepresentation or
misinformation on the financial accounts and reports shall be regarded as a violation of
this code.
PROTECTING COMPANY ASSETS
The assets of the company should not be misused but employed only for the purpose of
conducting the business for which they are authorized. All Directors and members of
28
the Senior Management Team should strive to protect company's assets and property
and ensure efficient use of them.
PROMOTING INTEREST OF THE COMPANY
Directors and Senior Management Team owe a duty to the company to promote its
legitimate interests when the opportunity to do so arises. They should not use company's
property, information or position for personal gains. All Directors and Senior
Management Team of the company must strive to perform their best at all times.
INTEGRITY AND HONESTY
The Directors and Senior Management Team shall act in accordance with the highest
standards of personal and professional integrity, honesty and ethical conduct. They shall
act and conduct free from fraud and deception. Their conduct shall conform to the
professional standards of conduct.
FAIR DEAL
Each Director and the member of Senior Management Team should deal fairly with
customers, suppliers and competitors. He should not take unfair advantage of anyone
through manipulation, concealment, abuse of confidential, proprietary or trade secret,
information, misrepresentation of material facts, or any other unfair practices.
HEALTH, SAFETY, ENVIRONMENT AND SOCIAL RESPONSIBILITY
Sagarsoft shall strive to provide a safe and healthy working environment and comply
with all regulations regarding the preservation of the environment in and around its
manufacturing facilities and other points of operations. The companies is committed to
efficient use of natural resources and minimize any hazardous impact of the
development, production, use and disposal of any of its products and services on the
ecological environment.
29
CONFIDENTIALITY
The Directors and the Senior Management Team shall maintain utmost confidentiality
of information or that of any customer, supplier or business associates of the company
to which company has a duty to maintain confidentiality except when disclosure is
authorized. The use of confidential information for his own advantage or profit is also
prohibited.
COMPLIANCES
The Directors and the Senior Management Team shall comply with all applicable laws,
rules and regulations. Transactions relating to sale or purchase of company's equity
shares should not be undertaken without complying with the formalities contained in the
company's code of internal procedures and conduct for prevention of insider trading. If
any Director or Member of the Senior Management Team who knows of or suspects of
any violation of applicable laws, rules or regulations or this Code of Conduct, he must
immediately report the same to the Board of Directors or any designated person thereof.
Such person should as far as possible provide the details of suspected violations with all
known particulars relating to the issue. The company recognizes that resolving such
problems or concerns will advance the overall interests of the company that will help to
safeguard the company’s assets, financial integrity and reputation.
All Directors and Senior Management Team should adhere to the Code of Conduct and
Ethics of the company. Violations of this Code of Ethics will result in disciplinary
action, which may even include termination of services of the employee. The Board of
Directors or any person designated by the Board for this purpose shall determine
appropriate action in response to violations of this Code.
PRODUCTS
Cement is the basic and the most widely used building material. Twice as much
Cement/Concrete is used worldwide than all other Building Materials.
30
A Mixture of Limestone and Clay is ground and burnt at a very high temperature to
form Clinker. The Clinker is ground to a fine powder with addition of Gypsum ( up to 5
%) to form Cement. The essential components of Cement are Lime, Silica, Alumina and
Iron Oxide.
There are different types of Cement, which differ based on their chemical composition.
However, the manufacturing process remains the same.
Cement - Varieties
There are different varieties of cement based on different compositions according to
specific end uses, namely, Ordinary Portland Cement, Portland Puzzolona Cement,
White Cement, Portland Blast Furnace Slag Cement and Specialized Cement.
The basic difference lies in the percentage of clinker used.
Ordinary Portland cement (OPC)
OPC, popularly known as grey cement, has 95 per cent clinker and 5 per cent gypsum
and other materials. It accounts for 70 per cent of the total consumption.
Portland Puzzolona Cement (PPC)
PPC has 80 per cent clinker, 15 per cent Pozzalona and 5 per cent gypsum and accounts
for 18 per cent of the total cement consumption. It is manufactured because it uses fly
ash/burnt clay/coal waste as the main ingredient.
White Cement
White cement is basically OPC - clinker using fuel oil (instead of coal) with iron oxide
content below 0.4 per cent to ensure whiteness. A special cooling technique is used in
31
its production. It is used to enhance aesthetic value in tiles and flooring. White cement
is much more expensive than grey cement.
Portland Blast Furnace Slag Cement (PBFSC)
PBFSC consists of 45 per cent clinker, 50 per cent blast furnace slag and 5 per cent
gypsum and accounts for 10 per cent of the total cement consumed. It has a heat of
hydration even lower than PPC and is generally used in construction of dams and
similar massive constructions.
Specialized Cement
Oil Well Cement is made from clinker with special additives to prevent any porosity.
Rapid Hardening Portland cement
Rapid Hardening Portland Cement is similar to OPC, except that it is ground much
finer, so that on casting, the compressible strength increases rapidly.
Water Proof Cement
Water Proof Cement is similar to OPC, with small portion of calcium stearate or non-
saponifibale oil to impart waterproofing properties.
32
CONTACT
Like any other standard company, Sagar Cements Limited too believes that the
employees are the most important assets to the company. Our 3000 trained and
professional employees make the toughest targets possible. We too care for them in
every way so that they can have total job satisfaction while putting efforts to serve the
end users in a best possible way.
Sagar Cements Limited
Registered Office
Plot No. 205
Road No. 14
Jubilee Hills
Hyderabad - 500 033
Administrative Office
8-2-472/B/2
Road No. 1
Banjara Hills,
Hyderabad - 500 034
Factory
Mattampally
Via Huzurnagar
Nalgonda District
Andhra Pradesh - 508
024
33
INTRODUCTION
A small, privately held organization in Ohio was interested in positioning itself for
growth. They needed to attract and retain some very specialized talent to continue their
business success. Without this talent, the organization would not be able to maintain its
past achievements and certainly could not expand its operations into new markets. It
was time to focus on the work force needs and issues while creating a top employer in
the region.
CHALLENGE
With minimal support to the Human Resource function, this client was challenged with
where to start work on their people issues. Findley Davies recommended on audit
which would review all current HR policies and practices to determine:
Which “Best practices” should be implemented to better position the
organization to achieve its goals.
Which practices or lack of practices might place the organization at risk for
compliance or regulatory violations.
Process improvements that will support HR in providing the highest quality
service to employees.
HR Audit begins with a data and documentation request that require the company to
gather many of their policy manuals, benefits descriptions and other employee
communications. The audit team then met with the HR and Finance staff to gain a better
understanding of the current practices as well as identify other issues in the
organizations.
34
The Audit report identified and prioritized recommendations in six key areas:
1. General HR Structure
2. Policies and Procedures.
3. Employee life cycle (Attraction, Recruitment, Hiring, Orientation, Termination)
4. Performance evaluation and Training.
5. Compensation and Benefits Administration.
6. Employee communication
The HR Audit was delivered to the company’s management team as a detailed report
and then presented to the executives in a summary format. It included a number of
recommendations to improve their ability to attract and retain talent.
Human Resource Audits or used to evaluate HR policies and practices. An audit can
help to evaluate the effectiveness of programs and services. The delivery of these
programs and services by HR and opportunities to enhance, change or remove programs
and processes.
An Audit is used to determine what processes are strong, what processes will need
attention. An HR Audit is used to identify problems and find solutions in an attempt to
address problems before they become unmanageable. It is an opportunity to assess what
an organization is doing right, as well as how things might be done differently, more
efficiently or with reduced costs. It can be used to create a plan for development of an
HR department’s functions.
OBJECTIVES
It reviews the system of acquiring, developing, allocating and utilization of
Human Resources in the organization.
35
To evaluate the extent to which the line managers have implemented the policies
and programs initiated by the top management towards HR.
To review the HR System in comparision with other organizations needs and
modify them to meet the challenges of Human Resource Management.
To locate the gaps, lapses, short comings in the implementation of the policies,
procedures, practices, directives of the HR department and to know the areas
where non-implementation has hindered the planned programs and activities.
To evaluate the effectiveness of various HR policies & practices and HR staff.
To seek answers to such questions as “What happened?”, “Why it happened?”
or “Why it did not happen?” while implementing policies, practices and
directives in Human Resources.
NEED
The need of the audit is to reveal the strengths and weaknesses in the organization’s
Human Resource System, and any issues needing resolution. The audit works best when
the focus is on analyzing and improving the HR function in organization. Top
management can look solutions to the problems, issues and challenges in Human
Resource Development, to face business competition and to achieve organization goals.
SCOPE
HR Audit scope is limited, to the organization and employees and their collective data.
The extent and boundaries of the audit in terms of factors such as physical location and
organizational activities as well as the manner of reporting. The scope of the audit is
determined by the management and organization. The resources committed to the audit
should be sufficient to meet its intended scope. Whenever the HR audit is taken up, the
scope is decided. Audit need not be exhaustive, but should be focused on particular
functions of Human Resource Management such as Training and Development,
36
Performance Appraisal, Compensation extra. However the objective and approach of HR
Audit, more or less remains the same, regardless of scope.
An HR Audit entails
1. Legal compliance
There are litanies of local, state and federal regulations governing how a company
operates. These laws vary by the number of employees a company has from 1 to 1,000
or more. To maintain legal compliance and avoid penalties, companies need to be aware
of what the regulations are and how they impact the organization.
Strategic HR inc. can assist with your Legal Compliance by:
Conducting a human resources audit to determine compliance and areas for
improvement
Conducting investigations for potential harassment situations
Developing or updating policies to ensure compliance with legislation
37
2. Compensation/Salary Administration:
Total compensation includes not only direct pay but also indirect compensation including
insurance and retirement benefits and time off programs. The Texas Legislature sets
eligibility requirements for these benefits and programs, based on the definition of regular
employee. A regular employee is one who is listed in the position identification database for
50 percent or more time for at least four and one-half months, excluding students employed in
positions that require student status as a condition for employment. Specific eligibility
requirements for various programs appear in the appropriate policies and regulations.
Each CEO shall establish and communicate salary administration rules, procedures and pay
plans for all categories of positions, except Board-appointed positions, existing in his/her
component. These rules and pay plans should address internal equity, objective and fair
treatment, competitiveness with the appropriate external markets, and compliance with
appropriate federal and state laws. Pay plans must interface with the
Budget/Payroll/Personnel (B/P/P) system design.
3. Employment/Recruiting:
Employee recruitment forms a major part of an organization's overall resourcing
strategies, which identify and secure people needed for the organization to survive and
succeed in the short to medium-term. Recruitment activities need to be responsive to the
ever-increasingly competitive market to secure suitably qualified and capable recruits at
all levels. To be effective these initiatives need to include how and when to source the
best recruits internally or externally. Common to the success of either are; well-defined
organizational structures with sound job design, robust task and person specification
and versatile selection processes, reward, employment relations and human resource
policies, underpinned by a commitment for strong employer branding and employee
engagement and on boarding strategies.
38
Internal recruitment can provide the most cost-effective source for recruits if the
potential of the existing pool of employees has been enhanced through training,
development and other performance-enhancing activities such as performance appraisal,
succession planning and development centers to review performance and assess
employee development needs and promotional potential.
Increasingly, securing the best quality candidates for almost all organizations relies, at
least occasionally if not substantially, on external recruitment methods. Rapidly
changing business models demand skill and experience that cannot be sourced or
rapidly enough developed from the existing employee base. It would be unusual for an
organization to undertake all aspects of the recruitment process without support from
third-party dedicated recruitment firms. This may involve a range of support services,
such as; provision of CVs or resumes, identifying recruitment media, advertisement
design and media placement for job vacancies, candidate response handling, short
listing, conducting aptitude testing, preliminary interviews or reference and
qualification verification. Typically, small organizations may not have in-house
resources or, in common with larger organizations, may not possess the particular skill-
set required to undertake a specific recruitment assignment. Where requirements arise,
these are referred on an ad hoc basis to government job centers or commercially run
employment agencies.
Except in sectors where high-volume recruitment is the norm, an organization faced
with sudden, unexpected requirements for an unusually large number of new recruits
often delegates the task to a specialist external recruiter. Sourcing executive-level and
senior management as well as the acquisition of scarce or ‘high-potential’ recruits has
been a long-established market serviced by a wide range of ‘search and selection’ or
‘headhunting’ consultancies, which typically form long-standing relationships with their
client organizations. Finally, certain organizations with sophisticated HR practices have
identified there is a strategic advantage in outsourcing complete responsibility for all
workforce procurement to one or more third-party recruitment agencies or
consultancies. In the most sophisticated of these arrangements the external recruitment
services provider may not only physically locate, or ‘embed’, their resourcing team(s) in
39
the client organization's offices, but work in tandem with the senior human resource
management team in developing the longer-term HR resourcing strategy and plan.
4. Orientation
New employee orientation effectively integrates the new employee into your organization
and assists with retention, motivation, job satisfaction, and quickly enabling each
individual to become contributing members of the work team. Two questions need to be
answered in regards to the orientation of a new employee:
1. Who will orientate the new employee?
2. What should be covered during orientation?
One person should be in charge of handling orientation. Generally, this will be the
owner/operator; however, on large farm operations, another employee may specifically
be responsible for orientating all new employees. Having just one individual in charge
of orientation ensures a consistent message to new employees. The orientation of a new
employee can involve several people even though one person has overall responsibility.
Information covered will change from farm to farm, but a basic core of material should
be discussed with the new employee, including such specific characteristics of the farm
as layout of operation, other employees, history, mission, goals, and role of the
employee. This kind of information provides the "big picture" of the farm to the
employee. Personnel policies including probationary period, disciplinary actions, work
schedule, safety rules, and use of equipment also need to be covered.
New employees are always interested in their benefits. Items such as pay, pay day,
vacation, sick leave, and other benefits should be covered. Discuss specific
responsibilities the new employee will be assigned, how the job relates to other work on
the farm, and safety rules. Finally, be sure to introduce the new employee to the farm
management team, including family members and other employees. It is helpful to
develop an employee handbook so policies and benefits can be accessible and clear to
both employer and employee.
40
Answer all of the immediate questions that the new employee might have. It is
important to develop open, two-way lines of communication between the employer and
employee right from the beginning. Consider the time spent for orientation as an
investment for both you and the employee. Clear, well-defined expectations will pay
dividends and reduce possible misunderstandings between employer and employee. By
orientating the new employee properly, a smooth transition can be made to the next
step--training.
Orientation can make the difference in your employee feeling part of your "team" or
not. Proven benefits of an effective orientation are:
better understanding of job functions
higher level of motivation
improved learning curve
improved employee retention rate
ultimately improved productivity for the organization
Human Resource Management Services conducts an employee orientation session for
new state employees at the beginning of every month. Following are some of the topics
on which new employees are briefed:
Health Plan
Retirement Benefits
Life Insurance Options
Flex Comp Plan
Employee Assistance Program
Sexual Harassment
Americans with Disabilities Act
Holidays
Annual, Sick, Family Medical, and Funeral Leave
Personnel Records
Drug-Free Workplace
41
Conflict of Interest
Alternative Dispute Resolution
The appointing authority or supervisor has responsibility to orient the new employee on:
Job duties, responsibilities, and expectations or goals
Probationary period
Hours of work and FLSA status
Agency and/or work unit policies
Employee Assistance Program
Safety issues
Agency mission and organization
It is the responsibility of the agency payroll clerk or human resource officer to cover the
following topics:
Payroll information and completion of forms
Insurance, retirement, and flex comp benefits and completion of forms
Other benefits such as leave, holidays, etc.
To ensure that various topics are addressed in employee orientation, you may wish to
use the SFN 19452 Employee Orientation Checklist.
The wealth of information to be learned in a new environment can be overwhelming for
a new employee. The purpose of the orientation program is to provide the employee
with the information to make those first days of new employment easier. The following
guidelines will help make the orientation for a new employee successful:
Focus on the job and those aspects that are most important, such as the day-to-
day events that an employee needs to know to get up to speed and be a part of
the team. Don’t explain everything about the agency on the first day. Those
types of things can be learned over time.
42
Pull together a set of orientation materials including work unit and/or agency
organizational charts, an employee handbook, job description, information on
benefits, etc.
The supervisor should follow up with the employee on a regular basis to monitor
how the employee is doing and the effectiveness of the orientation.
5. Terminations
Termination of employment is the end of an employee's duration with an employer.
Depending on the case, the decision may be made by the employee, the employer, or
mutually agreed upon by both. Employees leave your organization for good reasons and
bad reasons. On the positive side, they find new opportunities, go back to school, retire or
land their dream job. Less positively, they are fired for poor performance or poor
attendance or experience a layoff because of a business downturn. In each instance, you
need an employment termination checklist to help the employee exit process go smoothly.
Here's a sample employment termination checklist. There are two types of terminations in
human resource management. There are
Voluntary termination
Voluntary termination is a decision made by the employee to leave the job. Such a
decision is commonly known as "resignation," "quitting," "leaving," or" giving notice."
Some common reasons for voluntary termination include:
Personal dissatisfaction with job, employer, hours, or working conditions, or in
more severe cases, burnout.
Factors in employee's personal life not related to the job that makes holding or
performing the job impossible or more difficult. These may include family
obligations, education, health, or moving to a new location.
43
Hire at a new job. Reasons for wanting a different job may be better working
conditions, better hours, a shorter distance to work, better pay, graduation,
career progression or preparation for entry into a new career, or a career change.
Feared or anticipated involuntary termination. The employee may wish to take
matters into his/her own hands in order to leave more honorably. This is also
known as mutual consent in some parts.
Retirement. This may be as a result of the employee's age (which may vary,
depending on job type and benefits available following retirement) or else an
injury, disability, or other medical condition forcing early retirement.
Depending on the employee's reason, comfort with the employer, and dedication to the
job, voluntary termination may be sudden and abrupt without warning to the employer,
or with a certain amount of notice given. Generally, employers prefer that a departing
employee provide at least some notice to the employer, often at least two weeks, this
often called a two-week notice. Those in compliance with this requirement are more
likely to be rehired by the same employer in the future, to receive their full benefits
from the employer, and to get a better reference for future employers.
Involuntary termination
Involuntary termination is the employee's departure at the hands of the employer. There
are two basic types of involuntary termination, known often as being "fired" and "laid
off." To be fired, as opposed to being laid off, is generally thought of to be the
employee's fault, and therefore is considered in most cases to be dishonorable and a sign
of failure. Often, it may hinder the new job-seeker's chances of finding new
employment, particularly if he/she has been fired from earlier jobs. Job-seekers
sometimes do not mention jobs which they were fired from on their résumés;
accordingly, unexplained gaps in employment and refusal to contact previous
employers are often regarded as red flags.
44
Dismissal
Dismissal is the employer's choice to let the employee leave, generally for a reason
which is the fault of the employee. The most common colloquial term for dismissal in
America is being fired whereas in Britain the term 'getting the sack' is used.
Layoff
A less severe form of involuntary termination is often referred to as a layoff (also
redundancy or being made redundant in British English). A layoff is usually not strictly
related to personal performance, but instead due to economic cycles or the company's
need to restructure itself, the firm itself is going out of business, or due to a change in
the function of the employer (for example, a certain type of product or service is no
longer offered by the company, and therefore jobs related to that product or service are
no longer needed). One type of layoff is the aggressive layoff. In such a situation, the
employee is laid off for a just cause, but not replaced as the job is eliminated.
In a postmodern risk economy, such as that of the United States, a large proportion of
workers may be laid off at some time in their life, and often for reasons unrelated to
performance or ethics. However, employment termination can also result from a
probation period, in which both the employee and the employer reach an agreement that
the employer is allowed to lay off the employee if the probation period is not satisfied.
Often, layoffs occur as a result of "downsizing", "reduction in force" or "redundancy".
These are not technically classified as firings; laid-off employees jobs are terminated
and not re-filled, because either the company wishes to reduce its size or operations, or
otherwise lacks the economic stability to retain the position. In some cases, a laid-off
employee may be offered a re-hire by his/her respective company, though by this time,
s/he may have found a new job.
Some companies resort to attrition (voluntary redundancy in British English) as a means
to reduce their workforce. Under such a plan, no employees are forced to leave their
jobs. However, those who do depart voluntarily are not replaced. Additionally,
45
employees are given the option to resign in exchange for a fixed amount of money,
frequently a few years of their salary. Such plans have been carried out by the United
States Federal Government under President Bill Clinton during the 1990s and by the
Ford Motor Company in 2005.
However layoff may be specifically addressed and defined differently in the articles of
a contract in the case of union work.
Termination by mutual agreement
Some terminations occur as a result of mutual agreement between the employer and
employee. When this happens, it is sometimes debatable if the termination was truly
mutual. In many of these cases, it was originally the employer's wish for the employee
to depart, but the employer offered the mutual termination agreement in order to soften
the firing (as in a forced resignation). But there are also times when a termination date
is agreed upon before the employment starts (as in an employment contract).
Some types of termination by mutual agreement include:
The end of an employment contract for a specified period of time (such as an
internship)
Mandatory retirement. Some occupations, such as commercial airline pilots, face
mandatory retirement at a certain age.
Forced resignation
5. Training and Development
Training and Development is a subsystem of an organization. It ensures that randomness
is reduced and learning or behavioral change takes place in structured format.
TRADITIONAL AND MODERN APPROACH OF TRAINING AND DEVELOPMENT
Traditional Approach – Most of the organizations before never used to believe in training.
46
They were holding the traditional view that managers are born and not made. There were
also some views that training is a very costly affair and not worth. Organizations used to
believe more in executive pinching. But now the scenario seems to be changing.
The modern approach of training and development is that Indian Organizations have
realized the importance of corporate training. Training is now considered as more of
retention tool than a cost. The training system in Indian Industry has been changed to
create a smarter workforce and yield the best results
TRAINING AND DEVELOPMENT OBJECTIVES
The principal objective of training and development division is to make sure the
availability of a skilled and willing workforce to an organization. In addition to that, there
are four other objectives: Individual, Organizational, Functional, and Societal.
Individual Objectives – help employees in achieving their personal goals, which in turn,
enhances the individual contribution to an organization.
Organizational Objectives – assist the organization with its primary objective by bringing
individual effectiveness.
Functional Objectives – maintain the department’s contribution at a level suitable to the
organization’s needs.
Societal Objectives – ensure that an organization is ethically and socially responsible to the
needs and challenges of the society.
7. Employee Relations
Welcome to the Employee Relations division of the Office of Human Resources
Management. The company is committed to promoting a productive and positive work
47
environment for all of its employees. In support of this, the office of Employee
Relations offers a variety of services.
Consulting with individuals and departments to foster a positive and productive
work environment.
Providing coaching and training regarding the company’s performance
management system.
Advising and training departments on corrective actions and administering the
company’s progressive disciplinary process.
Advising individuals and departments on matters and policies related to
employee relations and employee rights.
Supporting the campus community through administrative processes including
disputes, grievances, charges, and appeals related to various employee relations
issues.
Investigating and resolving complaints and charges of discrimination, sexual
harassment, retaliation or other work related complaints.
Providing conflict resolution options including: facilitation, mediation and
training.
If you need to discuss a matter with Employee Relations staff, confidentiality will be
maintained to the extent possible. Some issues may require further investigation or
consultation with other campus departments. In such cases, information will only be
shared with other individuals on a need-to-know basis.
The Employee Relations Discipline concerns the relationship of employees with the
organization and with each other. It includes the processes of developing,
implementing, administering and analyzing the employer-employee relationship;
performing ongoing evaluation of it; managing employee performance; ensuring that
relations with employees comply with applicable federal, state and local laws and
regulations; and resolving workplace disputes. It also includes matters that focus on HR
careers, communications, legal and regulatory issues, technology, metrics and
outsourcing in the employee relations field, as well as effective employee relations
48
practices and global employee relations issues. It does not include matters involving
union organizing, union elections, collective bargaining and ongoing union-
management relations, which are encompassed in the Labor Relations Discipline.
8. Communications
If the company is involved in employee communication then they already know that one
of the most important aspects of employee communication today is measurement. But so
much of that measurement is focused on whether employees access the tools
organizations use to communicate with them.
The company knows that the questions such as do they read the newsletter, do they access
the corporate blog, and do they find the information sessions interesting. None of these
questions prove that the employee communication tools measure engagement which is
what every CEO wants to know. There is one key reason that the companies are
measuring the acceptance of communication tools, not measuring employee
communication strategy. So here's what the companies do.
Every organization conducts market research surveys. These surveys typically
measure customer satisfaction levels across services and products provided by
your organization. Sometimes they even ask questions about competitor
products and services. Organizations then take that information and work
towards improving the rating they received by introducing improvements to
services, products and information.
Typically the result demonstrates disparity between what customers think and
what employees think customers think. Once you have the difference measured
between perception and reality then you have the opportunity to commence
dialogue about with your employees about what customers really think. Most
importantly it allows you to design employee communication strategies
specifically to target that business issue. So now you have a business and know
the key messages for your employee communication strategy.
49
One year on when the customer survey is conducted, you ask the same questions
and again do the same with the staff survey. What you seek to find is that the
measure of the perception staff have of what customers think and what
customers actually think have moved closer together and towards the
organizations desired outcome. This becomes your business measure of whether
you have engaged employees.
This information is important because your ultimate aim in employee
communication has to be to create the "Aha Moment". The Aha Moment is
based on information that challenges the employee's belief about an aspect of the
business. The information that suddenly helps employees say, "Now it makes
sense", "Now I understand", "Now I can do something about it". It is only once
you see this gap close between what customers actually think about an issue and
what employees think the customer thinks that you have a measure that
demonstrates your employee communication engagement strategy has been
successful. If the gap still exists then the design of your employee
communication strategy is flawed in someway.
Finally, it is important that we measure employee communication tools such as
readership of our staff magazine, access of our intranet and other tools. However the
only way to impact perceptions of the value that the employee communication function
contributes to an organization is to measure engagement strategies against business
outcomes.
This approach to measurement is low cost. The investment in the human resources staff
survey and the marketing departments' customer research is already locked in. You are
simply adding 10 questions to the end of the human resources survey based on the
marketing questions. The engagement strategies are generally low cost because they
involve people, not tools. By this I mean that employees are involved in doing
something differently to bring about change in an organization. The staff newsletter and
other information tools already exist; all you do is tailor the articles to reflect the main
focus of your employee engagement strategy. This low cost yet highly effective
50
approach will ensure that you can measure your employee communication strategies
against business outcomes.
9. Files/Record maintenance technology
The university uses and maintaining a records management system that is secure from
unauthorized access, damage and misuse. The system captures and supports records that
are accurate, authentic, accessible, useable, retained, and regular operation and is
managed in compliance with all requirements arising from current business processes, the
regulatory environment and community expectations.
The record management system:
Routinely captures all records within the scope of the business activities of
Griffith University:
Organizes the records in a way to reflect the business processes of the record’s
creator
Protects the records from unauthorized alteration or disposition
Routinely functions as the primary source of information about actions that are
documented in the records: and
Provides ready access to all relevant records and related metadata.
Control measures, such as access monitoring, user verification authorized destruction and
security are implemented to prevent unauthorized access, destruction alteration or
removal of records.
10. Policies and procedures (including employee hand book)
Policies, handbooks and procedures provide guidance for fair and consistent staff
treatment. They are most useful when applied as guidelines rather than as rules and laws.
51
Straight-forward, clear and concise HR policies and job descriptions are important for a
number of reasons. Failing to implement policies and job descriptions leaves your
company open to legal challenges, grievances and lawsuits, especially if you
inconsistently apply your human resources policies and your pay structure/system.
Grievances and lawsuits lead to:
Increased costs that affect your profits
Increased turnover
Negative morale
Your company will avoid these problems if you implement hr policies, procedures and
job descriptions and you can easily do this if you download our sample job descriptions
and hr policies.
Your company needs human resources policies and procedures and current job
descriptions so that your staffs are treated equally across a variety of employment
issues. In addition, human resource polices help if legal situations arise. Our products
and services are ideally suited for:
Small Business Owners
Managers
HR Professionals
HR Consultants
Lawyers
Small businesses often scramble for resources when compiling staffing information,
contracts, developing HR policies and procedures and writing job descriptions. In
addition, many large companies have dated policies, procedures and job descriptions that
no longer reflect the reality of today's business world. Companies looking for fresh ideas
and a fresh start to can find what they are looking for with our sample hr policies and
sample job descriptions
52
LIMITATIONS
The audit works best when the focus is on analyzing and improving the HR
function in the organization.-if not it is a tooth less document.
The audit itself is a diagnostic tool, not a prescriptive document.
It will help you identify what you are missing or need to improve, but it can’t tell
you what you need to do to address these issues.
It is most useful when an organization is ready to act on the findings and to evolve
its HR function to a level where its full potential to support the organization’s
mission and objectives can be realized.
The audit information may or may not be accurate. Though the information
gathered from the employees who are working in the organization may or may not
reveal the truth. There is a chance of gathering false information.
Time taking element depends upon the employees working in the organization. If
they permit us our work concludes shortly. Otherwise, it may move for a long
period of time
53
1. COMMUNICATION
(A) Employees generally feels informed about changes that affect them within company.
ATTRIBUTES NUMBER OF
RESPONDENTS
PERCENTAGES
1.Strongly Disagree 2 2.105
2. Disagree 3 3.160
3.No opinion 6 6.315
4.Agree 80 84.210
5.Strongly Agree 4 4.210
TOTAL 95 100
GRAPH:
INTERPRETATION:
According to the above table, 84.2% of employees are feeling that the company is informing that affect them within the company. It denotes that the company is taking care of their employees.
54
1. (B) Employees usually know about the important things that happen within the company
ATTRIBUTES NUMBER OF RESPONDENTS
PERCENTAGES
1.Strongly Disagree 4 4.210
2. Disagree 6 6.315
3.No opinion 3 3.160
4.Agree 80 84.210
5.Strongly Agree 2 2.105
TOTAL 95 100
GRAPH:
INTERPRETATION:
According to the above table, 84.2 % of employees feel that they usually know about the important things that happen with in the company. It shows that the employees are aware of the things that happen within the company.
55
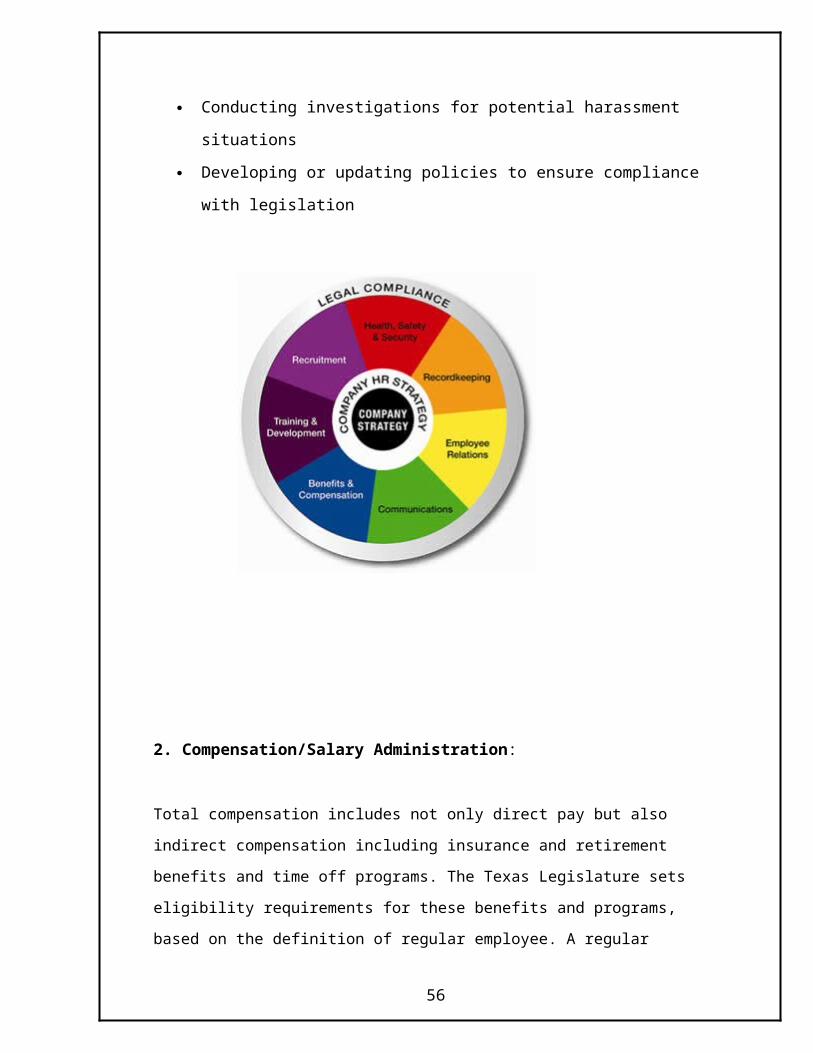
1. (C) Employees can see the link between their work and objectives
ATTRIBUTES NUMBER OF RESPONDENTS
PERCENTAGES
1.Strongly Disagree 3 3.160
2. Disagree 2 2.105
3.No opinion 4 4.210
4.Agree 80 84.216
5.Strongly Agree 6 6.315
TOTAL 95 100
GRAPH:
INTERPRETATION:
According to the above table, 84.2% of employees can see the link between their work and the company’s objectives. It shows that the employees can see the difference between their work and company’s objectives.
1(D). Managers communicate clear objectives for the company to achieve...
56
ATTRIBUTES NUMBER OF RESPONDENTS
PERCENTAGES
1.Strongly Disagree 6 6.315
2. Disagree 4 4.210
3.No opinion 2 2.105
4.Agree 80 84.210
5.Strongly Agree 3 3.160
TOTAL 95 100
GRAPH:
INTERPRETATION:
According to the above table, 84.2% of employees feel that the manager communicate clear objectives for the company to achieve. It denotes that there is an open communication between managers and employees.
2. SATISFACTION
57
(A) Considering every thing, employees are satisfied at the company.
ATTRIBUTES NUMBER OF
RESPONDENTSPERCENTAGES
1.Strongly Disagree 5 5.263
2. Disagree 6 6.315
3.No opinion 4 4.210
4.Agree 51 53.686
5.Strongly Agree 29 30.526
TOTAL 95 100
GRAPH:
INTERPRETATION: According to the above table, 53.6% of employee’s answers as agree, 30.5% employee’s answers that they are strongly agree that they are satisfied at the company. It denotes that most of the employees are very much satisfied at the company. 2(B) Employees find their work challenging.
ATTRIBUTES NUMBER OF PERCENTAGES
58
RESPONDENTS1.Strongly Disagree 3 3.160
2. Disagree 6 6.315
3.No opinion 7 7.368
4.Agree 46 48.421
5.Strongly Agree 33 34.736
TOTAL 95 100
GRAPH:
INTERPRETATION:
According to the above table, 48.4% of employee’s hangs on to the opinion as agree, 34.4% of employee’s found that their work is challenging. It shows that the employees are very much committed to the work that the company is assigned to do.
2(C) Employees like the kind of work they do.
ATTRIBUTES NUMBER OF RESPONDENTS
PERCENTAGES
59
1.Strongly Disagree 8 8.421
2. Disagree 7 7.368
3.No opinion 10 10.526
4.Agree 60 63.157
5.Strongly Agree 10 10.526
TOTAL 95 100
GRAPH:
INTERPRETATION:
According to the above table, 63.1% of employee’s feel that they like the kind of work that they are doing in the company 10.5 % of employee’s feels those they strongly agree that they like their work.
2(D) Employee’s working conditions are good.
ATTRIBUTES NUMBER OF RESPONDENTS
PERCENTAGES
60
1.Strongly Disagree 3 3.160
2. Disagree 6 6.315
3.No opinion 10 10.528
4.Agree 62 65.263
5.Strongly Agree 14 14.734
TOTAL 95 100
GRAPH:
INTERPRETATION:
According to the above table, 65.2 % of employee’s votes as agree, 14.7% of employee’s votes as strongly agree that the working conditions in the company are good.
3. TRAINING
(A)Employees get the training they need to do their job well.
ATTRIBUTES NUMBER OF PERCENTAGES
61
RESPONDENTS1.Strongly Disagree 5 5.263
2. Disagree 8 8.421
3.No opinion 12 12.631
4.Agree 50 52.631
5.Strongly Agree 20 21.054
TOTAL 95 100
GRAPH:
INTERPRETATION:
According to the above table, 52.6% of employee’s votes as agree, 21% of employee’s votes as strongly agree that the company is providing the training that they need to do their job well. Overall, 73% of employee’s agrees that the company is providing essential training to do their job well.
3(B) Employees aware of available training and development activities..
ATTRIBUTES NUMBER OF RESPONDENTS
PERCENTAGES
1.Strongly Disagree 5 5.263
62
2. Disagree 5 5.263
3.No opinion 15 15.789
4.Agree 45 47.370
5.Strongly Agree 25 26.315
TOTAL 95 100
GRAPH:
INTERPRETATION:
According to the above table, 47.3% of employee’s votes as agree, 26.3% of employee’s votes as strongly agree that they are aware of available training and development activities. It shows that the company is informing the employees about the training and development activities that are providing to them.
3(C) Employees gave a real opportunity to improve their skills in this company.
ATTRIBUTES NUMBER OF RESPONDENTS
PERCENTAGES
1.Strongly Disagree 7 7.368
63
2. Disagree 8 8.421
3.No opinion 10 10.528
4.Agree 52 54.736
5.Strongly Agree 18 18.947
TOTAL 95 100
GRAPH:
INTERPRETATION:
According to the above table, 54.7% of employee’s votes as agree, 18.9% of employee’s votes as strongly agree that the company is giving real opportunities to improve their skills. It denotes that the most of the employees are skilled in this company.
3(D) Employees training meets they needs for their current job.
ATTRIBUTES NUMBER OF RESPONDENTS
PERCENTAGES
1.Strongly Disagree 5 5.263
64
2. Disagree 7 7.368
3.No opinion 8 8.421
4.Agree 55 57.894
5.Strongly Agree 20 21.054
TOTAL 95 100
GRAPH:
INTERPRETATION:
According to the above table, 57.8% of employee’s votes as agree 21% of employee’s votes as strongly agree that their training meets their needs for their current job. It shows that the training providing by the company is helping the employees to meet their needs.
4. CAREER
(A) Employees believes there are a variety of ways for them to develop their carrier at company
ATTRIBUTES NUMBER OF RESPONDENTS
PERCENTAGES
65
1.Strongly Disagree 2 2.105
2. Disagree 3 3.160
3.No opinion 35 36.840
4.Agree 45 47.370
5.Strongly Agree 10 10.525
TOTAL 95 100
GRAPH:
INTERPRETATION:
According to the above table, 47.3% of employee’s votes as agree, 10.5% of employee’s votes as strongly agree that they believe there are a variety of ways for them to develop their career at company.36.8% of employee’s are in panic, that they are not aware of possible ways for them to develop their career at company.
4(B) Job promotions with in the company are fair and reasonable.
ATTRIBUTES NUMBER OF RESPONDENTS
PERCENTAGES
1.Strongly Disagree 2 2.105
2. Disagree 8 8.421
66
3.No opinion 16 16.843
4.Agree 54 56.842
5.Strongly Agree 15 15.789
TOTAL 95 100
GRAPH:
INTERPRETATION:
According to the above table, 56.8% of employee’s votes as agree, 15.7% of employee’s votes as strongly agree that the job promotions within the company are fair and reasonable. 16.8% of employees feel that the job promotions are unfair. It denotes that there is a slight variation in job promotion activities.
\
4(C) Employees are aware of promotion opportunities within company.
ATTRIBUTES NUMBER OF RESPONDENTS
PERCENTAGES
1.Strongly Disagree 6 6.315
2. Disagree 9 9.476
67
3.No opinion 15 15.789
4.Agree 45 47.368
5.Strongly Agree 20 21.052
TOTAL 95 100
GRAPH:
INTERPRETATION:
According to the above table, 47.3% of employee’s votes as agree, 21% of employee’s votes as strongly agree that they are aware of promotion opportunities within the company. 15.7% of employee’s have no idea about the promotion opportunities within the company.
4(D) Employees have the opportunities within company
ATTRIBUTES NUMBER OF RESPONDENTS
PERCENTAGES
1.Strongly Disagree 1 1.052
2. Disagree 4 4.210
68
3.No opinion 10 10.528
4.Agree 60 63.158
5.Strongly Agree 20 21.052
TOTAL 95 100
GRAPH:
INTERPRETATION:
According to the above table, 63.1% of employee’s votes as agree, 21% of employee’s votes as strongly agree that they have opportunities to progress with in the company. It shows that company is providing necessary opportunities to progress for the employees.
5. COMPANY
(A) Company is innovative in developing new ways to serve their customers..
ATTRIBUTES NUMBER OF RESPONDENTS
PERCENTAGES
1.Strongly Disagree 2 2.105
69
2. Disagree 3 3.157
3.No opinion 10 10.526
4.Agree 50 52.633
5.Strongly Agree 30 31.579
TOTAL 95 100
GRAPH:
INTERPRETATION:
According to above table, 52.6% of employee’s votes as agree, 31.5% of employee’s votes as strongly agree that the company is innovative in developing in new ways to serve their customers. It shows that the employees are aware of company’s innovative aspects.
5(B) Company’s image is that of high quality company.
ATTRIBUTES NUMBER OF RESPONDENTS
PERCENTAGES
1.Strongly Disagree 4 4.210
2. Disagree 8 8.421
3.No opinion 8 8.421
70
4.Agree 40 42.108
5.Strongly Agree 35 36.840
TOTAL 95 100
GRAPH:
INTERPRETATION:
According to the above table, 42.1% of employee’s votes as agree, 36.8% of employee’s votes as strongly agree that the company’s image is that of a high quality company.
5(C) Company’s work performs its business operations to a high standard...
ATTRIBUTES NUMBER OF RESPONDENTS
PERCENTAGES
1.Strongly Disagree 5 5.263
2. Disagree 5 5.263
3.No opinion 5 5.263
71
4.Agree 50 52.632
5.Strongly Agree 30 31.579
TOTAL 95 100
GRAPH:
INTERPRETATION:
According to the above table, 52.6% of employee’s votes as agree, 31.5% of employee’s votes as strongly agree that the company is performing its business operations to a high standard. It denotes that the company is upgrading their technology within a short period of time.
5(D) The work policies are well developed and organized...
ATTRIBUTES NUMBER OF RESPONDENTS
PERCENTAGES
1.Strongly Disagree 1 1.052
2. Disagree 2 2.105
3.No opinion 7 7.368
72
4.Agree 70 73.686
5.Strongly Agree 15 15.789
TOTAL 95 100
GRAPH:
INTERPRETATION:
According to the above table, 73.6% of employee’s votes as agree, 15.7% of employee’s votes as strongly agree that the company’s work policies are well developed and organized.
6. APPRAISALS
(A) Manager holds employees accountable for the work that they do..
ATTRIBUTES NUMBER OF RESPONDENTS
PERCENTAGES
1.Strongly Disagree 4 4.210
2. Disagree 6 6.315
73
3.No opinion 15 15.789
4.Agree 45 47.368
5.Strongly Agree 25 26.318
TOTAL 95 100
GRAPH:
INTERPRETATION:
According to the above table, 47.3% of employee’s votes as agree, 26.3% of employee’s votes as strongly agree that the manager holds them accountable for the work that they do. It shows that the manager is efficient for assigning the job to employees.
6(B) Manager provides employees with adequate feed back.
ATTRIBUTES NUMBER OF RESPONDENTS
PERCENTAGES
1.Strongly Disagree 2 2.105
2. Disagree 3 3.160
3.No opinion 20 21.052
4.Agree 52 54.736
74
5.Strongly Agree 18 18.947
TOTAL 95 100
GRAPH:
INTERPRETATION:
According to the above table, 54.7% of employee’s votes as agree, 18.9% of employee’s votes as strongly agree that the manager provides them with adequate feedback. 21% of employee’s feel that the manager doesn’t provide them adequate feedback
6(C) Employees have clear measure for each of their objectives..
ATTRIBUTES NUMBER OF RESPONDENTS
PERCENTAGES
1.Strongly Disagree 4 4.210
2. Disagree 8 8.421
3.No opinion 12 12.630
4.Agree 50 52.634
75
5.Strongly Agree 21 22.105
TOTAL 95 100
GRAPH:
INTERPRETATION:
According to the above table, 52.6% of employee’s votes as agree, 22.1% of employee’s votes as strongly agree that they have clear measures for each of their objectives. It denotes that the employees are working in the company according to their objectives.
6(D) Employees know what is expected of them in their job.
ATTRIBUTES NUMBER OF RESPONDENTS
PERCENTAGES
1.Strongly Disagree 5 5.263
2. Disagree 5 5.263
3.No opinion 20 21.054
4.Agree 40 42.102
76
5.Strongly Agree 25 26.318
TOTAL 95 100
GRAPH:
INTERPRETATION:
According to the above table, 42.1% of employee’s votes as agree, 26.3% of employee’s votes as strongly agree that they know what is expected of them in their job. It shows that the employees are aware and working according to the company’s objectives.
7. RECOGNITION
(A) Hard work is usually rewarded at my company.
ATTRIBUTES NUMBER OF RESPONDENTS
PERCENTAGES
1.Strongly Disagree 5 5.263
2. Disagree 5 5.263
3.No opinion 15 15.789
4.Agree 30 31.583
77
5.Strongly Agree 40 42.102
TOTAL 95 100
GRAPH:
INTERPRETATION:
According to the above table, 31.5% of employee’s votes as agree, 42.1% of employee’s votes as strongly agree that the hard work is usually rewarded at their company. It denotes that the employees working in the company are hard working.
7(B) Employees receive enough recognition for work that they do.
ATTRIBUTES NUMBER OF RESPONDENTS
PERCENTAGES
1.Strongly Disagree 3 3.160
2. Disagree 12 12.631
3.No opinion 10 10.525
4.Agree 38 40.000
5.Strongly Agree 32 33.684
TOTAL 95 100
78
GRAPH:
INTERPRETATION:
According to the above table, 40% of employee’s votes as agree, 33.6% of employee’s votes as strongly agree that they receive enough recognition for work that they do in the company. It shows that the company’s commitment towards hardworking employees in case of recognition.
7(C) If Employees does a good job, they have a better chance of getting ahead.
ATTRIBUTES NUMBER OF RESPONDENTS
PERCENTAGES
1.Strongly Disagree 1 1.052
2. Disagree 4 4.210
3.No opinion 12 12.634
4.Agree 58 61.052
5.Strongly Agree 20 21.052
TOTAL 95 100
79
GRAPH:
INTERPRETATION:
According to the above table, 61% of employee’s votes as agree, 21%of employee’s votes as strongly agree that if they do a good job they have a better chance of getting ahead in the employment.
7(D) Employees are recognized, whenever they do a good job.
ATTRIBUTES NUMBER OF RESPONDENTS
PERCENTAGES
1.Strongly Disagree 2 2.105
2. Disagree 2 2.105
3.No opinion 6 6.315
4.Agree 60 63.160
5.Strongly Agree 25 26.315
TOTAL 95 100
80
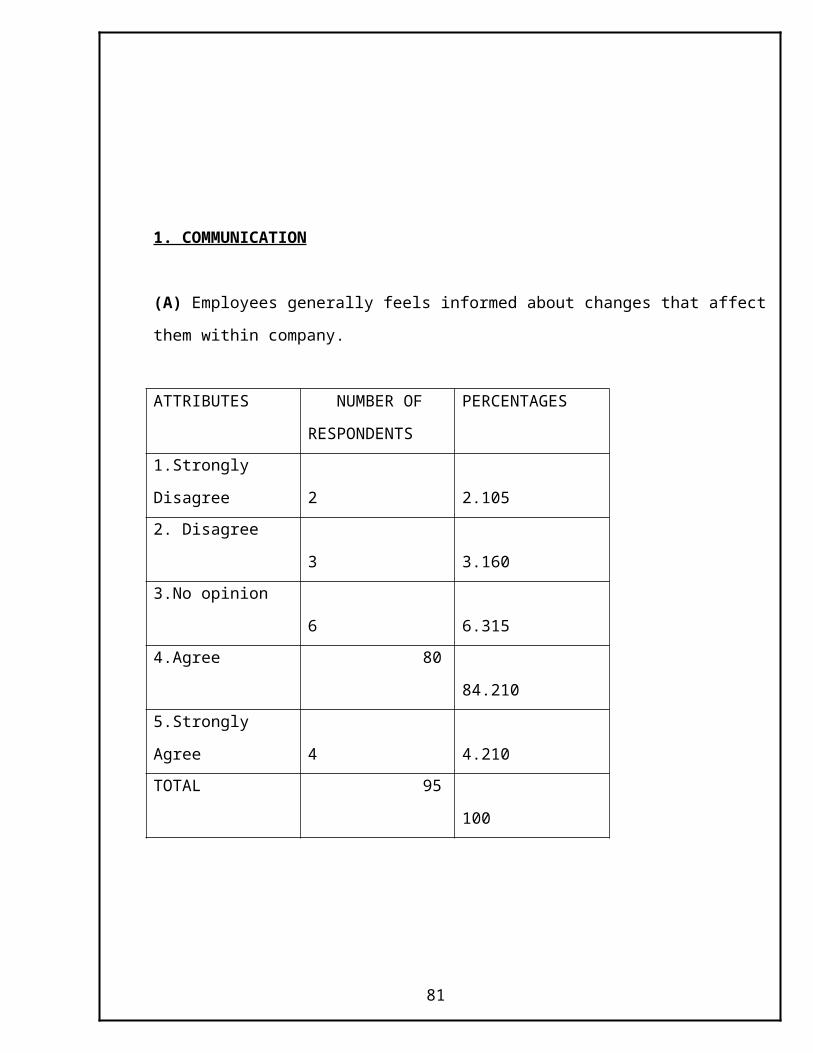
GRAPH:
INTERPRETATION:
According to the above table, 63.1% of employee’s votes as agree, 26.3% of employee’s votes as strongly agree that they are recognized whenever they do a good job.
8. MANAGEMENT
(A) Manager helps employees to get ahead at their job.
ATTRIBUTES NUMBER OF RESPONDENTS
PERCENTAGES
1.Strongly Disagree 7 7.368
2. Disagree 8 8.421
3.No opinion 15 15.789
4.Agree 35 36.842
5.Strongly Agree 30 31.580
TOTAL 95 100
81
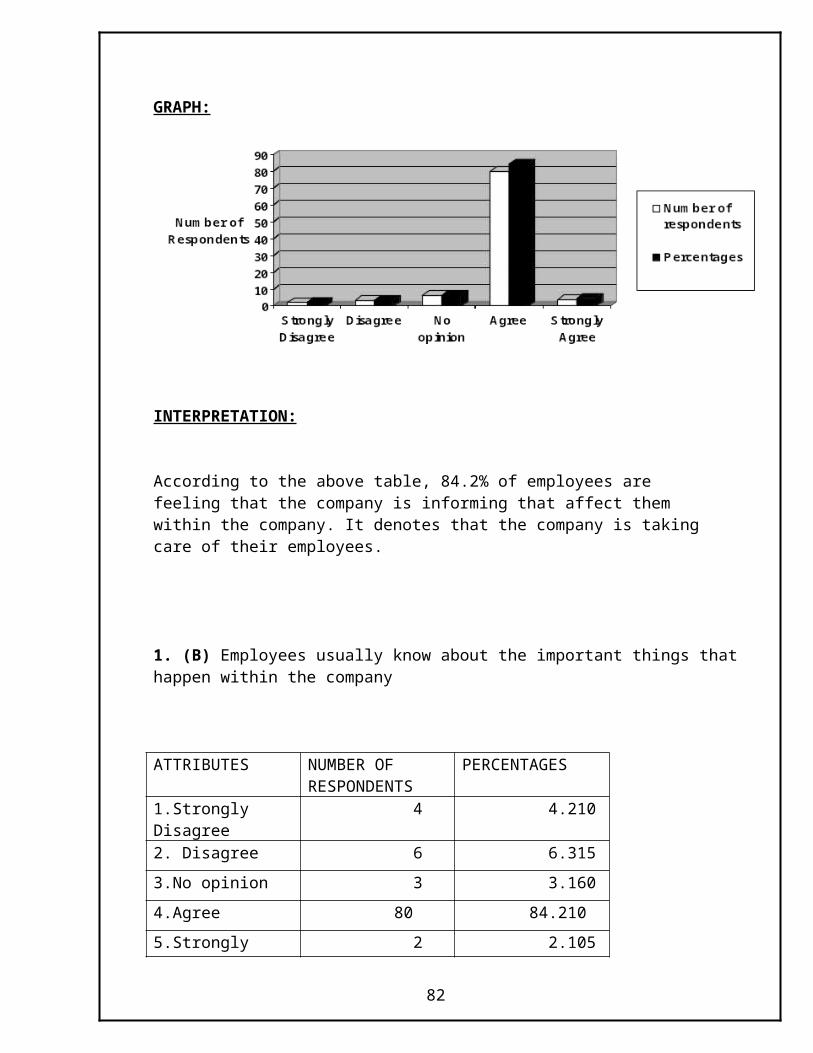
GRAPH:
INTERPRETATION:
According to the above table, 36.8% of employee’s votes as agree, 31.5% of employee’s votes as strongly agree that the manager helps them to get ahead at their job. But 15.7% of employees have no opinion that the manager helps them to get ahead at their job.
8(B) The relation between management and employees is good.
ATTRIBUTES NUMBER OF RESPONDENTS
PERCENTAGES
1.Strongly Disagree 4 4.213
2. Disagree 8 8.421
3.No opinion 13 13.684
4.Agree 42 44.210
5.Strongly Agree 28 29.475
TOTAL 95 100
GRAPH:
82
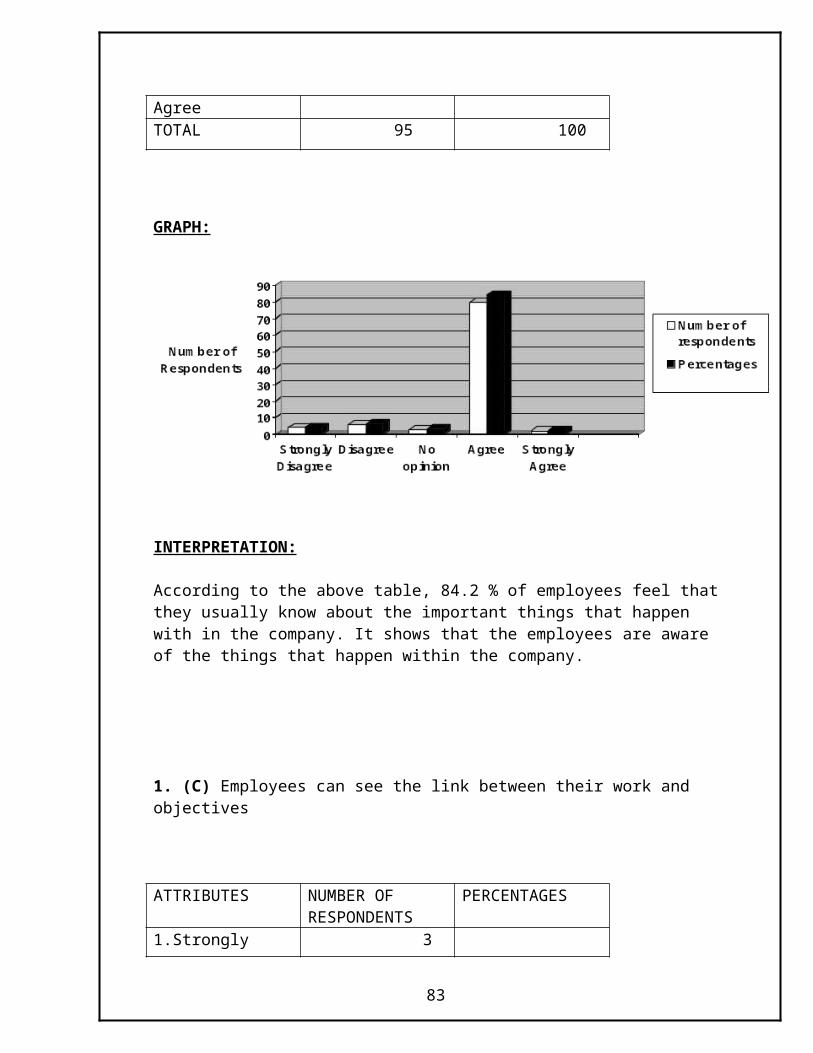
INTERPRETATION:
According to the above table, 44.2% of employee’s votes as agree, 29.4% of employee’s votes as strongly agree that the relationship between management and employees is good. It denotes that there is a good relationship between the management and employees within the company.
7(C) Management of company makes wise decision
ATTRIBUTES NUMBER OF RESPONDENTS
PERCENTAGES
1.Strongly Disagree 2 2.105
2. Disagree 5 5.263
3.No opinion 18 18.947
4.Agree 54 56.842
5.Strongly Agree 16 16.843
TOTAL 95 100
GRAPH:
83
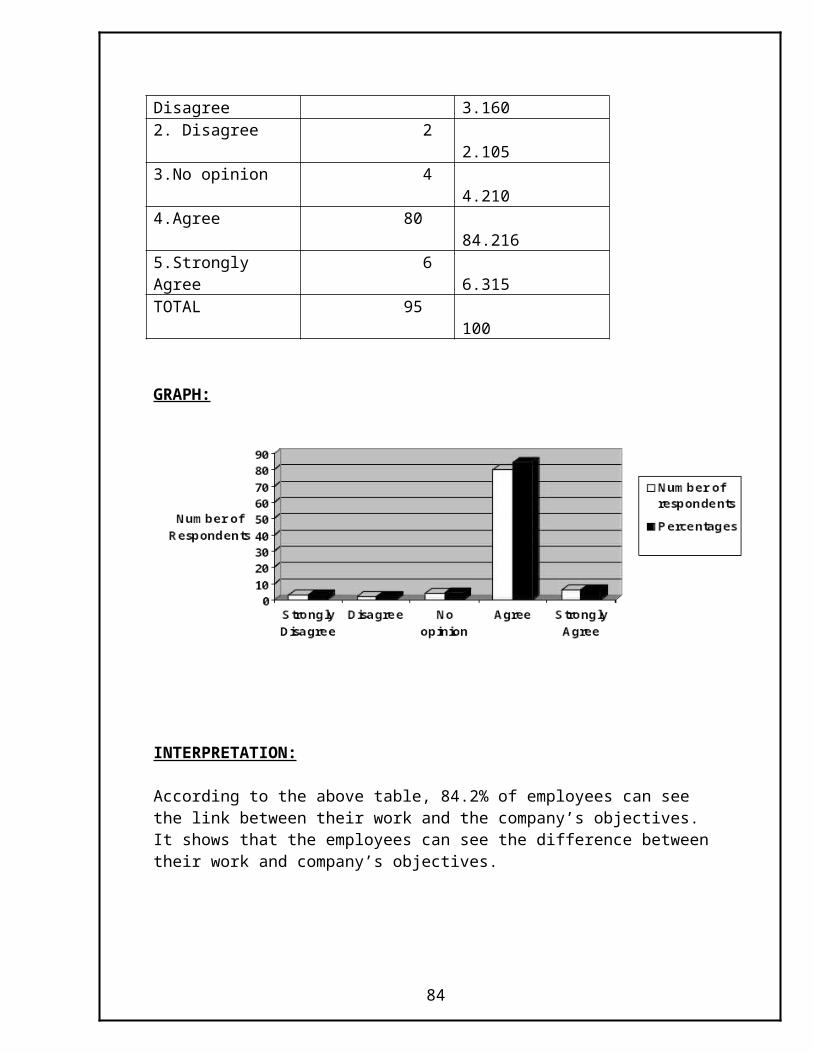
INTERPRETATION:
According to the above table, 56.8% of employee’s votes as agree, 16.8% of employee’s votes as strongly agree that the management of the company makes wise decisions. But 18.9% of employee’s has no idea about the management’s decisions.
7(D) The company executive cares about employee’s ideas.
ATTRIBUTES NUMBER OF RESPONDENTS
PERCENTAGES
1.Strongly Disagree 5 5.263
2. Disagree 10 10.528
3.No opinion 25 26.318
4.Agree 40 42.102
5.Strongly Agree 15 15.789
TOTAL 95 100
GRAPH:
84
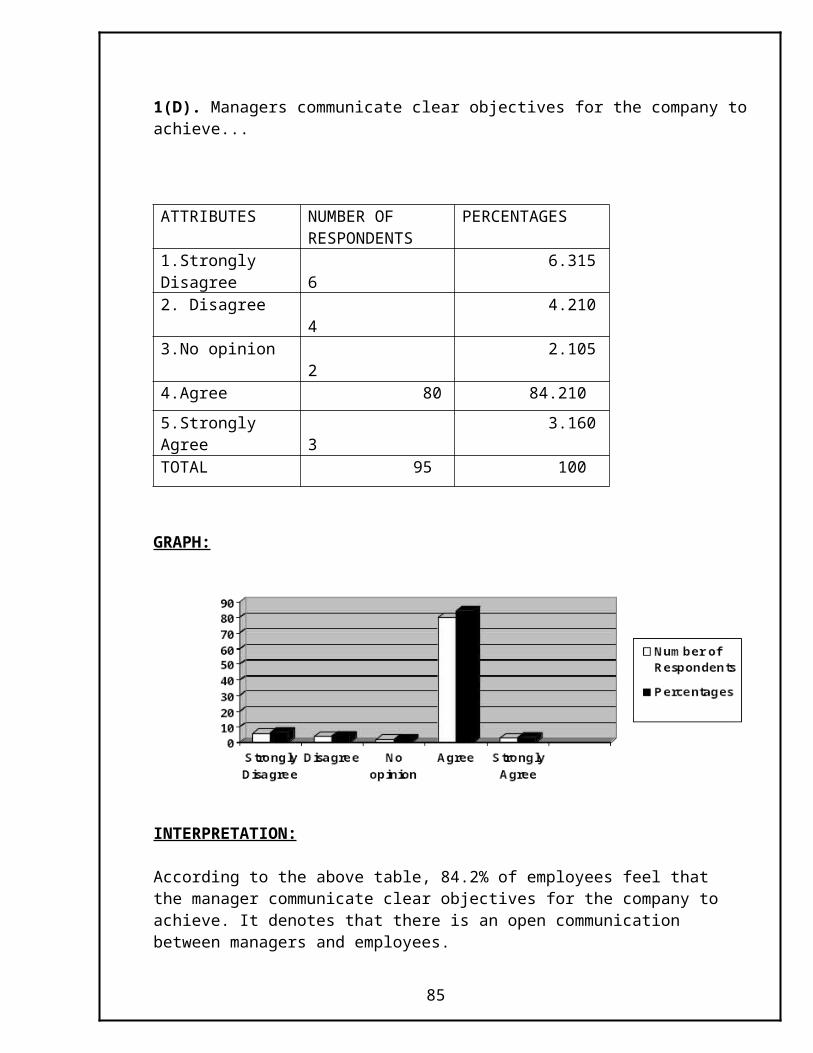
INTERPRETATION:
According to the above table, 42.1% of employee’s votes as agree, 15.7% of employee’s votes as strongly agree that the company executive cares about their ideas. But 26.3% of employee’s has no idea that the company executive cares about their ideas.
9. DEPARTMENT
(A) Conditions in departments allows employees to perform to a high standard..
ATTRIBUTES NUMBER OF RESPONDENTS
PERCENTAGES
1.Strongly Disagree 5 5.263
2. Disagree 10 10.528
3.No opinion 19 20.000
4.Agree 41 43.155
5.Strongly Agree 20 21.054
TOTAL 95 100
GRAPH:
85
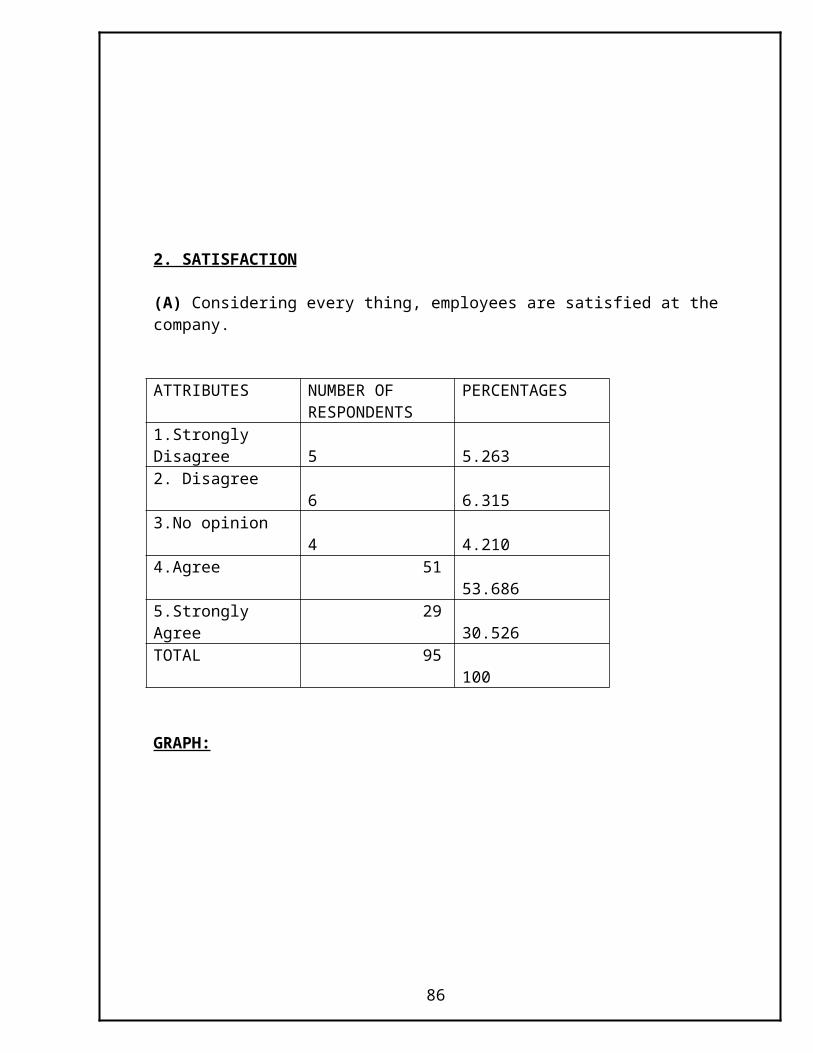
INTERPRETATION:
According to the above table,43.1% of employee’s votes as agree, 21% of employee’s votes as strongly agree that the conditions in their department allows them to perform to a high standard. But 20% of employee’s have no opinion about the conditions in the department that allow them to perform to a high standard.
9(B) Employee’s team focuses on fixing the problem rather than finding someone to blame.
ATTRIBUTES NUMBER OF RESPONDENTS
PERCENTAGES
1.Strongly Disagree 5 5.263
2. Disagree 5 5.263
3.No opinion 30 31.582
4.Agree 40 42.103
5.Strongly Agree 15 15.789
TOTAL 95 100
GRAPH:
86
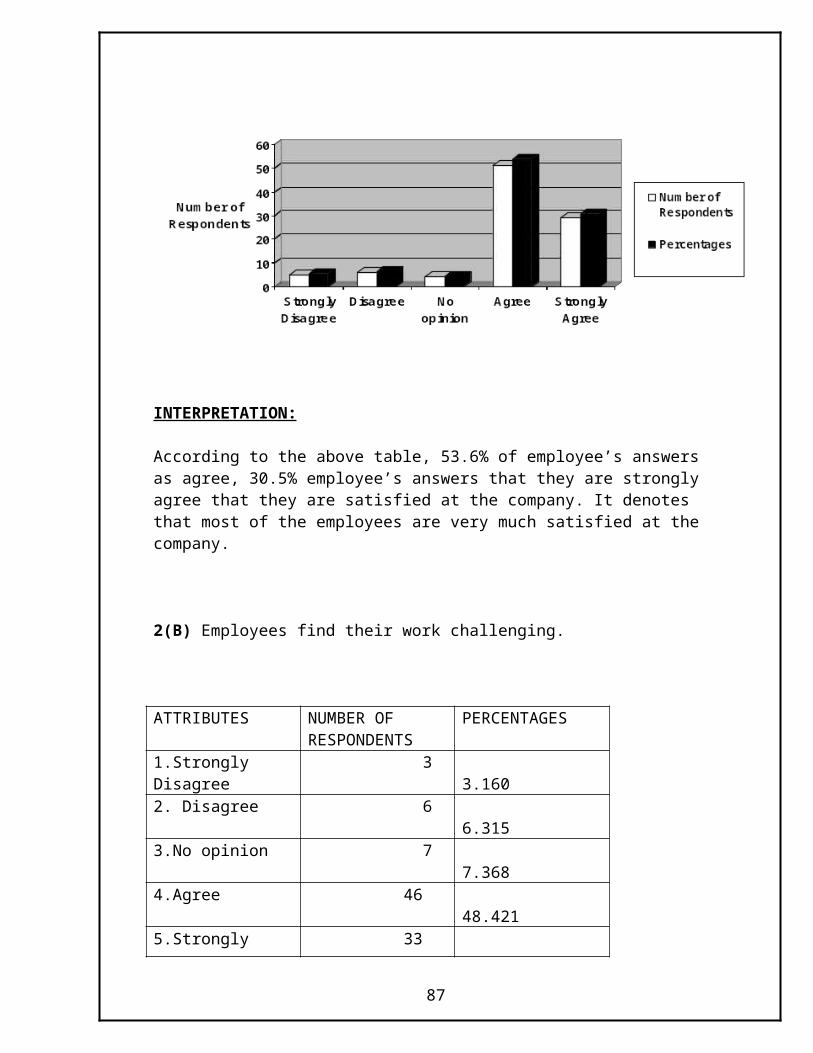
INTERPRETATION:
According to the above table, 42.1% of employee’s votes as agree, 15% of employee’s votes as strongly agree that their team focuses on fixing the problem rather than finding someone to blame. It denotes that the employees are committed to work that they have been done.
9(C) Employee’s team looks for ways to change processes to improve performance.
ATTRIBUTES NUMBER OF RESPONDENTS
PERCENTAGES
1.Strongly Disagree 5 5.263
2. Disagree 10 10.528
3.No opinion 15 15.789
4.Agree 50 52.631
5.Strongly Agree 15 15.789
TOTAL 95 100
GRAPH:
87
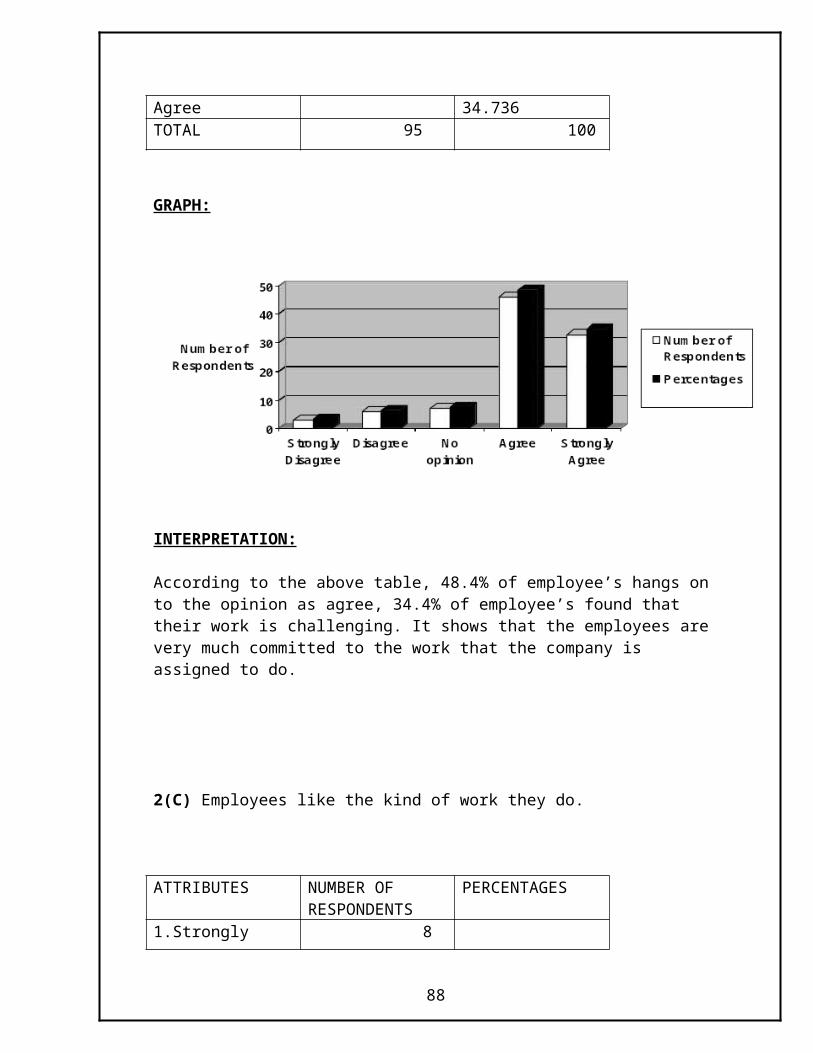
INTERPRETATION:
According to the above table, 52.6% of employee’s votes as agree, 15% of employee’s votes as strongly agree that their team looks for ways to change processes to improve performance. It shows that the team is very much innovative in finding their ideas to improve their performance.
9(D) The morale in employee’s department is generally high.
ATTRIBUTES NUMBER OF RESPONDENTS
PERCENTAGES
1.Strongly Disagree 5 5.263
2. Disagree 15 15.789
3.No opinion 30 31.580
4.Agree 25 26.318
5.Strongly Agree 20 21.050
TOTAL 95 100
GRAPH:
88
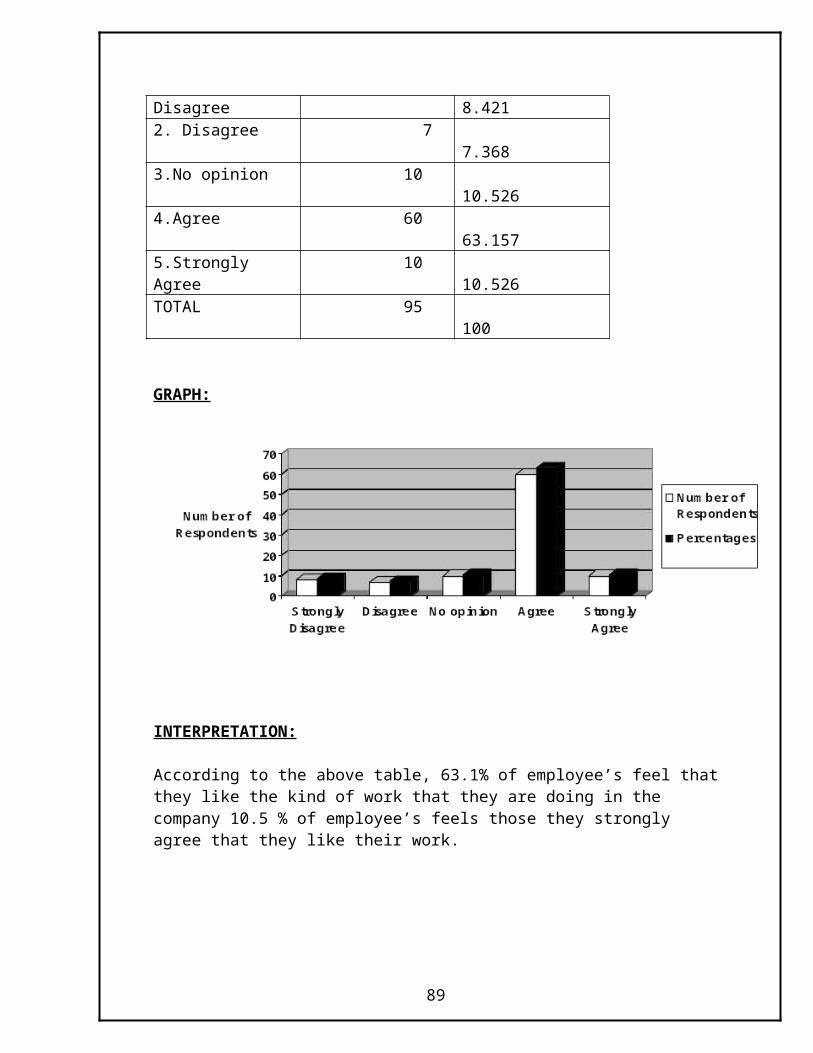
INTERPRETATION:
According to the above table, 26% of employee’s votes as agree, 21% of employee’s votes as strongly agree that the morale in their department is generally high. But most of the employee’s feels that they have no opinion about the morale in the department.
10. TEAMWORK
(A) Employees believe that all the division in the company work together to achieve a common goal.
ATTRIBUTES NUMBER OF RESPONDENTS
PERCENTAGES
1.Strongly Disagree 5 5.263
2. Disagree 8 8.421
3.No opinion 17 17.894
4.Agree 53 55.789
5.Strongly Agree 12 12.633
TOTAL 95 100
89
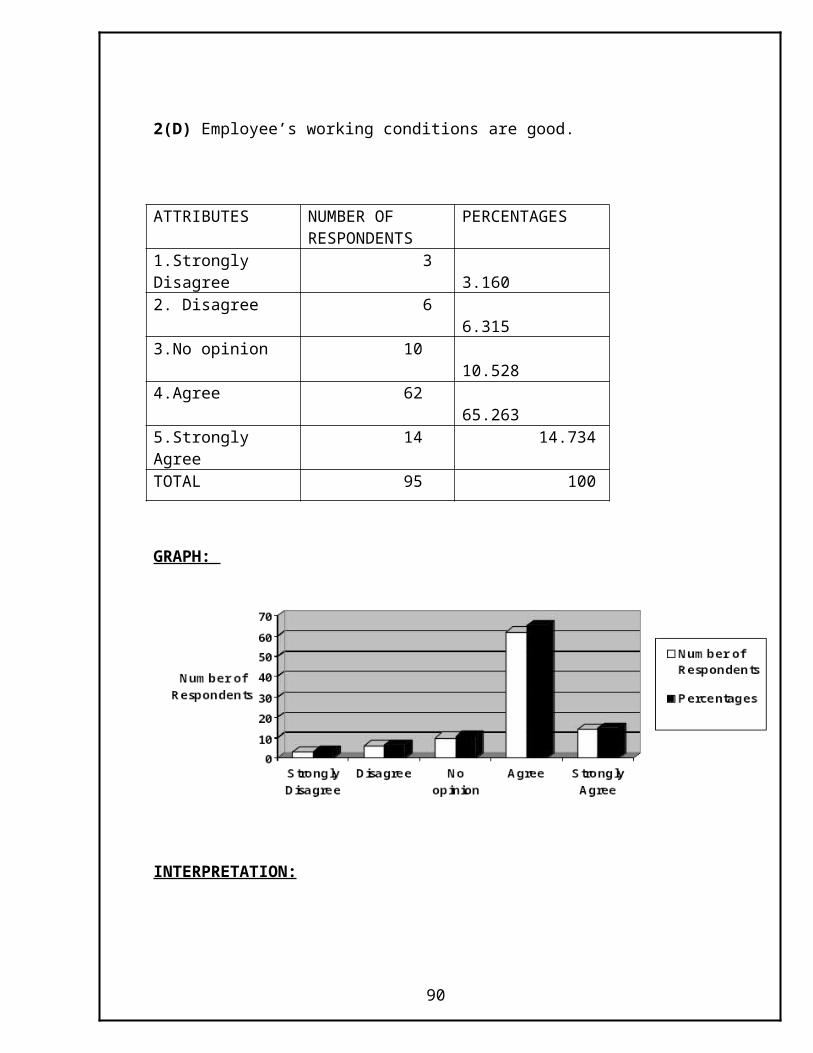
GRAPH:
INTERPRETATION:
According to the above table, 55.7% of employee’s votes as agree, 12.6% of employee’s votes as strongly agree that they believe that all the divisions in the company work together to achieve a common goal. It denotes that all the divisions in the company have a common goal and they work together to achieve it.
10(B) The people where employees work will co-operate to get the work done.
ATTRIBUTES NUMBER OF RESPONDENTS
PERCENTAGES
1.Strongly Disagree 5 5.263
2. Disagree 7 7.368
3.No opinion 8 8.420
4.Agree 65 68.421
5.Strongly Agree 10 10.528
TOTAL 95 100
GRAPH:
90
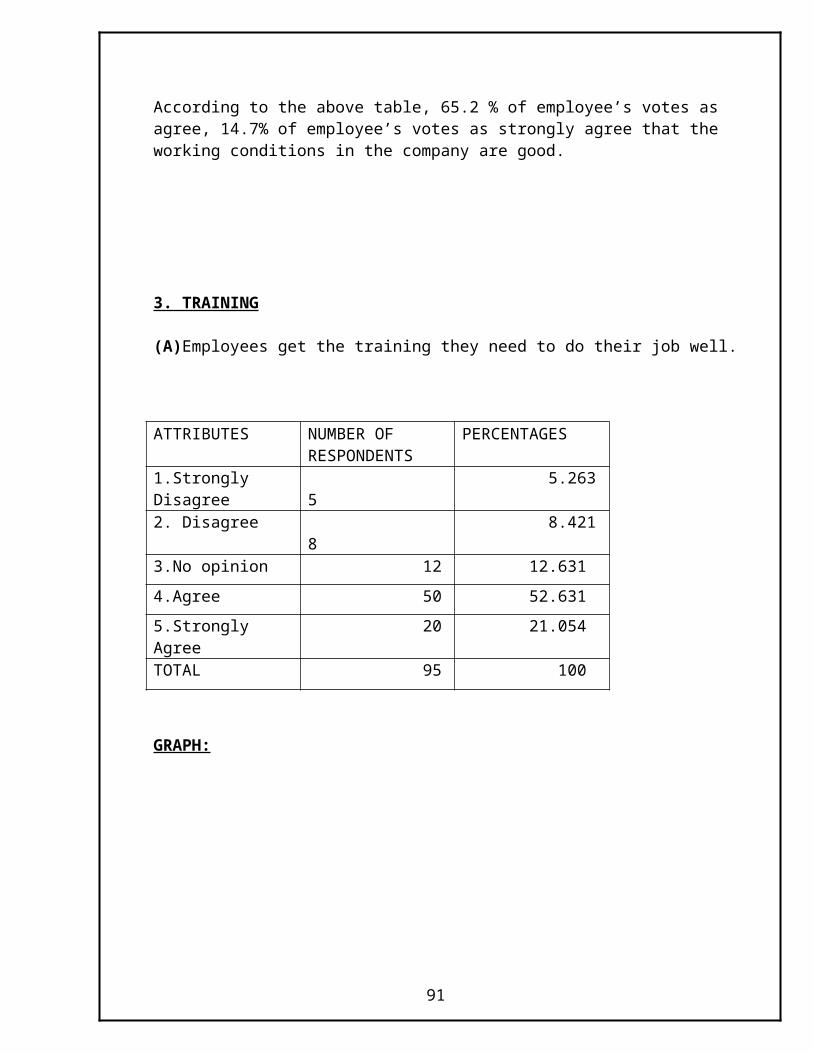
INTERPRETATION:
According to the above table, 68.4% of employee’s votes as agree, 10% of employee’s votes as strongly agree that the people where they work will cooperate to get the work done. It shows that the employee relations in the company are good.
10(C) There is a spirit of togetherness of employees within the company.
ATTRIBUTES NUMBER OF RESPONDENTS
PERCENTAGES
1.Strongly Disagree 3 3.157
2. Disagree 9 9.473
3.No opinion 27 28.421
4.Agree 35 36.842
5.Strongly Agree 21 22.107
TOTAL 95 100
GRAPH:
91
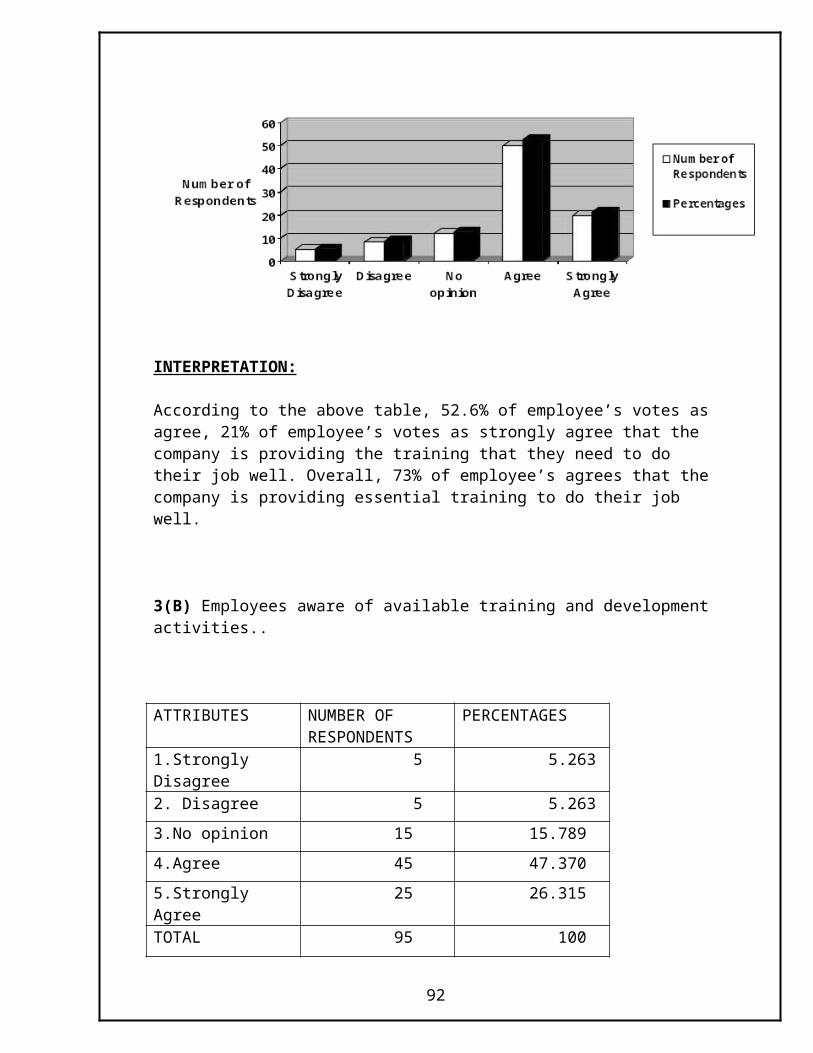
INTERPRETATION:
According to the above table, 36.8% of employee’s votes as agree, 22.1% of employee’s votes as strongly agree, that there is a spirit of equality with in the company. But 28.4% of employee’s have no opinion about the equality among themselves.
10(D) There is cooperation among team members.
ATTRIBUTES NUMBER OF RESPONDENTS
PERCENTAGES
1.Strongly Disagree 1 1.054
2. Disagree 2 2.105
3.No opinion 10 10.526
4.Agree 72 75.789
5.Strongly Agree 10 10.526
TOTAL 95 100
GRAPH:
92
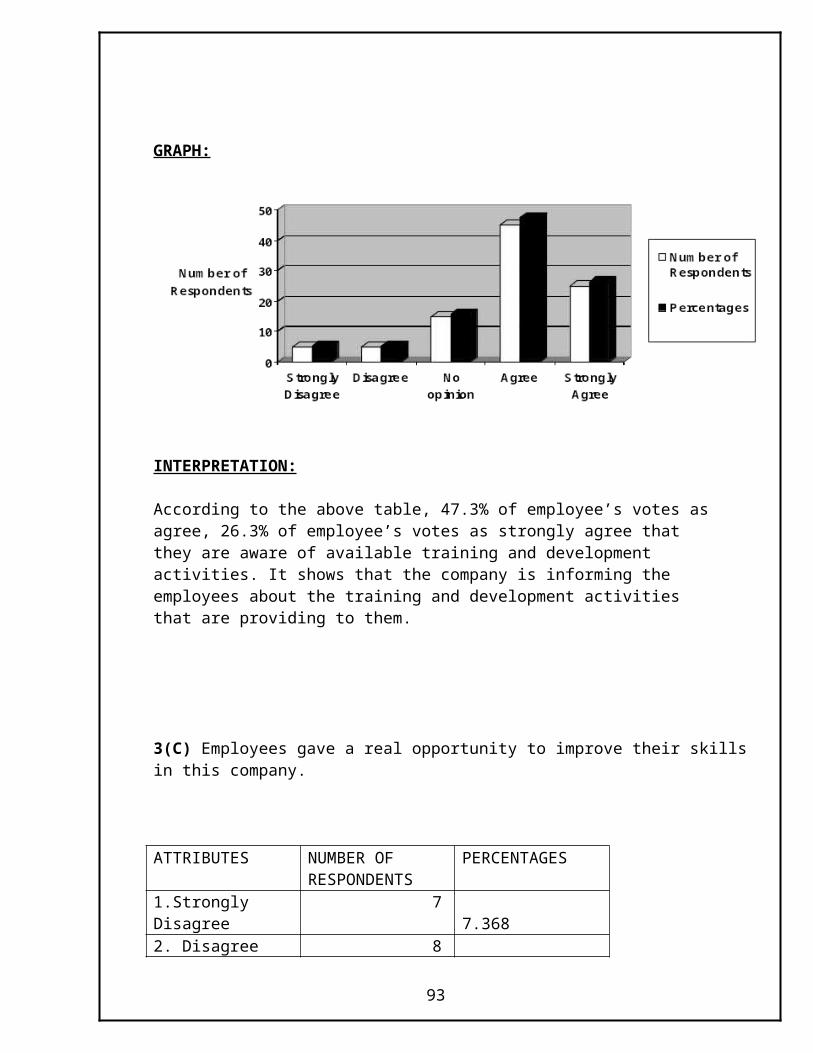
INTERPRETATION:
According to the above table, 75.7% of employee’s votes as agree, 10.5% of employee’s votes as strongly agree that there is cooperation among team members. It denotes that the employees cooperate with each other in the company.
11. RESPECT
(A) Employees feel that they are valued at work
ATTRIBUTES NUMBER OF RESPONDENTS
PERCENTAGES
1.Strongly Disagree 2 2.105
2. Disagree 2 2.105
3.No opinion 14 14.736
4.Agree 41 43.155
5.Strongly Agree 36 37.899
TOTAL 95 100
GRAPH:
93
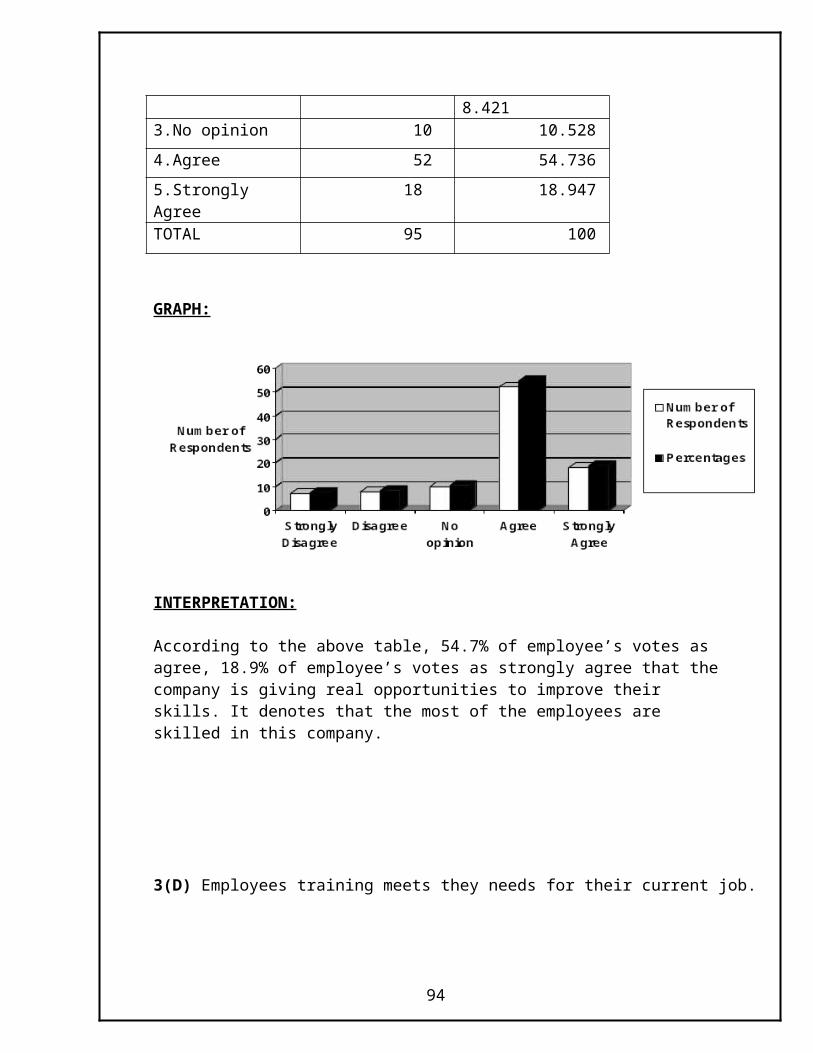
INTERPRETATION:
According to the above table, 43.1% of employee’s votes as agree, 37.8% of employee’s votes as strongly agree that they feel that they are valued at work. It shows that the company is valuing each employee at work
11(B) At Company, Employee’s opinions count.
ATTRIBUTES NUMBER OF RESPONDENTS
PERCENTAGES
1.Strongly Disagree 5 5.263
2. Disagree 10 10.526
3.No opinion 30 31.580
4.Agree 35 36.842
5.Strongly Agree 15 15.789
TOTAL 95 100
GRAPH:
94
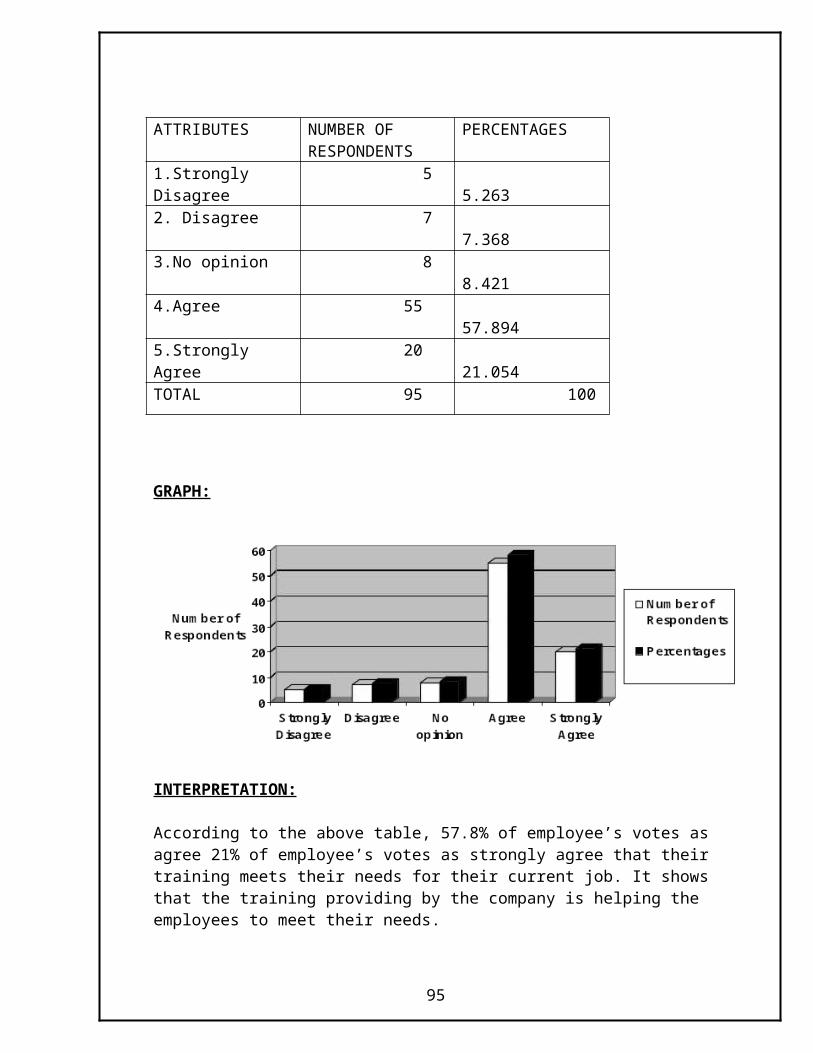
INTERPRETATION:
According to the above table, 36.8% of employee’s votes as agree, 15.7% of employee’s votes as strongly agree that their opinions will count at company. But 31.5% of employee’s don’t know whether their opinions will count or not.
11(C) Employees in the company are treated with respect regardless their job.
ATTRIBUTES NUMBER OF RESPONDENTS
PERCENTAGES
1.Strongly Disagree 2 2.105
2. Disagree 5 5.263
3.No opinion 22 23.157
4.Agree 48 50.526
5.Strongly Agree 18 18.949
TOTAL 95 100
GRAPH:
95
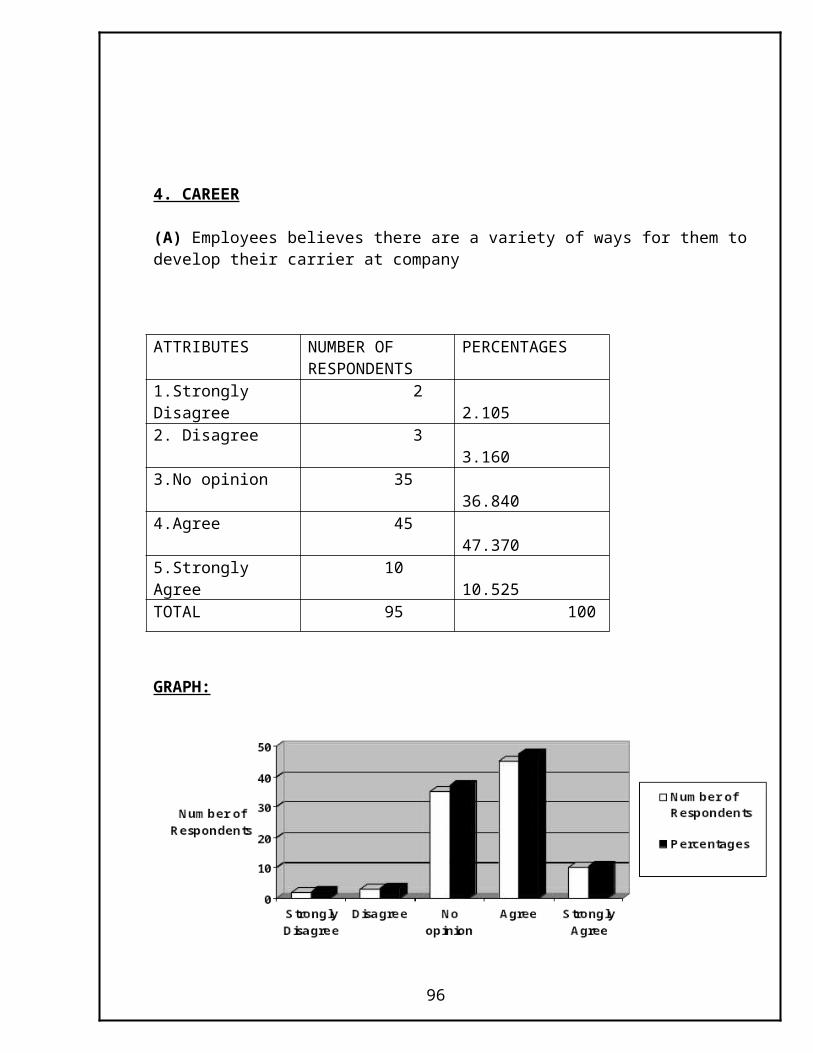
INTERPRETATION:
According to the above table, 50.5% of employee’s votes as agree, 18.9% of employee’s votes as strongly agree that employees in the company are treated with respect regardless of their job.
12. EQUALITY
(A) Employees believe that rewards are given fairly where they work..
ATTRIBUTES NUMBER OF RESPONDENTS
PERCENTAGES
1.Strongly Disagree 5 5.263
2. Disagree 6 6.315
3.No opinion 20 21.052
4.Agree 42 44.210
5.Strongly Agree 22 23.160
TOTAL 95 100
GRAPH:
96
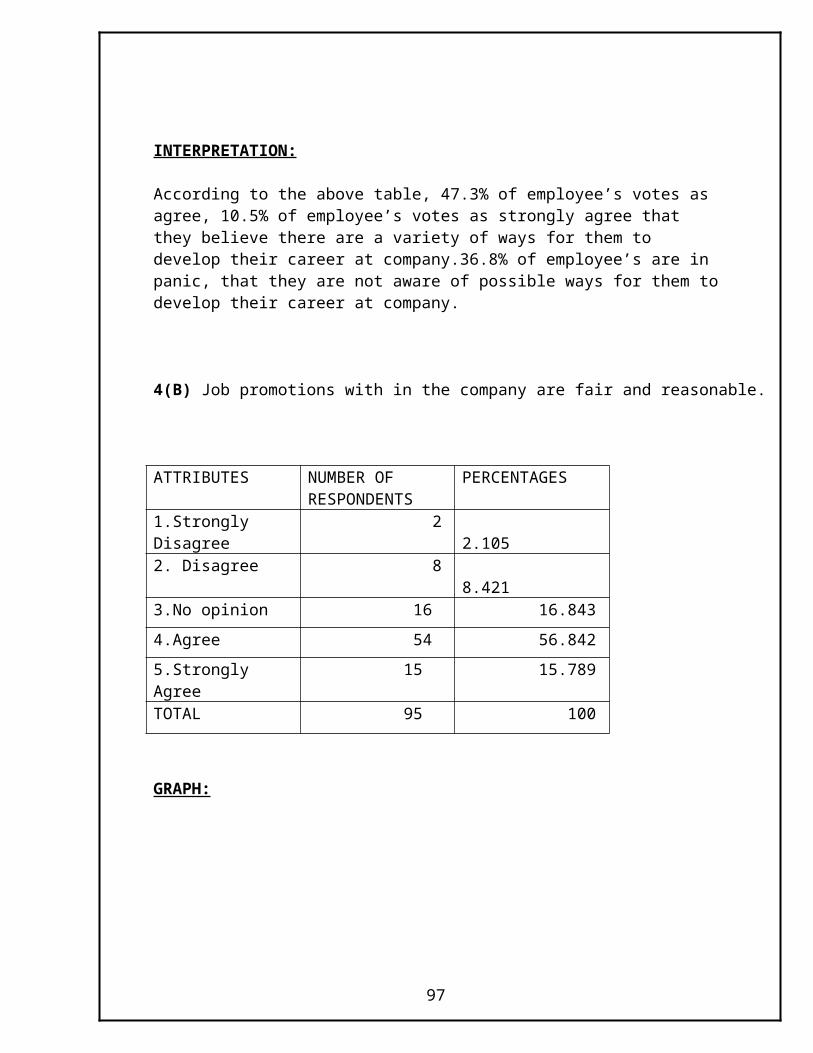
INTERPRETATION:
According to the above table, 44.2% of employee’s votes as agree, 23.1% of employee’s votes as strongly agree that they believe that rewards are given fairly in the company. But 21% of employees feels that they have no opinion about the rewards are given unfairly or fairly.
12(B) Every one at company does their share of work.
ATTRIBUTES NUMBER OF RESPONDENTS
PERCENTAGES
1.Strongly Disagree 2 2.105
2. Disagree 3 3.160
3.No opinion 14 14.738
4.Agree 56 58.947
5.Strongly Agree 20 21.050
TOTAL 95 100
GRAPH:
97

INTERPRETATION:
According to the above table, 58.9% of employee’s votes as agree, 21% of employee’s votes as strongly agree that every one at the company does their share of work. It denotes that the employees in the company are committed to the work.
12(C) Company is committed to ensuring equal opportunities for all employees.
ATTRIBUTES NUMBER OF RESPONDENTS
PERCENTAGES
1.Strongly Disagree 2 2.105
2. Disagree 6 6.315
3.No opinion 17 17.894
4.Agree 57 60.000
5.Strongly Agree 13 13.686
TOTAL 95 100
GRAPH:
98
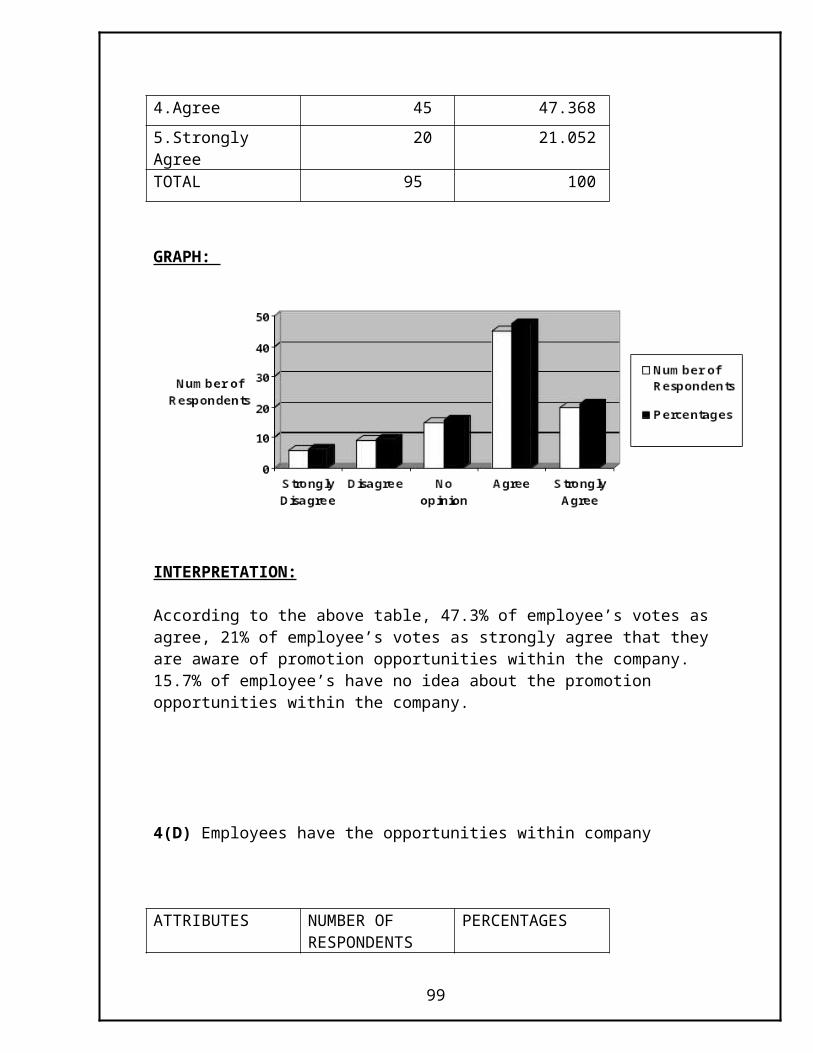
INTERPRETATION:
According to the above table, 60% of employee’s votes as agree, 13.6% of employee’s votes as strongly agree that the company is committed to ensuring equal opportunities for all employees. It denotes the equality of the company towards the employees
12(D) Employees feel everyone are treated fairly in their department
ATTRIBUTES NUMBER OF RESPONDENTS
PERCENTAGES
1.Strongly Disagree 3 3.157
2. Disagree 6 6.315
3.No opinion 12 12.631
4.Agree 42 44.210
5.Strongly Agree 32 33.687
TOTAL 95 100
GRAPH:
99
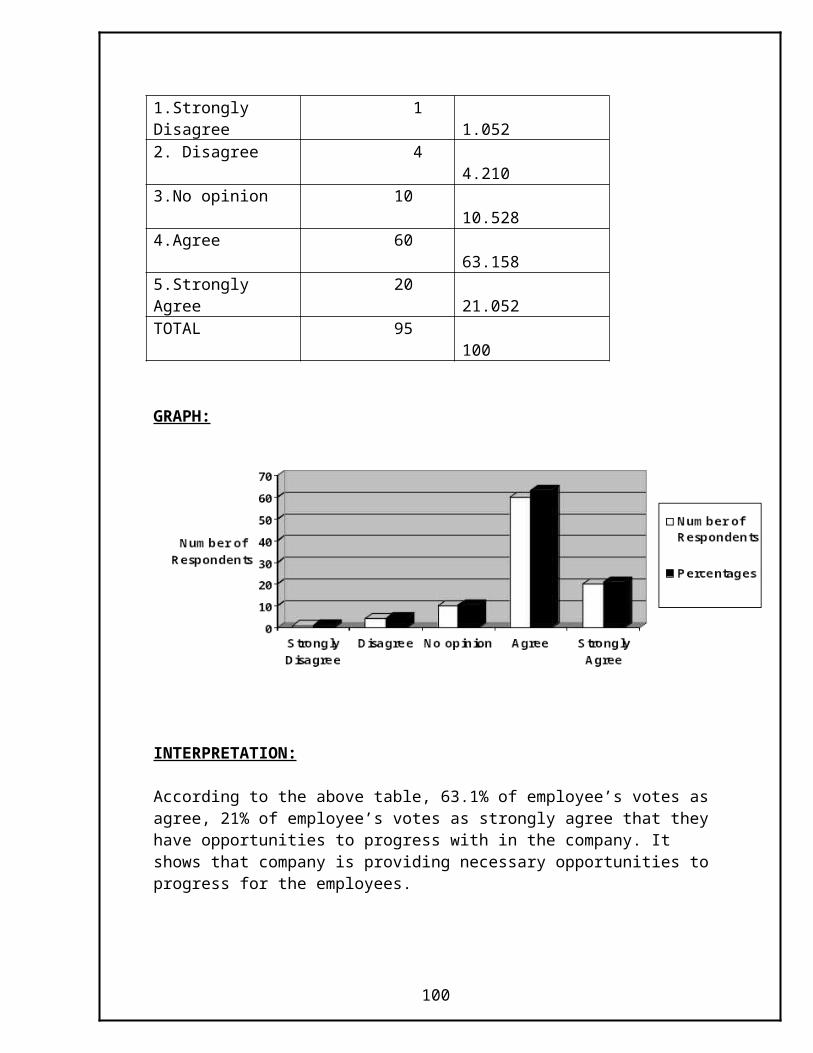
INTERPRETATION:
According to the above table, 44.2% of employee’s votes as agree, 33.6% of employee’s votes as strongly agree that they feel everyone is treated fairly in their department. It shows that the company is treating everyone fairly, but not with partiality.
14. SECURITY
(A) Employees feel to express their opinions without worrying about negative actions/responses.
ATTRIBUTES NUMBER OF RESPONDENTS
PERCENTAGES
1.Strongly Disagree 5 5.263
2. Disagree 10 10.528
3.No opinion 25 26.313
4.Agree 35 36.842
5.Strongly Agree 20 21.054
TOTAL 95 100
100
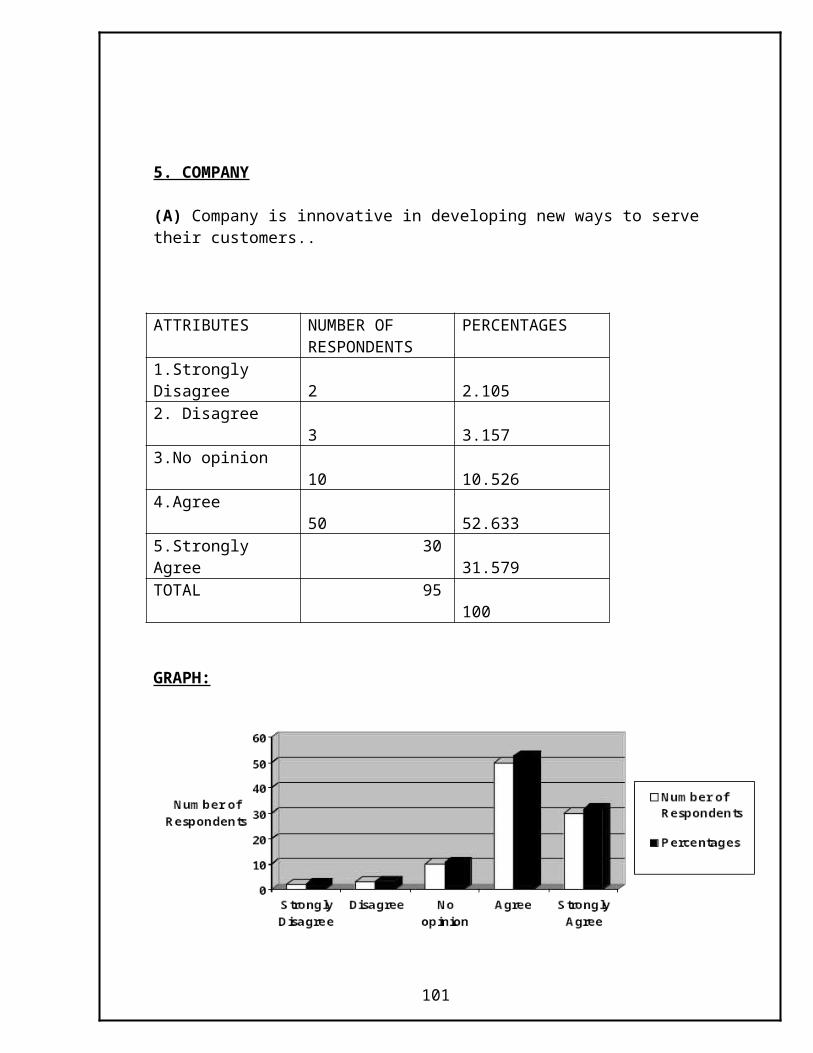
GRAPH:
INTERPRETATION:
According to the above table, 36.8% of employee’s votes as agree, 21% of employee’s votes as strongly agree that they feel free to express their opinions with out worrying about negative actions/responses. But 26.3% of employee’s have no idea about expressing there opinions in the company.
14(B) Employees feel they have job security.
ATTRIBUTES NUMBER OF RESPONDENTS
PERCENTAGES
1.Strongly Disagree 5 5.263
2. Disagree 10 10.528
3.No opinion 30 31.580
4.Agree 35 36.842
5.Strongly Agree 15 15.787
TOTAL 95 100
GRAPH:
101
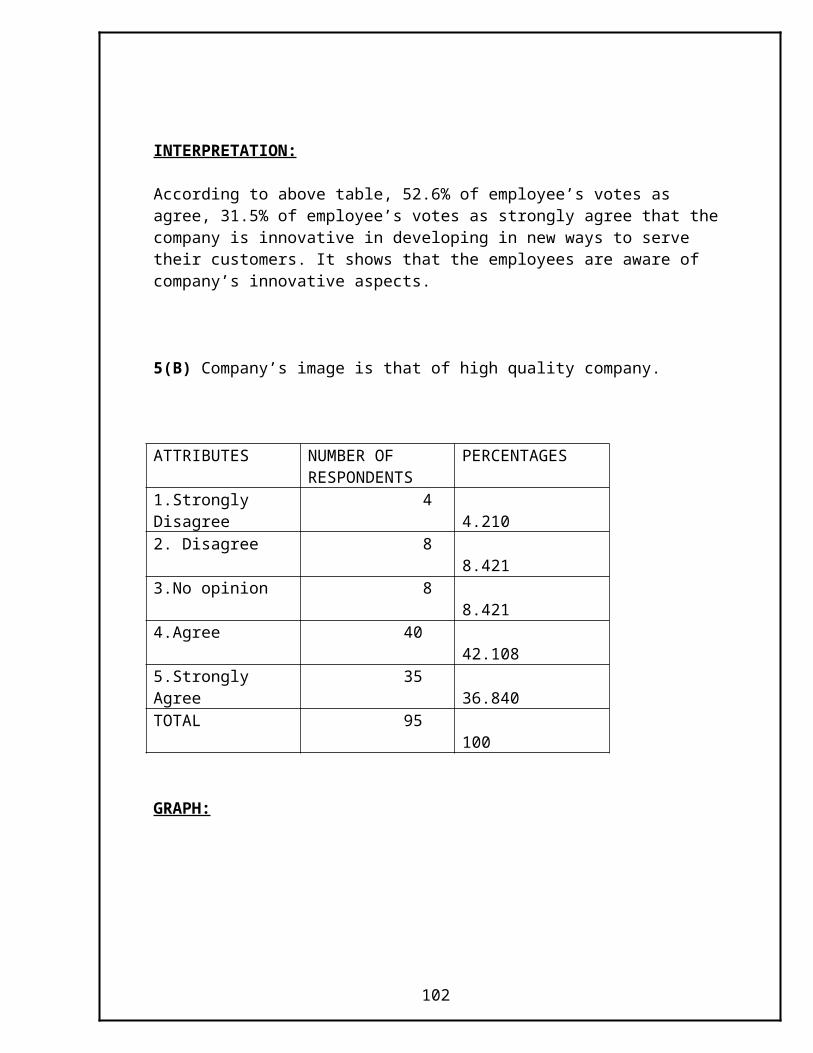
INTERPRETATION:
According to the above table, 36.8% of employee’s votes as agree, 15.7% of employee’s votes as strongly agree that they have job security. But 31.5% of employee’s feel that they have no idea about their job security.
13. EMPLOYEE’S SALARY AND COMPENSATION BENEFITS
(A) The company is providing with reasonable remuneration to employees.
ATTRIBUTES NUMBER OF RESPONDENTS
PERCENTAGES
1.Strongly Disagree 1 1.052
2. Disagree 4 4.210
3.No opinion 24 25.263
4.Agree 56 58.947
5.Strongly Agree 10 10.528
TOTAL 95 100
GRAPH:
102
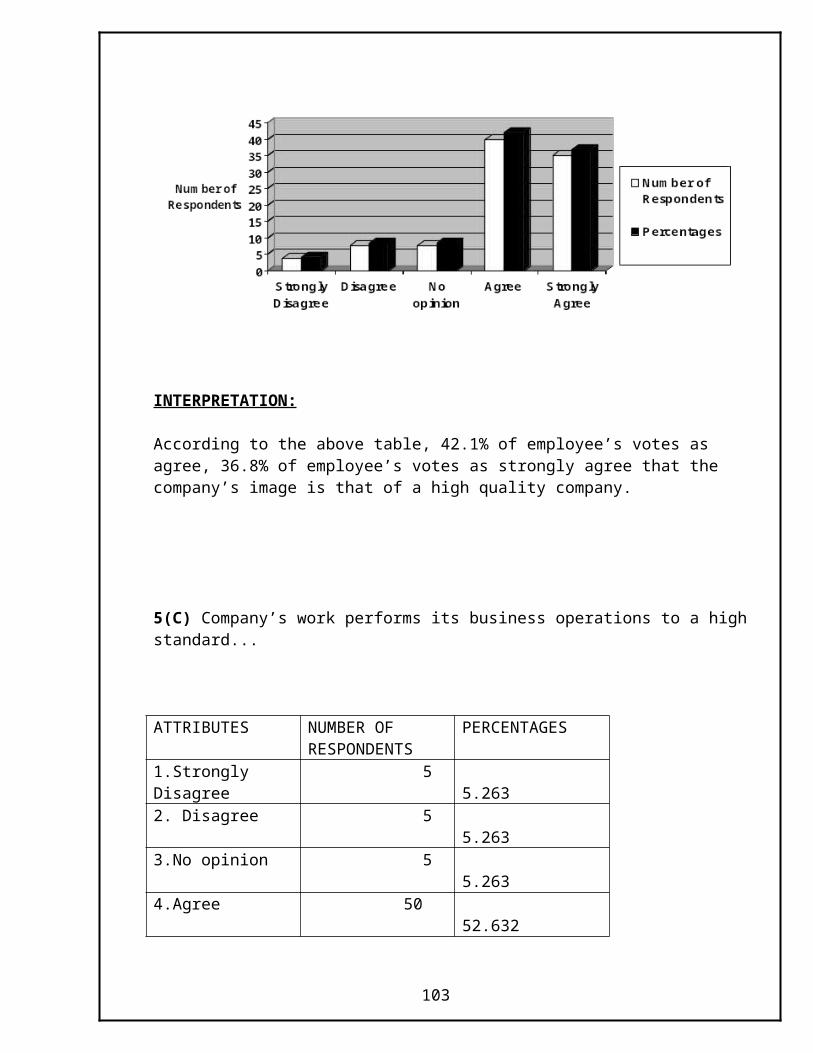
INTERPRETATION:
According to the above table, 58.9% of employee’s votes as agree, 10.5% of employee’s votes as strongly agree that the company is providing with reasonable remuneration to them. But 25.2% of employee’s have no answer whether the company is providing with reasonable remuneration or not.
13(B) Employees are satisfied with the salary that the company is offering.
ATTRIBUTES NUMBER OF RESPONDENTS
PERCENTAGES
1.Strongly Disagree 6 6.315
2. Disagree 10 10.528
3.No opinion 30 31.580
4.Agree 35 36.842
5.Strongly Agree 14 14.735
TOTAL 95 100
GRAPH:
103
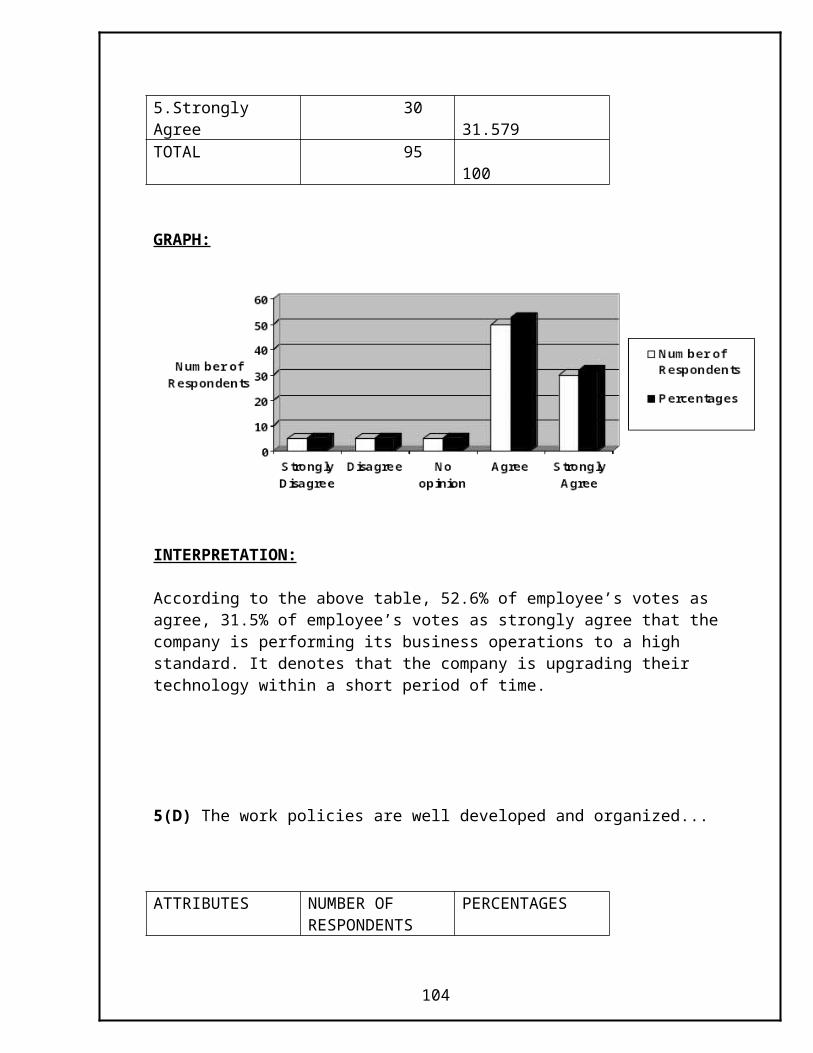
INTERPRETATION:
According to the above table, 36.8% of employee’s votes as agree, 14.7% of employee’s votes as strongly agree that they are satisfied with the salary that the company is offering. But 31.5% of employee’s have no answer that they are satisfied with the salary or not that the company is offering.
13(C) Employees are expecting more salary from the company.
ATTRIBUTES NUMBER OF RESPONDENTS
PERCENTAGES
1.Strongly Disagree 5 5.263
2. Disagree 10 10.528
3.No opinion 20 21.053
4.Agree 40 42.102
5.Strongly Agree 20 21.054
TOTAL 95 100
GRAPH:
104
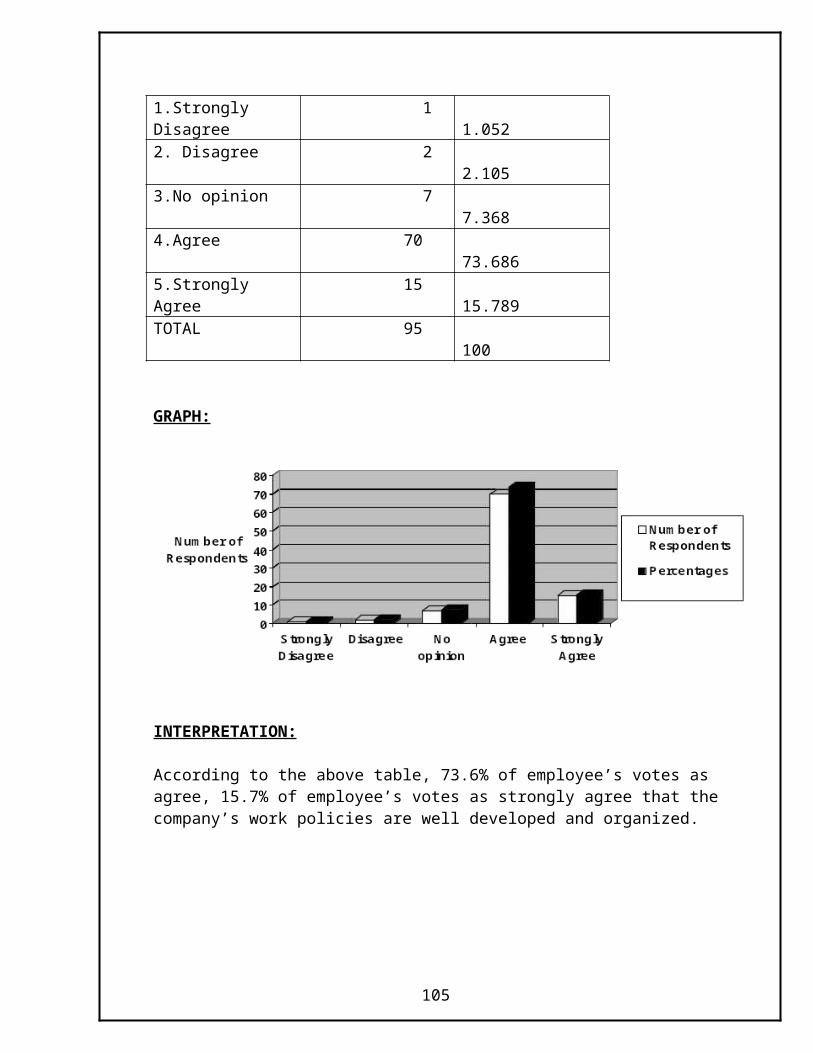
INTERPRETATION:
According to the above table, 42.1% of employee’s votes as agree, 21% of employee’s votes as strongly agree that they are expecting more salary from the company. But 21% of employee’s have no opinion about this issue.
13(D) Employee’s salary is equivalent to their work that they have been done..
ATTRIBUTES NUMBER OF RESPONDENTS
PERCENTAGES
1.Strongly Disagree 3 3.157
2. Disagree 12 12.631
3.No opinion 20 21.054
4.Agree 45 47.369
5.Strongly Agree 15 15.789
TOTAL 95 100
GRAPH:
105
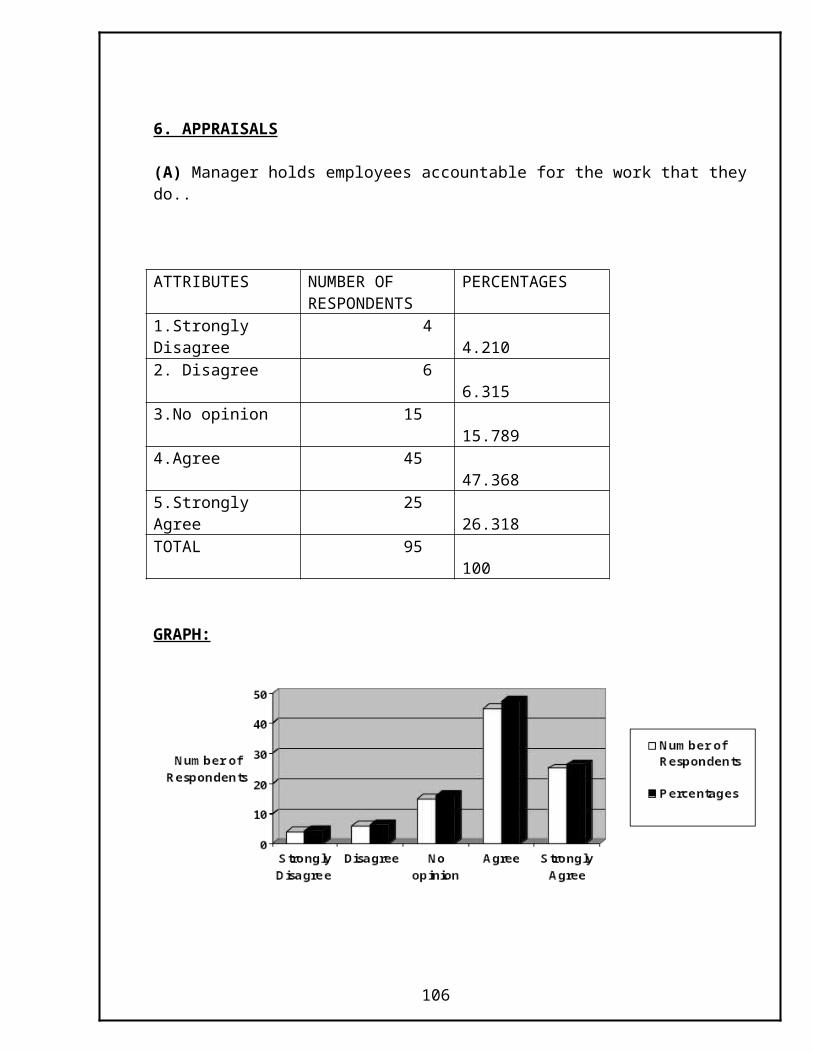
INTERPRETATION:
According to the above table, 47.3% of employee’s votes as agree, 15.7% of employee’s votes as strongly agree that the salary is equivalent to the work that they have been done. But 21% of employee’s have no idea about the sense of equality between their salary and work.
13(E) The Company is providing employees with all necessary benefits.
ATTRIBUTES NUMBER OF RESPONDENTS
PERCENTAGES
1.Strongly Disagree 2 2.105
2. Disagree 10 10.526
3.No opinion 20 21.054
4.Agree 40 42.103
5.Strongly Agree 23 24.212
TOTAL 95 100
GRAPH:
106
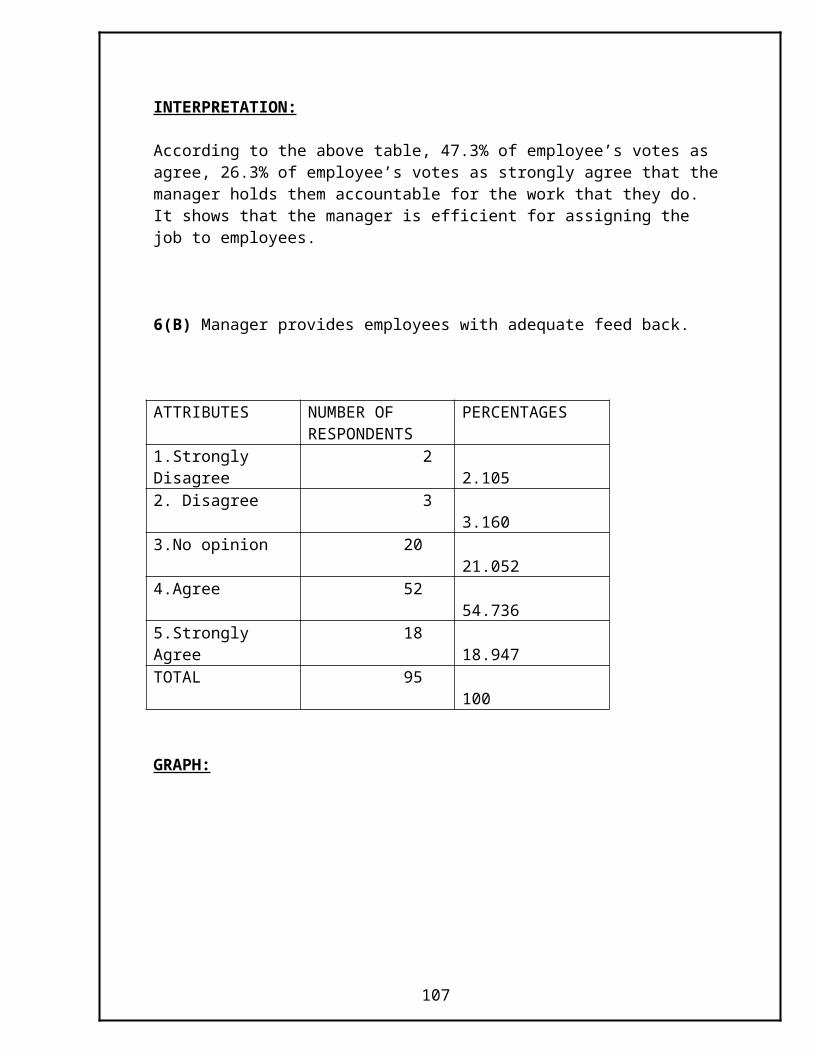
INTERPRETATION:
According to the above table, 42.1% of employee’s votes as agree, 24% of employee’s votes as strongly agree that the company is providing them with all necessary benefits. But 21% of employee’s have no opinion about this topic.
13(F) The Company is providing with all compensation benefits if any damage occurs to employees...
ATTRIBUTES NUMBER OF RESPONDENTS
PERCENTAGES
1.Strongly Disagree 4 4.210
2. Disagree 7 7.368
3.No opinion 12 12.631
4.Agree 62 65.265
5.Strongly Agree 10 10.526
TOTAL 95 100
GRAPH:
107
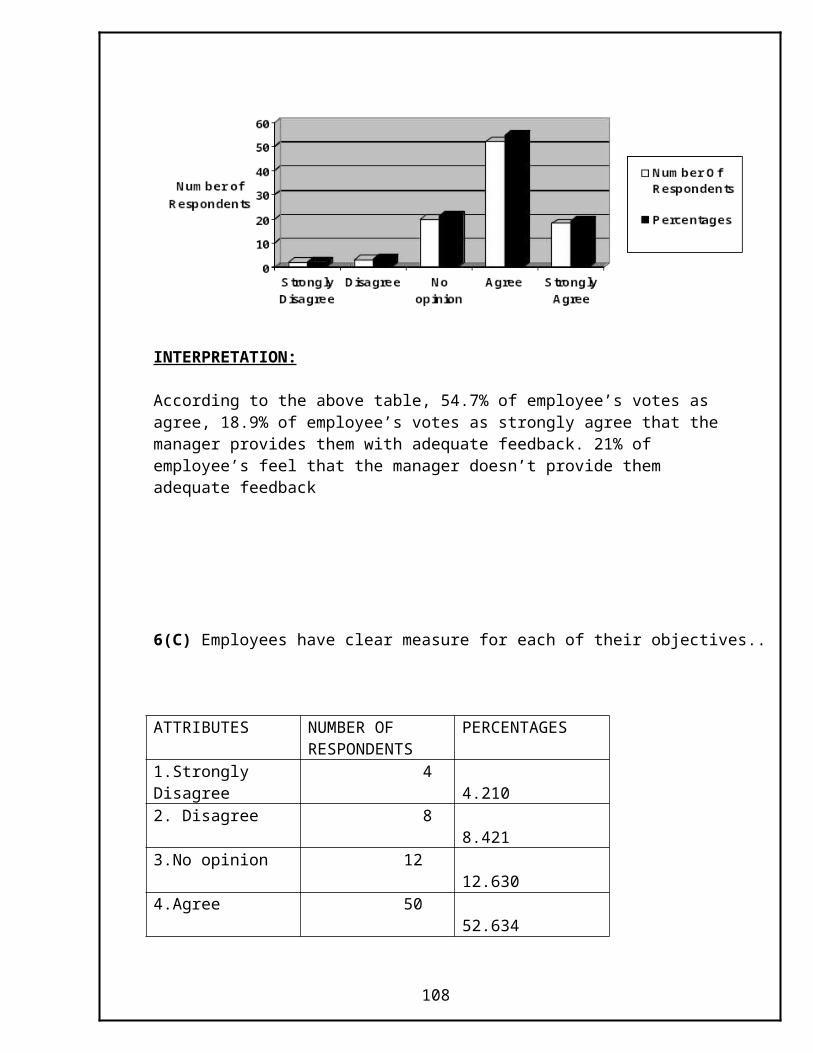
INTERPRETATION:
According to the above table, 65.2% of employee’s votes as agree, 10.5% of employees votes as strongly agree that the company is providing with all compensation benefits if any damage occurs to them.
13(G) The compensation benefits providing by the company are reasonable.
ATTRIBUTES NUMBER OF RESPONDENTS
PERCENTAGES
1.Strongly Disagree 3 3.157
2. Disagree 12 12.631
3.No opinion 35 36.845
4.Agree 25 26.313
5.Strongly Agree 20 21.054
TOTAL 95 100
GRAPH:
108
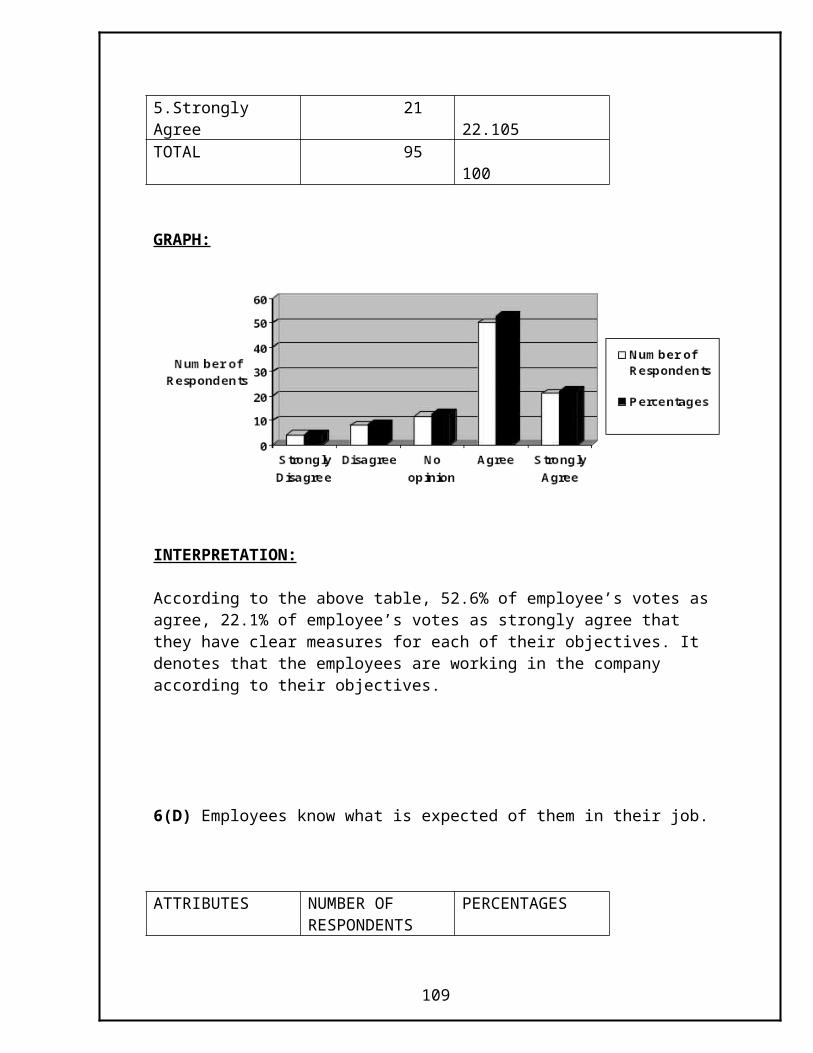
INTERPRETATION:
According to the above table, 26.3% of employee’s votes as agree, 21% of employee’s votes as strongly agree that the compensation benefits providing by the company are reasonable. But 36.8% of employee’s has no idea that the compensation benefits are reasonable or not.
13(H) The Company provides any monetary benefits in case of emergency to employees...
ATTRIBUTES NUMBER OF RESPONDENTS
PERCENTAGES
1.Strongly Disagree 3 3.157
2. Disagree 4 4.210
3.No opinion 36 37.894
4.Agree 32 33.685
5.Strongly Agree 20 21.054
TOTAL 95 100
GRAPH:
109

INTERPRETATION:
According to the above table, 33.6% of employee’s votes as agree, 21% of employee’s votes as strongly agree that the company provides any monetary benefits in case of emergency to them. But most of the employees have no opinion about this issue.
13(I) The Company provides all benefits at correct time without any delay.
ATTRIBUTES NUMBER OF RESPONDENTS
PERCENTAGES
1.Strongly Disagree 10 10.526
2. Disagree 14 14.736
3.No opinion 26 27.368
4.Agree 32 33.686
5.Strongly Agree 13 13.684
TOTAL 95 100
GRAPH:
110
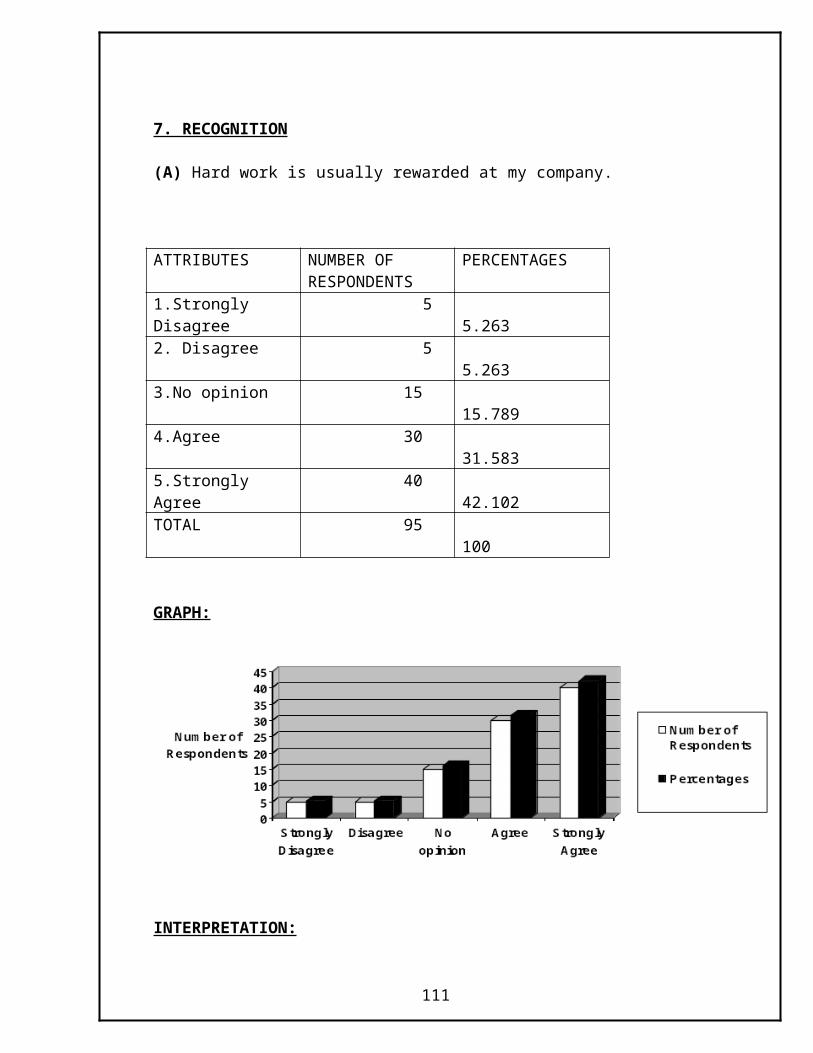
INTERPRETATION:
According to the above table, 33.6% of employee’s votes as agree, 13.6% of employee’s votes as strongly agree that the company provides all benefits at correct time without any delay. But 27.3% of employee’s has no answer to this question.
13(J) Employees are totally satisfied with all benefits that the company is providing.
ATTRIBUTES NUMBER OF RESPONDENTS
PERCENTAGES
1.Strongly Disagree 1 1.052
2. Disagree 2 2.105
3.No opinion 4 4.210
4.Agree 68 71.579
5.Strongly Agree 20 21.054
TOTAL 95 100
GRAPH:
111
INTERPRETATION:
According to the above table, 71.5% of employee’s votes as agree, 21% of employee’s votes as strongly agree that they are totally satisfied with all benefits that the company is providing to them. Overall, most of the employees feel that they are very much satisfied by the company.
15. PERSONAL OPINIONS
(A) Will employees refer others who are seeking employment to company?
ATTRIBUTES NUMBER OF RESPONDENTS
PERCENTAGES
1. Yes 76 80
2. No 19 20
TOTAL 95 100
GRAPH:
112

INTERPRETATION:
According to the above table, 80% of employees would refer others who are seeking employment into this company.
15(B) Employees feel good about their continued employment with company.
ATTRIBUTES NUMBER OF RESPONDENTS
PERCENTAGES
1. Yes 80 84.210
2. No 15 15.790
TOTAL 95 100
GRAPH:
113
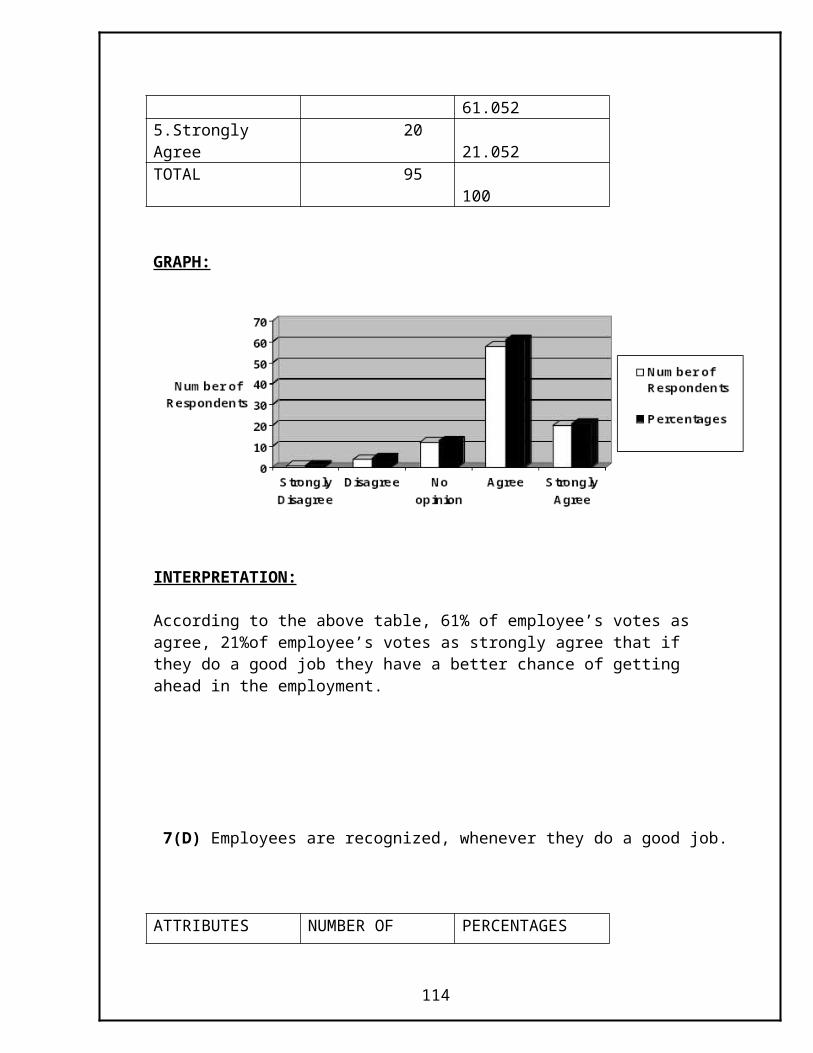
INTERPRETATION:
According to the above table, 84.2% of employee’s feel good about their continued employment with the company.
15(C) On the scale of excellence to poor, how would employees rate their overall employment with company?
ATTRIBUTES NUMBER OF RESPONDENTS
PERCENTAGES
1. Excellent 30 31.582
2. Good 50 52.630
3. Average 13 13.684
4. Poor 2 2.105
TOTAL 95 100
114
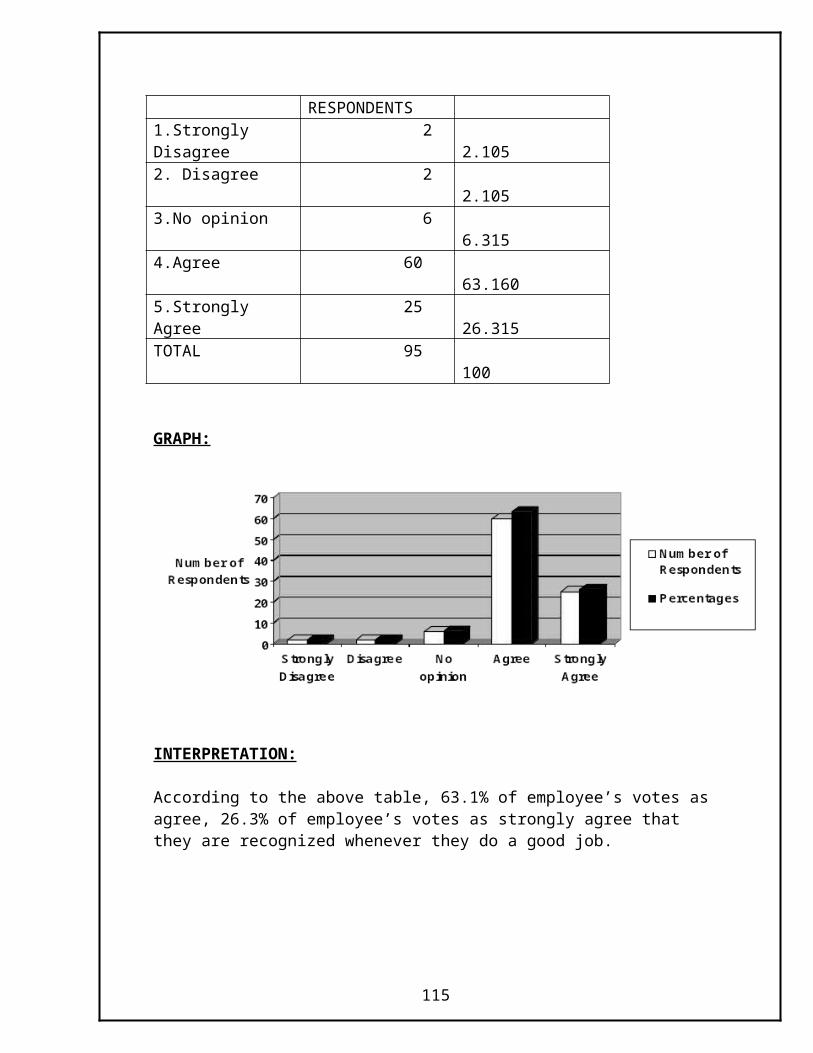
GRAPH:
INTERPRETATION:
According to the above table, 52.6% of employee’s votes as good and 31.5% of employees votes as excellent. It denotes that the employees are very much satisfied by the company.
FINDINGS
The important findings known by studying HR Audit are:
1. There is a nice way of communication between the manager and employees which determines an effective relationship between them
2. The organization is taking care of their employees by providing essential training which results in their development
3. The organization is providing enough job promotion activities which results in progress of employees.
4. The organization has enough care about their customers to serve them in an innovate way, which determines that their work policies or well developed and organized.
115
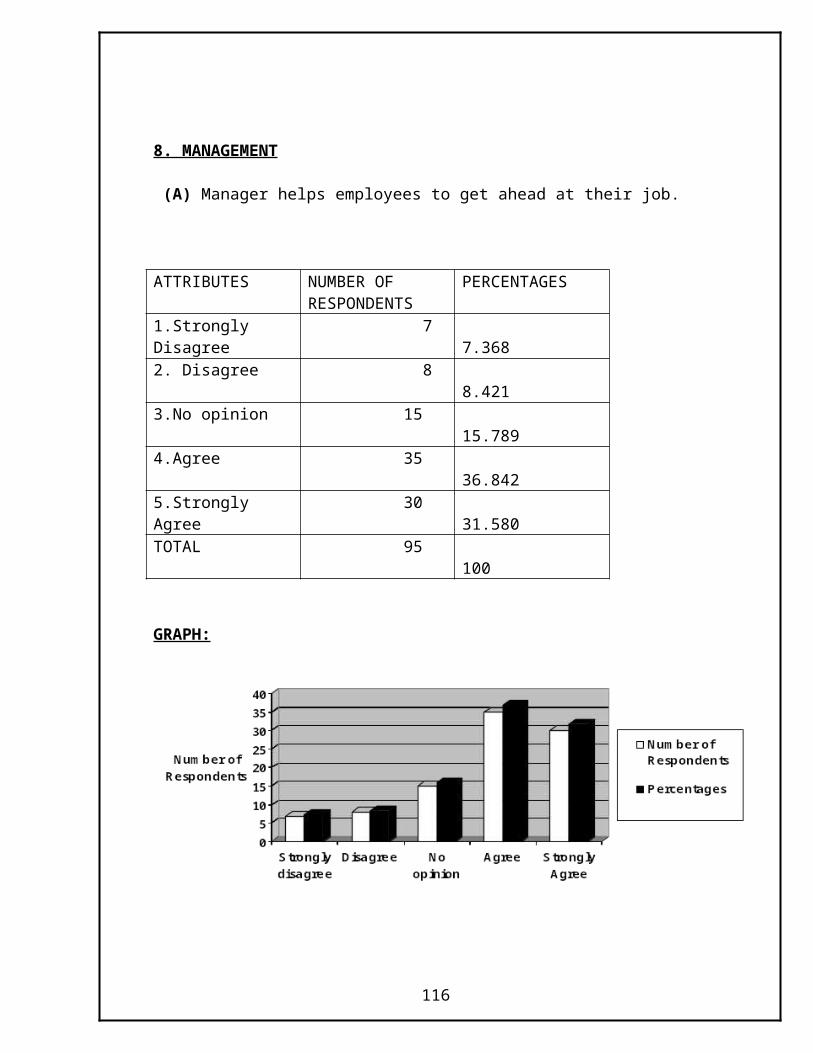
5. The organization is recognizing the employees work by making appraisals which shows that hard work is usually rewarded, when ever employees does a good job
6. The working environment of the company is good, where the employees share their work and they focuses on finding the solution to the problem rather than finding someone to blame. It shows that the morale is high and they find ways to improve their performance.
7. Employees have enough cooperation to get their work done and they respect each other. It shows that there is equality among the employees working in the organization
8. Employees feel that they have job security and they prefer others to seek employment in the organization
9. The organization is providing all necessary benefits to the employees and they
feel that the benefits are reasonable
10. Most of the employees feel that they are very much satisfied to work for this organization.
SUGGESTIONS
It is recommended that the organization must provide clear-cut or in detailed information about it to the employees. Employees should aware about the organization if once they entered in it.
The organization should focus on the employees who are incompetent in the team to make them competent which could be very much useful for the organization in the future.
Few of the employees responded that they need some more benefits. So it is suggested that all the employees should be educated about the remuneration paid to them is as per the performance and the seniority.
The company should put more emphasis on career development programs and constantly should conduct counseling programs.
The organization should focus on the employee’s working environment in order to work more freely.
116
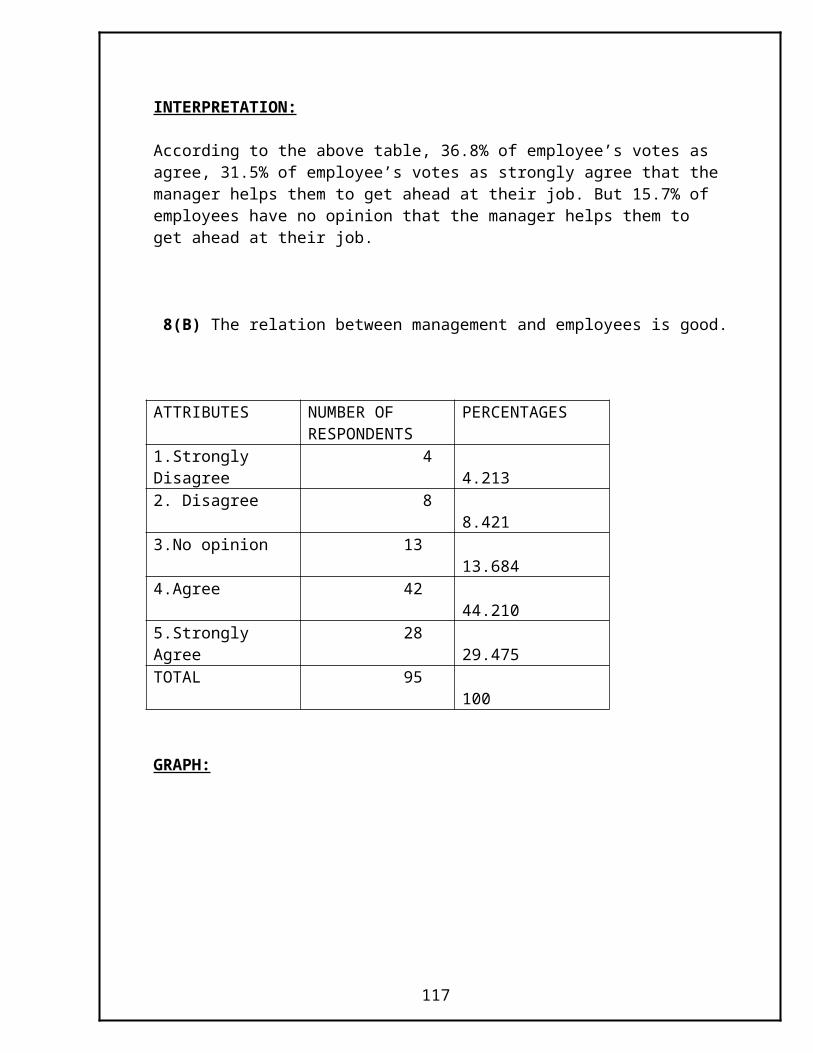
These are few suggestions where employees need some change in their working environment.
CONCLUSIONS
According to the opinions of the employees we know that they are very much satisfied and need few minor changes in their working environment in the organization. Most of the employees are satisfied and the organization should take necessary actions to increase their employee’s satisfaction levels which results in their growth.
QUESTIONNAIRE
1. COMMUNICATION
S.no Questions Strongly Disagree
Disagree No opinion
Agree Strongly Agree
A) I generally feel informed about changes that affect me within (company)
B) I usually know in plenty of time when important things happen.
117

C) I can see the link between my work and (company) objectives.
D) Managers communicate clear objectives for the company to achieve
2. SATISFACTION
S.no Questions Strongly Disagree Disagree No opinion Agree Strongly Agree
A) Considering everything, I am satisfied at (Company)
B) I find my work challenging
C) I like the kind of work I do
D) My working conditions are good.
3. TRAINING
S.no Questions Strongly Disagree
Disagree No opinion
Agree Strongly Agree
A) I get the training I need to do my job well.
B) I am aware of available training and development activities.
C) I am given a real opportunity to improve my skills in this company
118
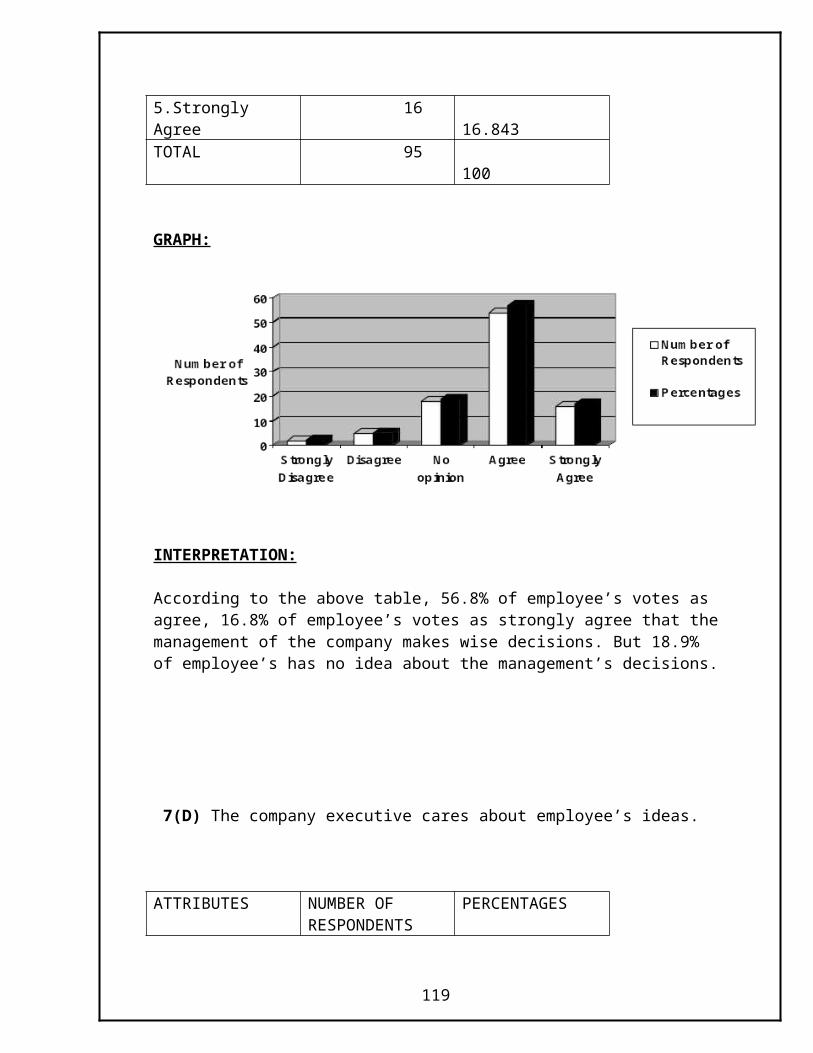
D) My training meets my needs for my current job
4. CAREER
S.no Questions Strongly Disagree Disagree No opinion
Agree Strongly Agree
A) I believe there are a variety of ways for me to develop my career at (Company)
B) Job promotions within the company are fair and reasonable.
C) I am aware of promotion opportunities within (company)
D) I have the opportunity to progress within (Company)
5. COMPANY
S.no Questions Strongly Disagree
Disagree No opinion
Agree Strongly Agree
A) (Company) is innovative in developing new ways to serve our customers
B) (Company) ‘s image is that of a high quality company
C) (Company)’s performs its business operations to a high standard
119
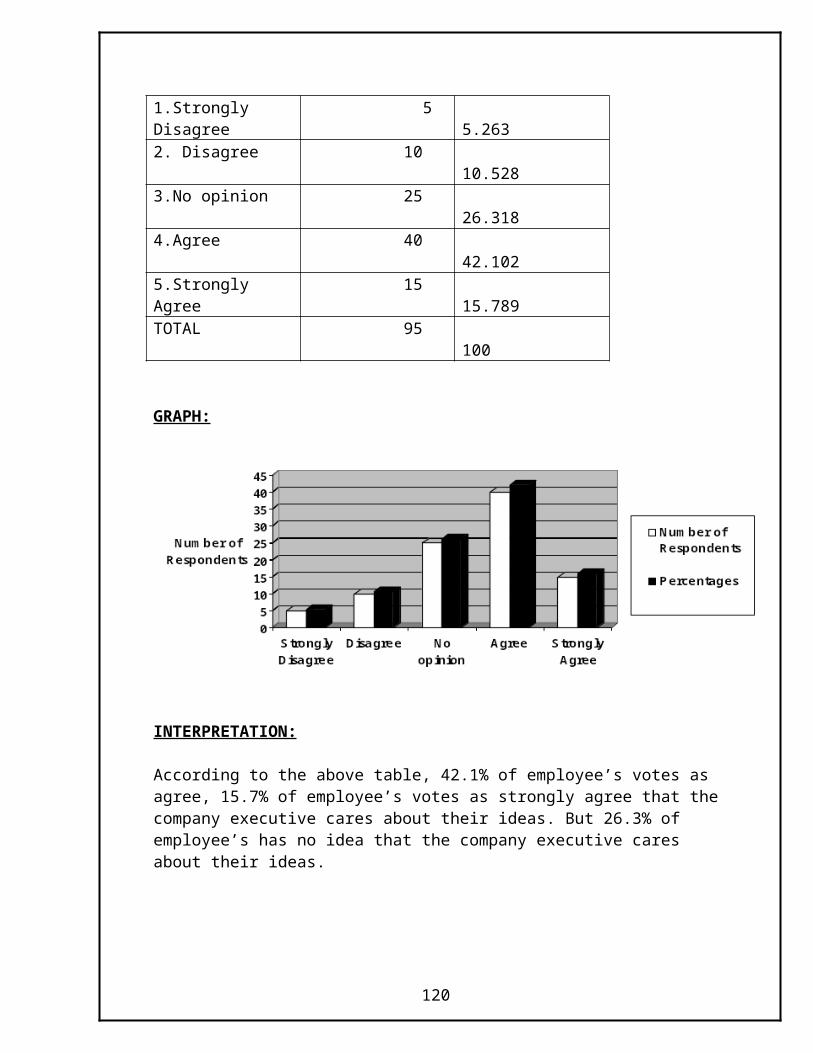
D) The work policies are well developed and organized
6. APPRAISALS
S.no Questions Strongly Disagree Disagree No opinion
Agree Strongly Agree
A) My manager holds me accountable for the work that I do
B) My manager provides me with adequate feedback
C) I have clear measures for each of my objectives
D) I know what is expected of me in my job
7. RECOGNITION
S.no Questions Strongly Disagree
Disagree No opinion
Agree Strongly Agree
A) Hard work is usually rewarded at my company
B) I receive enough recognition for work that I do
C) If I do a good job I have a better chance of getting ahead
120
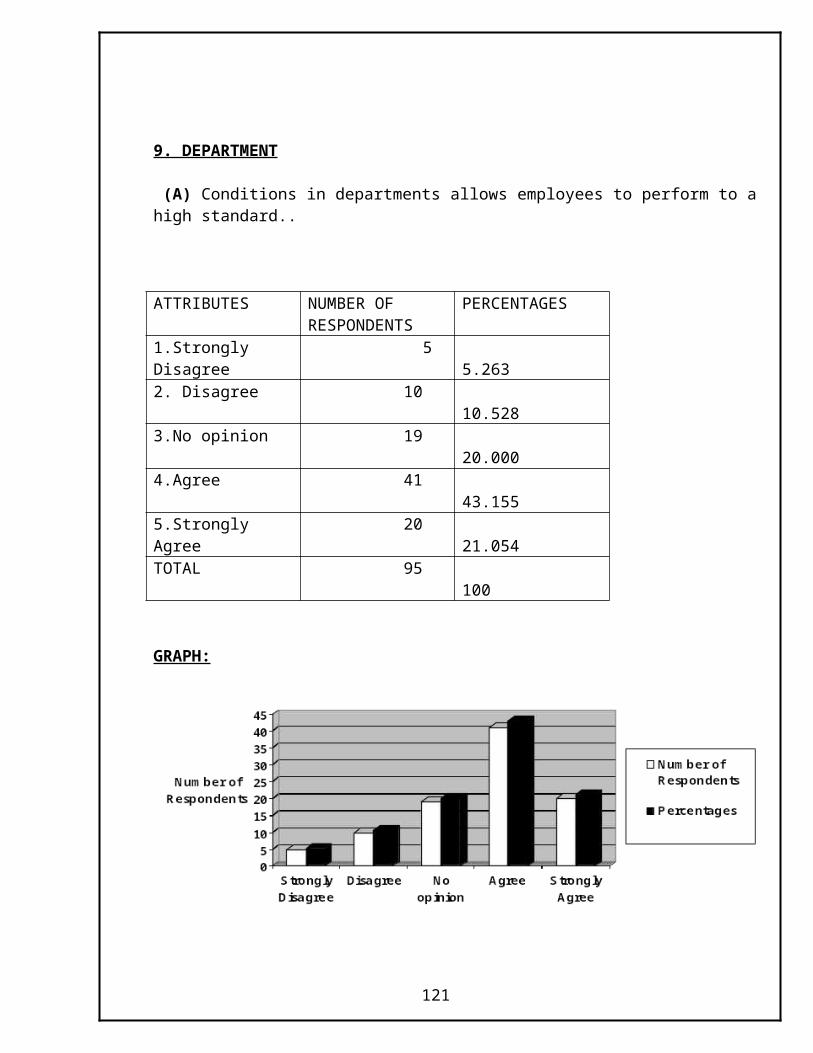
D) I am recognized whenever I do a good job.
8. MANAGEMENT
S.no Questions Strongly Disagree Disagree No opinion
Agree
Strongly Agree
A) My manager helps me to get ahead at my job.
B) The relationship between management and employees is good
C) Management of my company makes wise decisions
D) The company executive cares about my ideas
9. DEPARTMENT
S.no Questions Strongly Disagree
Disagree No opinion
Agree Strongly Agree
A) Conditions in my department allow me to perform to a high standard.
B) My team focuses on fixing the problem rather than finding someone to blame
C) My team looks for ways to change processes to improve performance.
121
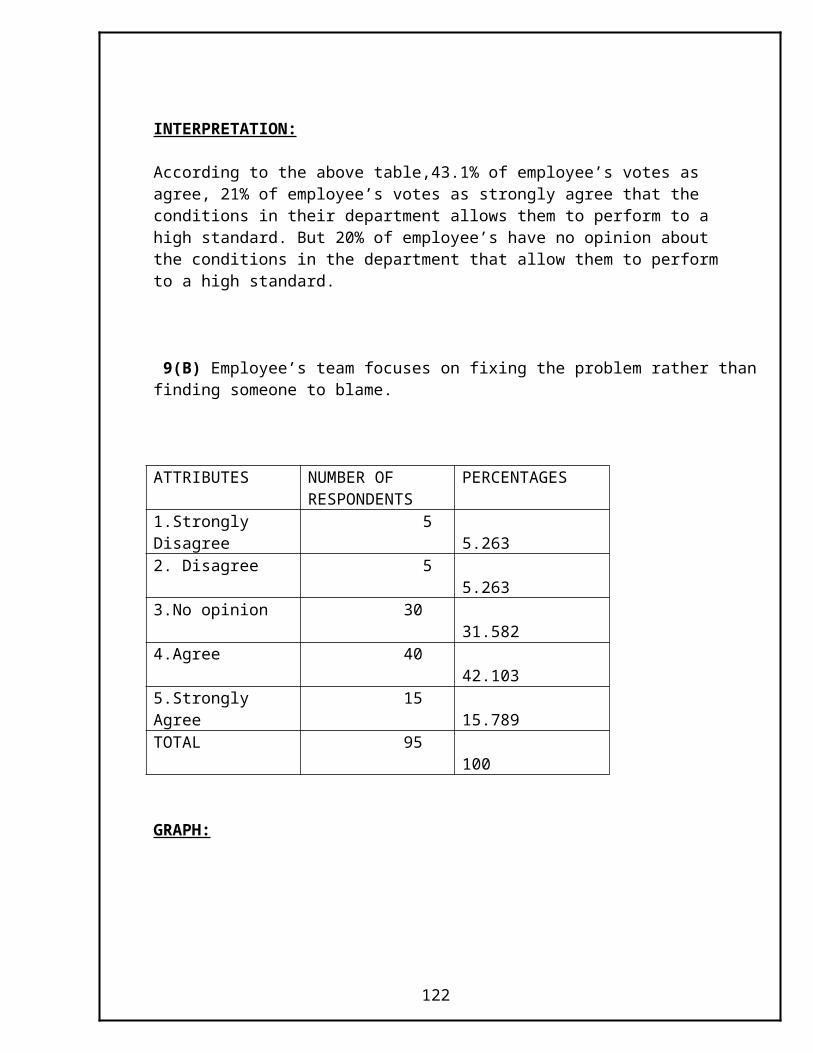
D) The morale in my department is generally high
10. TEAMWORK S.no Questions Strongly Disagree Disagree No
opinionAgree
Strongly Agree
A) . I believe that all the divisions in the company work together to achieve a common goal.
B) The people I work with cooperate to get the work done
C) There is a spirit of we’re all in this together within (Company)
D) There is cooperation among team members.
11. RESPECT
S.no Questions Strongly Disagree
Disagree No opinion
Agree Strongly Agree
A) I feel I am valued at work
B) At (Company) my opinions count.
C) Employees in the company are treated with respect regardless of their job.
122
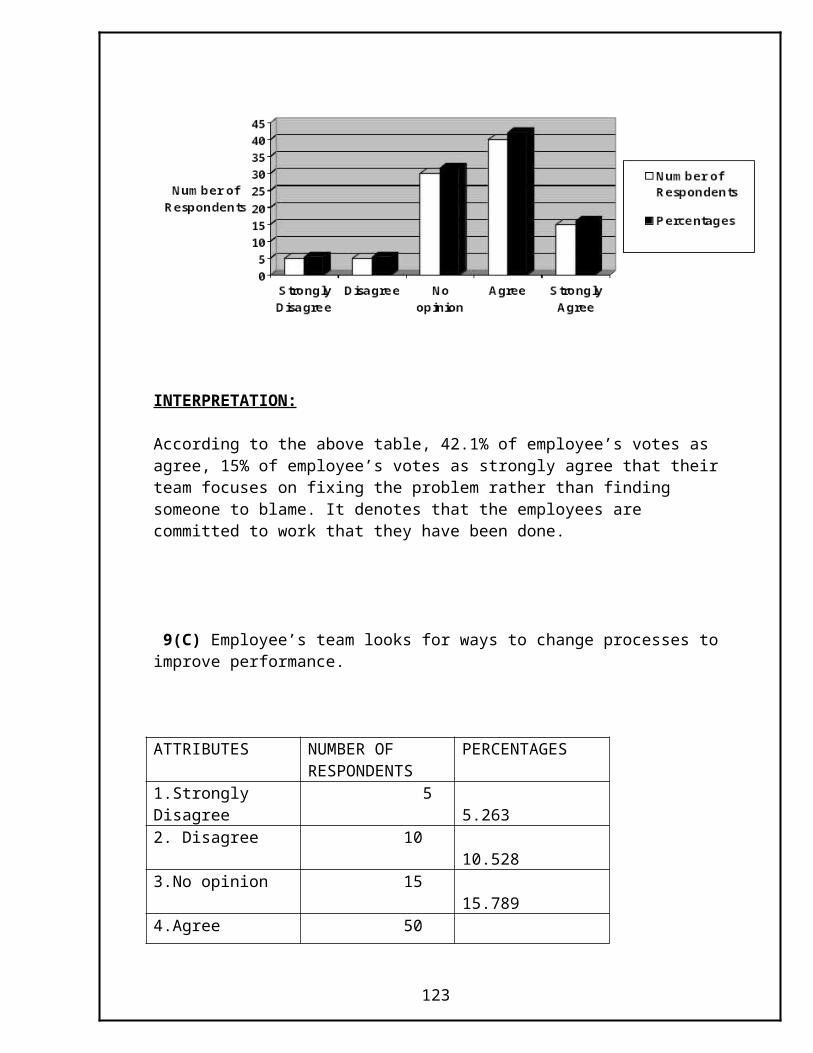
12. EQUALITY
S.no Questions Strongly Disagree Disagree No
opinionAgree Strong
ly Agree
A) . I believe that rewards are given fairly where I work
B) Every one a(Company) does their share of work
C) (Company) is committed to ensuring equal opportunities for all employees
D) I feel everyone is treated fairly in my department.
13. EMPLOYEE’S SALARY AND COMPENSATION BENEFITS
S.no
Questions Strongly Disagree
Disagree No opinion
Agree Strongly Agree
A) The company is providing with reasonable remuneration to you
B) Are you satisfied with salary that the company is offering?
C) Are you expecting more salary from the company?
123
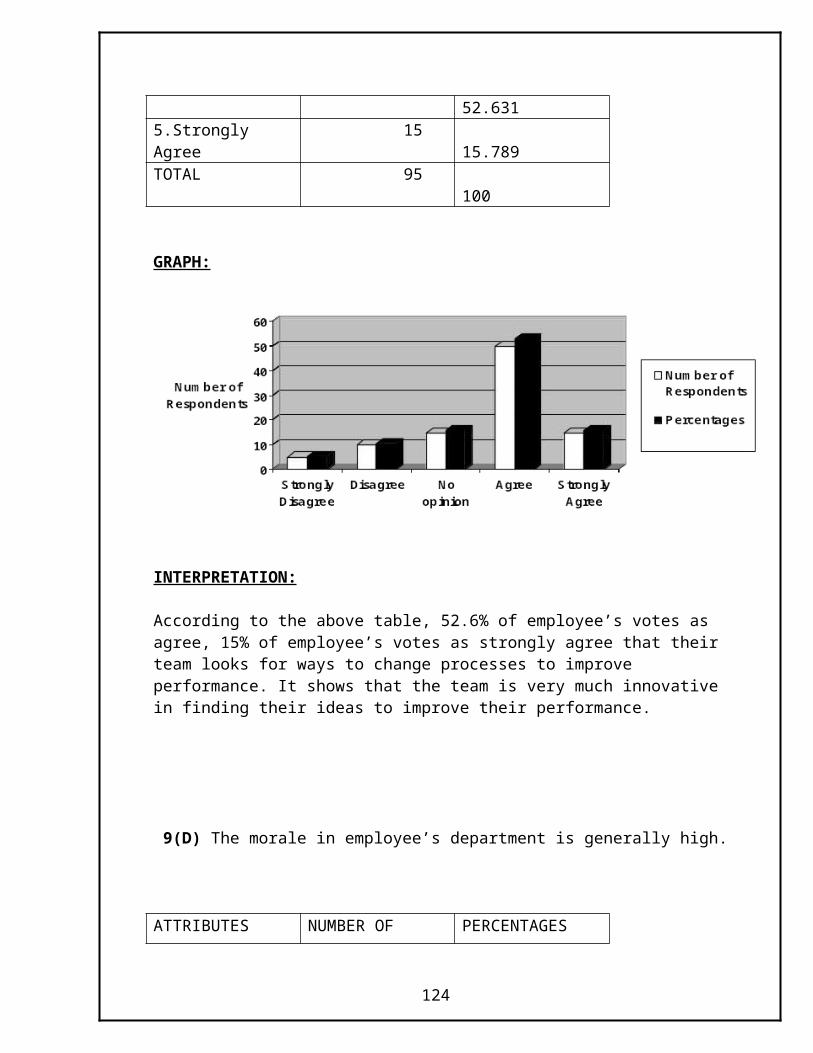
D) Is the salary is equivalent to your work u have been done?
E) The company is providing you with all necessary benefits
F) The company is providing with all compensation benefits if any damage occurs to you
G) The compensation benefits providing by the company are reasonable
H) The company provides any monetary benefits in case of emergency to you
I) The company provides all benefits at correct time without any delay
J) You are totally satisfied with all benefits that the company is providing.
14. SECURITY
S.no Questions Strongly Disagree
Disagree No opinion
Agree Strongly Agree
A) I feel free to express my opinions without worrying about negative actions/responses
B) I feel I have job security
124
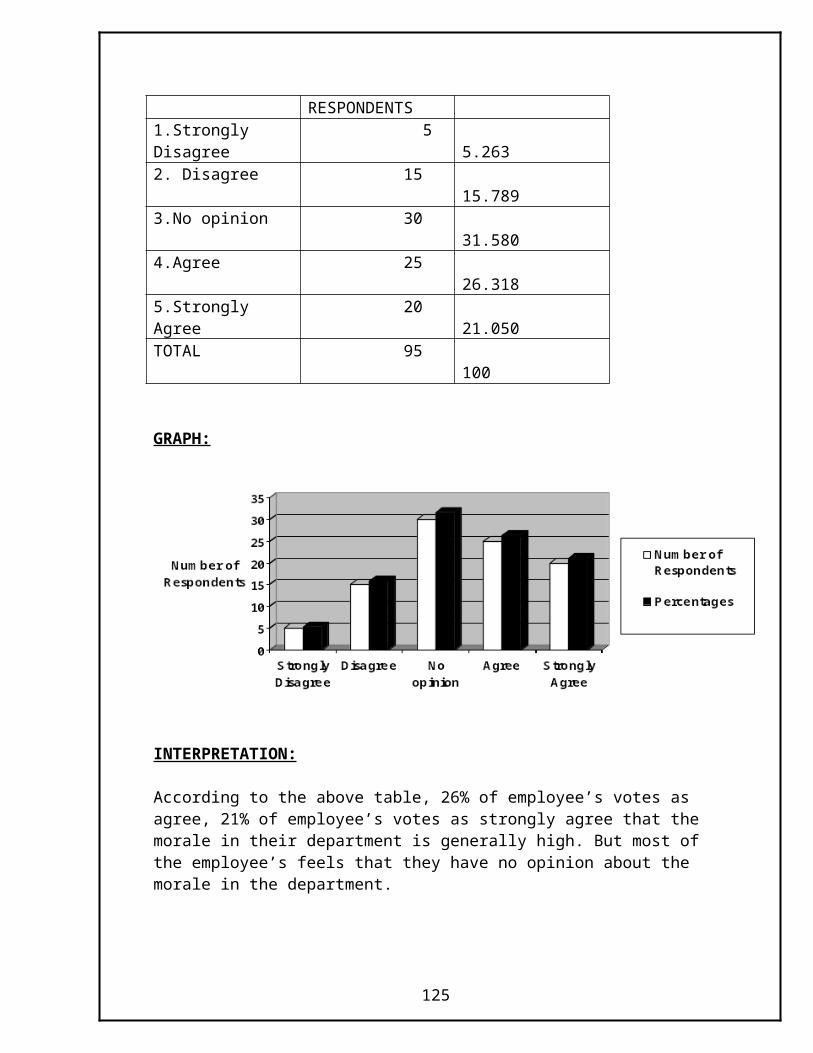
15. PERSONAL OPINIONS
S.no Questions YES NO
A) Would you refer others who are seeking employment to (Company)
B) I feel good about my continued employment with (Company)
S.no Question Excellent Good Average Poor
C) How would you rate your overall employment with the Company
Books Authors
Personal and Human resource management - P.Subbarao.
Human resource management - Ivancevich.
Research methodology & Statistical tools - P.Narayana reddy
& GVRK Acharyulu
125