Embed Size (px)
Citation preview

HPE Security ArcSight ESMSoftware Version: 7.0
ESM 101
April 20, 2018

Legal Notices
WarrantyThe only warranties for Hewlett Packard Enterprise products and services are set forth in the express warranty statementsaccompanying such products and services. Nothing herein should be construed as constituting an additional warranty.Hewlett Packard Enterprise shall not be liable for technical or editorial errors or omissions contained herein.
The information contained herein is subject to change without notice.
The network information used in the examples in this document (including IP addresses and hostnames) is for illustrationpurposes only.
HPE Security ArcSight products are highly flexible and function as you configure them. The accessibility, integrity, andconfidentiality of your data is your responsibility. Implement a comprehensive security strategy and follow good securitypractices.
This document is confidential.
Restricted Rights LegendConfidential computer software. Valid license from Hewlett Packard Enterprise required for possession, use or copying.Consistent with FAR 12.211 and 12.212, Commercial Computer Software, Computer Software Documentation, and TechnicalData for Commercial Items are licensed to the U.S. Government under vendor's standard commercial license.
Copyright Notice© Copyright 2018 Hewlett Packard Enterprise Development, LP
Follow this link to see a complete statement of copyrights and acknowledgements:https://community.softwaregrp.com/t5/Discussions/Third-Party-Copyright-Notices-and-License-Terms/td-p/1589228
Support
Phone A list of phone numbers is available on the Technical SupportPage: https://softwaresupport.softwaregrp.com/support-contact-information
Support Web Site https://softwaresupport.softwaregrp.com/
ArcSight Product Documentation https://community.softwaregrp.com/t5/ArcSight-Product-Documentation/ct-p/productdocs
Contact Information
ESM 101
HPE ESM 7.0 Page 2 of 162
Contents
Chapter 1: About ArcSight ESM 10
User Roles 10
User Paths Through ESM 13
Chapter 2: ArcSight Enterprise Security Management 15
ESM Enables Situational Awareness 15
ESM Anatomy 17
SmartConnectors 18ArcSight Management Center 18Supported Data Sources 19FlexConnector 21Forwarding Connector 21
ArcSight Manager 21
CORR-EngineStorage 21
User Interfaces 22The ArcSight Command Center 22The ArcSight Console 22
Use Cases 22
Interactive Discovery 23
Pattern Discovery 24
ESM on an Appliance 24
Logger 25
ArcSight Solutions 25
About Resources 25
Chapter 3: Life Cycle of an Event Through ESM 28
Chapter 4: Data Collection and Event Processing 30
Collect Event Data 30
Normalize Event Data 31Event Severity 32
HPE ESM 7.0 Page 3 of 162
Apply Event Categories 33Event Categorization Utility 34
Look up Customer and Zone in Network Model 35
Filter and Aggregate Events 36Configure SmartConnectors to Filter Out Events 36Configure SmartConnector to Aggregate Events 36Configure SmartConnector to Execute Commands 37
Managing SmartConnector Configurations 38
Chapter 5: Priority Evaluation and Network Model Lookup 39
Look Up the Network Model 39
Look Up the Actor Model 40
Priority Rating 40Evaluate the Priority Formula 41
Write Event to CORR-Engine Storage 43
Chapter 6: Workflow 44
Annotations 45
Cases 46
Stages 46
Users and User Groups 48
Notifications 48How Notifications Work 49Notification Groups 49Escalation Levels 50Notification Destinations 50Notification Acknowledgements 50
Knowledge Base 51
Reference Pages 51References Pages for Resource Groups 51Reference Pages for Events 51Reference Pages for Vulnerabilities 52
Chapter 7: Correlation Evaluation 53
Correlation Overview 53
Filters 54
ESM 101
HPE ESM 7.0 Page 4 of 162
Named Conditions (Filters Resource) 55Unnamed Conditions 55Filters in Active Channels 55Filter Debugging 56
Rules 56How Rules Work 57Standard Rules 57
Joins 57Lightweight and Pre-persistence Rules 58Rule Aggregation 58How Rules are Evaluated 59
Rule Actions and Thresholds 59Correlation Events Triggered by Rules 60
How Rules Use Active Lists 61How Active Lists Work 61
How Rules Use Session Lists 63Testing Standard Rules in a Rules Channel 64Deploying Standard Rules in Real-Time Rules 64
Data Monitors 66Event-Based Data Monitors 66Correlation Data Monitors 68Non-Event Based Data Monitors 68
How Correlation Uses Local and Global Variables 69
Velocity Templates 70Velocity Application Points 70Examples of Velocity Expressions to Retrieve Values 71
Event Types 72Raw Events 73Event Types in the Event Type Data Field 73Other Types of Normalized Events 73
Filtering Events 74Monitoring ESM’s Audit Events 74
Distributed Correlation 75Distributed Correlation Services in a Cluster 76Distributed Correlation and ESM Processing 77Distributed Correlation and Fault Tolerance 77Distributed Correlation Cluster Monitoring - Dashboard 78
Chapter 8: Monitoring and Investigation 79
ESM 101
HPE ESM 7.0 Page 5 of 162
Active Channels 79Live Channels 81Rules Channels 81Resource Channels 82
Field Sets 83Sortable Field Sets 83Fields & Global Variables 83
Dashboards 83Event Graph Data Monitors 84Event Graphs as a Monitoring Tool 85Event Graphs as an Investigation and Analysis Tool 86
Custom View Dashboards 87
Query Viewers 88Query Viewers as an Investigation and Analysis Tool 89
Saved Searches and Search Filters 91
Distributed Searches Among Peers 91
Integration Commands 92Third-Party Integration Scenarios 92How Integration Commands Work 93Supported Command Types 94How to Use Available Commands 94
Using Integration Commands During Monitoring and Investigation 95Using Integration Commands that Leverage the Network Model 95
Chapter 9: Reporting and Incident Analysis 96
Reports 96Queries 97Trends 98
Snapshot Trend 98Interval Trend 99How Trends Work 99
Report Templates 100Reports 101
Archived Reports 102Delta Reports 102Focused Reports 102
Job Scheduler 103Scheduled Jobs Manager 103
ESM 101
HPE ESM 7.0 Page 6 of 162
ArcSight Pattern Discovery 104Pattern Discovery Output: Snapshots and Patterns 105
Chapter 10: CORR-Engine 107
CORR-Engine Event Storage 107Active Retention Period 108Archives 109Time- and Space-Based Storage Retention 109
System Storage 110
CORR-Engine Storage Management 110
Chapter 11: The Event Schema 111
Event Data Fields 111Event Field Groups 111
Devices and Assets in the Event Schema 114Devices in the Event Schema 115Assets in the Event Schema 115
Alternate Interface in the Event Schema 116
Devices and Connectors in a Network 117Source/Destination, Attacker/Target: An External Attack 118Source/Destination, Attacker/Target: A Trojan Attack 118Destination/Target Only: A SysLog Reboot Report 119Device Chain: Final Device and Original Agent 120
Chapter 12: The Network Model 121
Network Model 121Assets 123
Auto-Created Assets 124Auto-Created Assets for ESM Components 125Devices Discovered by a Vulnerability Scanner 125Devices Reporting Through SmartConnectors 126Managing Assets in Asset Channels 126
Asset Ranges 127Zones 127
Dynamic and Static Zones 129Networks 130Customers 131
Network Modeling Resources Summary 132
ESM 101
HPE ESM 7.0 Page 7 of 162

Ways to Populate the Network Model 133ArcSight Console-Based Methods 134
Individually Using Network Modeling Resources 134In a Batch Using the Network Modeling Wizard 135How the Network Model Wizard Works 135
SmartConnector-Based Methods 136In a Batch Using the Asset Import FlexConnector 137Automatically From a Vulnerability Scanner Report 137
ArcSight-Assisted Methods 138As an Archive File From an Existing Configuration Database 138
Using Resource Graphs to Verify the Network Model 139
Asset Model 139Vulnerabilities 140
How Vulnerability Scans Populate and Update the Network Model 140Reference Pages for Vulnerabilities 142Refer to External Databases Using External IDs 142Calculating Event Priority 142
Locations 143Asset Categories 143
Asset Categories Assigned to Assets, Asset Ranges, and Asset Groups 144Asset Categories Assigned to Zones 145Create Your Own Asset Categories 146
Chapter 13: The Actor Model 147
How the Actors Feature Works 148
Actor Resource Framework 148
Actor Global Variables: Identifying Actors From Events 149
Actor Channels: Navigating Thousands of Actors 150
Category Models: Analyzing Actor Relationships 150
Actor Model Import Connector 150
Chapter 14: Managing Resources and Standard Content 152
ESM Resources 152File Resource 153The ArcSight Archive Utility 153Resource Graphs 153Uniform Resource Identifiers (URIs) and Resource Groups 154Resource IDs 156
ESM 101
HPE ESM 7.0 Page 8 of 162
Finding Resources 157
Packages 157Package States: Imported and Installed 158Package View 159
Content Management 159
Access Control Lists (ACLs) 159User Access Controls 160Resource Access Controls 160ACL Editor 160
Standard Content 161
Send Documentation Feedback 162
ESM 101
HPE ESM 7.0 Page 9 of 162

Chapter 1: About ArcSight ESMArcSight Enterprise Security Management (ESM) is a comprehensive software solution that combinestraditional security event monitoring with network intelligence, context correlation, anomaly detection,historical analysis tools, and automated remediation. ESM is a multi-level solution that provides tools fornetwork security analysts, system administrators, and business users.
ESM and ESM Express are the same software. ESM Express is a different license model that typicallybundles the ESM software with an appliance and a different set of licensed features. Whenever adocument refers to ESM, it means to include ESM Express, unless it specifically says otherwise. However,available licenses may change between releases, so it might not always be possible to identify a featurethat is or is not included in ESM Express.
ESM includes the Correlation Optimized Retention and Retrieval (CORR) Engine, a data storage andretrieval framework that receives and processes events at high rates, and performs high-speed searches.
This book introduces the underlying concepts behind how ESM works, the unique features of theCORR-Engine, and provides a road map to the tools available in ESM depending on your role in securityoperations. After reading this book, you will have a clear understanding of:
l How ESM works in the context of your network
l ESM functions and features and how they are used at various points in the event life cycle
l Which users in your organization would use what ESM tools
l Key terms and concepts
User RolesImplementing an ESM system within a security operations center takes planning. User roles helpdecision makers determine what skills and experience are needed to ensure a successful deployment.
ESM provides User Groups and Access Control Lists (ACLs) to manage user access to certain functionsand resources. Default User Groups and ACLs provide access control to certain resources uponinstallation (for more detail, see "Users and User Groups" on page 48). You can also create a custom usergroup to apply to a user role that you define, based on the needs of your security operations center. Formore about access privileges, see "Access Control Lists (ACLs)" on page 159.
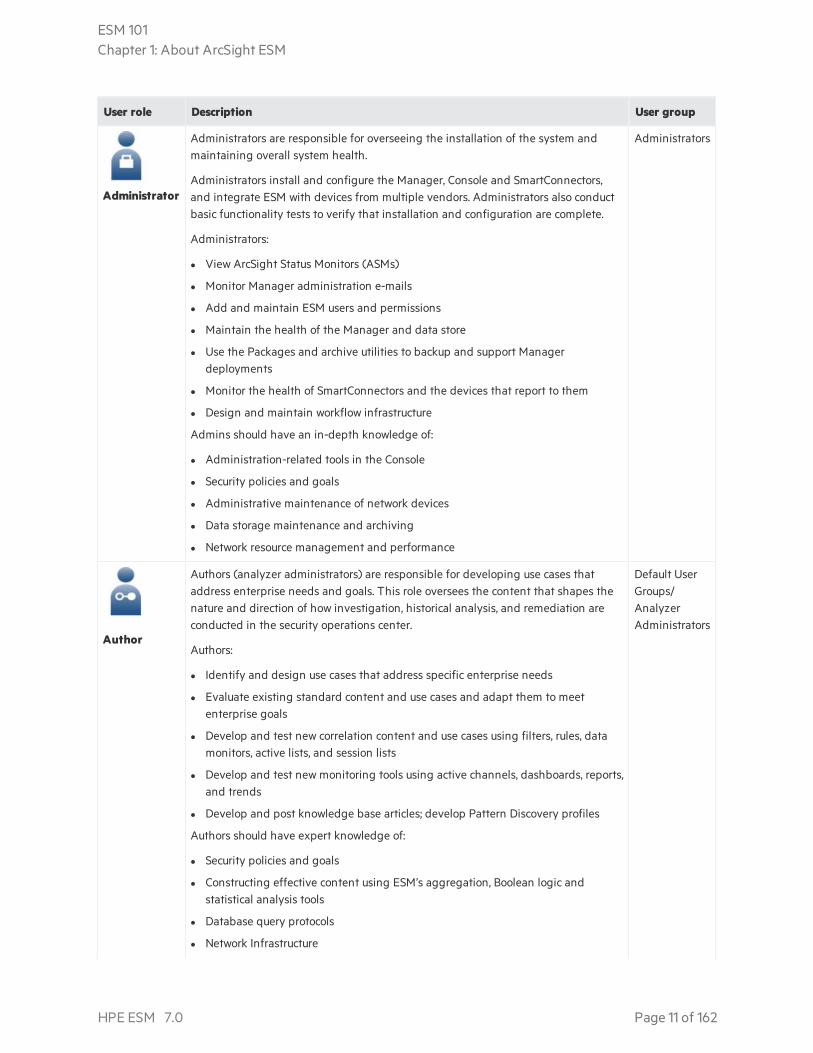
The following pages provide a detailed description the general user roles and the default User Groupthey correspond to.
HPE ESM 7.0 Page 10 of 162
User role Description User group
Administrator
Administrators are responsible for overseeing the installation of the system andmaintaining overall system health.
Administrators install and configure the Manager, Console and SmartConnectors,and integrate ESM with devices from multiple vendors. Administrators also conductbasic functionality tests to verify that installation and configuration are complete.
Administrators:
l View ArcSight Status Monitors (ASMs)
l Monitor Manager administration e-mails
l Add and maintain ESM users and permissions
l Maintain the health of the Manager and data store
l Use the Packages and archive utilities to backup and support Managerdeployments
l Monitor the health of SmartConnectors and the devices that report to them
l Design and maintain workflow infrastructure
Admins should have an in-depth knowledge of:
l Administration-related tools in the Console
l Security policies and goals
l Administrative maintenance of network devices
l Data storage maintenance and archiving
l Network resource management and performance
Administrators
Author
Authors (analyzer administrators) are responsible for developing use cases thataddress enterprise needs and goals. This role oversees the content that shapes thenature and direction of how investigation, historical analysis, and remediation areconducted in the security operations center.
Authors:
l Identify and design use cases that address specific enterprise needs
l Evaluate existing standard content and use cases and adapt them to meetenterprise goals
l Develop and test new correlation content and use cases using filters, rules, datamonitors, active lists, and session lists
l Develop and test new monitoring tools using active channels, dashboards, reports,and trends
l Develop and post knowledge base articles; develop Pattern Discovery profiles
Authors should have expert knowledge of:
l Security policies and goals
l Constructing effective content using ESM’s aggregation, Boolean logic andstatistical analysis tools
l Database query protocols
l Network Infrastructure
Default UserGroups/AnalyzerAdministrators
ESM 101Chapter 1: About ArcSight ESM
HPE ESM 7.0 Page 11 of 162
User role Description User group
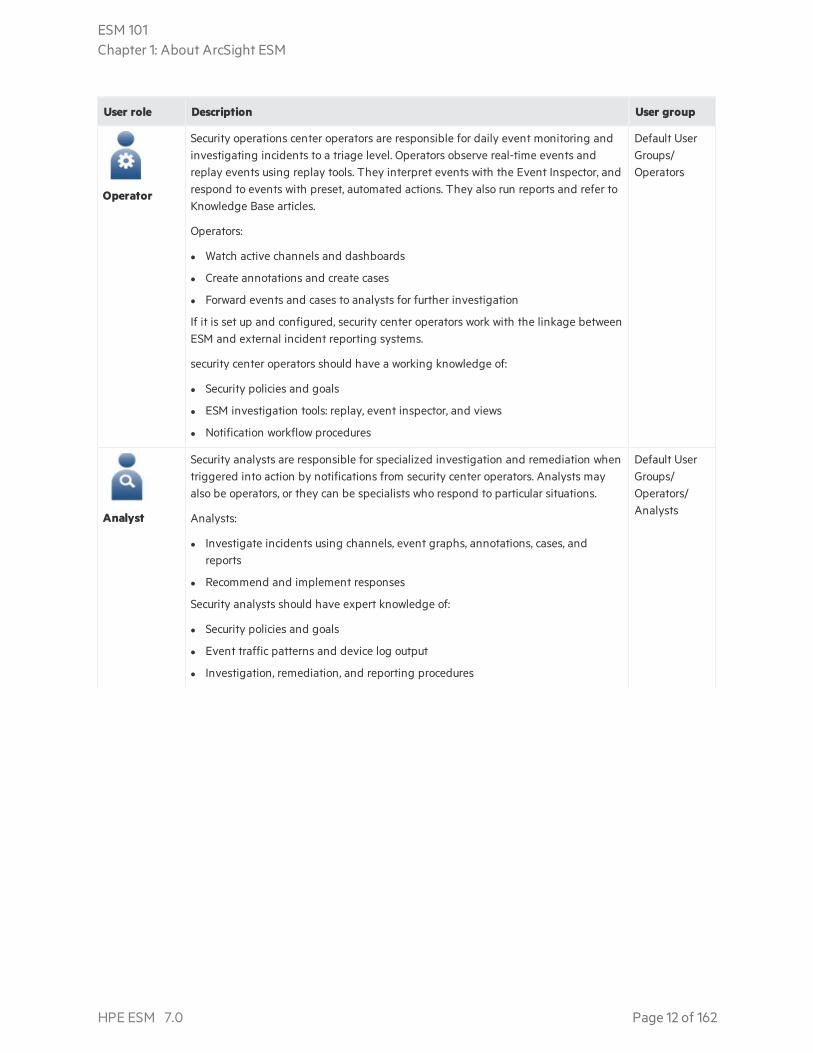
Operator
Security operations center operators are responsible for daily event monitoring andinvestigating incidents to a triage level. Operators observe real-time events andreplay events using replay tools. They interpret events with the Event Inspector, andrespond to events with preset, automated actions. They also run reports and refer toKnowledge Base articles.
Operators:
l Watch active channels and dashboards
l Create annotations and create cases
l Forward events and cases to analysts for further investigation
If it is set up and configured, security center operators work with the linkage betweenESM and external incident reporting systems.
security center operators should have a working knowledge of:
l Security policies and goals
l ESM investigation tools: replay, event inspector, and views
l Notification workflow procedures
Default UserGroups/Operators
Analyst
Security analysts are responsible for specialized investigation and remediation whentriggered into action by notifications from security center operators. Analysts mayalso be operators, or they can be specialists who respond to particular situations.
Analysts:
l Investigate incidents using channels, event graphs, annotations, cases, andreports
l Recommend and implement responses
Security analysts should have expert knowledge of:
l Security policies and goals
l Event traffic patterns and device log output
l Investigation, remediation, and reporting procedures
Default UserGroups/Operators/Analysts
ESM 101Chapter 1: About ArcSight ESM
HPE ESM 7.0 Page 12 of 162
User role Description User group
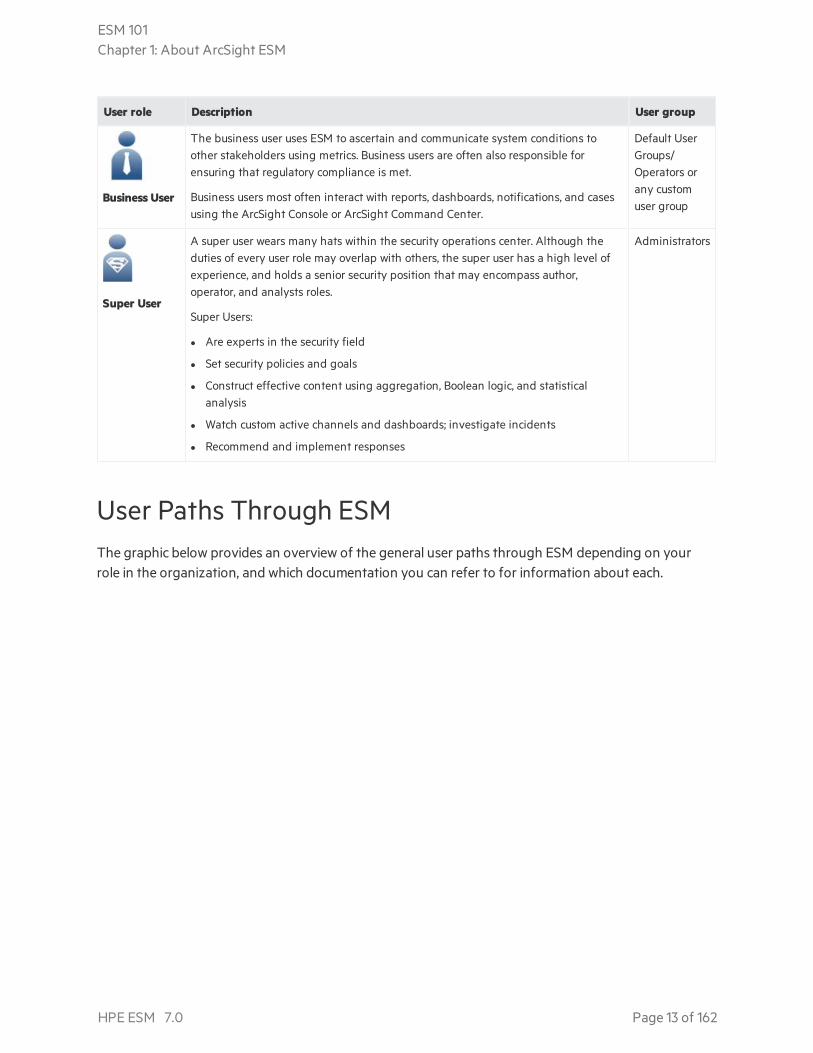
Business User
The business user uses ESM to ascertain and communicate system conditions toother stakeholders using metrics. Business users are often also responsible forensuring that regulatory compliance is met.
Business users most often interact with reports, dashboards, notifications, and casesusing the ArcSight Console or ArcSight Command Center.
Default UserGroups/Operators orany customuser group
Super User
A super user wears many hats within the security operations center. Although theduties of every user role may overlap with others, the super user has a high level ofexperience, and holds a senior security position that may encompass author,operator, and analysts roles.
Super Users:
l Are experts in the security field
l Set security policies and goals
l Construct effective content using aggregation, Boolean logic, and statisticalanalysis
l Watch custom active channels and dashboards; investigate incidents
l Recommend and implement responses
Administrators
User Paths Through ESMThe graphic below provides an overview of the general user paths through ESM depending on yourrole in the organization, and which documentation you can refer to for information about each.
ESM 101Chapter 1: About ArcSight ESM
HPE ESM 7.0 Page 13 of 162
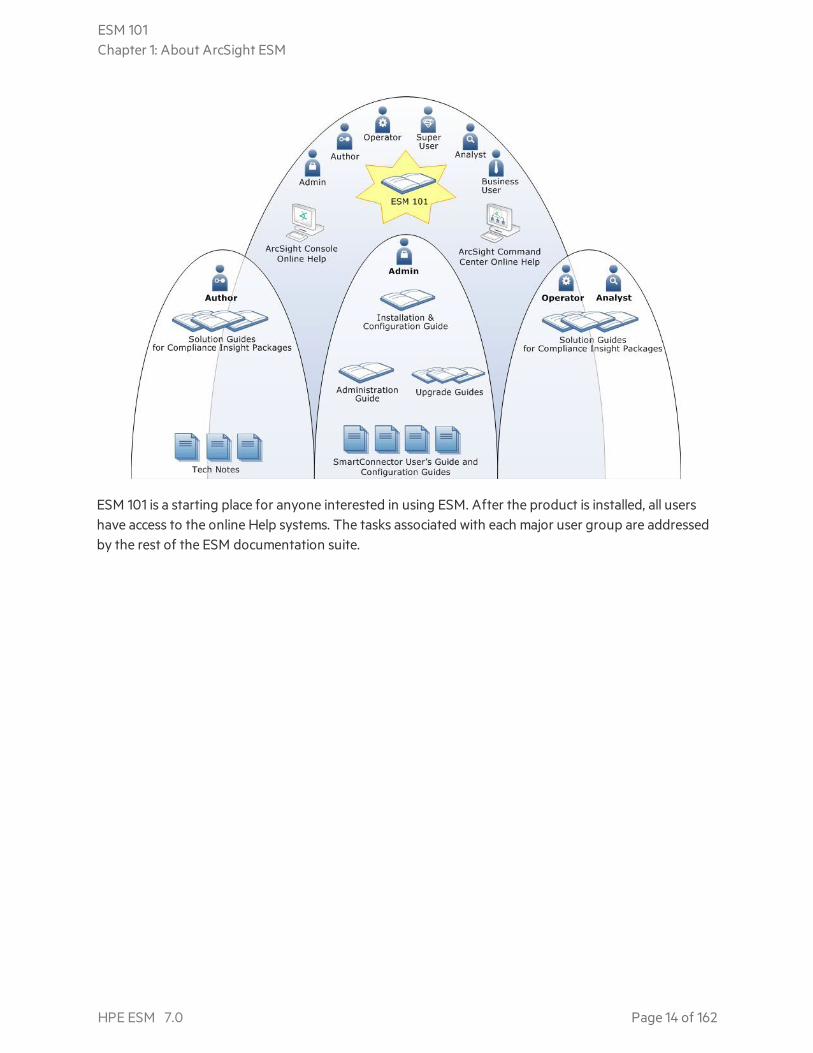
ESM 101 is a starting place for anyone interested in using ESM. After the product is installed, all usershave access to the online Help systems. The tasks associated with each major user group are addressedby the rest of the ESM documentation suite.
ESM 101Chapter 1: About ArcSight ESM
HPE ESM 7.0 Page 14 of 162
Chapter 2: ArcSight Enterprise SecurityManagementESM delivers comprehensive enterprise security management, advanced analysis and investigation, andoptions for remediation and expanded solutions, that are ready to configure and use right out of thebox.
ESM normalizes and aggregates data from devices across your enterprise network, provides tools foradvanced analysis and investigation, and offers options for automatic and workflow-managedremediation. ESM gives you a holistic view of the security status of all relevant IT systems, andintegrates security into your existing management processes and workflows.
• ESM Enables Situational Awareness 15• ESM Anatomy 17• SmartConnectors 18• ArcSight Manager 21• CORR-EngineStorage 21• User Interfaces 22• Use Cases 22• Interactive Discovery 23• Pattern Discovery 24• ESM on an Appliance 24• Logger 25• ArcSight Solutions 25• About Resources 25
ESM Enables Situational AwarenessLike the security system at a major art museum, your network security operation must flawlessly protectobjects of vital importance to your organization. At the art museum, security operations teams monitor,analyze, and investigate a continuous feed of data, including surveillance video, card reader logs, andtightly calibrated climate controls.
One of the surveillance cameras detects a person testing a locked door. A card reader registers a log-infrom a janitor who only works one day a week. The humidity control in the priceless painting collectionwavered by a fraction of a percent. Are these isolated events, or part of a coordinated break-in attempt?
HPE ESM 7.0 Page 15 of 162
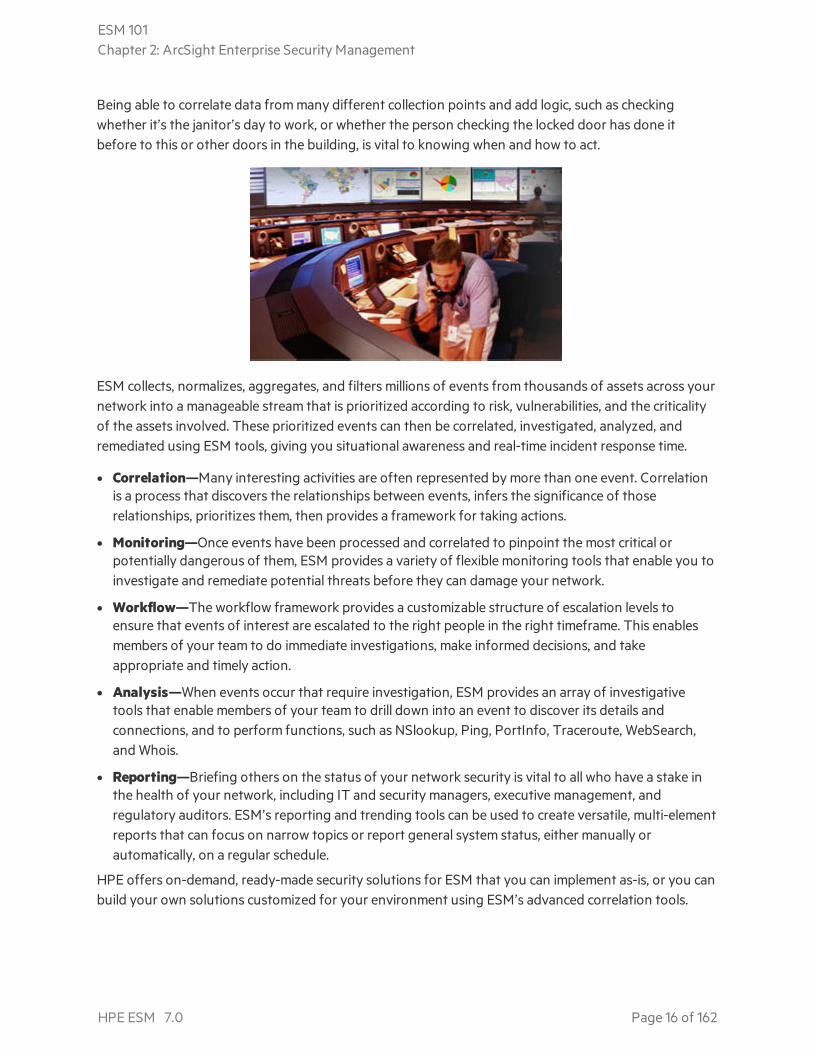
Being able to correlate data from many different collection points and add logic, such as checkingwhether it’s the janitor’s day to work, or whether the person checking the locked door has done itbefore to this or other doors in the building, is vital to knowing when and how to act.
ESM collects, normalizes, aggregates, and filters millions of events from thousands of assets across yournetwork into a manageable stream that is prioritized according to risk, vulnerabilities, and the criticalityof the assets involved. These prioritized events can then be correlated, investigated, analyzed, andremediated using ESM tools, giving you situational awareness and real-time incident response time.
l Correlation—Many interesting activities are often represented by more than one event. Correlationis a process that discovers the relationships between events, infers the significance of thoserelationships, prioritizes them, then provides a framework for taking actions.
l Monitoring—Once events have been processed and correlated to pinpoint the most critical orpotentially dangerous of them, ESM provides a variety of flexible monitoring tools that enable you toinvestigate and remediate potential threats before they can damage your network.
l Workflow—The workflow framework provides a customizable structure of escalation levels toensure that events of interest are escalated to the right people in the right timeframe. This enablesmembers of your team to do immediate investigations, make informed decisions, and takeappropriate and timely action.
l Analysis—When events occur that require investigation, ESM provides an array of investigativetools that enable members of your team to drill down into an event to discover its details andconnections, and to perform functions, such as NSlookup, Ping, PortInfo, Traceroute, WebSearch,and Whois.
l Reporting—Briefing others on the status of your network security is vital to all who have a stake inthe health of your network, including IT and security managers, executive management, andregulatory auditors. ESM’s reporting and trending tools can be used to create versatile, multi-elementreports that can focus on narrow topics or report general system status, either manually orautomatically, on a regular schedule.
HPE offers on-demand, ready-made security solutions for ESM that you can implement as-is, or you canbuild your own solutions customized for your environment using ESM’s advanced correlation tools.
ESM 101Chapter 2: ArcSight Enterprise Security Management
HPE ESM 7.0 Page 16 of 162
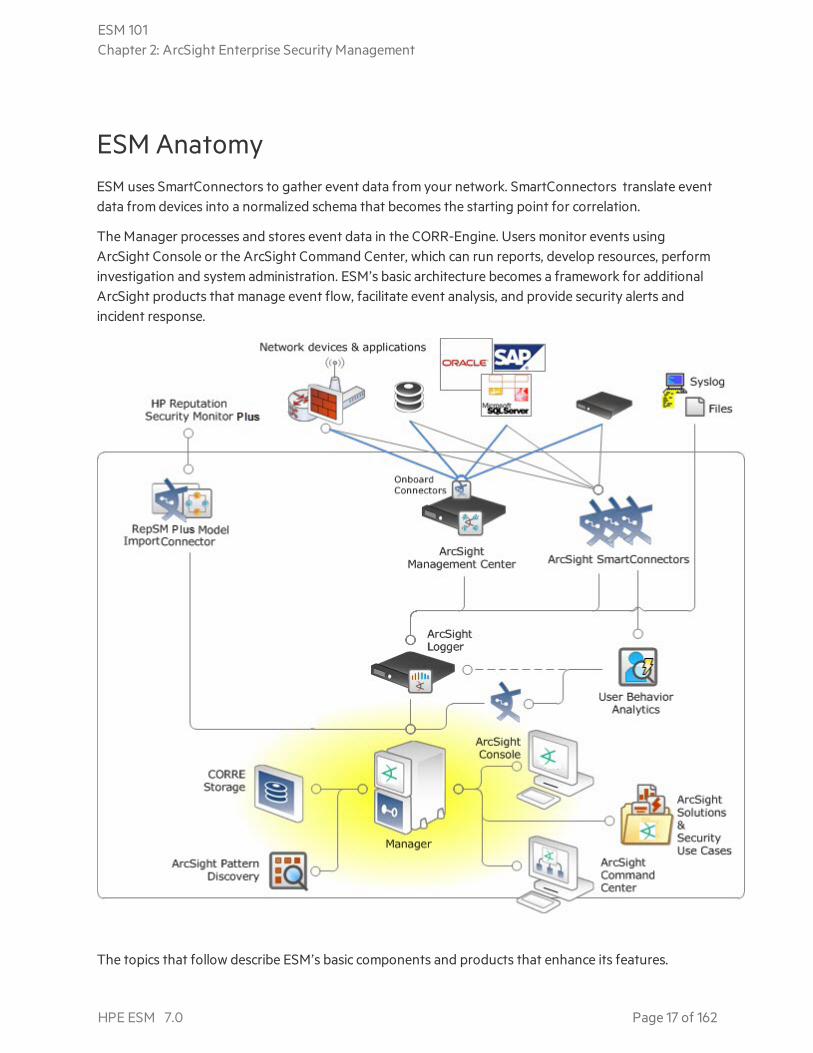
ESM AnatomyESM uses SmartConnectors to gather event data from your network. SmartConnectors translate eventdata from devices into a normalized schema that becomes the starting point for correlation.
The Manager processes and stores event data in the CORR-Engine. Users monitor events usingArcSight Console or the ArcSight Command Center, which can run reports, develop resources, performinvestigation and system administration. ESM’s basic architecture becomes a framework for additionalArcSight products that manage event flow, facilitate event analysis, and provide security alerts andincident response.
The topics that follow describe ESM’s basic components and products that enhance its features.
ESM 101Chapter 2: ArcSight Enterprise Security Management
HPE ESM 7.0 Page 17 of 162

SmartConnectorsSmartConnectors are the interface to the objects on your network that generate correlation-relevantevent data. After collecting event data from network nodes, they normalize the data in two ways:normalizing values (such as severity, priority, and time zone) into a common format, and normalizingthe data structure into a common schema. SmartConnectors can then filter and aggregate events toreduce the volume of events sent to the Manager, which increases ESM’s efficiency and accuracy, andreduces event processing time.
SmartConnectors enable you to execute commands on the local host, such as instructing a scanner torun a scan. SmartConnectors also add information to the data they gather, such as looking up IP and/orhost names in order to resolve IP/host name lookup at the Manager.
SmartConnectors perform the following functions:
l Collect all the data you need from a source device, so you do not have to go back to the device duringan investigation or audit.
l Save network bandwidth and storage space by filtering out data you know will not be needed foranalysis.
l Parse individual events and normalize them into a common schema (format) for use by ESM.
l Aggregate events to reduce the quantity of events sent to the Manager.
l Categorize events using a common, human-readable format. This saves you from having to be anexpert in reading the output from a myriad of devices from multiple vendors, and makes it easier touse those event categories to build filters, rules, reports, and data monitors.
l Pass events to the Manager after they have been processed.
l Depending on the network node, some SmartConnectors can also instruct the device to issuecommands to devices. These actions can be executed manually or through automated actions fromrules and some data monitors.
HPE releases new and updated ArcSight SmartConnectors regularly.
ArcSight Management CenterArcSight Management Center (ArcMC) is a hardware solution that hosts the SmartConnectors youneed in a single device with a web-based user interface for centralized management.
ArcMC offers unified control of SmartConnectors on the appliance itself, remote ArcMCs, and software-based SmartConnector installed on remote hosts.
The ArcSight Management Center:
l Supports bulk operations across all SmartConnectors and is ideal in ArcSight deployments with alarge number of SmartConnectors
ESM 101Chapter 2: ArcSight Enterprise Security Management
HPE ESM 7.0 Page 18 of 162
l Provides a SmartConnector management facility in Logger-only environments
l Provides a single interface through which to configure, monitor, tune, and update SmartConnectors
ArcSight Management Center does not affect working SmartConnectors unless it is used to changetheir configuration.
ArcSight Management Center is an ideal solution when connectors target multiple heterogeneousdestinations (for example, when Logger is deployed along with ESM), in an Logger-only environment,or when a large number of SmartConnectors are involved, such as in a MSSP deployment.
Supported Data SourcesESM collects output from data sources like network nodes, intrusion detection and prevention systems,vulnerability assessment tools, firewalls, anti-virus and anti-spam tools, encryption tools, applicationaudit logs, and physical security logs.
The graphic below shows the common network security data sources that ESM supports and ways youcan analyze their output in ESM.
ESM 101Chapter 2: ArcSight Enterprise Security Management
HPE ESM 7.0 Page 19 of 162
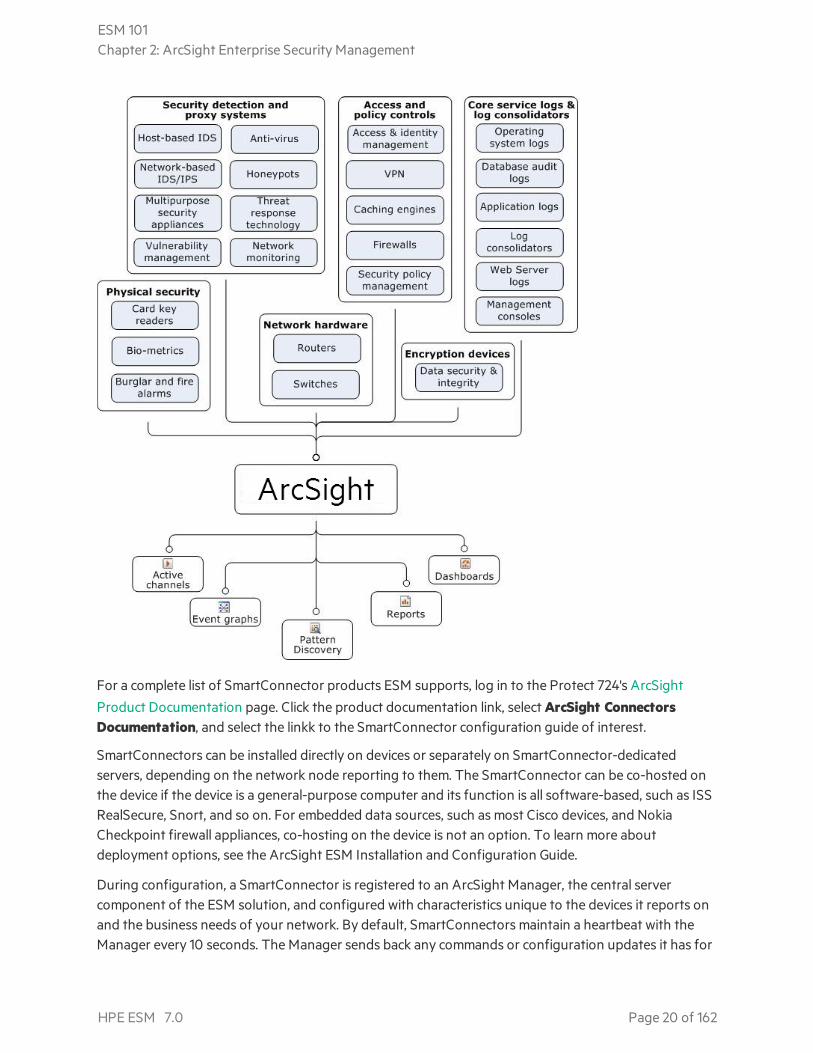
For a complete list of SmartConnector products ESM supports, log in to the Protect 724's ArcSight
Product Documentation page. Click the product documentation link, select ArcSight ConnectorsDocumentation, and select the linkk to the SmartConnector configuration guide of interest.
SmartConnectors can be installed directly on devices or separately on SmartConnector-dedicatedservers, depending on the network node reporting to them. The SmartConnector can be co-hosted onthe device if the device is a general-purpose computer and its function is all software-based, such as ISSRealSecure, Snort, and so on. For embedded data sources, such as most Cisco devices, and NokiaCheckpoint firewall appliances, co-hosting on the device is not an option. To learn more aboutdeployment options, see the ArcSight ESM Installation and Configuration Guide.
During configuration, a SmartConnector is registered to an ArcSight Manager, the central servercomponent of the ESM solution, and configured with characteristics unique to the devices it reports onand the business needs of your network. By default, SmartConnectors maintain a heartbeat with theManager every 10 seconds. The Manager sends back any commands or configuration updates it has for
ESM 101Chapter 2: ArcSight Enterprise Security Management
HPE ESM 7.0 Page 20 of 162
the SmartConnector. The SmartConnector sends new event data to the Manager in batches of 100events, or once every second, whichever comes first. The time and event count intervals are allconfigurable.
FlexConnectorThe FlexConnector framework is a software development kit (SDK) that enables you to create your ownSmartConnector tailored to the nodes on your network and their specific event data.
FlexConnector types include file reader, regular expression file reader, time-based database reader,syslog, and Simple Network Management Protocol (SNMP) readers. For more information aboutFlexConnectors and how to use them, contact your ArcSight customer service representative.
Forwarding ConnectorThe Forwarding Connectors forward events between multiple Managers in a hierarchical ESMdeployment, and/or to one or more Logger deployments. For more about the Forwarding Connector,see the Connector Configuration Guide for ArcSight Forwarding Connector.
ArcSight ManagerThe ArcSight Manager is the heart of the solution. It is a Java-based server that drives analysis,workflow, and services. It also correlates output from a wide variety of security systems.
The Manager writes events to the CORR-Engine as they stream into the system. It simultaneouslyprocesses them through the correlation engine, which evaluates each event with network model andvulnerability information to develop real-time threat summaries.
ESM comes with default configurations and standard foundation use cases consisting of filters, rules,reports, data monitors, dashboards, and network models that make ESM ready to use upon installation.You can also design the entire process that the Manager drives, from detection, to correlation, toescalation. The HPE ArcSight Professional Services department is available to help with this design andsetup.
CORR-EngineStorageThe Correlation Optimized Retention and Retrieval (CORR) Engine is a proprietary data storage andretrieval framework that receives and processes events at high rates, and performs high-speed searches.
For more about CORR-Engine, see "CORR-Engine" on page 107.
ESM 101Chapter 2: ArcSight Enterprise Security Management
HPE ESM 7.0 Page 21 of 162

User InterfacesESM provides the following interfaces depending on your role and the tasks you need to perform:
l ArcSight Command Center
l ArcSight Console
The ArcSight Command CenterThe ArcSight Command Center provides a streamlined interface for managing users, storage, and eventdata; monitoring events and running reports; and configuring storage, updating licenses, managingcomponent authentication, and setting up storage notifications. With content management, you canestablish peer relationships with other ESM installations, search, and synchronize ESM content acrosspeers. Searches ranging from simple to complex are easy to configure and saved for regular use.
For details about the ArcSight Command Center and how to use its features, see the ArcSightCommand Center User’s Guide.
The ArcSight ConsoleThe ArcSight Console is a workstation-based interface intended for use by your full-time security staffin a Security Operations Center or similar security-monitoring environment. It is the authoring tool forbuilding filters, rules, reports, Pattern Discovery, dashboards, and data monitors. It is also the interfacefor administering users and workflow.
Depending on your role in the security operations center and the permissions you have, you can doanything in the ArcSight Console from routine monitoring to building complex correlation and longsequence rules, to performing routine administrative functions.
The ArcSight Console version must match the Manager version to ensure that resources and schemas
match. For details about the ArcSight Console and how to use its features, see the ArcSight ConsoleUser’s Guide.
Use CasesUse cases are a way to view, configure, and transport specially developed sets of related resources thataddress specific security issues and business requirements. Use cases are currently available forArcSight-created content only.
After use cases are installed, they are presented in a new tab in the ArcSight Console's Navigator panel.When you open a use case, the viewer panel displays all the different types of resources that make up
ESM 101Chapter 2: ArcSight Enterprise Security Management
HPE ESM 7.0 Page 22 of 162
that use case and the types of devices whose events they operate on in a single view. This makes it easyto see what resources are related to others.
Each use case comes with its own set of documentation that includes instructions for installing andconfiguring that use case.
ArcSight ESM use cases are available for free from the ArcSight Marketplace.
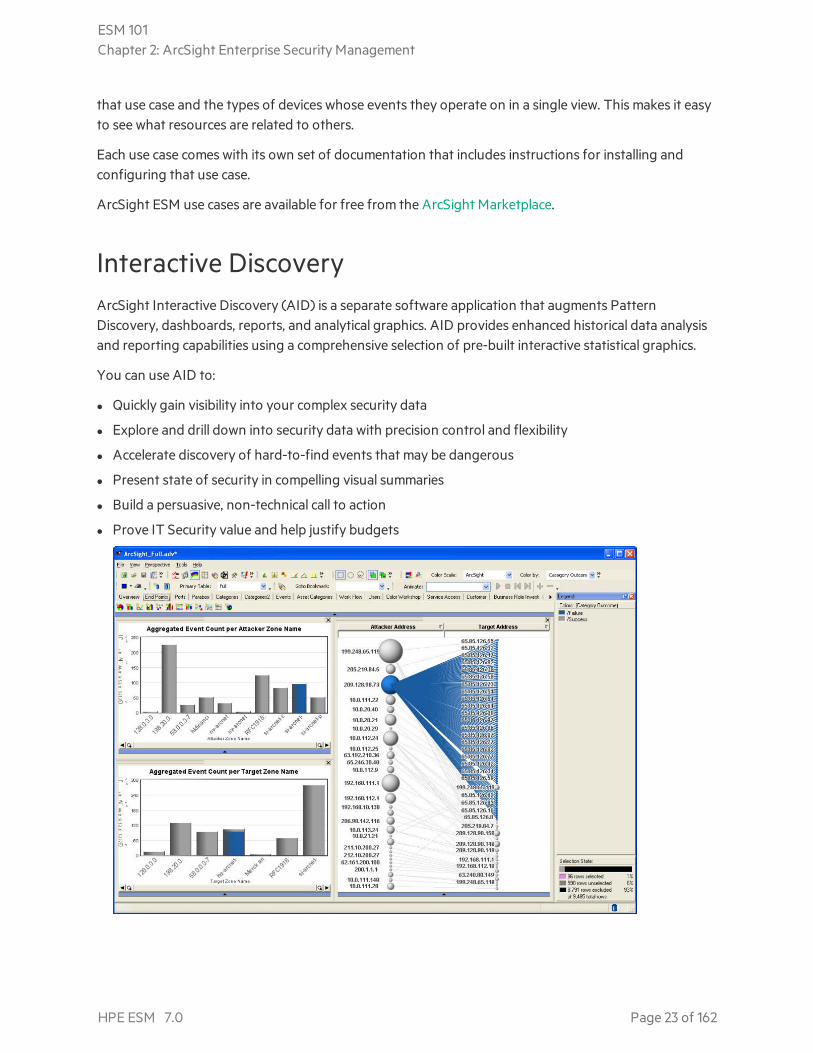
Interactive DiscoveryArcSight Interactive Discovery (AID) is a separate software application that augments PatternDiscovery, dashboards, reports, and analytical graphics. AID provides enhanced historical data analysisand reporting capabilities using a comprehensive selection of pre-built interactive statistical graphics.
You can use AID to:
l Quickly gain visibility into your complex security data
l Explore and drill down into security data with precision control and flexibility
l Accelerate discovery of hard-to-find events that may be dangerous
l Present state of security in compelling visual summaries
l Build a persuasive, non-technical call to action
l Prove IT Security value and help justify budgets
ESM 101Chapter 2: ArcSight Enterprise Security Management
HPE ESM 7.0 Page 23 of 162
Using Interactive Discovery’s visual selection tools, you can easily find and investigate potential attacks.This example shows an attacker with failed connections to many targets, which could indicate a portscan or worm.
AID enables you to analyze your network security activity using graphical summaries of event data.During daily analysis of the past day’s data, you may find new things that were missed by automatedanalysis alone. You can use this data to build new rules that improve your overall enterprise securitymanagement process.
Pattern DiscoveryPattern Discovery can automatically detect subtle, specialized, or long-term patterns that mightotherwise go undiscovered in the flow of events. You can use Pattern Discovery to:
l Discover zero-day attacks—Because Pattern Discovery does not rely on encoded domainknowledge (such as predefined rules or filters), it can discover patterns that otherwise go unseen, orare unique to your environment.
l Detect low-and-slow attacks—Pattern Discovery can process up to a million events in just a fewseconds (excluding read-time from the disk). This makes Pattern Discovery effective to capture evenlow-and-slow attack patterns.
l Profile common patterns on your network—New patterns discovered from current networktraffic are like signatures for a particular subset of network traffic. By matching against a repositoryof historical patterns, you can detect attacks in progress.
The patterns discovered in an event flow that either originate from or target a particular asset can beused to categorize those assets. For example, a pattern originating from machines that have a backdoor (unauthorized program that initiates a connection to the attacker) installed can all be visualizedas a cluster. If you see the same pattern originating from a new asset, it is a strong indication that thenew asset also has a back door installed.
l Automatically create rules—The patterns discovered can be transformed into a complete rule setwith a single mouse click. These rules are derived from data patterns unique to your environment,whereas predefined rules must be generic enough to work in many customer environments.
Pattern Discovery is a vital tool for preventive maintenance and early detection in your ongoing securitymanagement operations. Using periodic, scheduled analysis, you can always be scanning for newpatterns over varying time intervals to stay ahead of new exploitative behavior.
ESM on an ApplianceESM on an appliance can be called ESM Express or ESM Appliance. The difference is thatESM Appliance has a more extensive list of licensed features available. ESM Express is for customerswith a low to moderate number of events per second.
ESM 101Chapter 2: ArcSight Enterprise Security Management
HPE ESM 7.0 Page 24 of 162

In either case, ESM is the same Security Information and Event Management (SIEM) appliance. Itprovides the essentials for network perimeter and security monitoring by leveraging the superiorcorrelation capabilities of ESM in combination with the Correlation Optimized Retention and Retrieval(CORR) Engine. ESM on an appliance delivers an enterprise-level security monitoring and responsesystem through a series of coordinated resources, such as dashboards, rules, and reports.
For more about ESM standard content, see the ArcSight Administration and ArcSight System StandardContent Guide.
LoggerArcSight Logger is an event data storage appliance that is optimized for extremely high eventthroughput. Logger stores security events on board in compressed form, but can always retrieveunmodified events on demand for historical analysis-quality litigation data.
Logger can be deployed stand-alone to receive events from syslog messages or log files, or to receiveevents in Common Event Format from SmartConnectors. Logger can forward selected events as syslogmessages to ESM.
Multiple Loggers work together to scale up to support high sustained input rates. Event queries aredistributed across a peer network of Loggers.
ArcSight SolutionsMany industries are increasingly subject to regulatory guidelines, or face common concerns. For thesesituations, ArcSight provides detailed, ready-made solutions for both ESM and Logger. ArcSightsolutions collect relevant enterprise events across all locations and sources, and then correlate this datain real-time to detect compliance violations, data breaches or other fraudulent activity.
Each ArcSight solution has a solution guide to which you can refer. For example, the Compliance InsightPackage for HIPAA Solution Guide and the Compliance Insight Package for PCI Solution Guide.
About ResourcesESM uses objects called resources to manage event-processing logic. A resource defines the properties,values, and relationships used to configure the functions that ESM performs. Resources can also be theoutput of such a configuration (such as archived reports, or Pattern Discovery snapshots and patterns).Resources are discussed in more detail in "ESM Resources" on page 152.
ESM has more than 30 different types of resources and comes with hundreds of these resourcesalready configured to give you functionality as soon as the product is installed. These resources arepresented in the Navigator panel of the ArcSight Console.
ESM 101Chapter 2: ArcSight Enterprise Security Management
HPE ESM 7.0 Page 25 of 162
Functional Area Description Related Resources
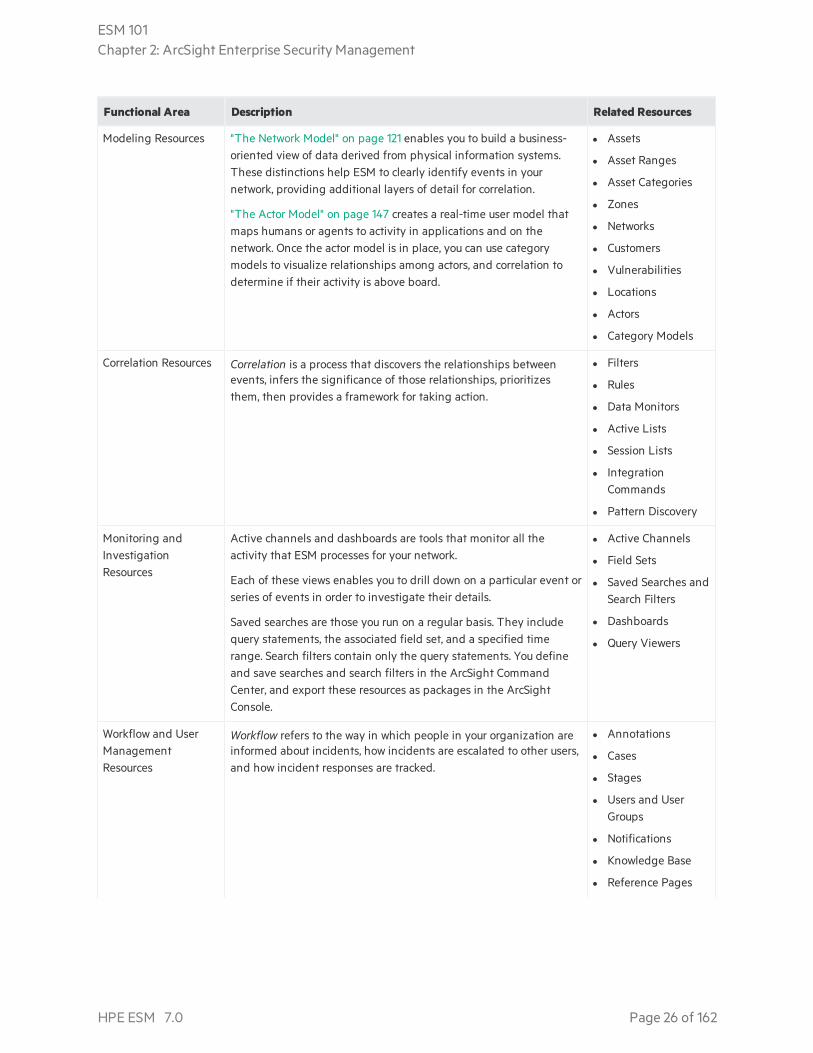
Modeling Resources "The Network Model" on page 121 enables you to build a business-oriented view of data derived from physical information systems.These distinctions help ESM to clearly identify events in yournetwork, providing additional layers of detail for correlation.
"The Actor Model" on page 147 creates a real-time user model thatmaps humans or agents to activity in applications and on thenetwork. Once the actor model is in place, you can use categorymodels to visualize relationships among actors, and correlation todetermine if their activity is above board.
l Assets
l Asset Ranges
l Asset Categories
l Zones
l Networks
l Customers
l Vulnerabilities
l Locations
l Actors
l Category Models
Correlation Resources Correlation is a process that discovers the relationships betweenevents, infers the significance of those relationships, prioritizesthem, then provides a framework for taking action.
l Filters
l Rules
l Data Monitors
l Active Lists
l Session Lists
l IntegrationCommands
l Pattern Discovery
Monitoring andInvestigationResources
Active channels and dashboards are tools that monitor all theactivity that ESM processes for your network.
Each of these views enables you to drill down on a particular event orseries of events in order to investigate their details.
Saved searches are those you run on a regular basis. They includequery statements, the associated field set, and a specified timerange. Search filters contain only the query statements. You defineand save searches and search filters in the ArcSight CommandCenter, and export these resources as packages in the ArcSightConsole.
l Active Channels
l Field Sets
l Saved Searches andSearch Filters
l Dashboards
l Query Viewers
Workflow and UserManagementResources
Workflow refers to the way in which people in your organization areinformed about incidents, how incidents are escalated to other users,and how incident responses are tracked.
l Annotations
l Cases
l Stages
l Users and UserGroups
l Notifications
l Knowledge Base
l Reference Pages
ESM 101Chapter 2: ArcSight Enterprise Security Management
HPE ESM 7.0 Page 26 of 162
Functional Area Description Related Resources
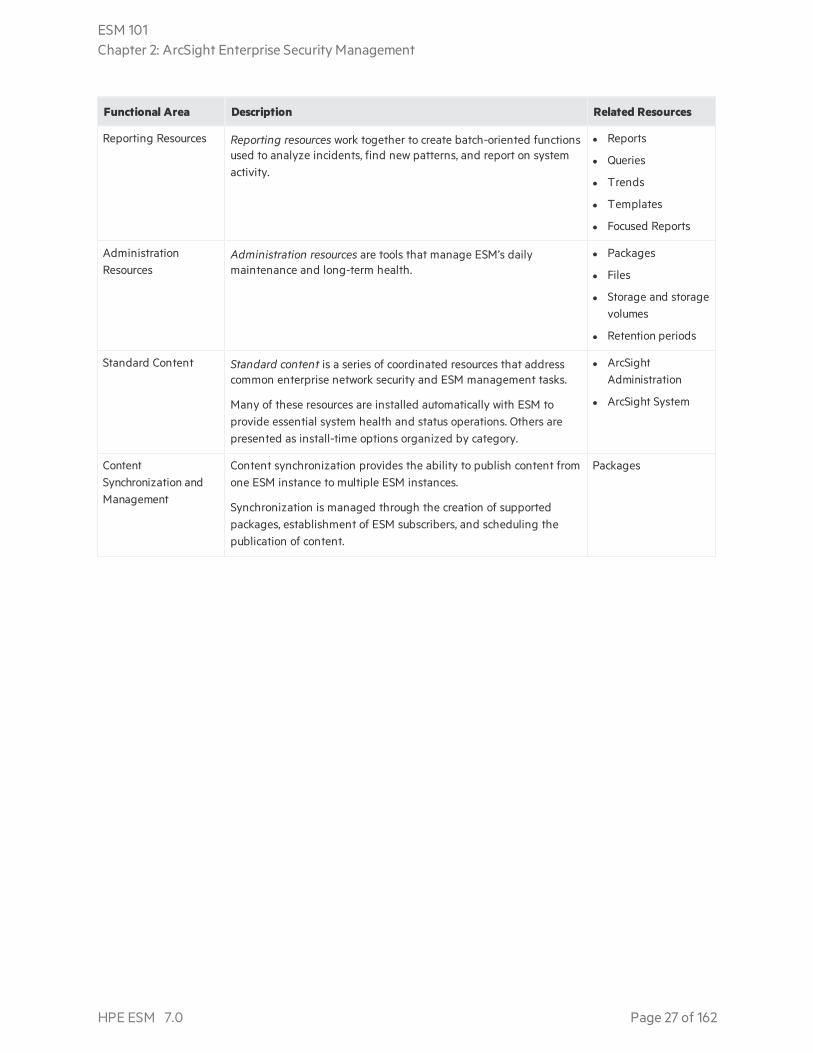
Reporting Resources Reporting resources work together to create batch-oriented functionsused to analyze incidents, find new patterns, and report on systemactivity.
l Reports
l Queries
l Trends
l Templates
l Focused Reports
AdministrationResources
Administration resources are tools that manage ESM’s dailymaintenance and long-term health.
l Packages
l Files
l Storage and storagevolumes
l Retention periods
Standard Content Standard content is a series of coordinated resources that addresscommon enterprise network security and ESM management tasks.
Many of these resources are installed automatically with ESM toprovide essential system health and status operations. Others arepresented as install-time options organized by category.
l ArcSightAdministration
l ArcSight System
ContentSynchronization andManagement
Content synchronization provides the ability to publish content fromone ESM instance to multiple ESM instances.
Synchronization is managed through the creation of supportedpackages, establishment of ESM subscribers, and scheduling thepublication of content.
Packages
ESM 101Chapter 2: ArcSight Enterprise Security Management
HPE ESM 7.0 Page 27 of 162
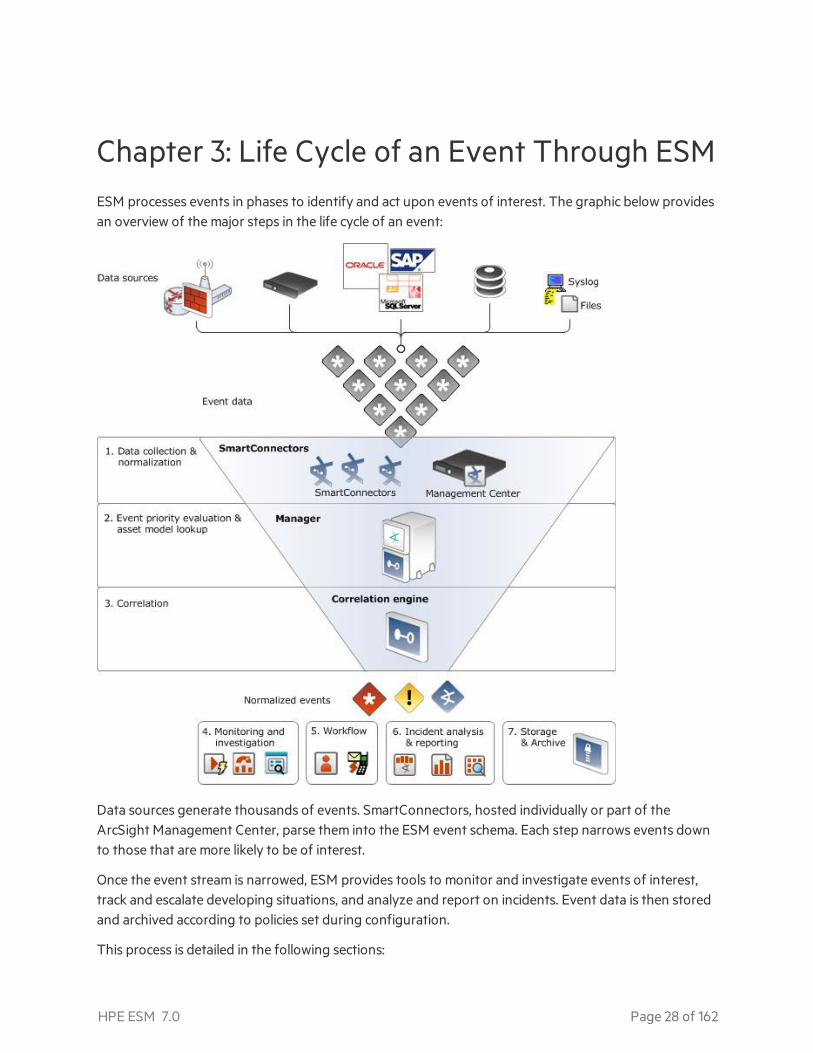
Chapter 3: Life Cycle of an Event Through ESMESM processes events in phases to identify and act upon events of interest. The graphic below providesan overview of the major steps in the life cycle of an event:
Data sources generate thousands of events. SmartConnectors, hosted individually or part of theArcSight Management Center, parse them into the ESM event schema. Each step narrows events downto those that are more likely to be of interest.
Once the event stream is narrowed, ESM provides tools to monitor and investigate events of interest,track and escalate developing situations, and analyze and report on incidents. Event data is then storedand archived according to policies set during configuration.
This process is detailed in the following sections:
HPE ESM 7.0 Page 28 of 162
l "Data Collection and Event Processing" on page 30
l "Priority Evaluation and Network Model Lookup" on page 39
l "Workflow" on page 44
l "Correlation Evaluation" on page 53
l "Monitoring and Investigation" on page 79
l "Reporting and Incident Analysis" on page 96
l "CORR-Engine" on page 107
To learn more about the event schema, network model, actor model, and resource management, seethese sections:
l "The Event Schema" on page 111
l "The Network Model" on page 121
l "The Actor Model" on page 147
l "Managing Resources and Standard Content" on page 152
ESM 101Chapter 3: Life Cycle of an Event Through ESM
HPE ESM 7.0 Page 29 of 162
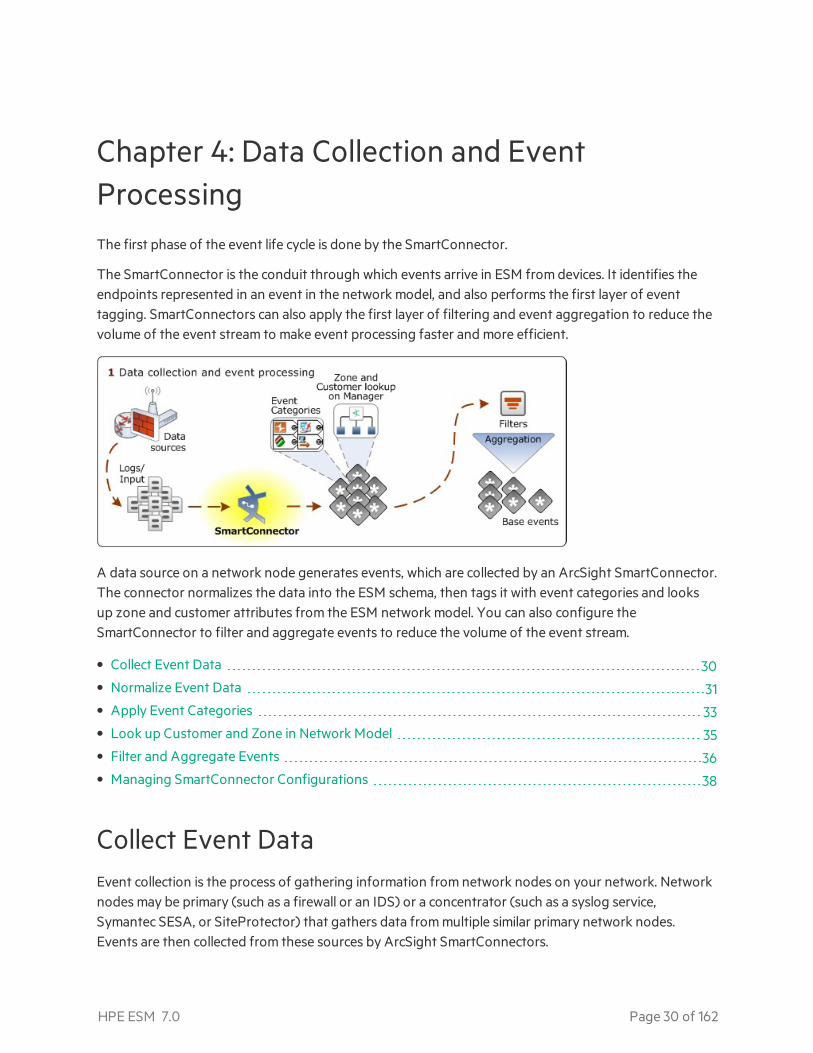
Chapter 4: Data Collection and EventProcessingThe first phase of the event life cycle is done by the SmartConnector.
The SmartConnector is the conduit through which events arrive in ESM from devices. It identifies theendpoints represented in an event in the network model, and also performs the first layer of eventtagging. SmartConnectors can also apply the first layer of filtering and event aggregation to reduce thevolume of the event stream to make event processing faster and more efficient.
A data source on a network node generates events, which are collected by an ArcSight SmartConnector.The connector normalizes the data into the ESM schema, then tags it with event categories and looksup zone and customer attributes from the ESM network model. You can also configure theSmartConnector to filter and aggregate events to reduce the volume of the event stream.
• Collect Event Data 30• Normalize Event Data 31• Apply Event Categories 33• Look up Customer and Zone in Network Model 35• Filter and Aggregate Events 36• Managing SmartConnector Configurations 38
Collect Event DataEvent collection is the process of gathering information from network nodes on your network. Networknodes may be primary (such as a firewall or an IDS) or a concentrator (such as a syslog service,Symantec SESA, or SiteProtector) that gathers data from multiple similar primary network nodes.Events are then collected from these sources by ArcSight SmartConnectors.
HPE ESM 7.0 Page 30 of 162
The data collected is log data generated by the different types of sources on your network. Each item ofthe log is translated into one event. How the data reaches the connector depends on the source thatgenerates the logs.
For example, event data may be retrieved from databases, such as EPO or SiteProtector, or sent as anevent stream via the network, such as syslog or SNMP. In some cases, the data is read from log files, andin other cases, it is pulled by the connector using proprietary protocols, such as OPSEC (Check Point) orRDEP (Cisco IDS).
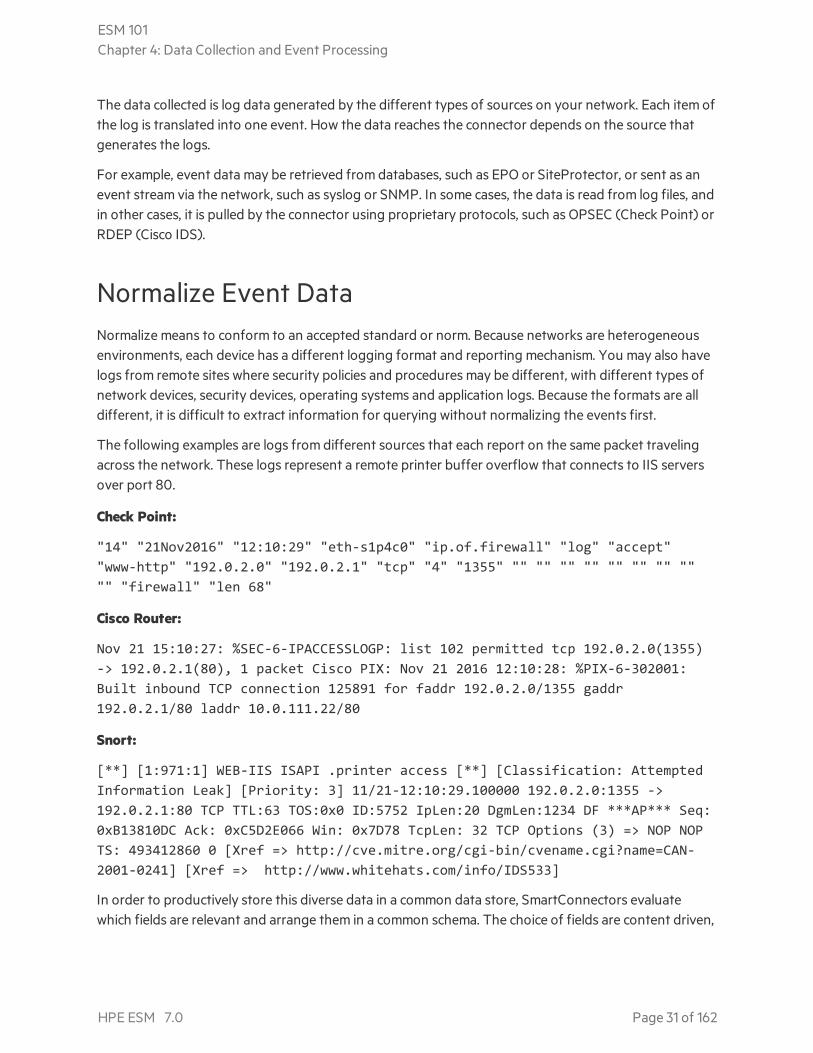
Normalize Event DataNormalize means to conform to an accepted standard or norm. Because networks are heterogeneousenvironments, each device has a different logging format and reporting mechanism. You may also havelogs from remote sites where security policies and procedures may be different, with different types ofnetwork devices, security devices, operating systems and application logs. Because the formats are alldifferent, it is difficult to extract information for querying without normalizing the events first.
The following examples are logs from different sources that each report on the same packet travelingacross the network. These logs represent a remote printer buffer overflow that connects to IIS serversover port 80.
Check Point:
"14" "21Nov2016" "12:10:29" "eth-s1p4c0" "ip.of.firewall" "log" "accept""www-http" "192.0.2.0" "192.0.2.1" "tcp" "4" "1355" "" "" "" "" "" "" "" """" "firewall" "len 68"
Cisco Router:
Nov 21 15:10:27: %SEC-6-IPACCESSLOGP: list 102 permitted tcp 192.0.2.0(1355)-> 192.0.2.1(80), 1 packet Cisco PIX: Nov 21 2016 12:10:28: %PIX-6-302001:Built inbound TCP connection 125891 for faddr 192.0.2.0/1355 gaddr192.0.2.1/80 laddr 10.0.111.22/80
Snort:
[**] [1:971:1] WEB-IIS ISAPI .printer access [**] [Classification: AttemptedInformation Leak] [Priority: 3] 11/21-12:10:29.100000 192.0.2.0:1355 ->192.0.2.1:80 TCP TTL:63 TOS:0x0 ID:5752 IpLen:20 DgmLen:1234 DF ***AP*** Seq:0xB13810DC Ack: 0xC5D2E066 Win: 0x7D78 TcpLen: 32 TCP Options (3) => NOP NOPTS: 493412860 0 [Xref => http://cve.mitre.org/cgi-bin/cvename.cgi?name=CAN-2001-0241] [Xref => http://www.whitehats.com/info/IDS533]
In order to productively store this diverse data in a common data store, SmartConnectors evaluatewhich fields are relevant and arrange them in a common schema. The choice of fields are content driven,
ESM 101Chapter 4: Data Collection and Event Processing
HPE ESM 7.0 Page 31 of 162
not based on syntactic differences between what Checkpoint may call target address and what Ciscocalls destination address.
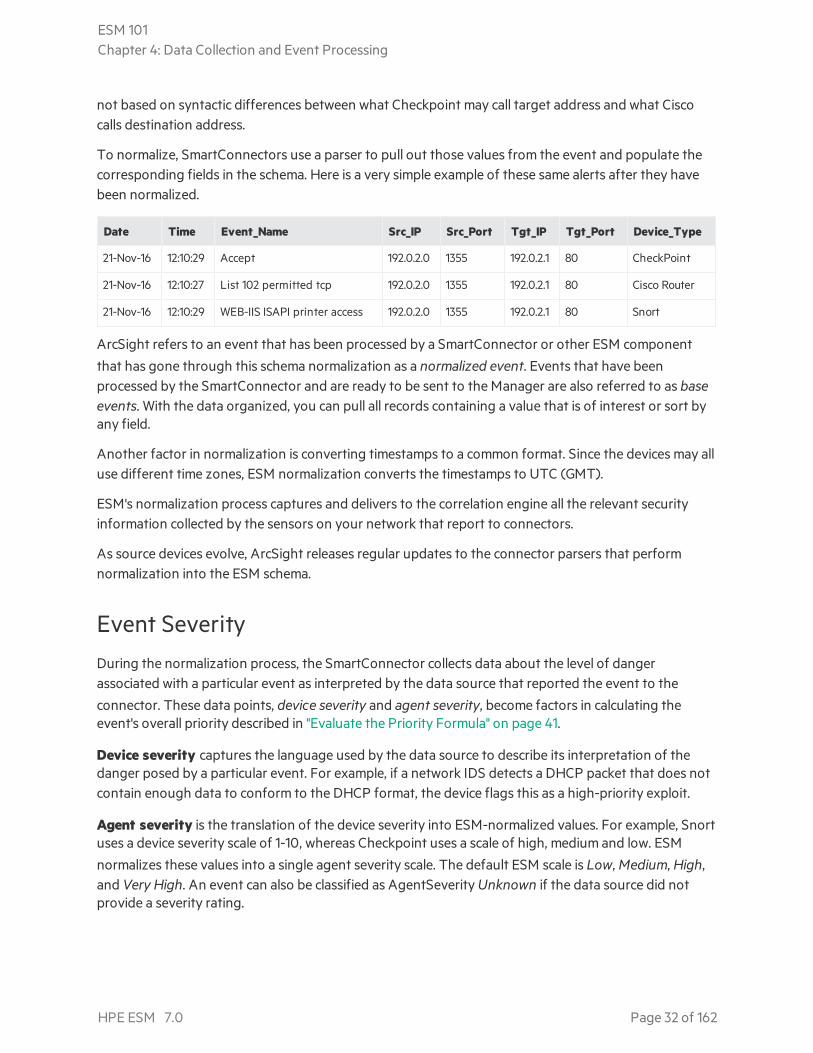
To normalize, SmartConnectors use a parser to pull out those values from the event and populate thecorresponding fields in the schema. Here is a very simple example of these same alerts after they havebeen normalized.
Date Time Event_Name Src_IP Src_Port Tgt_IP Tgt_Port Device_Type
21-Nov-16 12:10:29 Accept 192.0.2.0 1355 192.0.2.1 80 CheckPoint
21-Nov-16 12:10:27 List 102 permitted tcp 192.0.2.0 1355 192.0.2.1 80 Cisco Router
21-Nov-16 12:10:29 WEB-IIS ISAPI printer access 192.0.2.0 1355 192.0.2.1 80 Snort
ArcSight refers to an event that has been processed by a SmartConnector or other ESM componentthat has gone through this schema normalization as a normalized event. Events that have beenprocessed by the SmartConnector and are ready to be sent to the Manager are also referred to as baseevents. With the data organized, you can pull all records containing a value that is of interest or sort byany field.
Another factor in normalization is converting timestamps to a common format. Since the devices may alluse different time zones, ESM normalization converts the timestamps to UTC (GMT).
ESM's normalization process captures and delivers to the correlation engine all the relevant securityinformation collected by the sensors on your network that report to connectors.
As source devices evolve, ArcSight releases regular updates to the connector parsers that performnormalization into the ESM schema.
Event SeverityDuring the normalization process, the SmartConnector collects data about the level of dangerassociated with a particular event as interpreted by the data source that reported the event to the
connector. These data points, device severity and agent severity, become factors in calculating theevent's overall priority described in "Evaluate the Priority Formula" on page 41.
Device severity captures the language used by the data source to describe its interpretation of thedanger posed by a particular event. For example, if a network IDS detects a DHCP packet that does notcontain enough data to conform to the DHCP format, the device flags this as a high-priority exploit.
Agent severity is the translation of the device severity into ESM-normalized values. For example, Snortuses a device severity scale of 1-10, whereas Checkpoint uses a scale of high, medium and low. ESM
normalizes these values into a single agent severity scale. The default ESM scale is Low, Medium, High,and Very High. An event can also be classified as AgentSeverity Unknown if the data source did notprovide a severity rating.
ESM 101Chapter 4: Data Collection and Event Processing
HPE ESM 7.0 Page 32 of 162
For example, routine file access and successful authentications by authorized users would be translatedinto the ESM-normalized values as low severity, whereas a short DHCP packet would be translated asvery high severity.
Apply Event CategoriesLike the logs themselves, different security devices also include a model for describing thecharacteristics of the events they process. But no two devices or vendors use the same event-characteristic model.
To solve this problem, ArcSight has also developed a common model for describing events, whichenables you to understand the real significance of a particular event as reported from different devices.This common model also enables you to write device-independent content that can correlate eventswith normalized characteristics. This model is expressed as event categories, and the SmartConnectorassigns them using default criteria, which can be configured during connector setup.
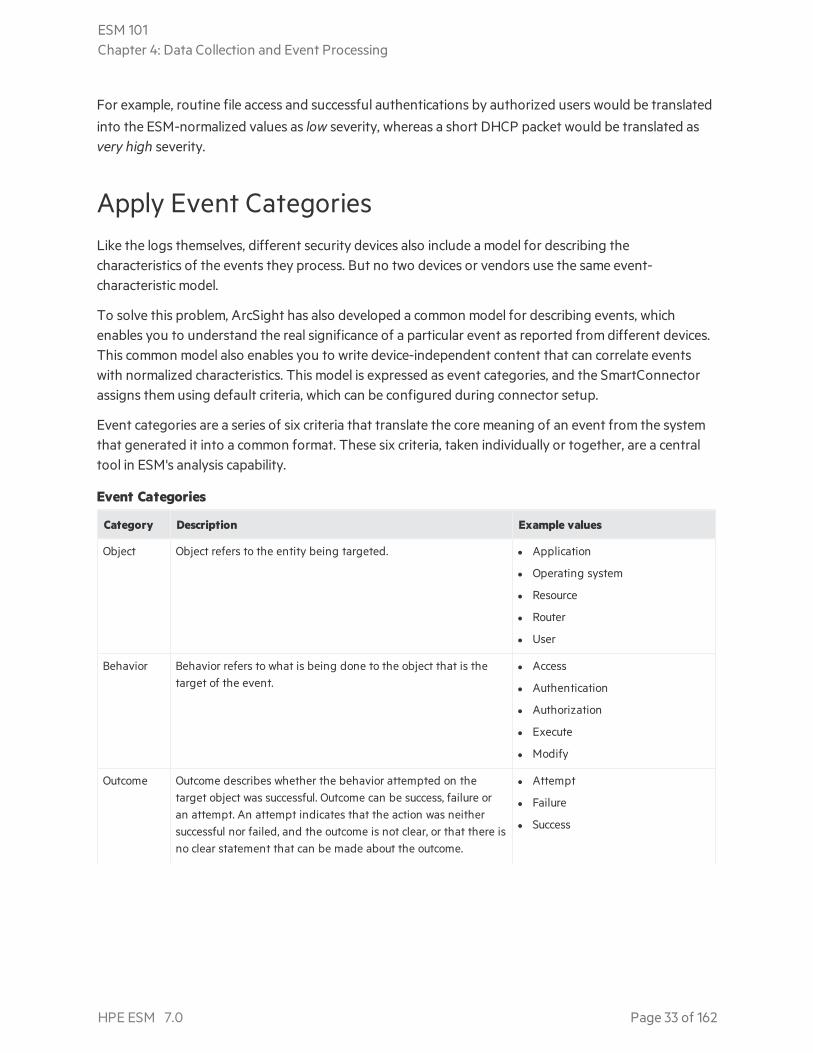
Event categories are a series of six criteria that translate the core meaning of an event from the systemthat generated it into a common format. These six criteria, taken individually or together, are a centraltool in ESM's analysis capability.
Category Description Example values
Object Object refers to the entity being targeted. l Application
l Operating system
l Resource
l Router
l User
Behavior Behavior refers to what is being done to the object that is thetarget of the event.
l Access
l Authentication
l Authorization
l Execute
l Modify
Outcome Outcome describes whether the behavior attempted on thetarget object was successful. Outcome can be success, failure oran attempt. An attempt indicates that the action was neithersuccessful nor failed, and the outcome is not clear, or that there isno clear statement that can be made about the outcome.
l Attempt
l Failure
l Success
Event Categories
ESM 101Chapter 4: Data Collection and Event Processing
HPE ESM 7.0 Page 33 of 162
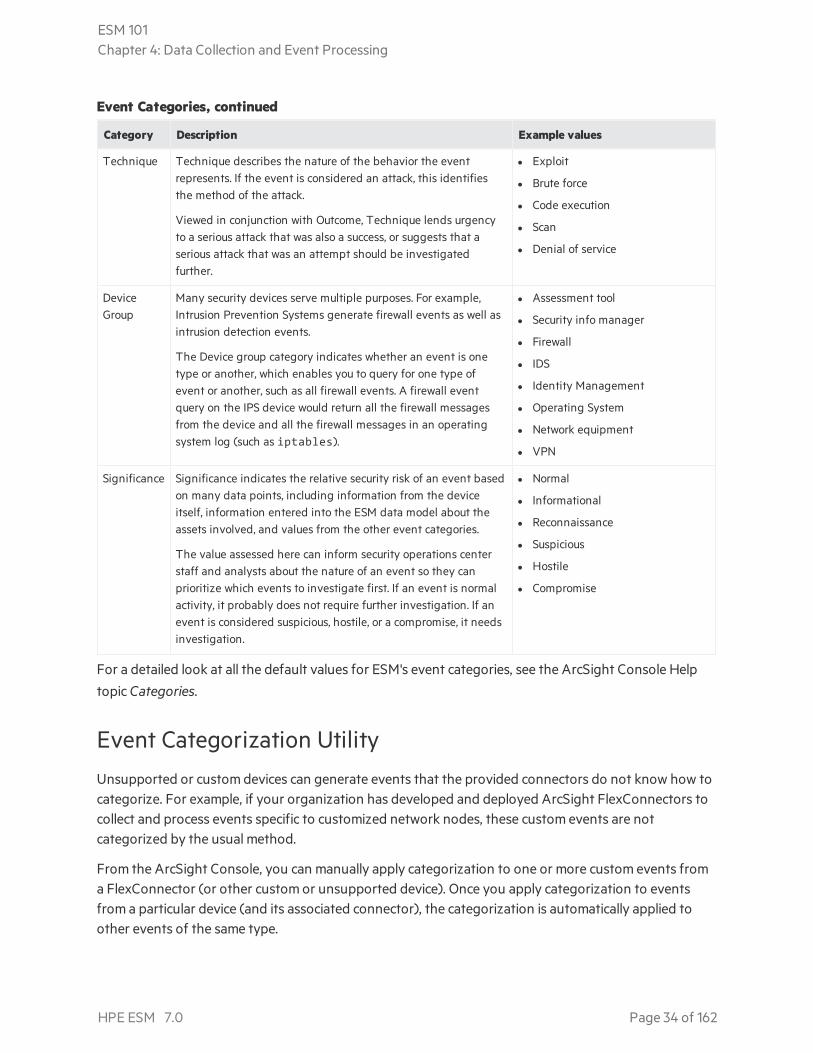
Category Description Example values
Technique Technique describes the nature of the behavior the eventrepresents. If the event is considered an attack, this identifiesthe method of the attack.
Viewed in conjunction with Outcome, Technique lends urgencyto a serious attack that was also a success, or suggests that aserious attack that was an attempt should be investigatedfurther.
l Exploit
l Brute force
l Code execution
l Scan
l Denial of service
DeviceGroup
Many security devices serve multiple purposes. For example,Intrusion Prevention Systems generate firewall events as well asintrusion detection events.
The Device group category indicates whether an event is onetype or another, which enables you to query for one type ofevent or another, such as all firewall events. A firewall eventquery on the IPS device would return all the firewall messagesfrom the device and all the firewall messages in an operatingsystem log (such as iptables).
l Assessment tool
l Security info manager
l Firewall
l IDS
l Identity Management
l Operating System
l Network equipment
l VPN
Significance Significance indicates the relative security risk of an event basedon many data points, including information from the deviceitself, information entered into the ESM data model about theassets involved, and values from the other event categories.
The value assessed here can inform security operations centerstaff and analysts about the nature of an event so they canprioritize which events to investigate first. If an event is normalactivity, it probably does not require further investigation. If anevent is considered suspicious, hostile, or a compromise, it needsinvestigation.
l Normal
l Informational
l Reconnaissance
l Suspicious
l Hostile
l Compromise
Event Categories, continued
For a detailed look at all the default values for ESM's event categories, see the ArcSight Console Help
topic Categories.
Event Categorization UtilityUnsupported or custom devices can generate events that the provided connectors do not know how tocategorize. For example, if your organization has developed and deployed ArcSight FlexConnectors tocollect and process events specific to customized network nodes, these custom events are notcategorized by the usual method.
From the ArcSight Console, you can manually apply categorization to one or more custom events froma FlexConnector (or other custom or unsupported device). Once you apply categorization to eventsfrom a particular device (and its associated connector), the categorization is automatically applied toother events of the same type.
ESM 101Chapter 4: Data Collection and Event Processing
HPE ESM 7.0 Page 34 of 162
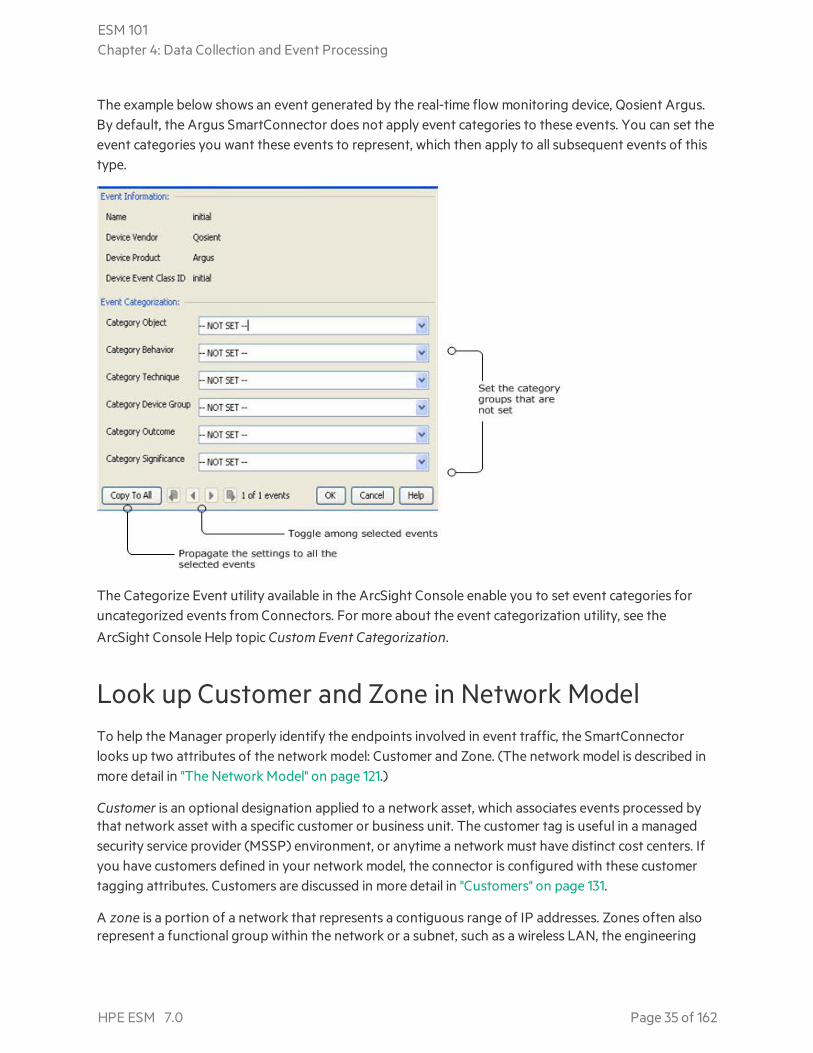
The example below shows an event generated by the real-time flow monitoring device, Qosient Argus.By default, the Argus SmartConnector does not apply event categories to these events. You can set theevent categories you want these events to represent, which then apply to all subsequent events of thistype.
The Categorize Event utility available in the ArcSight Console enable you to set event categories foruncategorized events from Connectors. For more about the event categorization utility, see theArcSight Console Help topic CustomEvent Categorization.
Look up Customer and Zone in Network ModelTo help the Manager properly identify the endpoints involved in event traffic, the SmartConnectorlooks up two attributes of the network model: Customer and Zone. (The network model is described inmore detail in "The Network Model" on page 121.)
Customer is an optional designation applied to a network asset, which associates events processed bythat network asset with a specific customer or business unit. The customer tag is useful in a managedsecurity service provider (MSSP) environment, or anytime a network must have distinct cost centers. Ifyou have customers defined in your network model, the connector is configured with these customertagging attributes. Customers are discussed in more detail in "Customers" on page 131.
A zone is a portion of a network that represents a contiguous range of IP addresses. Zones often alsorepresent a functional group within the network or a subnet, such as a wireless LAN, the engineering
ESM 101Chapter 4: Data Collection and Event Processing
HPE ESM 7.0 Page 35 of 162

network, the VPN or the DMZ. Zones are also how ESM resolves private networks whose IP ranges mayoverlap with other existing IP ranges.
Zones are set at the Manager and pushed to the SmartConnector by the Manager as part of its normaladministrative handshake with the connector. Zones are discussed in more detail in "Zones" on page 127.
Filter and Aggregate EventsSmartConnectors can be configured with filter conditions and aggregation logic that focus and reducethe volume of events sent to the Manager.
Configure SmartConnectors to Filter Out EventsFilters for SmartConnectors are exclusive (filter out). Events that meet the connector filteringcriteria are not forwarded to the Manager.
During SmartConnector setup, you can configure the connector to use filter conditions that do notpass events to the Manager according to specific criteria. For example, you can use filters to excludeevents with certain characteristics or events from specific network devices. For more about filters, see"Filters" on page 54.
Configure SmartConnector to Aggregate EventsYou can configure the SmartConnector to aggregate (summarize and merge) events that have thesame values in a specified set of fields, either a specified number of times, OR within a specified timelimit.
Connector aggregation merges events with matching values into a single aggregated event. Theaggregated event contains only the values the events have in common plus the earliest start time andlatest end time. This reduces the number of individual events the Manager has to evaluate.
For example, suppose the connector is configured to aggregate events with a certain source IP andport, destination IP and port, and device action if they occur 10 times in 30 seconds. If the connectorreceives 10 events with these matching values within that time, they are grouped into a singleaggregated event with an aggregated event count of 10.
ESM 101Chapter 4: Data Collection and Event Processing
HPE ESM 7.0 Page 36 of 162
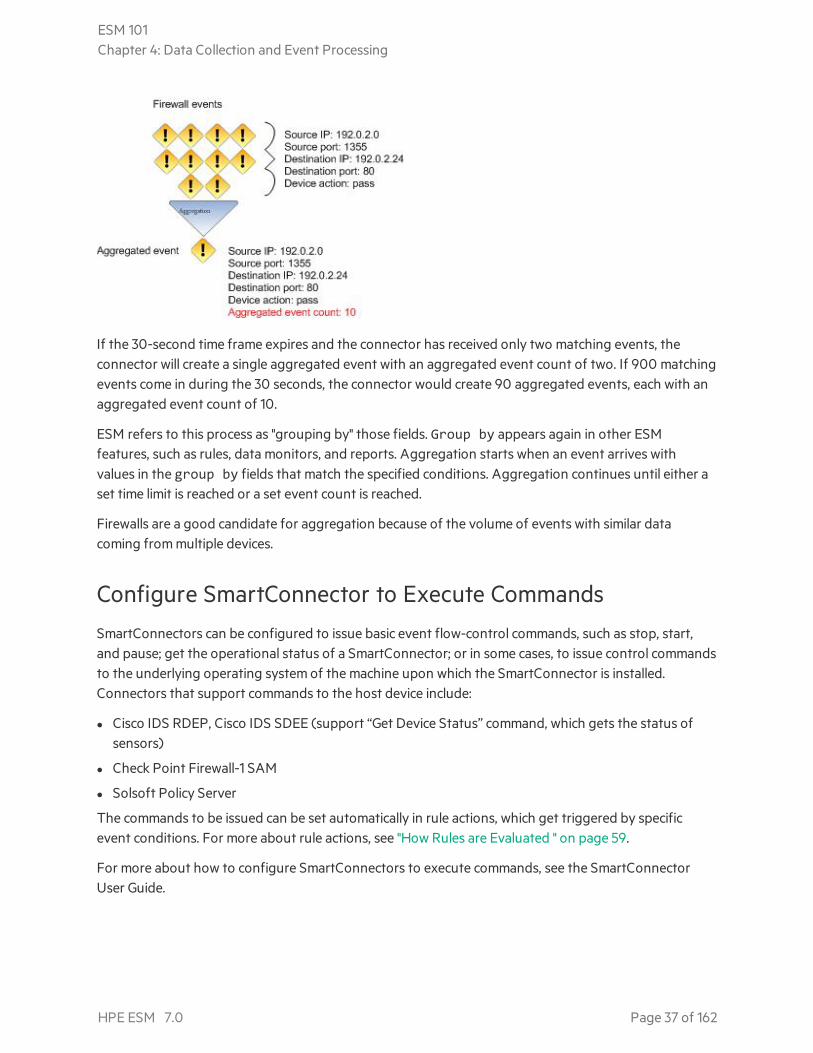
If the 30-second time frame expires and the connector has received only two matching events, theconnector will create a single aggregated event with an aggregated event count of two. If 900 matchingevents come in during the 30 seconds, the connector would create 90 aggregated events, each with anaggregated event count of 10.
ESM refers to this process as "grouping by" those fields. Group by appears again in other ESMfeatures, such as rules, data monitors, and reports. Aggregation starts when an event arrives withvalues in the group by fields that match the specified conditions. Aggregation continues until either aset time limit is reached or a set event count is reached.
Firewalls are a good candidate for aggregation because of the volume of events with similar datacoming from multiple devices.
Configure SmartConnector to Execute CommandsSmartConnectors can be configured to issue basic event flow-control commands, such as stop, start,and pause; get the operational status of a SmartConnector; or in some cases, to issue control commandsto the underlying operating system of the machine upon which the SmartConnector is installed.Connectors that support commands to the host device include:
l Cisco IDS RDEP, Cisco IDS SDEE (support “Get Device Status” command, which gets the status ofsensors)
l Check Point Firewall-1 SAM
l Solsoft Policy Server
The commands to be issued can be set automatically in rule actions, which get triggered by specificevent conditions. For more about rule actions, see "How Rules are Evaluated " on page 59.
For more about how to configure SmartConnectors to execute commands, see the SmartConnectorUser Guide.
ESM 101Chapter 4: Data Collection and Event Processing
HPE ESM 7.0 Page 37 of 162
Managing SmartConnector ConfigurationsAll the configurable attributes of SmartConnectors are set when the connector is installed. Theseattributes can be edited after installation by the Administrator using the Connector resource.
The Connector resource enables the Administrator to configure SmartConnector attributes andbehavior, such as:
l SmartConnector name, ID, location, owner, creation, and update information
l The ESM network with which the connector is associated
l The default behavior of the connector, such as batching, time correction, cache size, Managerconnection attributes, aggregation parameters, or filters
l The alternate behavior of the connector, which can be initiated in an alternate environment, such as atest environment
For complete instructions about what connector attributes to configure and how, see theSmartConnector User Guide.
ESM 101Chapter 4: Data Collection and Event Processing
HPE ESM 7.0 Page 38 of 162
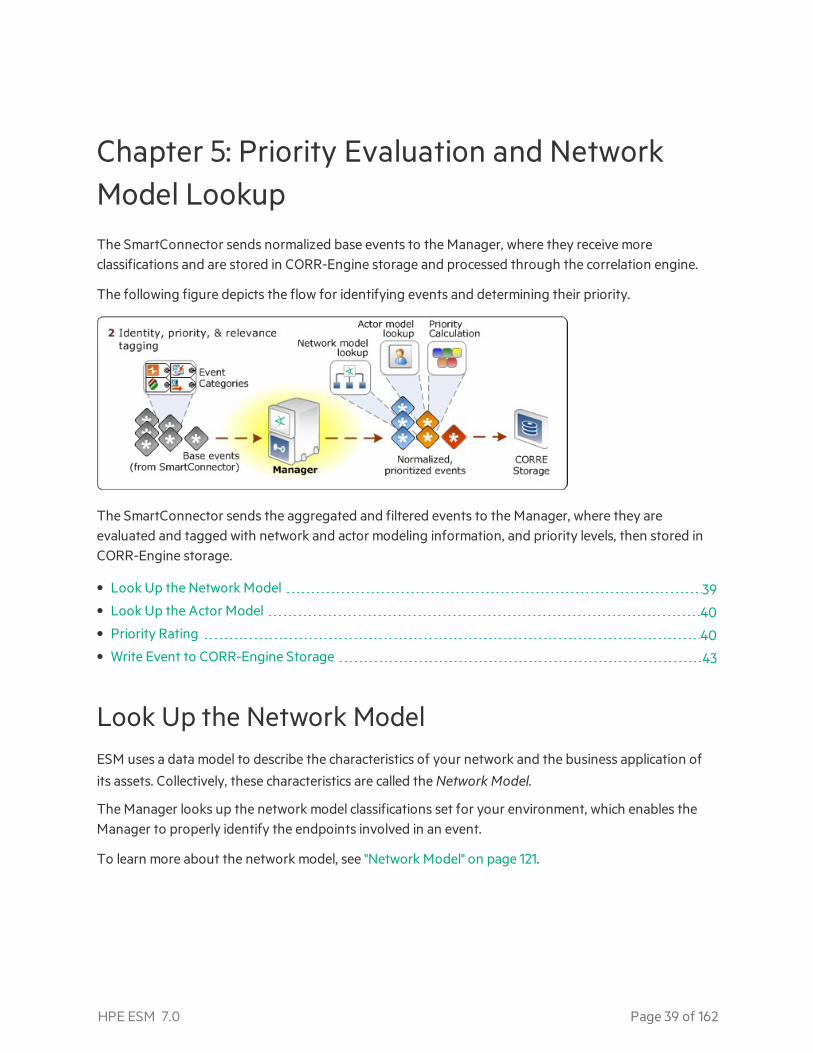
Chapter 5: Priority Evaluation and NetworkModel LookupThe SmartConnector sends normalized base events to the Manager, where they receive moreclassifications and are stored in CORR-Engine storage and processed through the correlation engine.
The following figure depicts the flow for identifying events and determining their priority.
The SmartConnector sends the aggregated and filtered events to the Manager, where they areevaluated and tagged with network and actor modeling information, and priority levels, then stored inCORR-Engine storage.
• Look Up the Network Model 39• Look Up the Actor Model 40• Priority Rating 40• Write Event to CORR-Engine Storage 43
Look Up the Network ModelESM uses a data model to describe the characteristics of your network and the business application of
its assets. Collectively, these characteristics are called the Network Model.
The Manager looks up the network model classifications set for your environment, which enables theManager to properly identify the endpoints involved in an event.
To learn more about the network model, see "Network Model" on page 121.
HPE ESM 7.0 Page 39 of 162
Look Up the Actor ModelESM also uses a data model to normalize user information stored in different formats in differentauthentication data stores to create a profile that identifies users on your network.
Leveraging the "Actor Resource Framework" on page 148, the Manager identifies actors based onwhatever user identity attributes are available in events arriving from different sources from across thenetwork.
The actors feature real-time user model maps humans or agents to activity in applications and on thenetwork. Once the actor model is in place, you can use category models (see "Category Models:Analyzing Actor Relationships" on page 150) to visualize relationships among actors, and correlation todetermine if their activity is above board.
Actors require a separate license. See "The Actor Model" on page 147.
Priority RatingPriority evaluation is an automatic feature that is always "on," and is applied to all the events received bythe Manager. The point of calculating an event's priority is to signal to security operations personnelwhether this is an event that warrants further notice. The priority of an event is a calculated overallrating based on Event Severity adjusted by Model Confidence, Relevance, Severity, and Criticality usinga detailed formula. The four priority formula factors and agentSeverity are all fields in the ESM eventschema (see "Event Data Fields " on page 111), and can therefore be used in correlation.
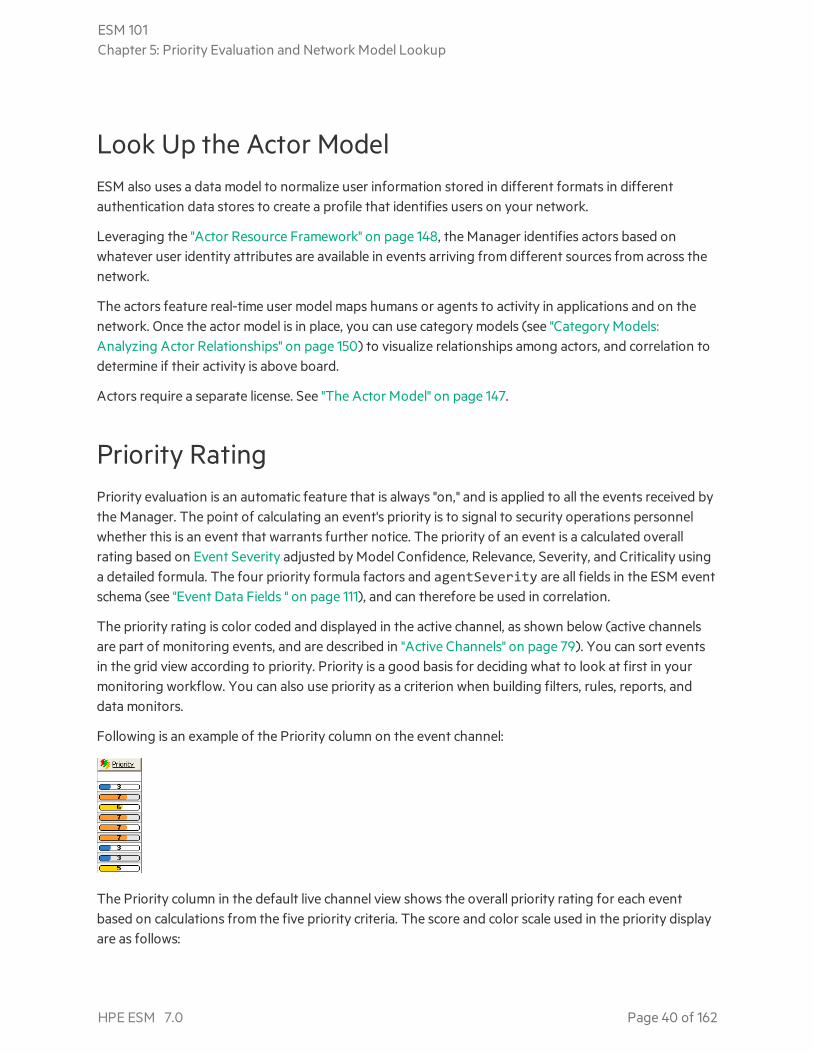
The priority rating is color coded and displayed in the active channel, as shown below (active channelsare part of monitoring events, and are described in "Active Channels" on page 79). You can sort eventsin the grid view according to priority. Priority is a good basis for deciding what to look at first in yourmonitoring workflow. You can also use priority as a criterion when building filters, rules, reports, anddata monitors.
Following is an example of the Priority column on the event channel:
The Priority column in the default live channel view shows the overall priority rating for each eventbased on calculations from the five priority criteria. The score and color scale used in the priority displayare as follows:
ESM 101Chapter 5: Priority Evaluation and Network Model Lookup
HPE ESM 7.0 Page 40 of 162
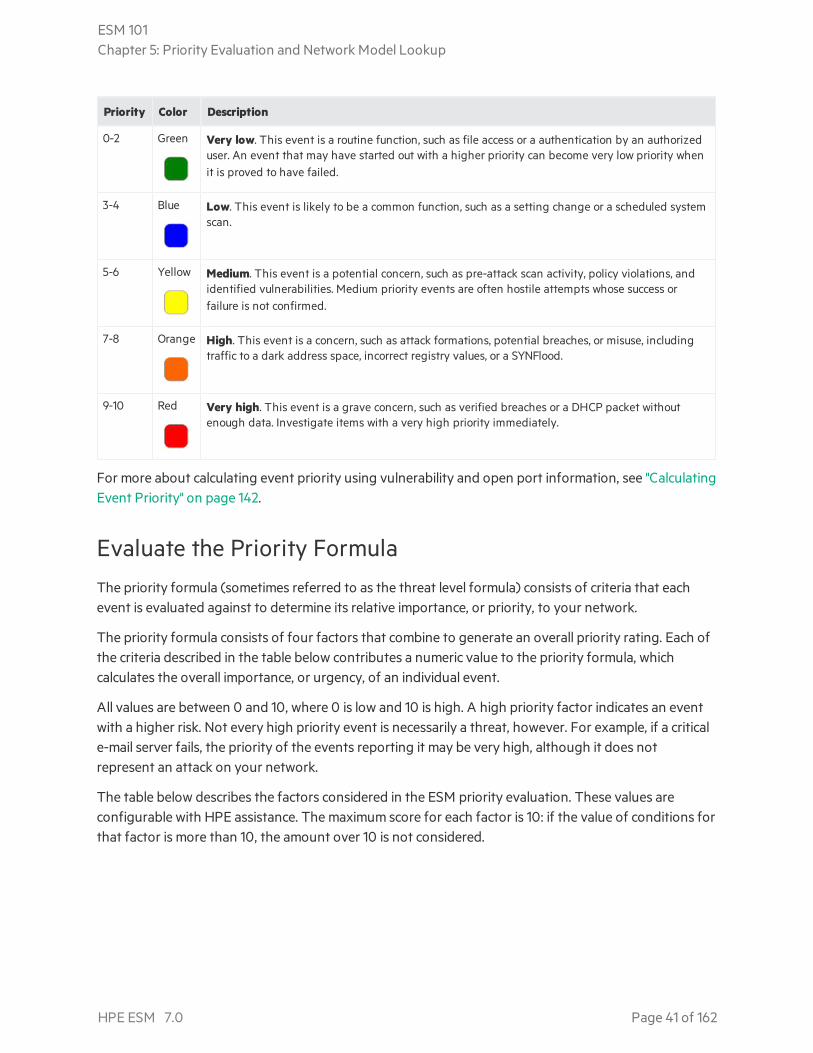
Priority Color Description
0-2 Green Very low. This event is a routine function, such as file access or a authentication by an authorizeduser. An event that may have started out with a higher priority can become very low priority whenit is proved to have failed.
3-4 Blue Low. This event is likely to be a common function, such as a setting change or a scheduled systemscan.
5-6 Yellow Medium. This event is a potential concern, such as pre-attack scan activity, policy violations, andidentified vulnerabilities. Medium priority events are often hostile attempts whose success orfailure is not confirmed.
7-8 Orange High. This event is a concern, such as attack formations, potential breaches, or misuse, includingtraffic to a dark address space, incorrect registry values, or a SYNFlood.
9-10 Red Very high. This event is a grave concern, such as verified breaches or a DHCP packet withoutenough data. Investigate items with a very high priority immediately.
For more about calculating event priority using vulnerability and open port information, see "CalculatingEvent Priority" on page 142.
Evaluate the Priority FormulaThe priority formula (sometimes referred to as the threat level formula) consists of criteria that eachevent is evaluated against to determine its relative importance, or priority, to your network.
The priority formula consists of four factors that combine to generate an overall priority rating. Each ofthe criteria described in the table below contributes a numeric value to the priority formula, whichcalculates the overall importance, or urgency, of an individual event.
All values are between 0 and 10, where 0 is low and 10 is high. A high priority factor indicates an eventwith a higher risk. Not every high priority event is necessarily a threat, however. For example, if a criticale-mail server fails, the priority of the events reporting it may be very high, although it does notrepresent an attack on your network.
The table below describes the factors considered in the ESM priority evaluation. These values areconfigurable with HPE assistance. The maximum score for each factor is 10: if the value of conditions forthat factor is more than 10, the amount over 10 is not considered.
ESM 101Chapter 5: Priority Evaluation and Network Model Lookup
HPE ESM 7.0 Page 41 of 162
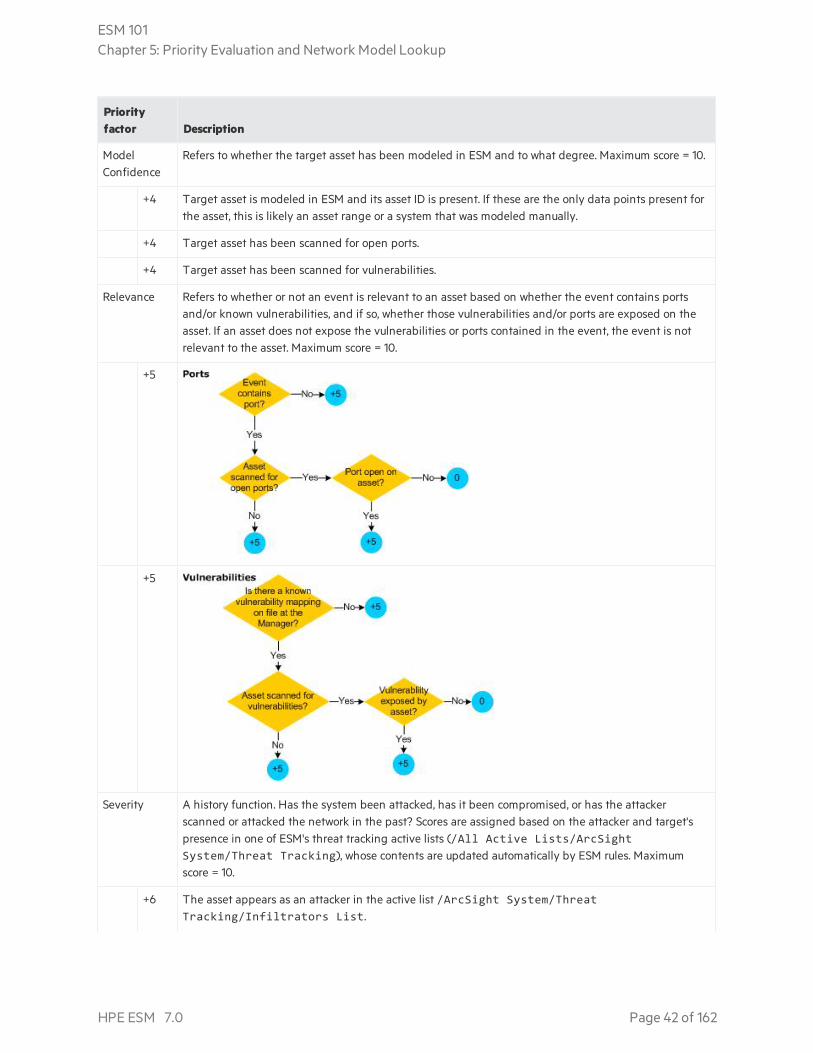
Priorityfactor Description
ModelConfidence
Refers to whether the target asset has been modeled in ESM and to what degree. Maximum score = 10.
+4 Target asset is modeled in ESM and its asset ID is present. If these are the only data points present forthe asset, this is likely an asset range or a system that was modeled manually.
+4 Target asset has been scanned for open ports.
+4 Target asset has been scanned for vulnerabilities.
Relevance Refers to whether or not an event is relevant to an asset based on whether the event contains portsand/or known vulnerabilities, and if so, whether those vulnerabilities and/or ports are exposed on theasset. If an asset does not expose the vulnerabilities or ports contained in the event, the event is notrelevant to the asset. Maximum score = 10.
+5
+5
Severity A history function. Has the system been attacked, has it been compromised, or has the attackerscanned or attacked the network in the past? Scores are assigned based on the attacker and target'spresence in one of ESM's threat tracking active lists (/All Active Lists/ArcSightSystem/Threat Tracking), whose contents are updated automatically by ESM rules. Maximumscore = 10.
+6 The asset appears as an attacker in the active list /ArcSight System/ThreatTracking/Infiltrators List.
ESM 101Chapter 5: Priority Evaluation and Network Model Lookup
HPE ESM 7.0 Page 42 of 162
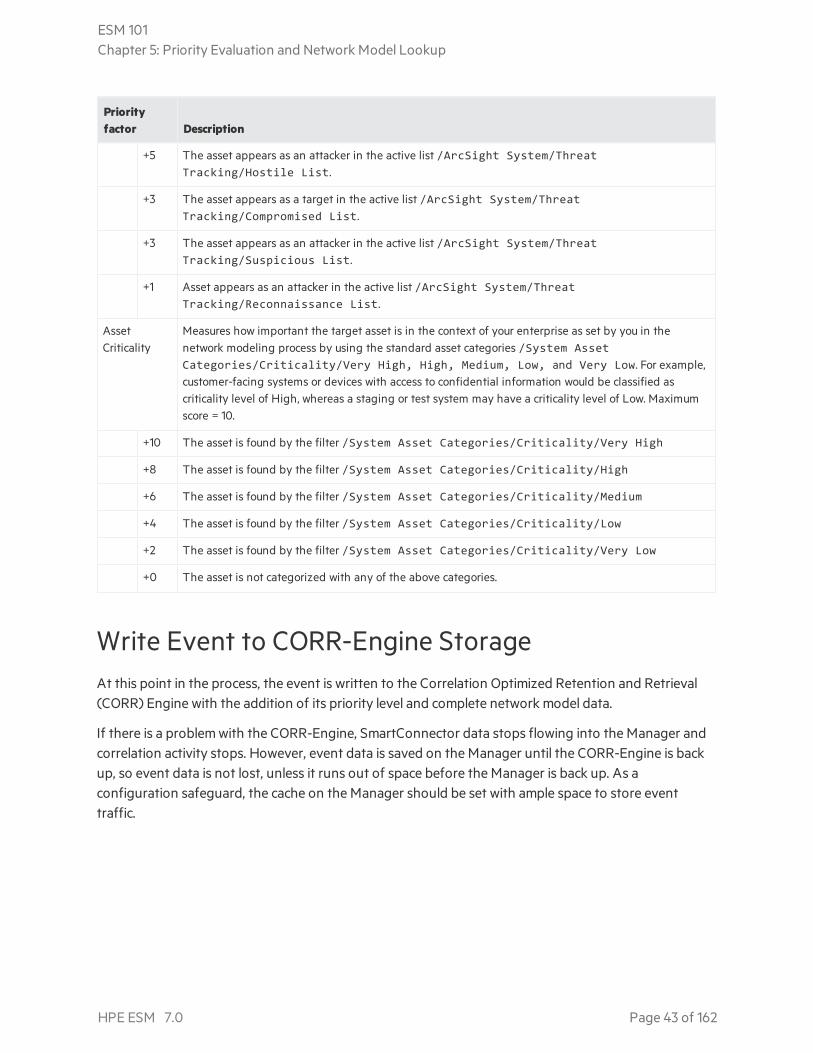
Priorityfactor Description
+5 The asset appears as an attacker in the active list /ArcSight System/ThreatTracking/Hostile List.
+3 The asset appears as a target in the active list /ArcSight System/ThreatTracking/Compromised List.
+3 The asset appears as an attacker in the active list /ArcSight System/ThreatTracking/Suspicious List.
+1 Asset appears as an attacker in the active list /ArcSight System/ThreatTracking/Reconnaissance List.
AssetCriticality
Measures how important the target asset is in the context of your enterprise as set by you in thenetwork modeling process by using the standard asset categories /System AssetCategories/Criticality/Very High, High, Medium, Low, and Very Low. For example,customer-facing systems or devices with access to confidential information would be classified ascriticality level of High, whereas a staging or test system may have a criticality level of Low. Maximumscore = 10.
+10 The asset is found by the filter /System Asset Categories/Criticality/Very High
+8 The asset is found by the filter /System Asset Categories/Criticality/High
+6 The asset is found by the filter /System Asset Categories/Criticality/Medium
+4 The asset is found by the filter /System Asset Categories/Criticality/Low
+2 The asset is found by the filter /System Asset Categories/Criticality/Very Low
+0 The asset is not categorized with any of the above categories.
Write Event to CORR-Engine StorageAt this point in the process, the event is written to the Correlation Optimized Retention and Retrieval(CORR) Engine with the addition of its priority level and complete network model data.
If there is a problem with the CORR-Engine, SmartConnector data stops flowing into the Manager andcorrelation activity stops. However, event data is saved on the Manager until the CORR-Engine is backup, so event data is not lost, unless it runs out of space before the Manager is back up. As aconfiguration safeguard, the cache on the Manager should be set with ample space to store eventtraffic.
ESM 101Chapter 5: Priority Evaluation and Network Model Lookup
HPE ESM 7.0 Page 43 of 162
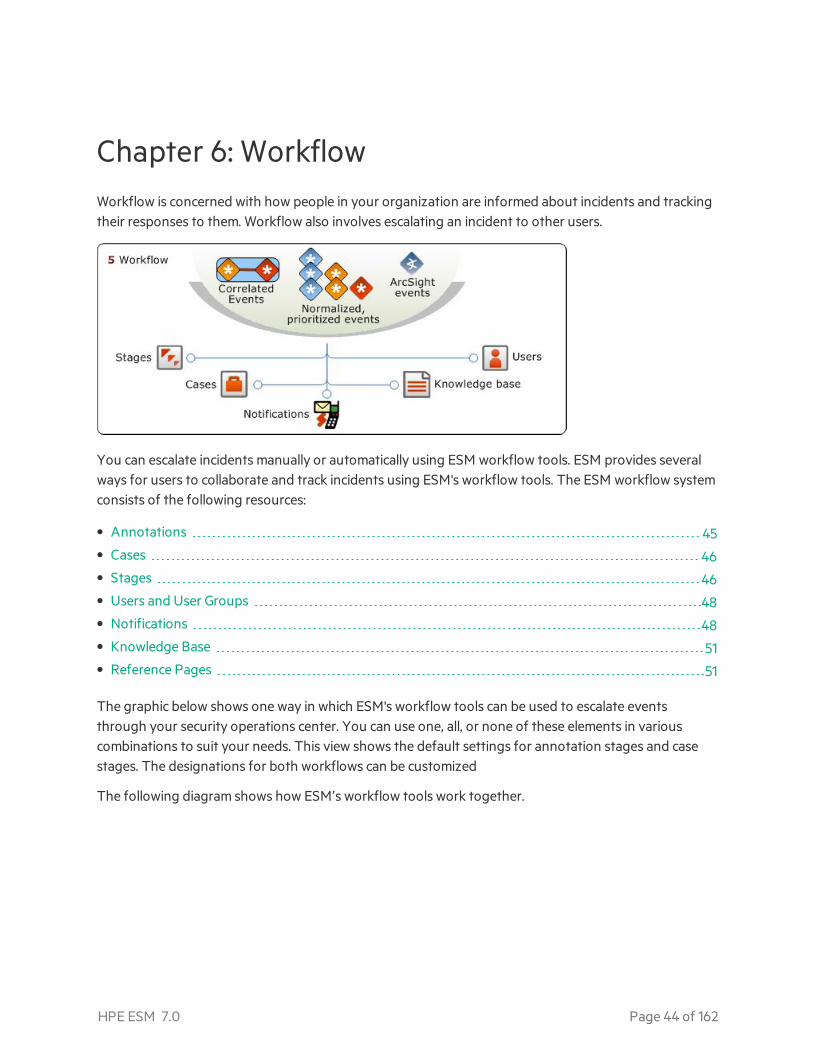
Chapter 6: WorkflowWorkflow is concerned with how people in your organization are informed about incidents and trackingtheir responses to them. Workflow also involves escalating an incident to other users.
You can escalate incidents manually or automatically using ESM workflow tools. ESM provides severalways for users to collaborate and track incidents using ESM's workflow tools. The ESM workflow systemconsists of the following resources:
• Annotations 45• Cases 46• Stages 46• Users and User Groups 48• Notifications 48• Knowledge Base 51• Reference Pages 51
The graphic below shows one way in which ESM's workflow tools can be used to escalate eventsthrough your security operations center. You can use one, all, or none of these elements in variouscombinations to suit your needs. This view shows the default settings for annotation stages and casestages. The designations for both workflows can be customized
The following diagram shows how ESM’s workflow tools work together.
HPE ESM 7.0 Page 44 of 162
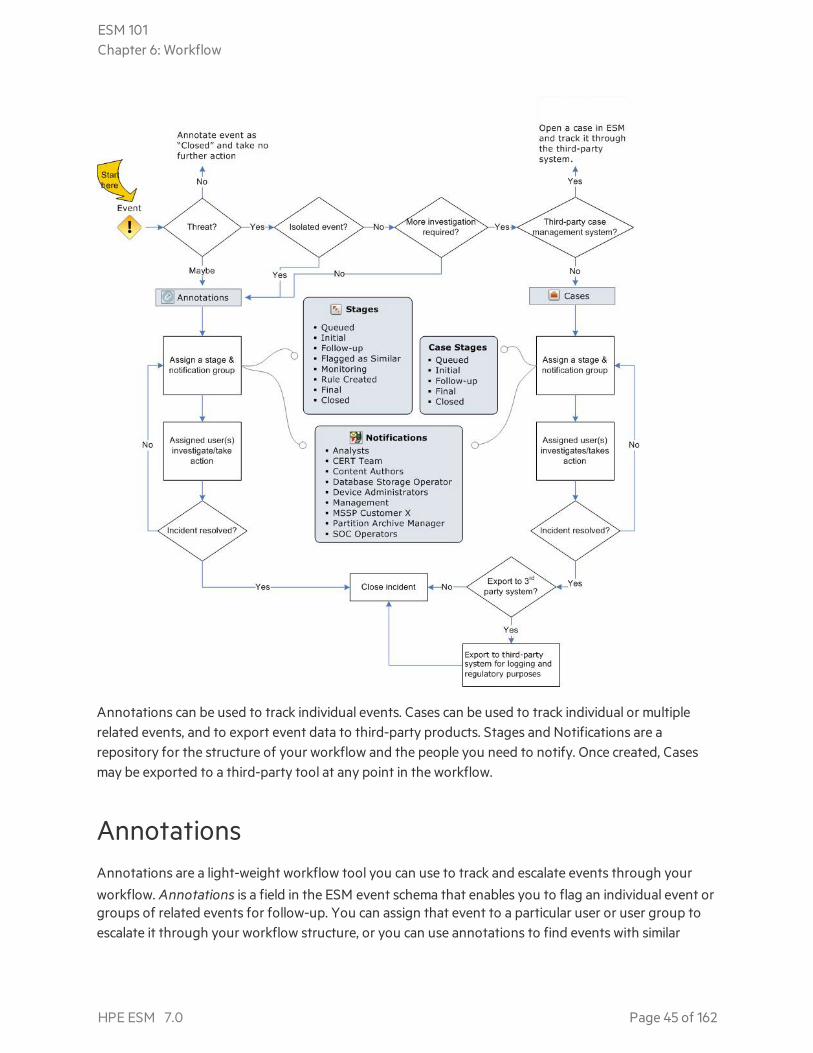
Annotations can be used to track individual events. Cases can be used to track individual or multiplerelated events, and to export event data to third-party products. Stages and Notifications are arepository for the structure of your workflow and the people you need to notify. Once created, Casesmay be exported to a third-party tool at any point in the workflow.
AnnotationsAnnotations are a light-weight workflow tool you can use to track and escalate events through your
workflow. Annotations is a field in the ESM event schema that enables you to flag an individual event orgroups of related events for follow-up. You can assign that event to a particular user or user group toescalate it through your workflow structure, or you can use annotations to find events with similar
ESM 101Chapter 6: Workflow
HPE ESM 7.0 Page 45 of 162
attributes within a specified time frame. This enables you to find new events coming into the systemwith attributes similar to the annotated event.
Annotations are not displayed as an ESM resource, but are provided as a user-editable extension of theESM event schema. (See "Event Data Fields " on page 111). They can be created through a user'snotifications in-box and the Event Annotations column in the active channel, or as an automated actionas the result of a rule trigger. Once created, they can be used as a factor anywhere event fields can becited, such as rules, data monitors, reports, filters, and so on.
Annotations are a flexible tool and can be used in different ways depending on how your workflowenvironment is set up. You can use annotations to track every event that makes it through the ESMcorrelation engine; you can use it as a triage tool before escalating an event to a case; or you can choosenot to use it at all and simply use ESM's case management system.
Whenever an annotation is created or updated, the action triggers the active channel to be refreshed toreflect the annotation changes. You can also build a channel that shows all events that have beenannotated and assigned to you for follow up.
CasesCases are ESM's built-in trouble-ticket system, designed to track individual or multiple related eventsand export event data to third-party products. Cases are designed to stand alone within ESM orintegrate with a third-party case management system.
A case is a container for information about a specific incident, usually with one or more events attached,that is used to track, investigate, and resolve events of interest. When events of concern occur, you cancreate cases and assign them to analysts, who can then investigate and resolve them based on severityand enterprise policies and practices. You can also use rules to automatically open or update a casewhen certain conditions are met.
With the ESM case management system, you can create new cases and assign them to specific groups ofusers who receive a notification with access to the case and its associated data. Those users can takeaction on the assigned case and specify other actions to be taken, assign it to another user, or resolvethe case.
StagesStages are the various steps that make up a collaborative workflow for event annotations. Once thisstructure is defined, individual events can be assigned to the various stages by security operationspersonnel who are investigating events.
Stages are assigned to individual events using event annotations. You can assign stages to an eventfrom an active channel view by right-clicking an event, or opening it in the event Inspector. Scroll down
to Event Annotation and look for the Stage series of actions.
ESM 101Chapter 6: Workflow
HPE ESM 7.0 Page 46 of 162
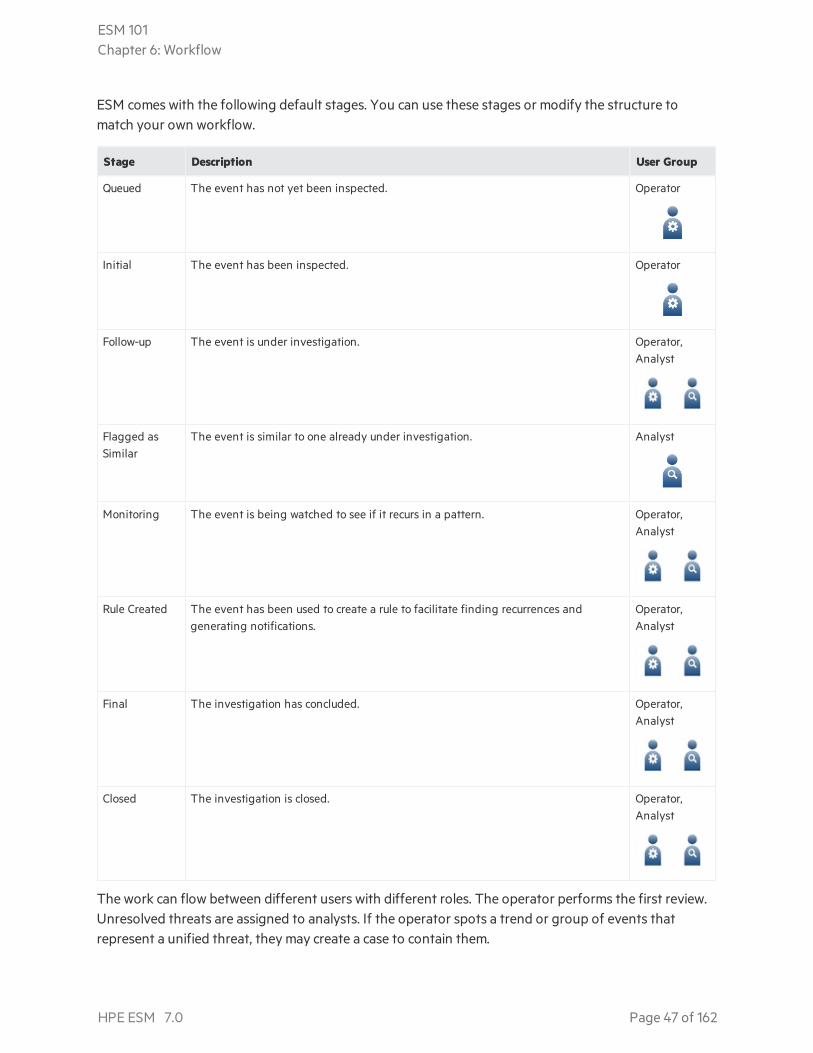
ESM comes with the following default stages. You can use these stages or modify the structure tomatch your own workflow.
Stage Description User Group
Queued The event has not yet been inspected. Operator
Initial The event has been inspected. Operator
Follow-up The event is under investigation. Operator,Analyst
Flagged asSimilar
The event is similar to one already under investigation. Analyst
Monitoring The event is being watched to see if it recurs in a pattern. Operator,Analyst
Rule Created The event has been used to create a rule to facilitate finding recurrences andgenerating notifications.
Operator,Analyst
Final The investigation has concluded. Operator,Analyst
Closed The investigation is closed. Operator,Analyst
The work can flow between different users with different roles. The operator performs the first review.Unresolved threats are assigned to analysts. If the operator spots a trend or group of events thatrepresent a unified threat, they may create a case to contain them.
ESM 101Chapter 6: Workflow
HPE ESM 7.0 Page 47 of 162
Analysts may create additional cases in order to track interesting incidents or to expose the incident toan external database. Once the case or event has been closed, a supervisor may review that decision andeither finalize the closure, or re-open the case or annotated event.
Users and User GroupsThe Users resource is where the ESM administrator registers new users. Individuals can use the Usersresource to manage their profiles, including contact information.
Users gain access to resources according to the user groups they belong to, and it is also at the Usersresource where the administrator creates and manages user groups. Permissions to view and editresources is granted to user groups.
Users can also view the attributes of the user groups to which they belong to find out what permissionsthey have to read from and write to certain resource groups. These settings are accessed in the ACLeditor, which is described in more detail in "Access Control Lists (ACLs)" on page 159.
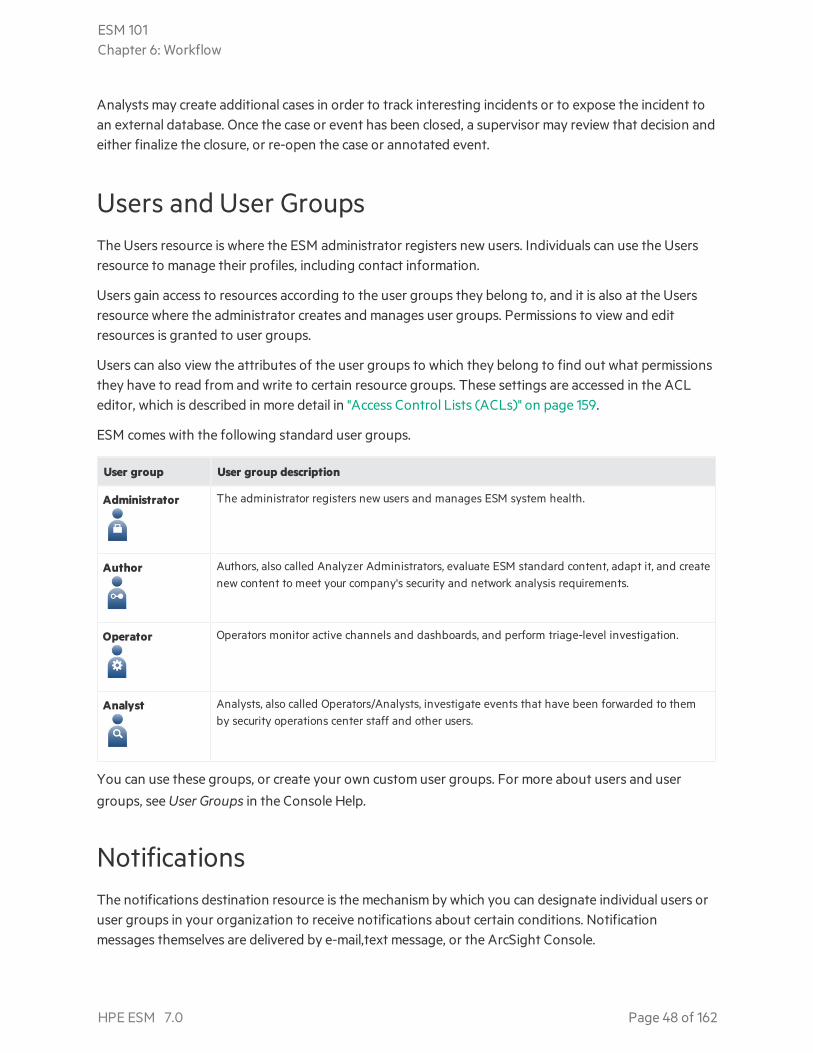
ESM comes with the following standard user groups.
User group User group description
Administrator The administrator registers new users and manages ESM system health.
Author Authors, also called Analyzer Administrators, evaluate ESM standard content, adapt it, and createnew content to meet your company's security and network analysis requirements.
Operator Operators monitor active channels and dashboards, and perform triage-level investigation.
Analyst Analysts, also called Operators/Analysts, investigate events that have been forwarded to themby security operations center staff and other users.
You can use these groups, or create your own custom user groups. For more about users and user
groups, see User Groups in the Console Help.
NotificationsThe notifications destination resource is the mechanism by which you can designate individual users oruser groups in your organization to receive notifications about certain conditions. Notificationmessages themselves are delivered by e-mail,text message, or the ArcSight Console.
ESM 101Chapter 6: Workflow
HPE ESM 7.0 Page 48 of 162
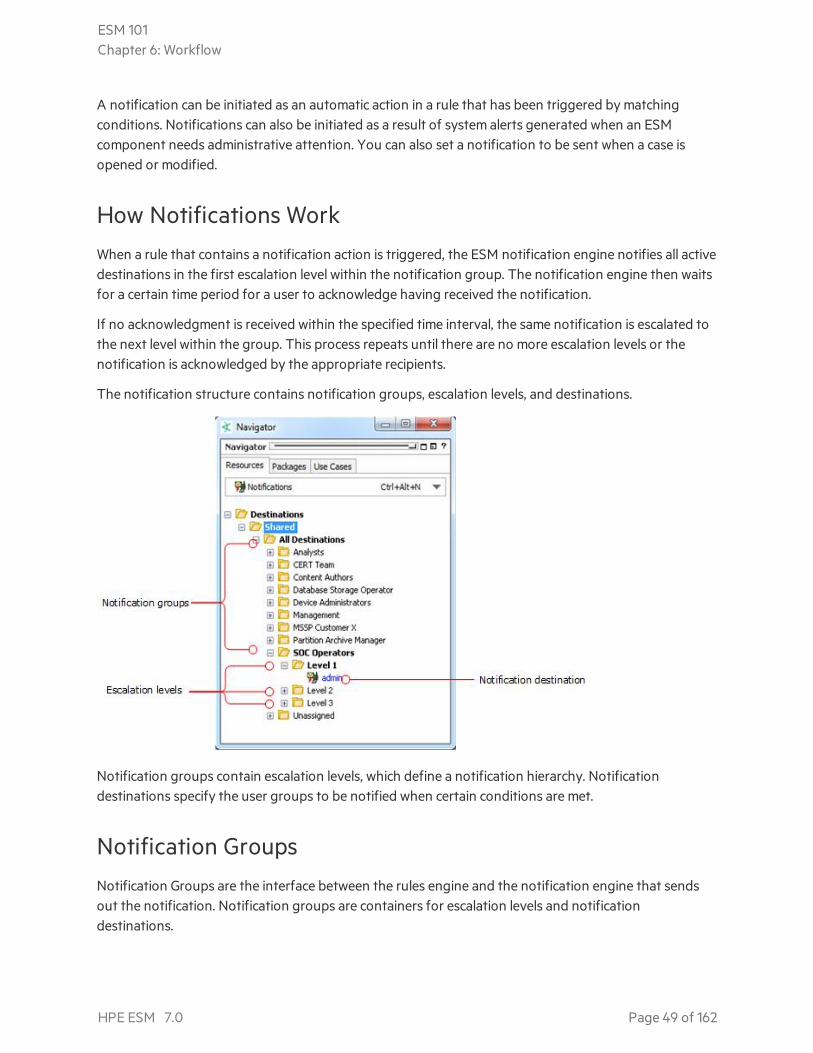
A notification can be initiated as an automatic action in a rule that has been triggered by matchingconditions. Notifications can also be initiated as a result of system alerts generated when an ESMcomponent needs administrative attention. You can also set a notification to be sent when a case isopened or modified.
How Notifications WorkWhen a rule that contains a notification action is triggered, the ESM notification engine notifies all activedestinations in the first escalation level within the notification group. The notification engine then waitsfor a certain time period for a user to acknowledge having received the notification.
If no acknowledgment is received within the specified time interval, the same notification is escalated tothe next level within the group. This process repeats until there are no more escalation levels or thenotification is acknowledged by the appropriate recipients.
The notification structure contains notification groups, escalation levels, and destinations.
Notification groups contain escalation levels, which define a notification hierarchy. Notificationdestinations specify the user groups to be notified when certain conditions are met.
Notification GroupsNotification Groups are the interface between the rules engine and the notification engine that sendsout the notification. Notification groups are containers for escalation levels and notificationdestinations.
ESM 101Chapter 6: Workflow
HPE ESM 7.0 Page 49 of 162
The example above shows the standard notification groups included with ESM. You can add escalationlevels and notification destinations to these, or create your own notification groups.
Escalation LevelsEscalation levels define a hierarchy structure for whom to notify in what order. There can be anynumber of escalation levels within a notification group. Each escalation level can contain multiplenotification destinations.
The example above shows the standard escalation levels defined for the notification group securitycenter Operators in ESM's standard content. Level 1 contains one notification destination, the standarduser group Administrators.
Notification DestinationsA notification destination is the entity to be notified of a specific condition. The notificationdestinations are what you can select from when adding a notification to a rule action. A notificationdestination can be a user or a network entity, such as a scanner or firewall.
If the notification destination is a user, any contact information entered for the user, such as e-mailaddress and phone number, is automatically populated from the user's profile. In the notificationdestination editor, you can also change the user's contact information without changing the user'sprofile.
If the notification destination is a network entity, the notification can be to execute an automated scriptor command.
Each destination can have an associated start and end time, which is the time period during the daywhen the destination is expected to be active. For example, one notification destination can be for theday shift with a start time of 9:00 AM and an end time of 5:00 PM, and another can be an after-hoursshift.
Notification AcknowledgementsWhen a notification is sent to a user who is logged into an ArcSight Console or ArcSight CommandCenter, the user is notified through the notification status button on their display.
The notification may just be informational and require no response, or it may require that a userrespond within a certain timeframe before escalating the notification to another user or user group.
ESM 101Chapter 6: Workflow
HPE ESM 7.0 Page 50 of 162
Knowledge BaseYour organization may require that certain procedures should be followed for particular incidents, forexample, incidents that require Sarbanes-Oxley disclosure.
The ESM Knowledge Base is a resource that enables you to post data, such as protocols to be followed,to an internal web site that you have created. An operator or analyst can then associate cases, reports,filters, or individual events with a knowledge base article that informs other users about a standardresponse, a procedure, or company policy.
The ESM Knowledge base is a way to ensure your users have access to the additional information theyneed in the context they need it. This can also be a regulatory compliance feature.
Knowledge base articles are built by importing text or HTML files. For details about how to set up andmanage knowledge base articles, see Knowledge Base Authoring in the ArcSight Console Help.
Reference PagesReference pages are a pointer to an internal or external web page where a user can find moreinformation about the following objects:
l Resource groups
l Individual events
l Vulnerabilities
Reference pages are available in the right-click context menu for these objects. If you click the Referencepage link and a reference page is not specified for the object, an error message appears.
Reference page content is launched in the default web browser.
References Pages for Resource GroupsResource groups in the Navigator panel can have a reference page URL attached to point users to aninternal or external URL. You can add your own reference pages, as needed, to annotate the resourcegroups in your Navigator panel tree.
Reference Pages for EventsMany devices generate a device event class ID and template to determine what the event means fromthe device that produced it, such as Windows common event log.
ESM 101Chapter 6: Workflow
HPE ESM 7.0 Page 51 of 162

These configurations, if present for the devices installed in your environment, are stored on theManager. You access them from the ArcSight Console when you right-click an event. That launchesyour browser to look up a vendor's description of that event on the vendor's web page or associateddevice Help page.
Reference Pages for VulnerabilitiesThe Vulnerability groups that come with ESM standard content provide links to the vendor web sitesthat publish associated vulnerability data. This helps ensure that users have access to the latestvulnerability data associated with a particular product.
ESM 101Chapter 6: Workflow
HPE ESM 7.0 Page 52 of 162
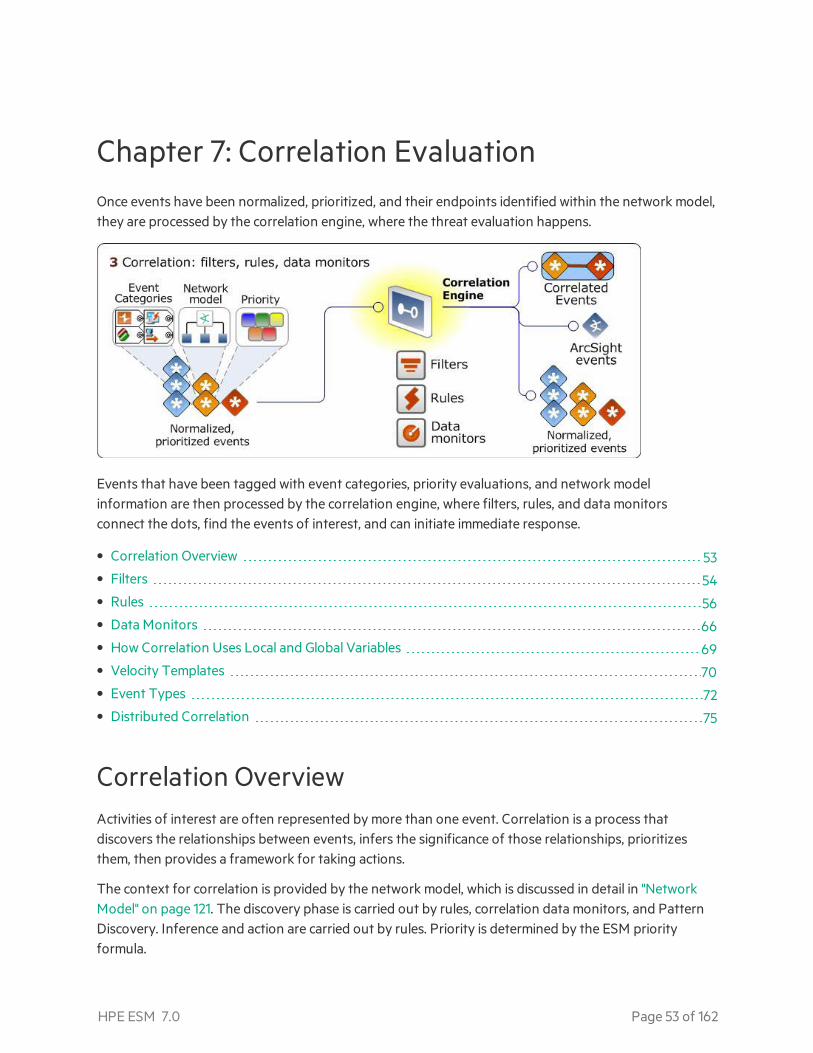
Chapter 7: Correlation EvaluationOnce events have been normalized, prioritized, and their endpoints identified within the network model,they are processed by the correlation engine, where the threat evaluation happens.
Events that have been tagged with event categories, priority evaluations, and network modelinformation are then processed by the correlation engine, where filters, rules, and data monitorsconnect the dots, find the events of interest, and can initiate immediate response.
• Correlation Overview 53• Filters 54• Rules 56• Data Monitors 66• How Correlation Uses Local and Global Variables 69• Velocity Templates 70• Event Types 72• Distributed Correlation 75
Correlation OverviewActivities of interest are often represented by more than one event. Correlation is a process thatdiscovers the relationships between events, infers the significance of those relationships, prioritizesthem, then provides a framework for taking actions.
The context for correlation is provided by the network model, which is discussed in detail in "NetworkModel" on page 121. The discovery phase is carried out by rules, correlation data monitors, and PatternDiscovery. Inference and action are carried out by rules. Priority is determined by the ESM priorityformula.
HPE ESM 7.0 Page 53 of 162
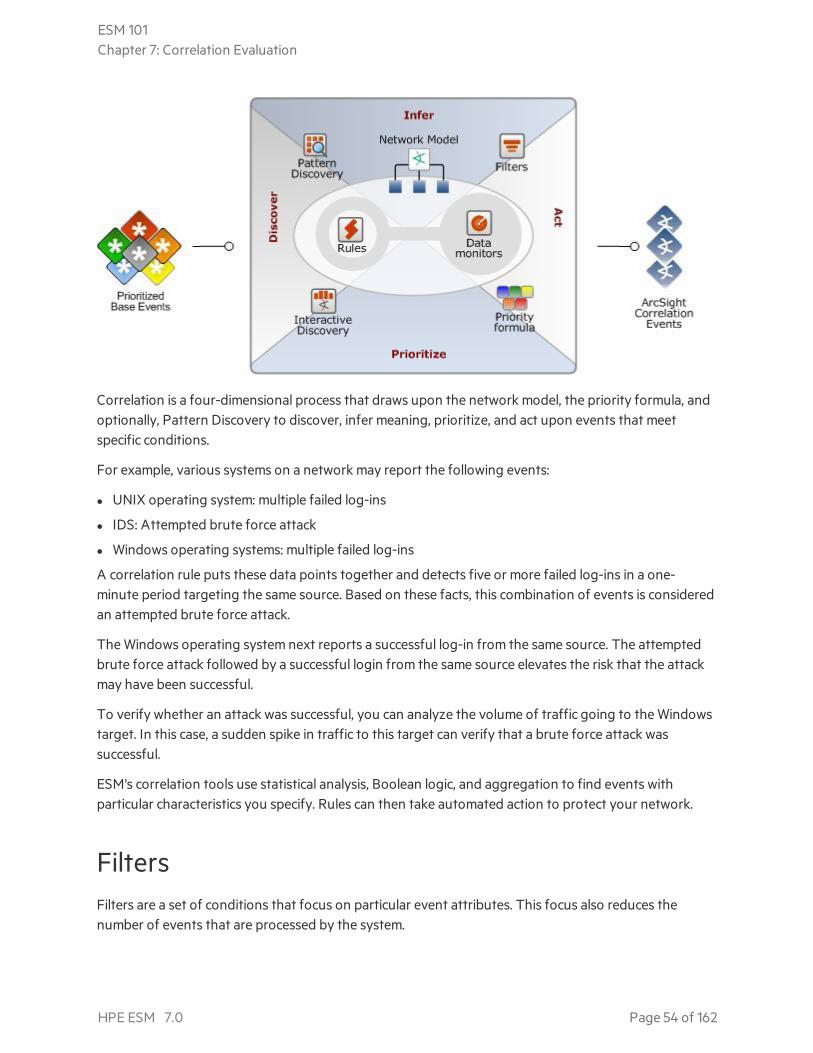
Correlation is a four-dimensional process that draws upon the network model, the priority formula, andoptionally, Pattern Discovery to discover, infer meaning, prioritize, and act upon events that meetspecific conditions.
For example, various systems on a network may report the following events:
l UNIX operating system: multiple failed log-ins
l IDS: Attempted brute force attack
l Windows operating systems: multiple failed log-ins
A correlation rule puts these data points together and detects five or more failed log-ins in a one-minute period targeting the same source. Based on these facts, this combination of events is consideredan attempted brute force attack.
The Windows operating system next reports a successful log-in from the same source. The attemptedbrute force attack followed by a successful login from the same source elevates the risk that the attackmay have been successful.
To verify whether an attack was successful, you can analyze the volume of traffic going to the Windowstarget. In this case, a sudden spike in traffic to this target can verify that a brute force attack wassuccessful.
ESM's correlation tools use statistical analysis, Boolean logic, and aggregation to find events withparticular characteristics you specify. Rules can then take automated action to protect your network.
FiltersFilters are a set of conditions that focus on particular event attributes. This focus also reduces thenumber of events that are processed by the system.
ESM 101Chapter 7: Correlation Evaluation
HPE ESM 7.0 Page 54 of 162
Filters are applied in many places in the event life cycle by SmartConnectors, the Manager, and thecorrelation engine. Filters are also used for monitoring, analysis, and reporting.
Filters applied at the SmartConnector select only events that match the conditions, and it is theseevents that are forwarded to the Manager for processing. Non-matching events are not forwarded tothe Manager.
Filters applied at the Manager select which events it will process based on the conditions specified.Events that don't meet the conditions are not evaluated further, but they are preserved in the datastore.
Construct filter condition statements using ESM's Common Conditions Editor (CCE). If the criteria aremet, the evaluation returns true or false. All conditions constructed by the CCE are expressions thatconsist of a value or variable, an operator (such as not, and, or), and a second value or variable bywhich the first value is evaluated.
ESM filters come in two major forms:
l Named conditions (Filters resource)
l Unnamed conditions
Named Conditions (Filters Resource)A filter resource is a named object that other resources and SmartConnectors can reference. Filterresources are reusable, and you can transport them among Managers using Packages. If you need touse the same condition in multiple places, create a filter resource, which you can then refer to in rules,reports, data monitors, and active channels.
ESM comes with pre-built filters that support the standard ESM foundations and core content.
Unnamed ConditionsUnnamed conditions reside within another resource, and are used to specify conditions that are appliedlocally by that resource only. You can specify unnamed conditions as part of an active channel, rule, orreport. These conditions are saved as part of the resource in which they were created, and are notreusable by other resources.
Much of ESM's standard content also contains unnamed conditions designed to work in conjunctionwith ESM's other standard resources.
Filters in Active ChannelsAn active channel displays a stream of events defined by parameters set in the active channel editor.Active channels are defined and described in detail in the topic "Active Channels" on page 79. The activechannel has several ways that filters and unnamed conditions can be applied:
ESM 101Chapter 7: Correlation Evaluation
HPE ESM 7.0 Page 55 of 162
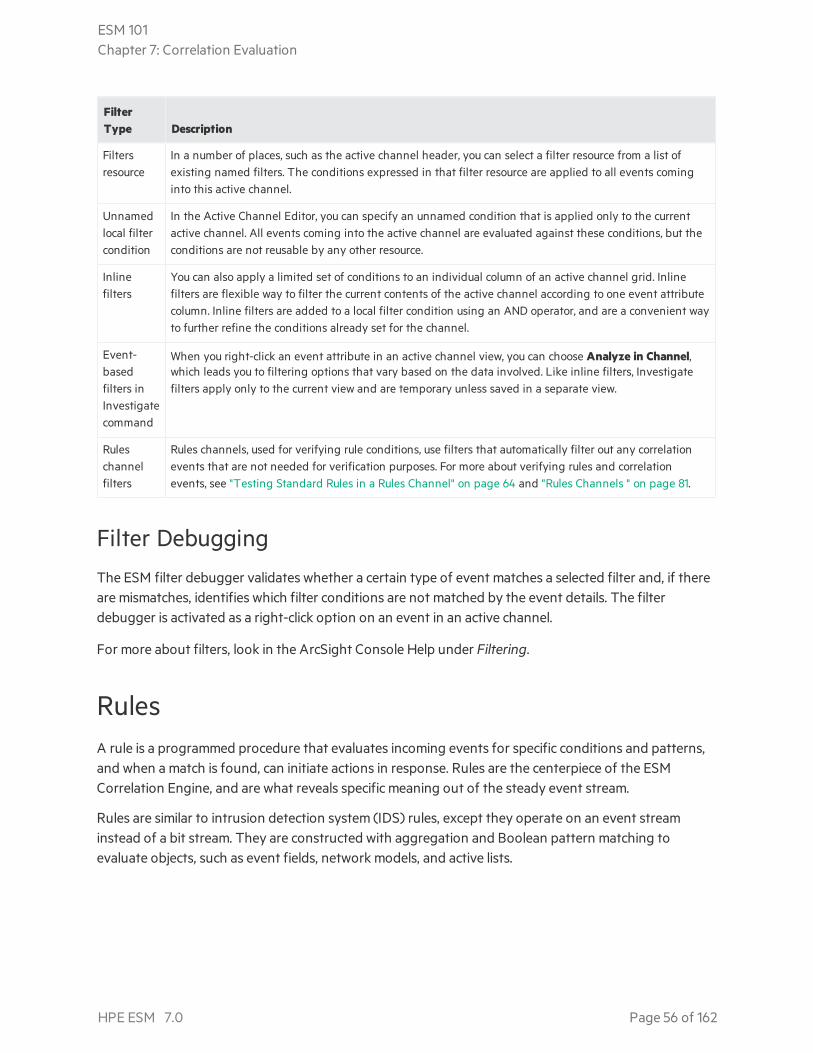
FilterType Description
Filtersresource
In a number of places, such as the active channel header, you can select a filter resource from a list ofexisting named filters. The conditions expressed in that filter resource are applied to all events cominginto this active channel.
Unnamedlocal filtercondition
In the Active Channel Editor, you can specify an unnamed condition that is applied only to the currentactive channel. All events coming into the active channel are evaluated against these conditions, but theconditions are not reusable by any other resource.
Inlinefilters
You can also apply a limited set of conditions to an individual column of an active channel grid. Inlinefilters are flexible way to filter the current contents of the active channel according to one event attributecolumn. Inline filters are added to a local filter condition using an AND operator, and are a convenient wayto further refine the conditions already set for the channel.
Event-basedfilters inInvestigatecommand
When you right-click an event attribute in an active channel view, you can choose Analyze in Channel,which leads you to filtering options that vary based on the data involved. Like inline filters, Investigatefilters apply only to the current view and are temporary unless saved in a separate view.
Ruleschannelfilters
Rules channels, used for verifying rule conditions, use filters that automatically filter out any correlationevents that are not needed for verification purposes. For more about verifying rules and correlationevents, see "Testing Standard Rules in a Rules Channel" on page 64 and "Rules Channels " on page 81.
Filter DebuggingThe ESM filter debugger validates whether a certain type of event matches a selected filter and, if thereare mismatches, identifies which filter conditions are not matched by the event details. The filterdebugger is activated as a right-click option on an event in an active channel.
For more about filters, look in the ArcSight Console Help under Filtering.
RulesA rule is a programmed procedure that evaluates incoming events for specific conditions and patterns,and when a match is found, can initiate actions in response. Rules are the centerpiece of the ESMCorrelation Engine, and are what reveals specific meaning out of the steady event stream.
Rules are similar to intrusion detection system (IDS) rules, except they operate on an event streaminstead of a bit stream. They are constructed with aggregation and Boolean pattern matching toevaluate objects, such as event fields, network models, and active lists.
ESM 101Chapter 7: Correlation Evaluation
HPE ESM 7.0 Page 56 of 162
How Rules WorkRules express conditions against which the event stream is evaluated. These conditions can cross-reference:
l The network model (see "Network Model" on page 121)
l The asset model (see "Asset Model" on page 139)
l The Priority Formula (see "Evaluate the Priority Formula" on page 41)
l Active lists (see "How Rules Use Active Lists" on page 61)
l Session lists ("How Rules Use Session Lists" on page 63)
Rules can be constructed modularly to make use of blocks of other conditions expressed in:
l Filters
l Other rules
l Correlation data monitors
Rules must be activated in order to run on live data. When a rule is under development, you can test iton historical data on a local system before activating it on a live event stream. When activated, rulesevaluate each event for the conditions specified.
Rules whose conditions have been met generate an ESM event called a correlation event, which is fedback into the event life cycle at the Manager, and is itself evaluated by the Manager and correlationprocesses.
There are three types of rules available in ESM: standard, lightweight, and pre-persistence.
Standard RulesStandard rules are triggered when events match one or more set of conditions, for example, events thattarget a critical asset and are categorized as hostile.
You can configure a rule to aggregate (consolidate) events with matching attributes that occur withinsome set time interval. For example, if the rule is configured to aggregate three matching events, therule is triggered when those three matching events occur in the time limit specified.
Joins
Standard rules can have joins. A join means to connect events from different network nodes in order tounderstand attributes they may have in common. Join rules recognize patterns that involve more thanone type of event. Join rules are triggered by events that match two or more sets of conditions, butthere is no time interval involved other than the time interval represented by the amount of event datayou have available to match against.
ESM 101Chapter 7: Correlation Evaluation
HPE ESM 7.0 Page 57 of 162
For example, a join rule can be triggered if there is an event from your intrusion detection system and acorresponding permit event from the firewall, and both target the same asset on the same port from thesame attacker. If the join rule is configured for aggregation, the rule is triggered if the specified numberof matching events occur within the specified time frame.
Because join rules count and track potential matches in working memory, they can also be memory-intensive.
Lightweight and Pre-persistence RulesLightweight and pre-persistence rules are designed for simplicity and performance. Each type has onlyone event condition (no joins), is triggered on every matching event, has no aggregation, and does notgenerate correlation events although rule failures are logged.
Lightweight rules can only act on active and session lists and are processed earlier in the flow thanstandard rules.
Event-enriching pre-persistence rules are best used for threat level formula analysis. These rules setvalues for incoming base events before the events themselves are persisted in the database. Pre-persistence rules are processed early in the workflow, however, the values they set are available tostandard and lightweight rules that run during the post-persistence event flow. Pre-persistence rulescannot be scheduled or replayed, since events occurring in the past have already been persisted and canno longer be modified.
Rule AggregationStandard rules can aggregate, or summarize and consolidate, events with matching (or not matching)values over a specified time frame.
Event aggregation can be performed on the initial event stream at the SmartConnector, as described in"Filter and Aggregate Events" on page 36; and again at the Manager, by rules. Aggregation applied atthe SmartConnector consolidates numerous repetitive events (events with the same essential data, suchas firewall events) to reduce the volume of events sent to the Manager without losing crucial event data.The SmartConnector generates a single event whose event type is aggregated event.
Aggregation applied by rules also groups together events with similar characteristics, but with theadded benefit of being able to send a correlation event when matches occur, and trigger actions, suchas sending a notification if the number of matches meets a certain threshold. For example, a user mayonly want to be notified if there are more than five login failures in one minute.
Aggregation matches are counted and tracked in working memory, so rules with aggregation conditionscan be memory-intensive, depending on what they evaluate.
ESM 101Chapter 7: Correlation Evaluation
HPE ESM 7.0 Page 58 of 162
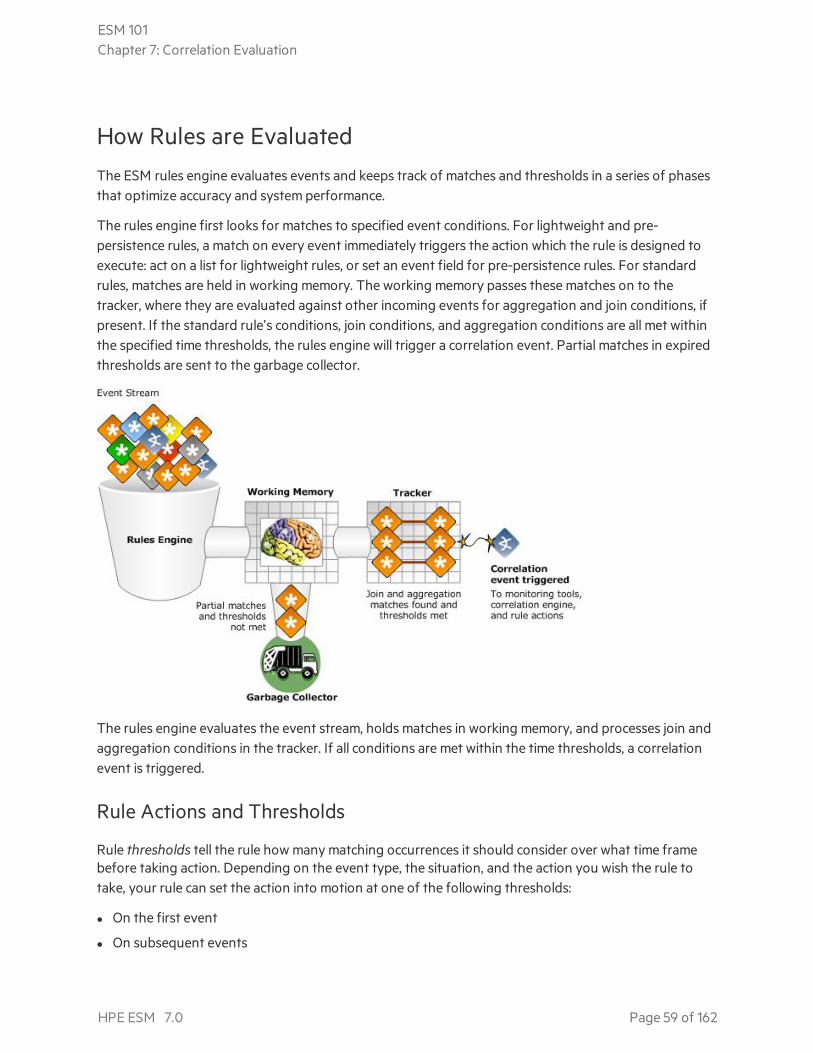
How Rules are EvaluatedThe ESM rules engine evaluates events and keeps track of matches and thresholds in a series of phasesthat optimize accuracy and system performance.
The rules engine first looks for matches to specified event conditions. For lightweight and pre-persistence rules, a match on every event immediately triggers the action which the rule is designed toexecute: act on a list for lightweight rules, or set an event field for pre-persistence rules. For standardrules, matches are held in working memory. The working memory passes these matches on to thetracker, where they are evaluated against other incoming events for aggregation and join conditions, ifpresent. If the standard rule’s conditions, join conditions, and aggregation conditions are all met withinthe specified time thresholds, the rules engine will trigger a correlation event. Partial matches in expiredthresholds are sent to the garbage collector.
The rules engine evaluates the event stream, holds matches in working memory, and processes join andaggregation conditions in the tracker. If all conditions are met within the time thresholds, a correlationevent is triggered.
Rule Actions and Thresholds
Rule thresholds tell the rule how many matching occurrences it should consider over what time framebefore taking action. Depending on the event type, the situation, and the action you wish the rule totake, your rule can set the action into motion at one of the following thresholds:
l On the first event
l On subsequent events
ESM 101Chapter 7: Correlation Evaluation
HPE ESM 7.0 Page 59 of 162
l On every event (This is the only threshold available for lightweight and pre-persistence rules)
l On first threshold
l On subsequent thresholds
l On every threshold
l On time unit
l On time window expiration
When the threshold is met, a rule can take action, such as notify other users, execute a script, add anevent to an active list, add an event to a case, or export the event to a third-party system. Forlightweight rules, the action is limited to creating or updating an active or session list. For pre-persistence rules, the action lis limited to setting an event field.
When a standard rule’s action is triggered by a threshold, the system generates an action event, which isa type of audit event that is used by ESM to keep track of system status and event processing statistics.All audit events, including action events, are sent back through the correlation engine, where they canbe evaluated by other filters, rules, data monitors, and active lists that are looking for specific types ofaudit events. Audit events can be tracked in active channels, and can be useful to those who need tomonitor, administrate, and report on ESM system health and behavior.
ESM automatically disables rules that are triggered excessively, or that are triggered by their owncorrelation events, such as join rules that create a greater number of correlation events than the inputevents that trigger them.
For more about integration commands, see "Integration Commands" on page 92.
Correlation Events Triggered by Rules
Only "Standard Rules" on page 57 generate correlation events.
When all rule conditions and thresholds are met, ESM generates a correlation event. A correlation eventrepresents the events that contributed to the rule being triggered and the relevant data contained inthem. Correlation events are signified in the active channel with a flash icon:
These correlation events are among the items that security operations center staff and analysts want towatch, because they represent rules that have already evaluated the event stream and made thecorrelations and inferences that operators and analysts would be interested in investigating.
Correlation data monitors, discussed in "Correlation Data Monitors" on page 68, also trigger correlationevents.
When a correlation event is generated, it goes through the event life cycle starting at the Manager(summarized in "Life Cycle of an Event Through ESM" on page 28), as if it were a normalized eventreceived from a SmartConnector. When the correlation event passes through the correlation engineagain, it is evaluated by other rules and data monitors that are looking for correlation events with
ESM 101Chapter 7: Correlation Evaluation
HPE ESM 7.0 Page 60 of 162
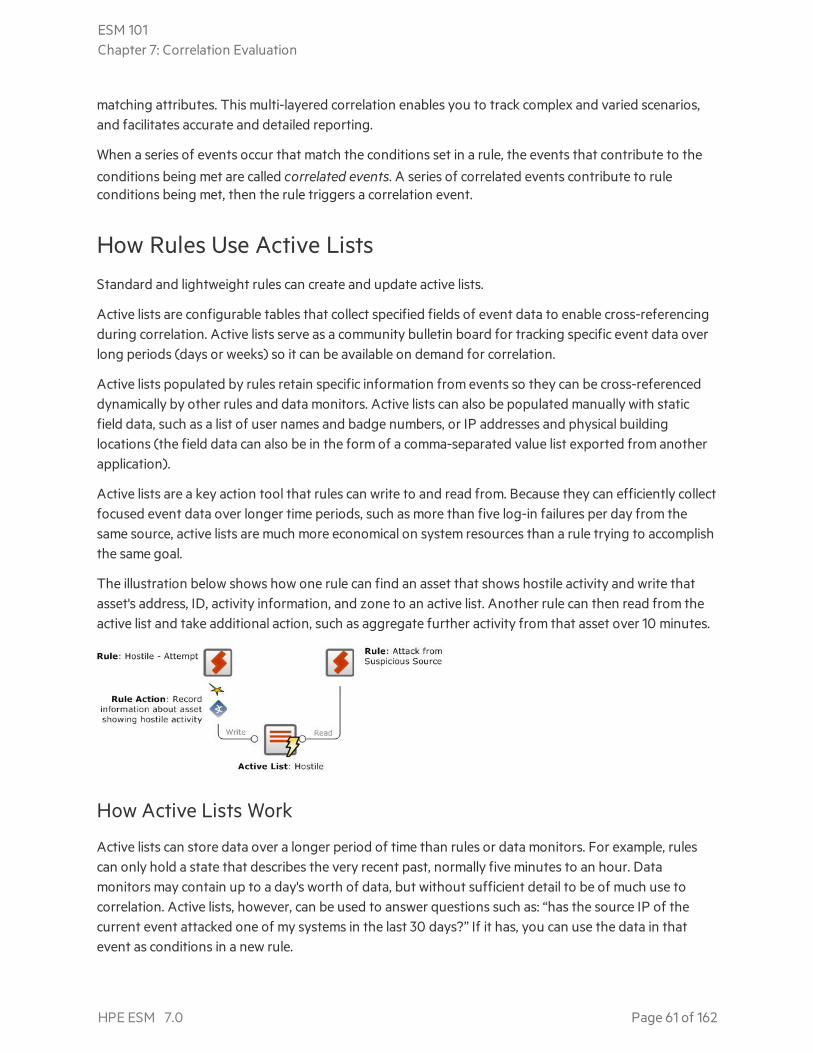
matching attributes. This multi-layered correlation enables you to track complex and varied scenarios,and facilitates accurate and detailed reporting.
When a series of events occur that match the conditions set in a rule, the events that contribute to theconditions being met are called correlated events. A series of correlated events contribute to ruleconditions being met, then the rule triggers a correlation event.
How Rules Use Active ListsStandard and lightweight rules can create and update active lists.
Active lists are configurable tables that collect specified fields of event data to enable cross-referencingduring correlation. Active lists serve as a community bulletin board for tracking specific event data overlong periods (days or weeks) so it can be available on demand for correlation.
Active lists populated by rules retain specific information from events so they can be cross-referenceddynamically by other rules and data monitors. Active lists can also be populated manually with staticfield data, such as a list of user names and badge numbers, or IP addresses and physical buildinglocations (the field data can also be in the form of a comma-separated value list exported from anotherapplication).
Active lists are a key action tool that rules can write to and read from. Because they can efficiently collectfocused event data over longer time periods, such as more than five log-in failures per day from thesame source, active lists are much more economical on system resources than a rule trying to accomplishthe same goal.
The illustration below shows how one rule can find an asset that shows hostile activity and write thatasset's address, ID, activity information, and zone to an active list. Another rule can then read from theactive list and take additional action, such as aggregate further activity from that asset over 10 minutes.
How Active Lists Work
Active lists can store data over a longer period of time than rules or data monitors. For example, rulescan only hold a state that describes the very recent past, normally five minutes to an hour. Datamonitors may contain up to a day's worth of data, but without sufficient detail to be of much use tocorrelation. Active lists, however, can be used to answer questions such as: “has the source IP of thecurrent event attacked one of my systems in the last 30 days?” If it has, you can use the data in thatevent as conditions in a new rule.
ESM 101Chapter 7: Correlation Evaluation
HPE ESM 7.0 Page 61 of 162
Items that get placed on an active list are the result of inference. During correlation, meaning is inferredabout an event or group of events based on their context. Active lists should be reserved for non-temporal activity, that is, activity from systems whose state is consistent and not session-based, and notsomething that may be resolved immediately by an automated process.
For example, if a system is compromised, you can add it to a compromise list if its compromised statemust be resolved by a person rather than by an automated lock-down script. You can use the active listto collect all the events that occur on the asset while it is compromised, which you can use for trackingand further investigation.
The data stored in an active list usually takes the form of data pairs, such as the zone and address of asuspicious source. This data can then be used for correlation, analysis, and reporting.
There are two types of active lists:
l Event based -- Event-based active lists retain specific data from live events, and are populatedautomatically as the result of a rule action triggered by qualifying events. Event-based lists have anexplicit event field tied to every field in the active list.
For example, you can configure a rule to look for three failed login attempts in one minute. When therule is triggered, it generates a correlation event and populates an active list with the event data forthe login attempts.
l Fields based -- Fields-based active lists contain data that is not part of the event data, and are thuspopulated by the user manually, or by importing a comma-separated value list exported from anotherapplication. Rules use this list as as a reference lookup table.
For example, you could manually populate an active list with the user login names of all theemployees in the IT department. Then you can write a rule that looks for special administrator loginson critical assets to which only members of the IT department are authorized access. The rule thenchecks for login attempts by employees who are not on the this fields-based active list.
An active list can also be both event-based and fields-based. That is, you can populate an active list withfield data, then also have a rule write additional entries to the list when certain event conditions are met.
Active lists can be read by all resources that express conditions except those used by active channels.This includes the priority formula, filters, rules, data monitors, reports, and Pattern Discovery.
Active lists support the following actions from rules and Pattern Discovery:
Function Description
Add to active list Adds the event data to the active list. How the information is used by other resources depends onthe purpose of the list.
Remove fromactive list
Removes the event data from the active list.
Once an asset has been cleared of the conditions that qualified it for the list, you can remove it from thelist manually using the Active List Editor. You can also set a rule or Pattern Discovery action to removean item from an active list under certain conditions.
ESM 101Chapter 7: Correlation Evaluation
HPE ESM 7.0 Page 62 of 162
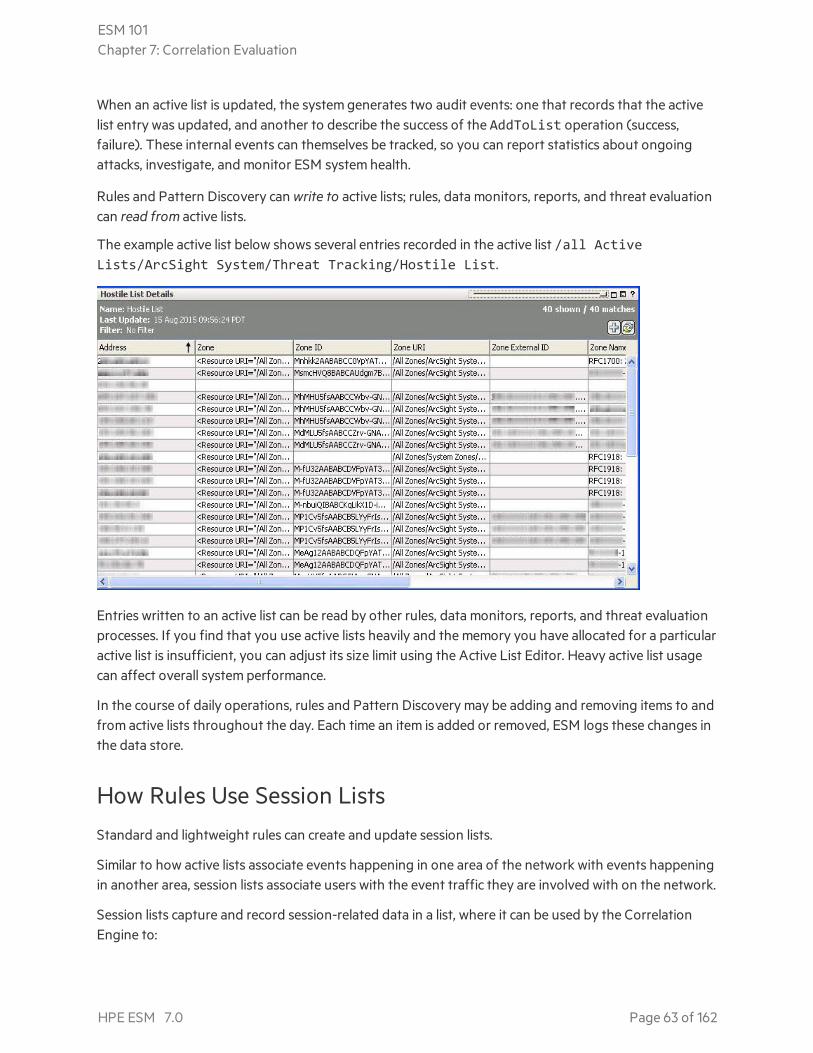
When an active list is updated, the system generates two audit events: one that records that the activelist entry was updated, and another to describe the success of the AddToList operation (success,failure). These internal events can themselves be tracked, so you can report statistics about ongoingattacks, investigate, and monitor ESM system health.
Rules and Pattern Discovery can write to active lists; rules, data monitors, reports, and threat evaluationcan read from active lists.
The example active list below shows several entries recorded in the active list /all ActiveLists/ArcSight System/Threat Tracking/Hostile List.
Entries written to an active list can be read by other rules, data monitors, reports, and threat evaluationprocesses. If you find that you use active lists heavily and the memory you have allocated for a particularactive list is insufficient, you can adjust its size limit using the Active List Editor. Heavy active list usagecan affect overall system performance.
In the course of daily operations, rules and Pattern Discovery may be adding and removing items to andfrom active lists throughout the day. Each time an item is added or removed, ESM logs these changes inthe data store.
How Rules Use Session ListsStandard and lightweight rules can create and update session lists.
Similar to how active lists associate events happening in one area of the network with events happeningin another area, session lists associate users with the event traffic they are involved with on the network.
Session lists capture and record session-related data in a list, where it can be used by the CorrelationEngine to:
ESM 101Chapter 7: Correlation Evaluation
HPE ESM 7.0 Page 63 of 162
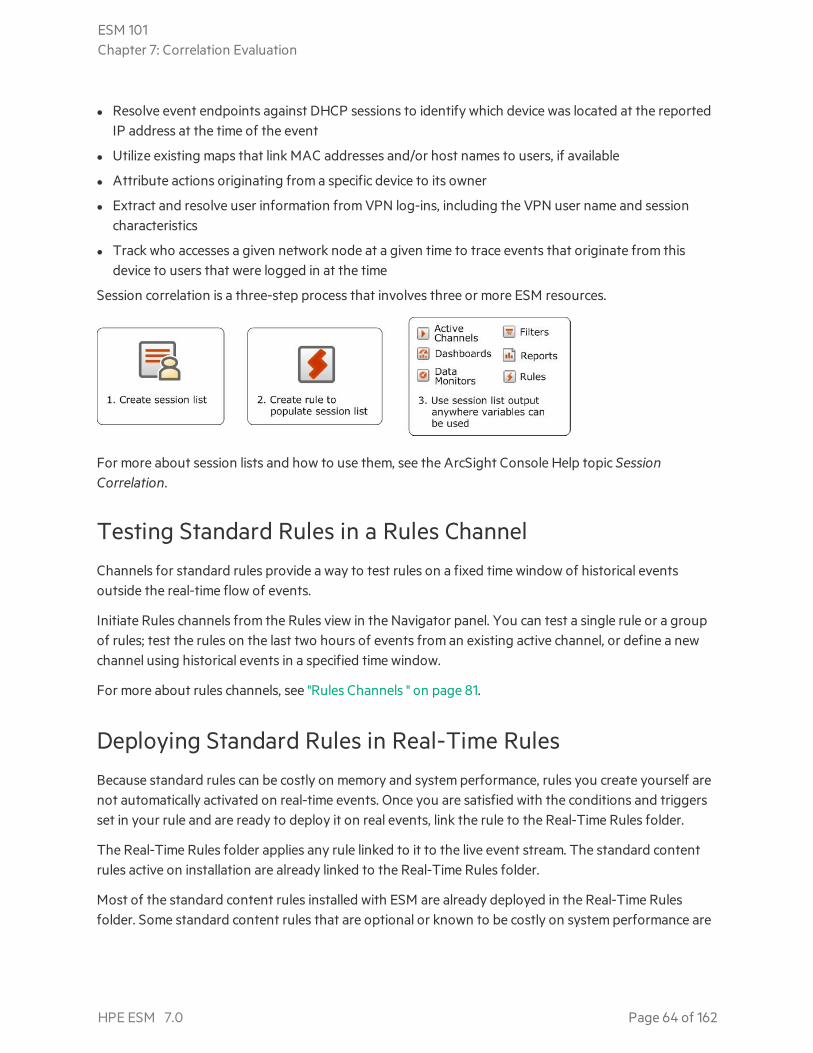
l Resolve event endpoints against DHCP sessions to identify which device was located at the reportedIP address at the time of the event
l Utilize existing maps that link MAC addresses and/or host names to users, if available
l Attribute actions originating from a specific device to its owner
l Extract and resolve user information from VPN log-ins, including the VPN user name and sessioncharacteristics
l Track who accesses a given network node at a given time to trace events that originate from thisdevice to users that were logged in at the time
Session correlation is a three-step process that involves three or more ESM resources.
For more about session lists and how to use them, see the ArcSight Console Help topic SessionCorrelation.
Testing Standard Rules in a Rules ChannelChannels for standard rules provide a way to test rules on a fixed time window of historical eventsoutside the real-time flow of events.
Initiate Rules channels from the Rules view in the Navigator panel. You can test a single rule or a groupof rules; test the rules on the last two hours of events from an existing active channel, or define a newchannel using historical events in a specified time window.
For more about rules channels, see "Rules Channels " on page 81.
Deploying Standard Rules in Real-Time RulesBecause standard rules can be costly on memory and system performance, rules you create yourself arenot automatically activated on real-time events. Once you are satisfied with the conditions and triggersset in your rule and are ready to deploy it on real events, link the rule to the Real-Time Rules folder.
The Real-Time Rules folder applies any rule linked to it to the live event stream. The standard contentrules active on installation are already linked to the Real-Time Rules folder.
Most of the standard content rules installed with ESM are already deployed in the Real-Time Rulesfolder. Some standard content rules that are optional or known to be costly on system performance are
ESM 101Chapter 7: Correlation Evaluation
HPE ESM 7.0 Page 64 of 162
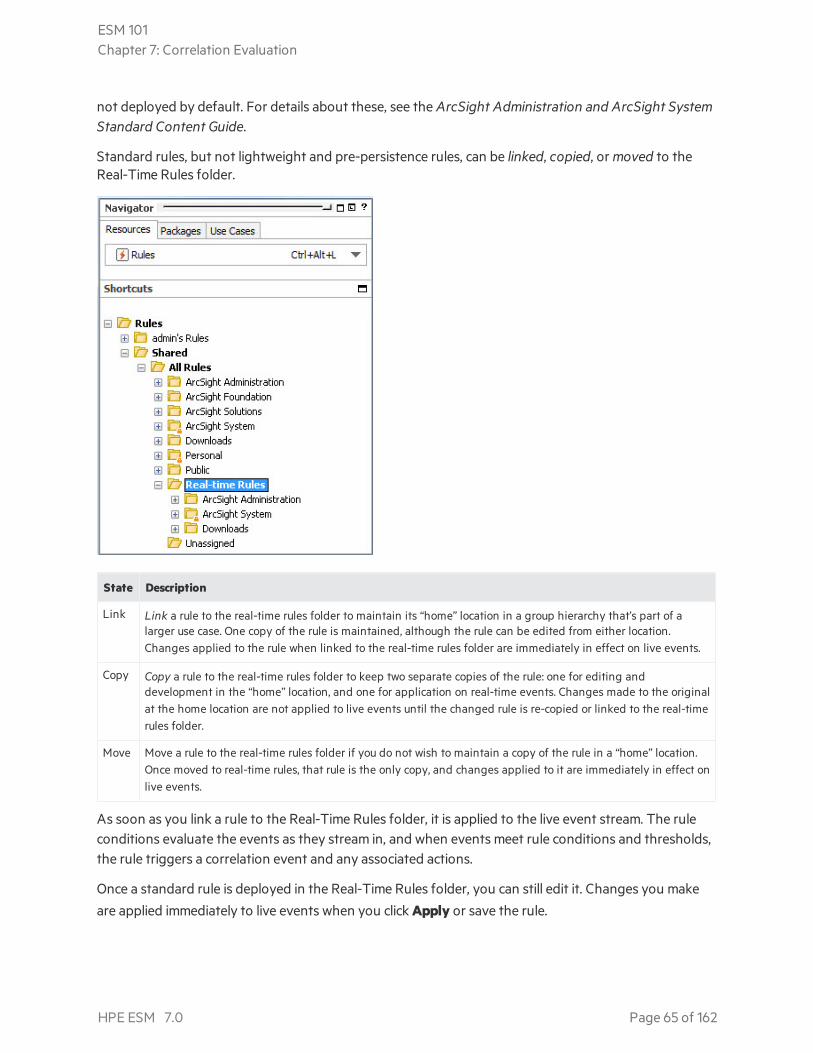
not deployed by default. For details about these, see the ArcSight Administration and ArcSight SystemStandard Content Guide.
Standard rules, but not lightweight and pre-persistence rules, can be linked, copied, or moved to theReal-Time Rules folder.
State Description
Link Link a rule to the real-time rules folder to maintain its “home” location in a group hierarchy that’s part of alarger use case. One copy of the rule is maintained, although the rule can be edited from either location.Changes applied to the rule when linked to the real-time rules folder are immediately in effect on live events.
Copy Copy a rule to the real-time rules folder to keep two separate copies of the rule: one for editing anddevelopment in the “home” location, and one for application on real-time events. Changes made to the originalat the home location are not applied to live events until the changed rule is re-copied or linked to the real-timerules folder.
Move Move a rule to the real-time rules folder if you do not wish to maintain a copy of the rule in a “home” location.Once moved to real-time rules, that rule is the only copy, and changes applied to it are immediately in effect onlive events.
As soon as you link a rule to the Real-Time Rules folder, it is applied to the live event stream. The ruleconditions evaluate the events as they stream in, and when events meet rule conditions and thresholds,the rule triggers a correlation event and any associated actions.
Once a standard rule is deployed in the Real-Time Rules folder, you can still edit it. Changes you make
are applied immediately to live events when you click Apply or save the rule.
ESM 101Chapter 7: Correlation Evaluation
HPE ESM 7.0 Page 65 of 162
Data MonitorsData monitors are how the logic is defined for the graphical summaries that are displayed indashboards. The data monitors resource is located in the Dashboards area of the navigation tree(dashboards are part of the monitoring phase of the event life cycle, and are discussed in "Dashboards"on page 83). Some data monitors, however, also perform special analysis.
Data monitors are similar to rules, in that they evaluate the event stream and system health statistics,and consolidate (aggregate) events with common elements. Rules focus on inferring meaning fromcertain event conditions in order to specify actions, whereas data monitors focus primarily onsummarizing event data graphically, and in the case of correlation data monitors, on providing adifferent type of analysis, such as calculating statistics and moving averages, and reconciling eventstreams.
Most data monitors are part of the discovery phase of the discover-infer-prioritize-act correlationprocess. Correlation data monitors can also infer, or draw conclusions, based on the corollary factorspresent in events with common elements. Unlike rules, however, data monitors cannot specify actions.For this reason, correlation data monitors are used in conjunction with rules.
There are three types of data monitors:
l Event-based data monitors: used to create graphical or tabular summaries of event data for displayin dashboards.
l Correlation data monitors: used to evaluate the event stream and discover anomalies bycalculating statistics, reconciling event streams, and calculating moving averages. Like rules,correlation data monitors generate correlation events when their conditions are met. Correlation datamonitors are used in conjunction with rules, which can trigger actions when the correlation datamonitor conditions are met.
l Non-event based data monitors: used to monitor and display ESM system status in a graphical ortabular summary.
ESM provides a series of standard data monitors designed to work in conjunction with filters,dashboards, and rules to address specific use cases.
Event-Based Data MonitorsEvent-based data monitors evaluate the event stream, apply filters, and render summaries in a graphicalformat, which can then be displayed in a dashboard. When presented in dashboards, event-based datamonitors are used primarily as a monitoring and investigation tool in the discovery phase of thecorrelation process.
If you are previewing the output of a data monitor that has not yet been placed in a dashboard, thesystem will create a temporary dashboard in which to display the results. You can create permanent
ESM 101Chapter 7: Correlation Evaluation
HPE ESM 7.0 Page 66 of 162
dashboards that display the results of one or more data monitors. The same data monitor can bedisplayed in more than one dashboard, or displayed multiple times in the same dashboard usingdifferent display options.
When added to a dashboard, the results of the evaluation are then rendered graphically in a format ofyour choosing: bar chart, 3-D bar chart, bar chart table, pie chart, table, statistics graph, and so on.
Data monitors can become costly in terms of memory if the data monitor defines groups of data withmany members, which must be updated and evaluated as new events come into the event life cycle.Data monitors can also be CPU-intensive when they make use of many filters or filters that are complex.
The following table describes the types of event-based data monitors provided by ESM.
Name Description
AssetCategoryCount
This data monitor enumerates the number of events that occur per asset category, by priority, within atime interval.
EventGraph
This data monitor draws real-time diagrams of selected event activity. Event graph data monitors canconsume a lot of memory and CPU time, because every time fresh event data comes into the channel,the system first calculates, then re-renders the graphic. To ease the burden on memory resources, youcan lower the data refresh rate.
GeographicEventGraph
This data monitor draws a real-time geographic map of selected events.
HierarchyMap
The Hierarchy Map Data Monitor draws an image made up of proportionally-sized panels where eachpanel represents a group of events selected by group fields selected in the source node identifier. Asource-node criteria could be a combination of fields.
This data monitor includes several enhancements including a more refined view of grouped fields, moredrill-downs, and enhanced visualization tools for controlling the map displays.
For details about the Hierarchy Map data monitor, see the ArcSight Console User’s Guide.
HourlyCounts
The Hourly Counts Data Monitor displays the total count of events on an hourly basis along with theirpriority.
Last NEvents
The Last N Events data monitor displays the latest number of events in a table ordered by whateverparameter you are interested in seeing, such as priority, event name, protocol, and category.
Last State This data monitor shows graphics that translate complex values into simple, rapidly observable resultssuch as green / yellow / red “signal lights” or check mark / asterisk / exclamation point symbols.
Top ValueCounts(Bucketized)
Displays top events by selected data field, the total number of events, and the event Severity within thetotal number of events with the Table and BarChartTable viewer configurations.
ESM 101Chapter 7: Correlation Evaluation
HPE ESM 7.0 Page 67 of 162
Correlation Data MonitorsCorrelation data monitors are also event-based and evaluate the event stream, however, they have thecapability to perform special analytic functions that rules cannot. Their purpose is to work analytically inconjunction with rules. Their results can also be displayed graphically in a dashboard.
Correlation-based data monitors evaluate the event stream, apply filters or other conditions, and somecompare features of two data streams using filters and elements of aggregation.
When the correlation data monitor finds events that match the specified conditions, it can trigger acorrelation event, as discussed in "Correlation Events Triggered by Rules" on page 60.
CorrelationDataMonitor Description
EventCorrelation
This data monitor provides flow-volume correlation between two different event streams. This helpscorroborate attacks reported by different systems. For example, this can be applied to event streamsgenerated by a firewall and an IDS to correlate and verify their output.
MovingAverage
The Moving Average data monitor displays the moving average of events by a selected data field. Amoving average allows for short term fluctuations to be removed and more correctly shows long termtrends. The moving average data monitor can also plot values using various numeric fields in the event.
Statistics The Statistics data monitor is similar to the Moving Average data monitor, except that it enables you toselect other statistical methods in addition to Moving Average. Statistical methods include average,standard deviation, skew and kurtosis, as well as moving average.
Non-Event Based Data MonitorsNon-event based data monitors evaluate internal statistics associated with ESM resources and theirusage. These data monitors are mainly useful to administrators to view the instrumentation monitoringESM. For example, the rules partial match data monitor can help you understand how costly rules andother data monitors are to CPU and memory.
ESM 101Chapter 7: Correlation Evaluation
HPE ESM 7.0 Page 68 of 162
Non-event based DataMonitor Description
System Monitor The System data monitor provides measurements based on Manager internal system Javaclasses and attributes. ESM's standard system monitors capture several common systemmonitoring scenarios. Examples include system information, rules engine, and data storetransaction volume. The focus is on a particular Mbean Java class.
System Monitor Attribute The System Monitor Attributes data monitor is similar to System Monitor, except that,instead of providing measurements for all attributes of a specified Java class, it focuses ona specific attribute of a given ESM Java class. Examples include Free Space Summary,Report Logger, Current Running Reports, Connector State Tracker, and ManagerThroughputs. The focus in this data monitor is on a particular attribute of an Mbean Javaclass.
Rules Partial Match Displays rules that have partial matches and the total number of partial match eventswithin a specified time frame. This is useful to see how much memory and CPU is beingused by the working memory for evaluating join and aggregation partial matches.
How Correlation Uses Local and Global VariablesVariable event fields are user-named extensions to ESM's event schema (for more about the eventschema, see "The Event Schema" on page 111). Variables are virtual event fields whose values are theresult of a special function performed on another field.
ESM enables you to create local variables that apply to the rule, filter, data monitor, query, activechannel, or field set you are editing, and global variables that can be referenced by multiple resources.
Variables boil down the complexity of the data in a way that enables calculations or functions to beperformed. Local and global variables support the following types of functions:
l Alias Functions
l Arithmetic Functions
l Category Model Functions
l Condition Functions
l Group Functions
l IP Address Functions
l List Functions
l String Functions
l Timestamp Functions
l Type Conversion Functions
l Value List Functions
For example, you can write a rule that is triggered when an after-hours login occurs. To calculate the“after hours” time range, you can define a timestamp variable that extracts the hour of day out of a time
ESM 101Chapter 7: Correlation Evaluation
HPE ESM 7.0 Page 69 of 162

stamp, then set the rule trigger on events that occur between x and y time. The time stamp value ismade up of multiple data points: dd mmm yyyy hh:mm:ms UTC, as shown below:
21 Jun 2017 17:28:02 PDT
You can also use a string function variable to re-arrange the information in a compound data field, suchas a uniform resource locator (URI), in a format that is easier to read in reports and other monitoringdisplays. For example, a location URI may be constructed as USA/CA/Cupertino. Variables enable youto reconstruct the order of these elements, and specify punctuation or spacing in between, so you candisplay Cupertino CA, USA in your output display.
Once created, variables can be selected in the Common Conditions Editor (CCE) as additional fields onthe Filters or Conditions tabs, as Group By arguments for data monitors and queries, and in ruleconditions and actions. You can add variables to field sets in the Field Set Editor to extend the eventand resource schema with values derived from other data fields.
For more about variables, see the ArcSight Console Help topics “Variables” and “Global Variables.”
Velocity TemplatesVelocity is a Java-based template engine developed by the Apache Velocity Project(http://velocity.apache.org/). It enables you to use the Velocity Template Language (VTL) scripts toinsert a variable in a condition instead of a literal value to populate a string field.
Stated briefly, Velocity templates can be applied in most places where a literal string might be enhancedby a conditional or variable string. Common examples are formatting time expressions or condensingfine units into more meaningful groupings.
Velocity Application PointsESM provides several places where you can use Velocity template variables as input instead of literalvalues to make an action more universally applicable to changing conditions. The designated Velocityaccess points into ESM are described below.
ApplicationPoint Description
Rules ActionParameters
You can use Velocity templates in Add Action dialog boxes to create or edit fired-rule behavior. You
get to these from the Actions tab or the Rules Editor. The Command and Parameters fields forExecute Command actions are Velocity candidates, as is the message-subject text in the Messagefield of Send Notification actions.
CustomColumns
Velocity templates are also applicable in the Cell Format and ToolTip Format panels of the Custom
Columns Editor, which are described in the Monitoring Events chapter in the ArcSight Console User’sGuide.
ESM 101Chapter 7: Correlation Evaluation
HPE ESM 7.0 Page 70 of 162
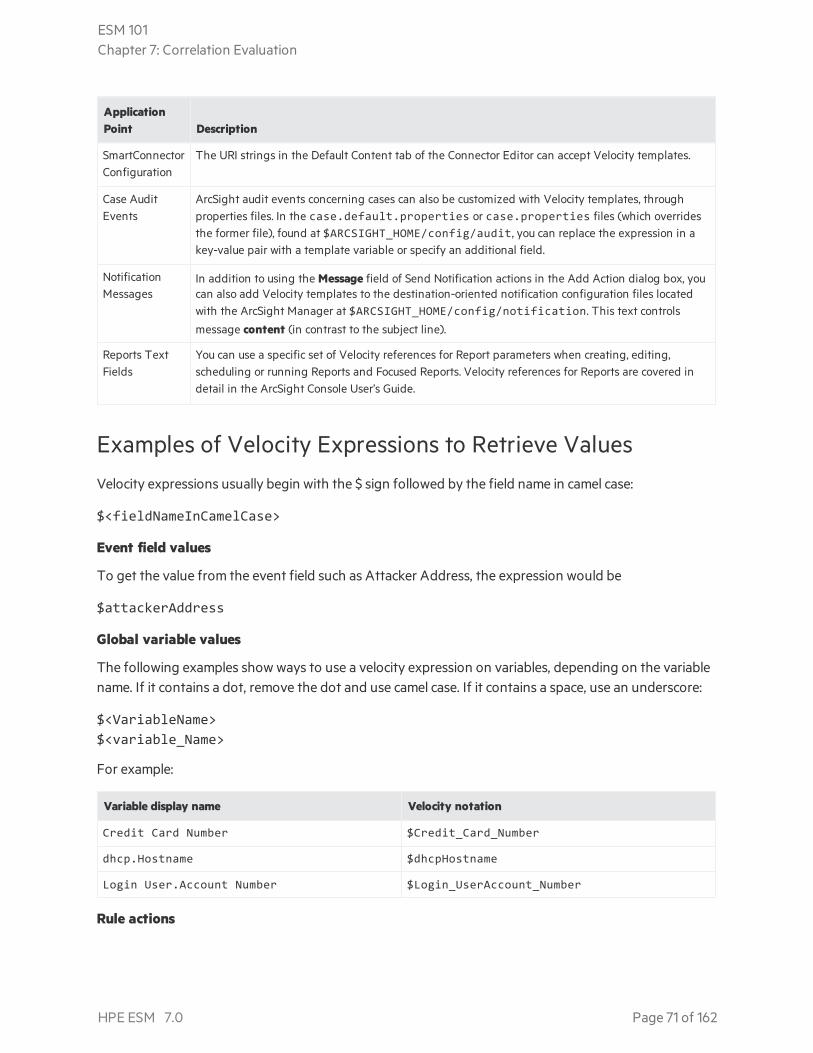
ApplicationPoint Description
SmartConnectorConfiguration
The URI strings in the Default Content tab of the Connector Editor can accept Velocity templates.
Case AuditEvents
ArcSight audit events concerning cases can also be customized with Velocity templates, throughproperties files. In the case.default.properties or case.properties files (which overridesthe former file), found at $ARCSIGHT_HOME/config/audit, you can replace the expression in akey-value pair with a template variable or specify an additional field.
NotificationMessages
In addition to using the Message field of Send Notification actions in the Add Action dialog box, youcan also add Velocity templates to the destination-oriented notification configuration files locatedwith the ArcSight Manager at $ARCSIGHT_HOME/config/notification. This text controls
message content (in contrast to the subject line).
Reports TextFields
You can use a specific set of Velocity references for Report parameters when creating, editing,scheduling or running Reports and Focused Reports. Velocity references for Reports are covered indetail in the ArcSight Console User’s Guide.
Examples of Velocity Expressions to Retrieve ValuesVelocity expressions usually begin with the $ sign followed by the field name in camel case:
$<fieldNameInCamelCase>
Event field values
To get the value from the event field such as Attacker Address, the expression would be
$attackerAddress
Global variable values
The following examples show ways to use a velocity expression on variables, depending on the variablename. If it contains a dot, remove the dot and use camel case. If it contains a space, use an underscore:
$<VariableName>$<variable_Name>
For example:
Variable display name Velocity notation
Credit Card Number $Credit_Card_Number
dhcp.Hostname $dhcpHostname
Login User.Account Number $Login_UserAccount_Number
Rule actions
ESM 101Chapter 7: Correlation Evaluation
HPE ESM 7.0 Page 71 of 162
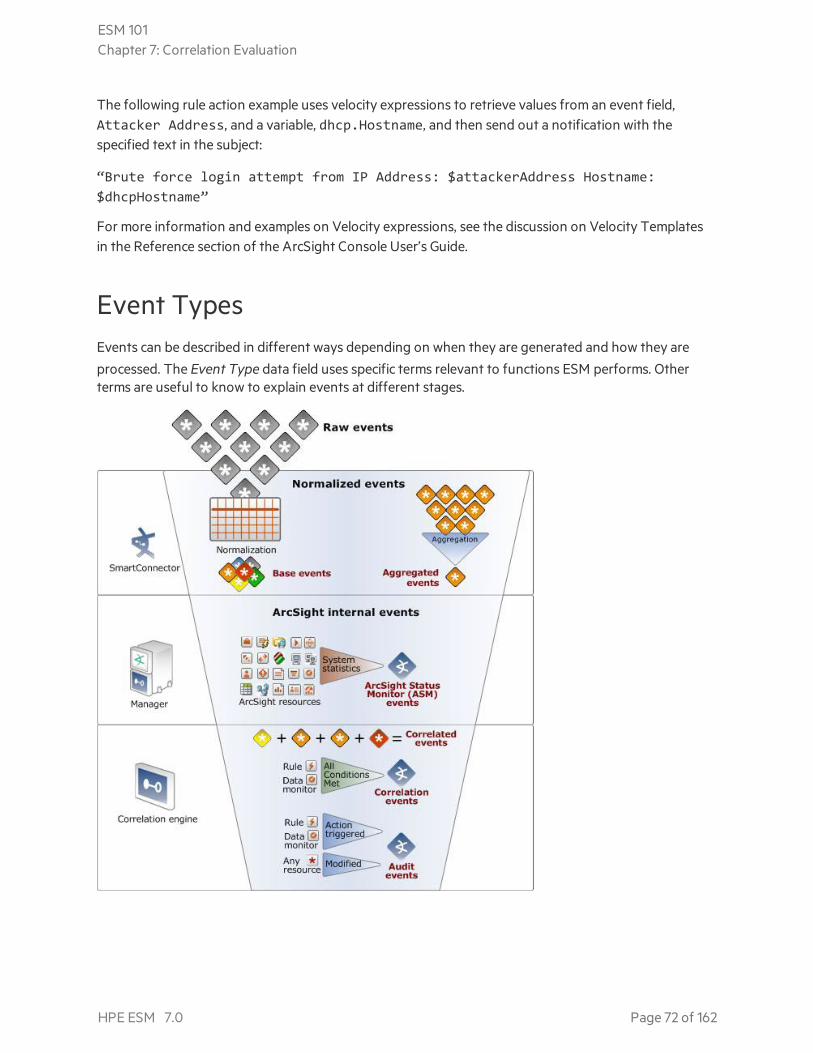
The following rule action example uses velocity expressions to retrieve values from an event field,Attacker Address, and a variable, dhcp.Hostname, and then send out a notification with thespecified text in the subject:
“Brute force login attempt from IP Address: $attackerAddress Hostname:$dhcpHostname”
For more information and examples on Velocity expressions, see the discussion on Velocity Templatesin the Reference section of the ArcSight Console User’s Guide.
Event TypesEvents can be described in different ways depending on when they are generated and how they areprocessed. The Event Type data field uses specific terms relevant to functions ESM performs. Otherterms are useful to know to explain events at different stages.
ESM 101Chapter 7: Correlation Evaluation
HPE ESM 7.0 Page 72 of 162
Raw EventsRaw events are events in their native format (generated directly by network devices and reported toSmartConnectors) before being normalized by SmartConnectors. All other event phases occur afternormalization. Internal events are those generated at various stages by the ArcSight Manager.
See "Normalize Event Data" on page 31.
Event Types in the Event Type Data Field
All event types presented in the Event Type data field are normalized events: events that have beenprocessed by a SmartConnector. The Event Type field presents the following four event types:
Base: Base events are raw events that have arrived in the SmartConnector and have been normalized.Normalizing raw events means arranging the data fields in a standardized (normal) order and removingminor differences in formatting so that a given field can be successfully compared to rules regardless ofthe native formatting at the source.
Aggregated: Connector aggregation generates an aggregated event for events with matching values.The aggregated event contains the matching values plus the earliest start time and latest end time andan Aggregation field specifying the number of events aggregated. Aggregation reduces the number ofevents the Manager has to evaluate.
Correlation: The Correlation Engine correlates normalized base events based on conditions expressedin rules and data monitors that match specific attributes. When one or more base events match a rule,ESM generates a correlation event. The base events that were correlated remain as base events withtheir original Device Event Class ID.
Action: An action event is a type of audit event (defined in "Other Types of Normalized Events" below)generated when a rule whose conditions have been met triggers an action to be taken, and the action iscompleted.
Other Types of Normalized EventsIn addition to the event types presented in te Event Type data field, there are also a number of otherterms used to identify normalized events at different stages.
Normalized Events: Events that have been processed by a SmartConnector to evaluate which fields arerelevant and arrange them in a common schema.
Correlated Events: Correlated events are a series of normalized events that, together, cause theconditions of a rule or correlation data monitor to be met. Correlated events fulfill the conditions that
trigger a rule to generate a correlation event (defined above).
ESM 101Chapter 7: Correlation Evaluation
HPE ESM 7.0 Page 73 of 162
Audit Events: The term “audit event” is a common industry term to indicate a record of some action,event, or state that a system generates to monitor itself.
Audit events record actions and conditions generated by the ArcSight Manager and the componentsthat communicate with it, such as when an action is triggered by a rule or data monitor, when anyresource is created/modified/deleted, or when a SmartConnector is registered with the Manager.
When the Manager generates an audit event, it assigns the event an audit event ID in the Device EventClass ID field. Audit events are then sent back through the event lifecycle so they can be evaluated bythe correlation engine.
For a list of ArcSight Audit Event Device Event Class IDs and what triggers them, see The ArcSightConsole User’s Guide topic “Reference Guide,” and look at the “Audit Events” section.
ArcSight Status Monitor (ASM) Events: ASM events are events generated by the Manager to monitorsystem statistics for internal reporting and system troubleshooting.
Filtering Events
To identify the origins and nature of an event, for example when you create event filters, some key datafields to look at are the Vendor, the Product, and the Device Event Class ID fields. The ID field containsan ID code supplied by the device or product vendor that identifies what the event was. For events thatArcSight generates, the Vendor is ArcSight, the Product is ArcSight, and the Device Event Class ID isone of our Audit Event codes. Knowing the vendor and product enables you to sort out events whenthe vendors use the same codes for different events.
For a list of all the data fields, see the ArcSight Console User’s Guide chapter entitled “Reference Guide,”and look at the “Data Fields” section.
When viewing a channel you can sort any of the fields with a double-arrow icon .
Monitoring ESM’s Audit Events
To create an active Channel that monitors ESM's audit events, create a new active channel that onlyshows events whose Vendor is ArcSight and have it display the Device Event Class ID field.
Refer to the ArcSight Console User's Guide for information on how to create an active channel. It is inthe chapter entitled “Monitoring Events,” in the section “Monitoring Active Channels,” “Viewing andUsing and Using Channels,” “Creating an Active Channel.”
Below are some significant event fields that will help in analyzing an audit event to find subject identity,location, date, and time.
Type — Shows the event type for this audit event (Base, Correlation, aggregated, Action).
Device Event Class ID — Shows the audit event id, such as authentication:100. You cannot sort on thisfield in an active channel, but you can sort on it in Query Viewers and reports.
ESM 101Chapter 7: Correlation Evaluation
HPE ESM 7.0 Page 74 of 162
Category Outcome — Shows the status of an action. For example: Adding to an Active List shows/Successful or /Failure, depending on the result.
Target User Name — The Target User Name is the identity of the user. This field is populated only foruser-specific actions such as authentication related actions, resource add/update/delete related actions,or scheduled tasks related actions. For example, upon console login, for the authentication:100 auditevent, the Target User Name contains the name of the user logging in through the Console. However,when an audit event is generated for a rule action, this field is not populated as it is not directly drivenby a User.
Attacker Address — This field might contain the IP address of the source, depending on the event.For audit events this is always an ArcSight component, but when it is the Manager these fields areblank. For example:
l Upon console login, for the authentication:100 audit event, the Attacker Address is the IP address ofthe Console system from which the user is logging in.
l When data monitors do a data refresh, the Attacker Address field in the resulting audit event is notpopulated.
Device Event Category, File Name, File Type, File Path — These fields are helpful as they usuallycontain the information about the resource about which the audit event is generated. Note that the“file” fields can contain resource name, type, and URI, and not just information for files.
End-time, Manager Receipt Time — These show the date and time the audit event was generated.
Device Vendor, Device Product — Both of these have the value ArcSight, which means they areinternally generated.
Distributed CorrelationDistributed correlation enables you to configure and deploy multiple instances of correlators andaggregators on multiple nodes (multiple systems) in a cluster. The multiple instances of correlators andaggregators run as individual services and distribute the correlation workload across these services. Youcan configure the multiple services to run on several machines, which are nodes in a distributedcorrelation cluster. The benefits of processing on multiple systems as cluster nodes are higherperformance and fault tolerance. The multiple instances of correlators and aggregators support thefaster processing of larger numbers of events, depending on your content and environment. You canlook at the distributed correlation cluster as a large instance of ESM, to which you can add more nodes,correlators and aggregators as needed.
Note: You are not required to use distributed correlation. It is optional, and is available when youinstall or upgrade ESM. If you do not choose to use distributed correlation, you can install ESM inwhat is termed compact mode, which is the original ESM configuration that has always beenavailable. If you do choose to take advantage of distributed correlation, however, no changes arerequired to the content to be able to function equivalently in this distributed environment.
ESM 101Chapter 7: Correlation Evaluation
HPE ESM 7.0 Page 75 of 162
With distributed correlation, you can add correlators and aggregators to your ESM environment untilyou have enough of these resources to improve correlation performance. ESM with distributedcorrelation works exactly the same as ESM did before distributed correlation was available. Yourexperience in the ArcSight Console will be exactly the same as in compact mode. The only difference willbe a multiplicity of correlators and aggregators. Connectors or the Event Broker remain as eventsources.
For details on distributed cluster planning and installation, see the ESM Installation Guide; for details onconfiguring and managing your cluster, see the ESM Administration Guide.
Distributed Correlation Services in a ClusterThe main components of distributed correlation are:
l Persistor: Persists to disk the information that needs to be retained, retrieved, or shared. There is asingle persistor in a distributed correlation cluster. The persistor consists of multiple entities,including the Manager, Logger, and the CORR-Engine database, among others. When you configurea distributed correlation cluster, the persistor is on the first node you configure during installation.Other nodes are added in the course of installation to build the cluster.
l Correlators: Correlators and aggregators in a cluster perform correlation in the same manner thatcorrelation occurs in the compact (non-cluster) mode of ESM. Correlators perform partial matches forlightweight and standard rules, then send the events to aggregators for further matching.
Each correlator in the cluster is a single process; there can be multiple correlators on each node in thecluster.
l Aggregators: These services perform aggregation in a cluster, and summarize or consolidate eventswith matching (or not matching) values over a timeframe. Non-join rules are immediately evaluatedby the aggregators. After join rules have been evaluated for partial matches at the correlators,aggregators perform additional event matching. If rules are triggered, aggregators generatecorrelation audit events and then execute rule actions.
Each aggregator in the cluster is a single process; there can be multiple aggregators on each node inthe cluster.
l Message Bus Control and Message Bus Data: Message bus control (mbus_control) and messagebus data (mbus_data) facilitate communication among cluster services.
l Information Repository (Repo): The repository contains shared information for the cluster, and iscentral to cluster operation. It contains the state of each member of the cluster among all of thenodes. This is the clearing-house of cluster service status information and the index of clusterresources. The benefit of having multiple instances of the repository is that if one instance goesdown, there is another instance of the repository to keep cluster service status information (includingcertificate status and port assignments for services); all repository instances work together to providethe repository service.
l Distributed Cache: Manages the short-term storage of data needed for cluster operation. Itcontains the shared resources for the cluster, such as keeping track of how many times a rule
ESM 101Chapter 7: Correlation Evaluation
HPE ESM 7.0 Page 76 of 162
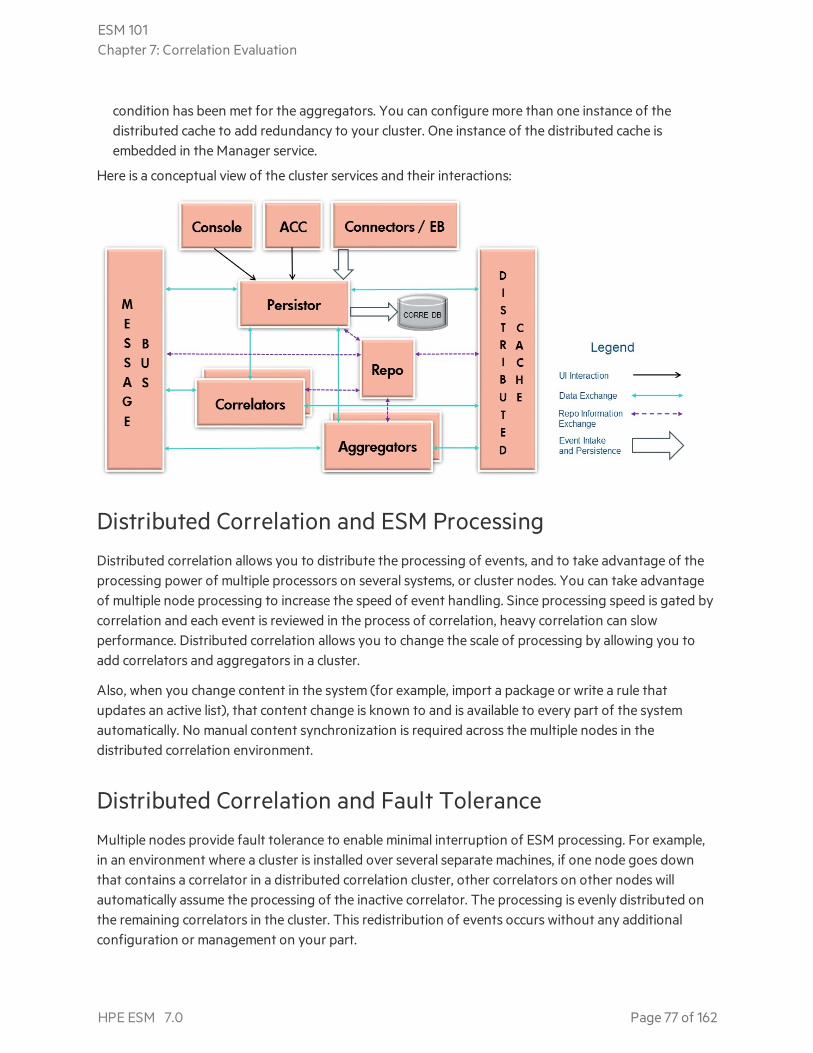
condition has been met for the aggregators. You can configure more than one instance of thedistributed cache to add redundancy to your cluster. One instance of the distributed cache isembedded in the Manager service.
Here is a conceptual view of the cluster services and their interactions:
Distributed Correlation and ESM ProcessingDistributed correlation allows you to distribute the processing of events, and to take advantage of theprocessing power of multiple processors on several systems, or cluster nodes. You can take advantageof multiple node processing to increase the speed of event handling. Since processing speed is gated bycorrelation and each event is reviewed in the process of correlation, heavy correlation can slowperformance. Distributed correlation allows you to change the scale of processing by allowing you toadd correlators and aggregators in a cluster.
Also, when you change content in the system (for example, import a package or write a rule thatupdates an active list), that content change is known to and is available to every part of the systemautomatically. No manual content synchronization is required across the multiple nodes in thedistributed correlation environment.
Distributed Correlation and Fault ToleranceMultiple nodes provide fault tolerance to enable minimal interruption of ESM processing. For example,in an environment where a cluster is installed over several separate machines, if one node goes downthat contains a correlator in a distributed correlation cluster, other correlators on other nodes willautomatically assume the processing of the inactive correlator. The processing is evenly distributed onthe remaining correlators in the cluster. This redistribution of events occurs without any additionalconfiguration or management on your part.
ESM 101Chapter 7: Correlation Evaluation
HPE ESM 7.0 Page 77 of 162
Plan your cluster to have some reserve capacity (more correlators and aggregators than you think youmight need). If all your correlators are running at full capacity and one goes down, re-distributing thisload can overload the remaining correlators and result in slower event processing. You will almostalways be adding correlators and aggregators, not removing them. The goal is to have more correlatorsand aggregators on additional nodes with more computing power than you currently need.
A Distributed Correlation Cluster consists of a persistor node and two or more correlator nodes. Referto recommended the cluster configurations in the ESM Installation Guide.
Distributed Correlation Cluster Monitoring - DashboardThe ArcSight Command Center includes a Cluster View dashboard to enable you to monitor the activityof correlators and aggregators, and determine if they are keeping up with the event load. Thisdashboard displays representations of cluster nodes and services in relation to each other, and thestatus of each, with metrics and audit event views. See the ArcSight Command Center User's Guide fordetails about this dashboard.
ESM 101Chapter 7: Correlation Evaluation
HPE ESM 7.0 Page 78 of 162
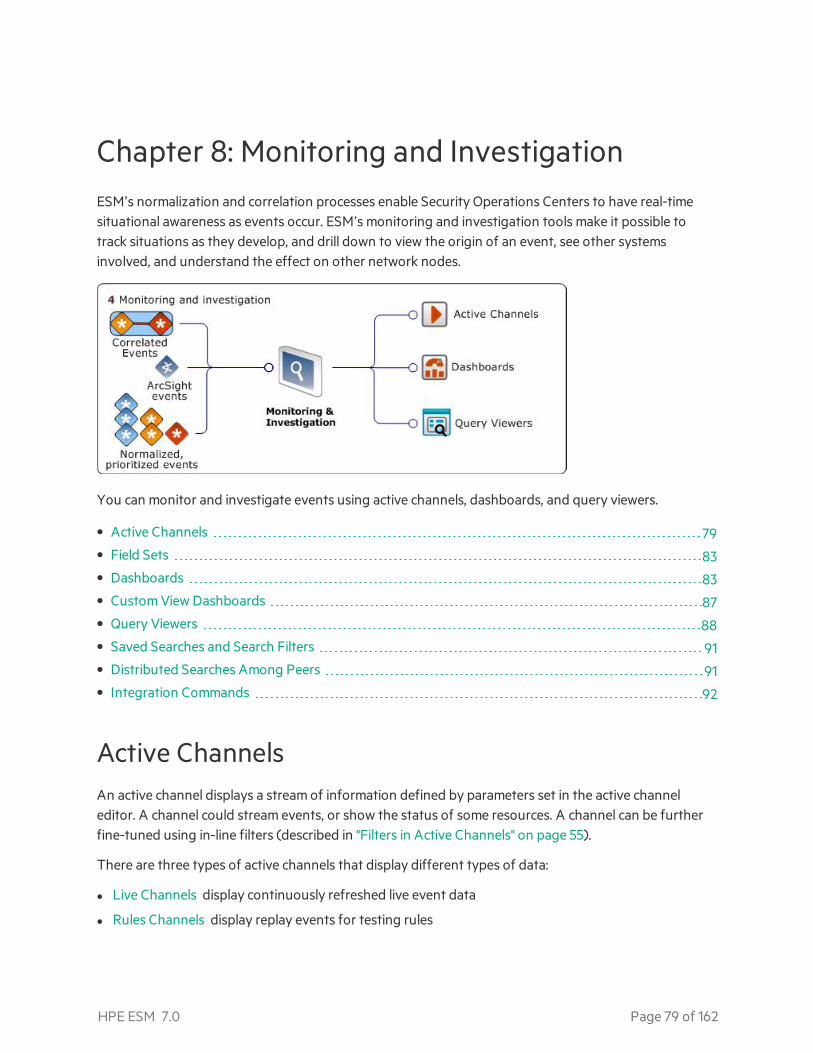
Chapter 8: Monitoring and InvestigationESM’s normalization and correlation processes enable Security Operations Centers to have real-timesituational awareness as events occur. ESM’s monitoring and investigation tools make it possible totrack situations as they develop, and drill down to view the origin of an event, see other systemsinvolved, and understand the effect on other network nodes.
You can monitor and investigate events using active channels, dashboards, and query viewers.
• Active Channels 79• Field Sets 83• Dashboards 83• Custom View Dashboards 87• Query Viewers 88• Saved Searches and Search Filters 91• Distributed Searches Among Peers 91• Integration Commands 92
Active ChannelsAn active channel displays a stream of information defined by parameters set in the active channeleditor. A channel could stream events, or show the status of some resources. A channel can be furtherfine-tuned using in-line filters (described in "Filters in Active Channels" on page 55).
There are three types of active channels that display different types of data:
l Live Channels display continuously refreshed live event data
l Rules Channels display replay events for testing rules
HPE ESM 7.0 Page 79 of 162
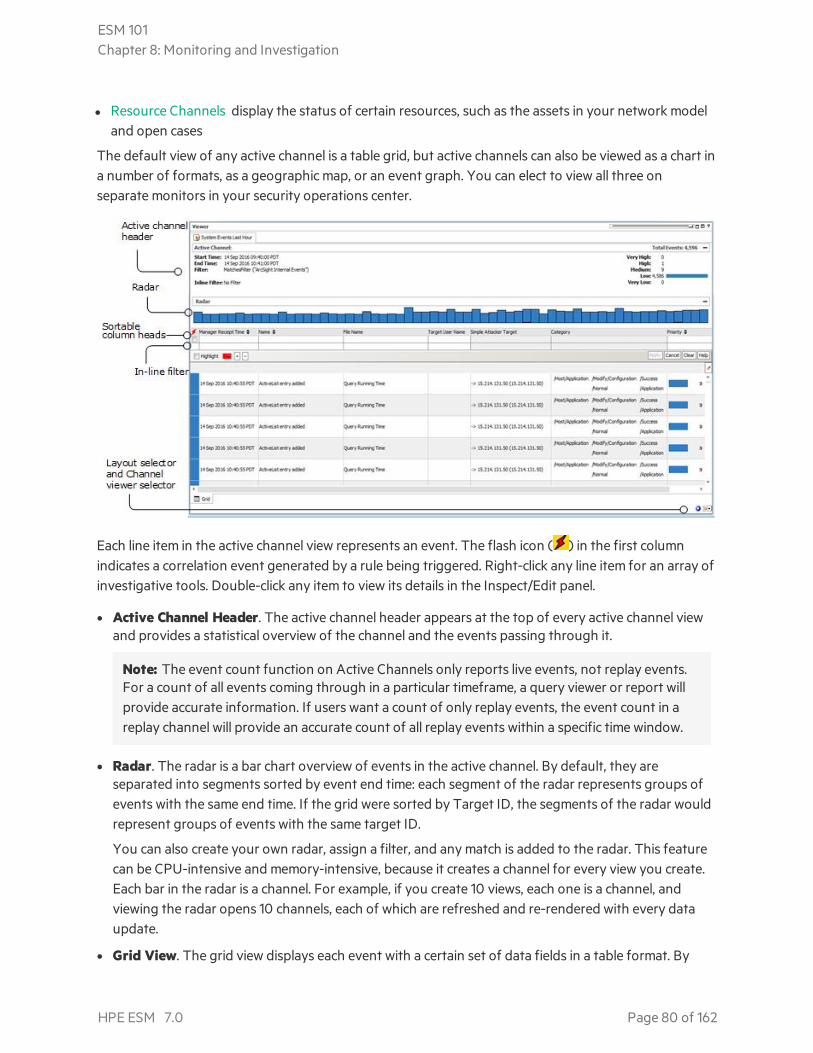
l Resource Channels display the status of certain resources, such as the assets in your network modeland open cases
The default view of any active channel is a table grid, but active channels can also be viewed as a chart ina number of formats, as a geographic map, or an event graph. You can elect to view all three onseparate monitors in your security operations center.
Each line item in the active channel view represents an event. The flash icon ( ) in the first columnindicates a correlation event generated by a rule being triggered. Right-click any line item for an array ofinvestigative tools. Double-click any item to view its details in the Inspect/Edit panel.
l Active Channel Header. The active channel header appears at the top of every active channel viewand provides a statistical overview of the channel and the events passing through it.
Note: The event count function on Active Channels only reports live events, not replay events.For a count of all events coming through in a particular timeframe, a query viewer or report willprovide accurate information. If users want a count of only replay events, the event count in areplay channel will provide an accurate count of all replay events within a specific time window.
l Radar. The radar is a bar chart overview of events in the active channel. By default, they areseparated into segments sorted by event end time: each segment of the radar represents groups ofevents with the same end time. If the grid were sorted by Target ID, the segments of the radar wouldrepresent groups of events with the same target ID.
You can also create your own radar, assign a filter, and any match is added to the radar. This featurecan be CPU-intensive and memory-intensive, because it creates a channel for every view you create.Each bar in the radar is a channel. For example, if you create 10 views, each one is a channel, andviewing the radar opens 10 channels, each of which are refreshed and re-rendered with every dataupdate.
l Grid View. The grid view displays each event with a certain set of data fields in a table format. By
ESM 101Chapter 8: Monitoring and Investigation
HPE ESM 7.0 Page 80 of 162

default, the Viewer panel loads the grid view established for the user group of which you are amember. The view you last set will be the one that loads the next time you log on.
l Chart View. Chart view displays a summary of events. You can view live events in the following ways:o Line graph
o Scatter plot
o Area graph
o Bar chart
o Stacking bar chart
o Pie chart
o Stacking area graph
l Image Viewer Map. The image viewer plots events geographically on a global or political map of theworld. You can also import your own graphic, such as an organization chart.
ESM provides a series of standard active channels, which provide out-of-the-box monitoringfunctionality for common security and network scenarios. For example, by default, the Live activechannel displays all events processed in the last two hours in a grid view.
Live ChannelsLive channels display real-time events, which are continuously refreshed whenever events are written tothe data store. This means that active channels reflect any changes at its next refresh cycle, such aswhen new base events arrive from SmartConnectors, or when a user annotates an existing event withinvestigation or follow-up information.
You can define a live channel to display events that match an existing filter over a particular fixed orrolling time frame. You can also define which fields (data columns) of event data you wish to display.You can manually define the fields you wish to view, select a standard field set (specific columns ofevent data), or define your own field set (see "Field Sets" on page 83).
As an Administrator, you can also apply filters for particular user groups, in effect limiting what eventsother users see. Filters set for the group by the Administrator are implied, and do not appear in theuser's view as part of the filter settings in the active channel header.
Each event makes up a line item in an active channel grid. You can investigate any line item to view all ofits characteristics using tools in the right-click menu.
Rules ChannelsRules channels provide a way to test rules on a fixed time window of historical events outside the real-time flow of events.
ESM 101Chapter 8: Monitoring and Investigation
HPE ESM 7.0 Page 81 of 162
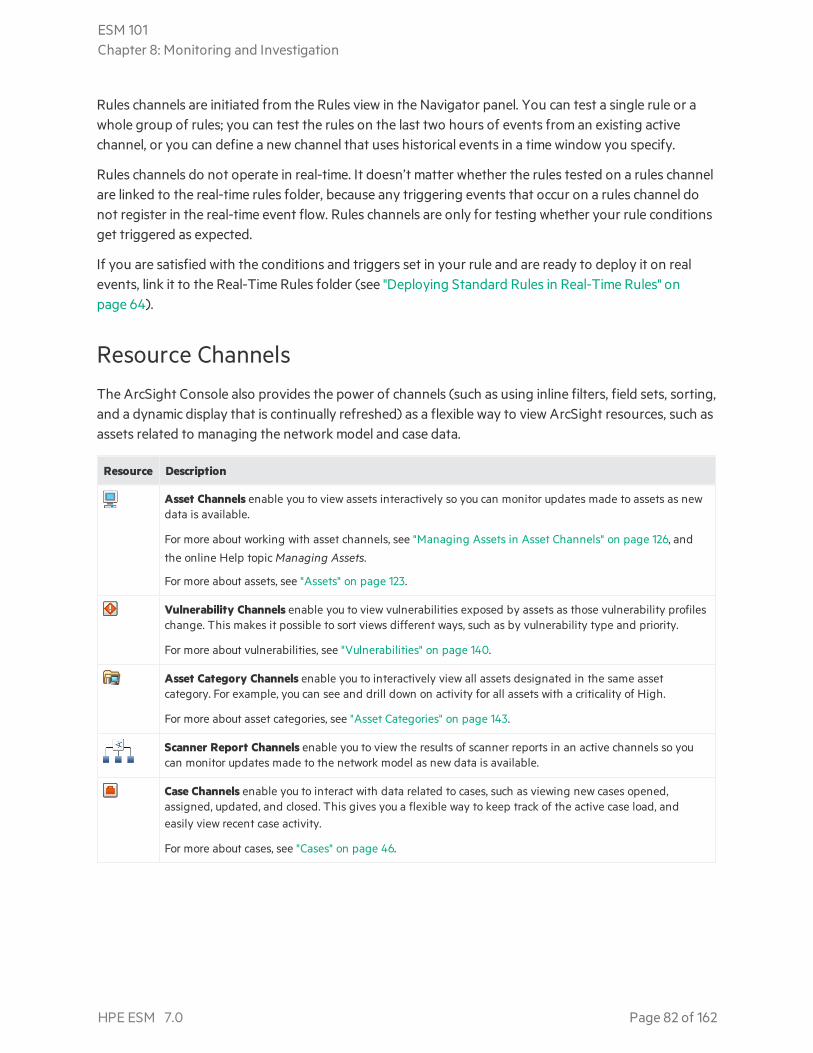
Rules channels are initiated from the Rules view in the Navigator panel. You can test a single rule or awhole group of rules; you can test the rules on the last two hours of events from an existing activechannel, or you can define a new channel that uses historical events in a time window you specify.
Rules channels do not operate in real-time. It doesn’t matter whether the rules tested on a rules channelare linked to the real-time rules folder, because any triggering events that occur on a rules channel donot register in the real-time event flow. Rules channels are only for testing whether your rule conditionsget triggered as expected.
If you are satisfied with the conditions and triggers set in your rule and are ready to deploy it on realevents, link it to the Real-Time Rules folder (see "Deploying Standard Rules in Real-Time Rules" onpage 64).
Resource ChannelsThe ArcSight Console also provides the power of channels (such as using inline filters, field sets, sorting,and a dynamic display that is continually refreshed) as a flexible way to view ArcSight resources, such asassets related to managing the network model and case data.
Resource Description
Asset Channels enable you to view assets interactively so you can monitor updates made to assets as newdata is available.
For more about working with asset channels, see "Managing Assets in Asset Channels" on page 126, and
the online Help topic Managing Assets.
For more about assets, see "Assets" on page 123.
Vulnerability Channels enable you to view vulnerabilities exposed by assets as those vulnerability profileschange. This makes it possible to sort views different ways, such as by vulnerability type and priority.
For more about vulnerabilities, see "Vulnerabilities" on page 140.
Asset Category Channels enable you to interactively view all assets designated in the same assetcategory. For example, you can see and drill down on activity for all assets with a criticality of High.
For more about asset categories, see "Asset Categories" on page 143.
Scanner Report Channels enable you to view the results of scanner reports in an active channels so youcan monitor updates made to the network model as new data is available.
Case Channels enable you to interact with data related to cases, such as viewing new cases opened,assigned, updated, and closed. This gives you a flexible way to keep track of the active case load, andeasily view recent case activity.
For more about cases, see "Cases" on page 46.
ESM 101Chapter 8: Monitoring and Investigation
HPE ESM 7.0 Page 82 of 162
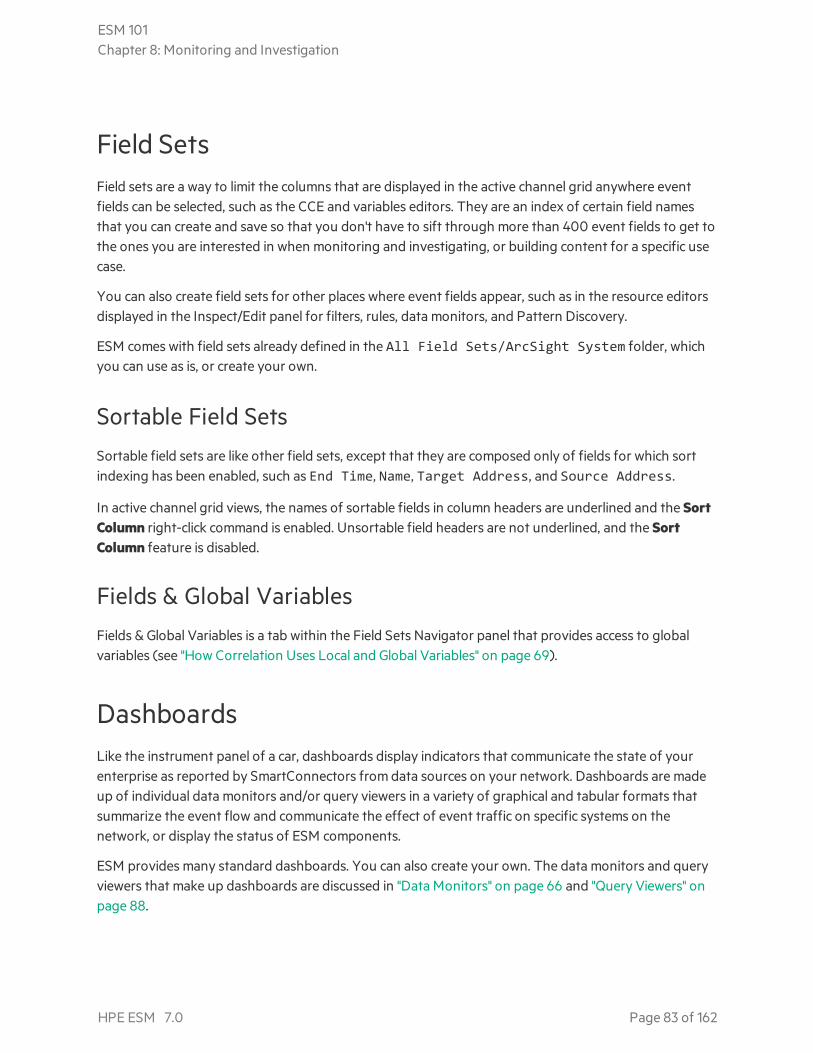
Field SetsField sets are a way to limit the columns that are displayed in the active channel grid anywhere eventfields can be selected, such as the CCE and variables editors. They are an index of certain field namesthat you can create and save so that you don't have to sift through more than 400 event fields to get tothe ones you are interested in when monitoring and investigating, or building content for a specific usecase.
You can also create field sets for other places where event fields appear, such as in the resource editorsdisplayed in the Inspect/Edit panel for filters, rules, data monitors, and Pattern Discovery.
ESM comes with field sets already defined in the All Field Sets/ArcSight System folder, whichyou can use as is, or create your own.
Sortable Field SetsSortable field sets are like other field sets, except that they are composed only of fields for which sortindexing has been enabled, such as End Time, Name, Target Address, and Source Address.
In active channel grid views, the names of sortable fields in column headers are underlined and the SortColumn right-click command is enabled. Unsortable field headers are not underlined, and the SortColumn feature is disabled.
Fields & Global VariablesFields & Global Variables is a tab within the Field Sets Navigator panel that provides access to globalvariables (see "How Correlation Uses Local and Global Variables" on page 69).
DashboardsLike the instrument panel of a car, dashboards display indicators that communicate the state of yourenterprise as reported by SmartConnectors from data sources on your network. Dashboards are madeup of individual data monitors and/or query viewers in a variety of graphical and tabular formats thatsummarize the event flow and communicate the effect of event traffic on specific systems on thenetwork, or display the status of ESM components.
ESM provides many standard dashboards. You can also create your own. The data monitors and queryviewers that make up dashboards are discussed in "Data Monitors" on page 66 and "Query Viewers" onpage 88.
ESM 101Chapter 8: Monitoring and Investigation
HPE ESM 7.0 Page 83 of 162
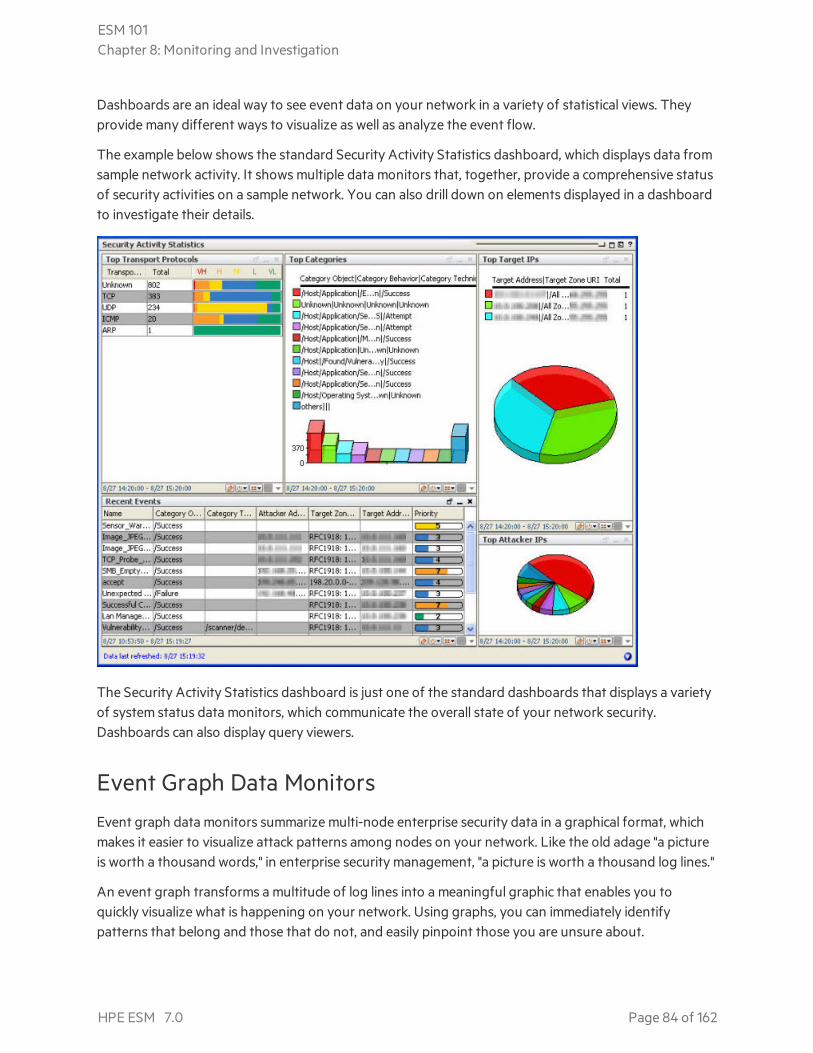
Dashboards are an ideal way to see event data on your network in a variety of statistical views. Theyprovide many different ways to visualize as well as analyze the event flow.
The example below shows the standard Security Activity Statistics dashboard, which displays data fromsample network activity. It shows multiple data monitors that, together, provide a comprehensive statusof security activities on a sample network. You can also drill down on elements displayed in a dashboardto investigate their details.
The Security Activity Statistics dashboard is just one of the standard dashboards that displays a varietyof system status data monitors, which communicate the overall state of your network security.Dashboards can also display query viewers.
Event Graph Data MonitorsEvent graph data monitors summarize multi-node enterprise security data in a graphical format, whichmakes it easier to visualize attack patterns among nodes on your network. Like the old adage "a pictureis worth a thousand words," in enterprise security management, "a picture is worth a thousand log lines."
An event graph transforms a multitude of log lines into a meaningful graphic that enables you toquickly visualize what is happening on your network. Using graphs, you can immediately identifypatterns that belong and those that do not, and easily pinpoint those you are unsure about.
ESM 101Chapter 8: Monitoring and Investigation
HPE ESM 7.0 Page 84 of 162
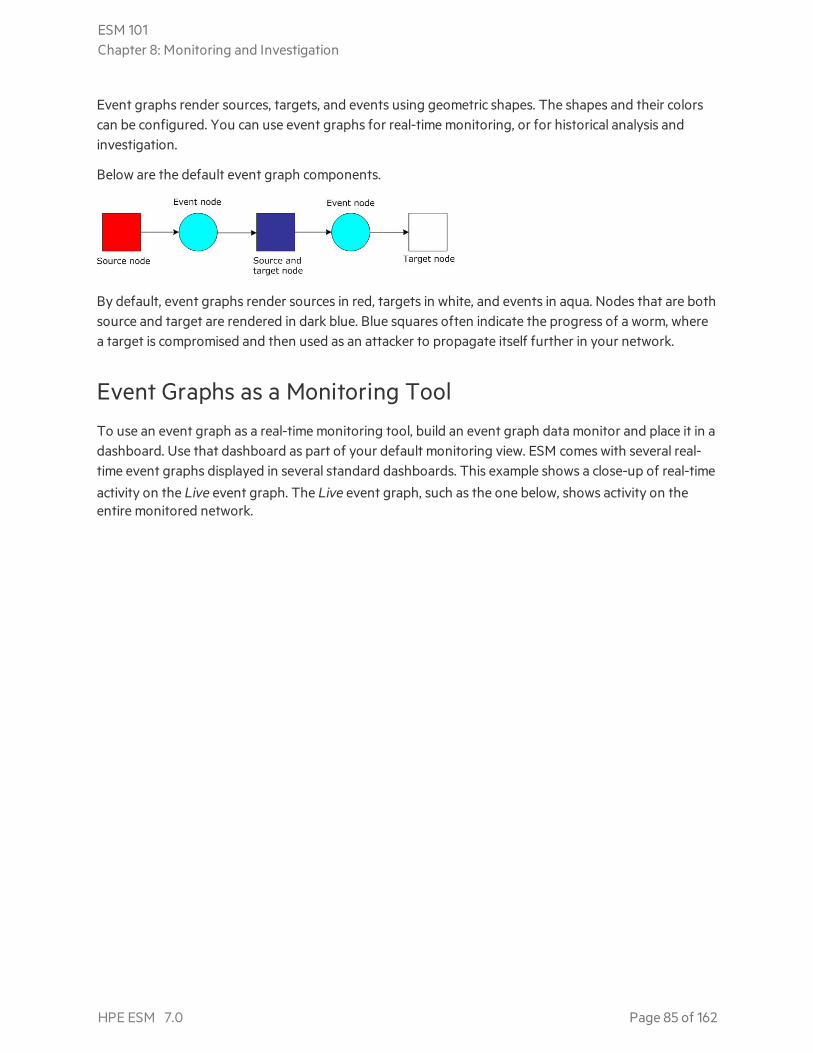
Event graphs render sources, targets, and events using geometric shapes. The shapes and their colorscan be configured. You can use event graphs for real-time monitoring, or for historical analysis andinvestigation.
Below are the default event graph components.
By default, event graphs render sources in red, targets in white, and events in aqua. Nodes that are bothsource and target are rendered in dark blue. Blue squares often indicate the progress of a worm, wherea target is compromised and then used as an attacker to propagate itself further in your network.
Event Graphs as a Monitoring ToolTo use an event graph as a real-time monitoring tool, build an event graph data monitor and place it in adashboard. Use that dashboard as part of your default monitoring view. ESM comes with several real-time event graphs displayed in several standard dashboards. This example shows a close-up of real-timeactivity on the Live event graph. The Live event graph, such as the one below, shows activity on theentire monitored network.
ESM 101Chapter 8: Monitoring and Investigation
HPE ESM 7.0 Page 85 of 162
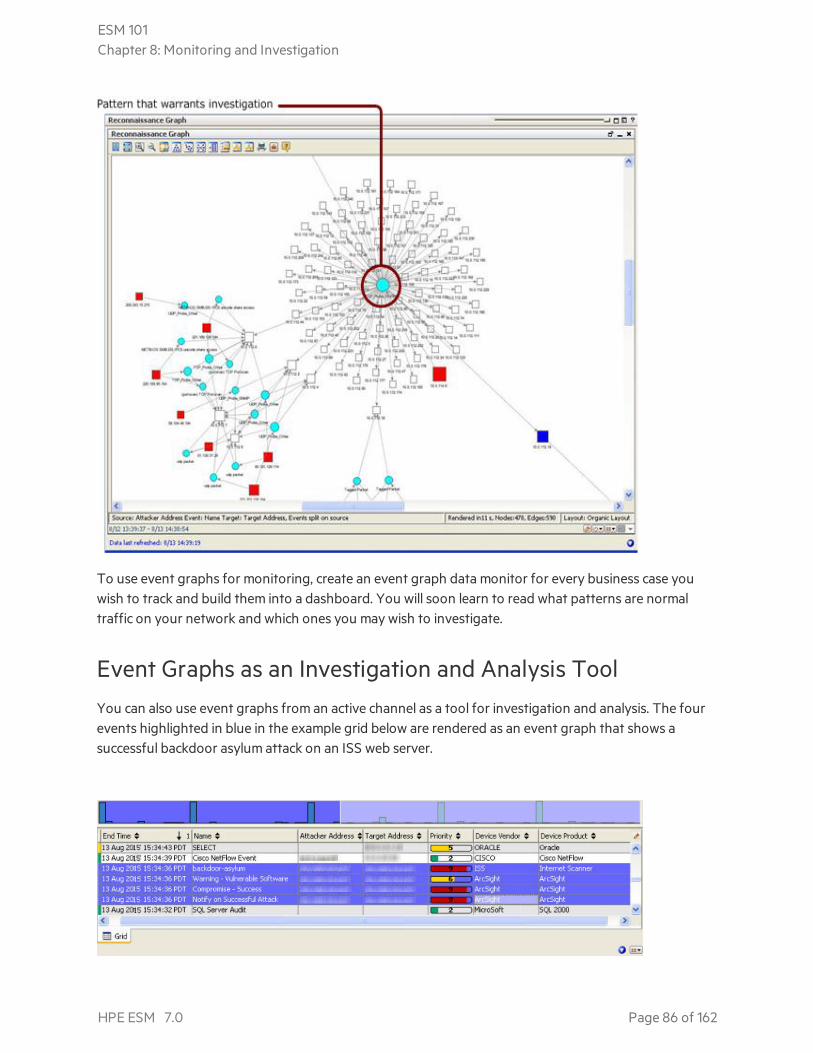
To use event graphs for monitoring, create an event graph data monitor for every business case youwish to track and build them into a dashboard. You will soon learn to read what patterns are normaltraffic on your network and which ones you may wish to investigate.
Event Graphs as an Investigation and Analysis ToolYou can also use event graphs from an active channel as a tool for investigation and analysis. The fourevents highlighted in blue in the example grid below are rendered as an event graph that shows asuccessful backdoor asylum attack on an ISS web server.
ESM 101Chapter 8: Monitoring and Investigation
HPE ESM 7.0 Page 86 of 162
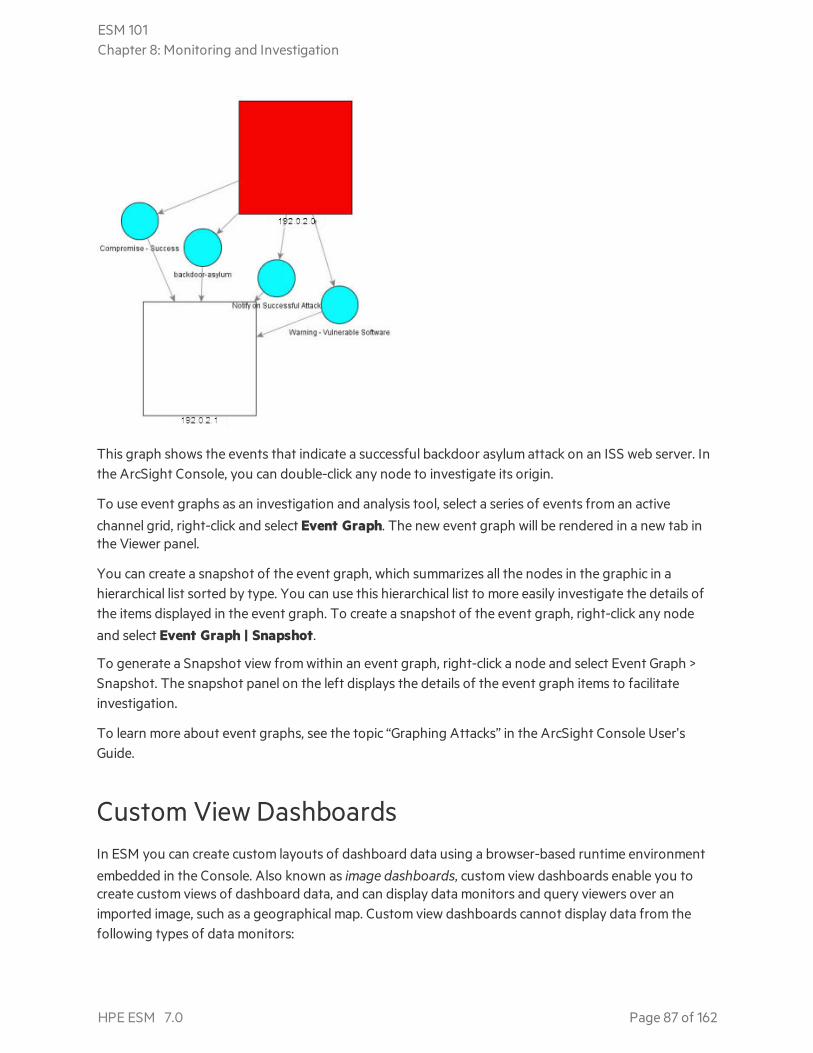
This graph shows the events that indicate a successful backdoor asylum attack on an ISS web server. Inthe ArcSight Console, you can double-click any node to investigate its origin.
To use event graphs as an investigation and analysis tool, select a series of events from an activechannel grid, right-click and select Event Graph. The new event graph will be rendered in a new tab inthe Viewer panel.
You can create a snapshot of the event graph, which summarizes all the nodes in the graphic in ahierarchical list sorted by type. You can use this hierarchical list to more easily investigate the details ofthe items displayed in the event graph. To create a snapshot of the event graph, right-click any nodeand select Event Graph | Snapshot.
To generate a Snapshot view from within an event graph, right-click a node and select Event Graph >Snapshot. The snapshot panel on the left displays the details of the event graph items to facilitateinvestigation.
To learn more about event graphs, see the topic “Graphing Attacks” in the ArcSight Console User’sGuide.
Custom View DashboardsIn ESM you can create custom layouts of dashboard data using a browser-based runtime environment
embedded in the Console. Also known as image dashboards, custom view dashboards enable you tocreate custom views of dashboard data, and can display data monitors and query viewers over animported image, such as a geographical map. Custom view dashboards cannot display data from thefollowing types of data monitors:
ESM 101Chapter 8: Monitoring and Investigation
HPE ESM 7.0 Page 87 of 162
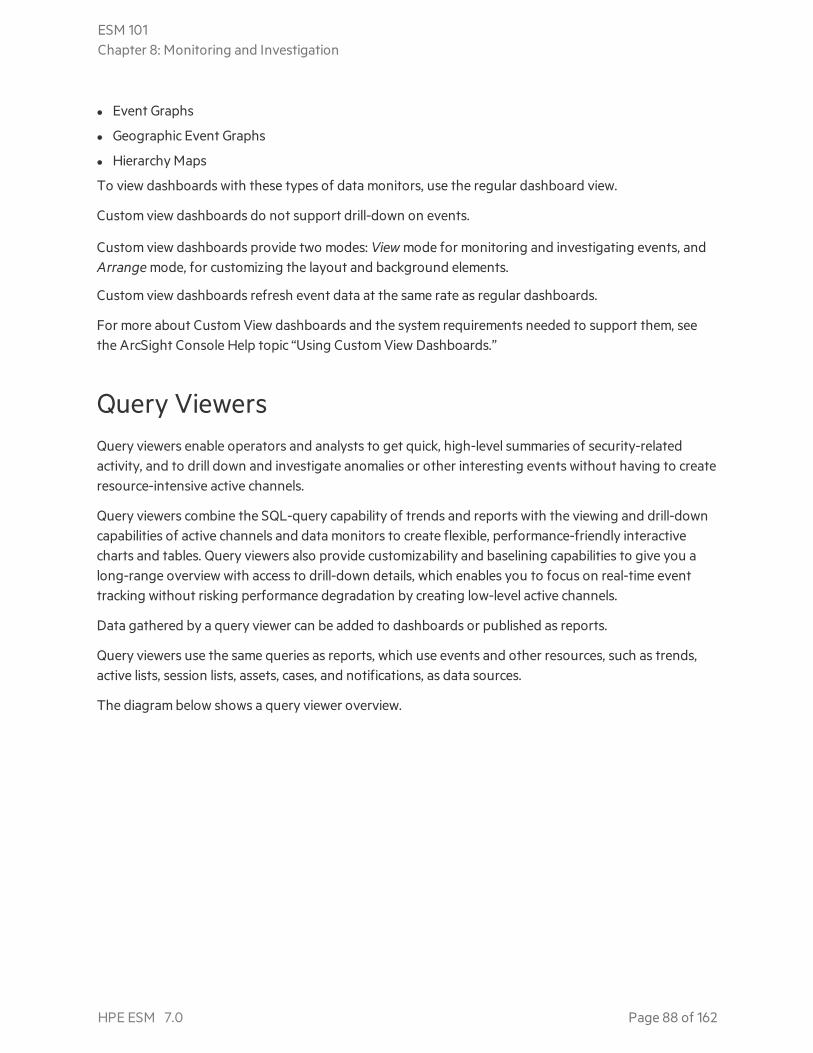
l Event Graphs
l Geographic Event Graphs
l Hierarchy Maps
To view dashboards with these types of data monitors, use the regular dashboard view.
Custom view dashboards do not support drill-down on events.
Custom view dashboards provide two modes: View mode for monitoring and investigating events, andArrange mode, for customizing the layout and background elements.
Custom view dashboards refresh event data at the same rate as regular dashboards.
For more about Custom View dashboards and the system requirements needed to support them, seethe ArcSight Console Help topic “Using Custom View Dashboards.”
Query ViewersQuery viewers enable operators and analysts to get quick, high-level summaries of security-relatedactivity, and to drill down and investigate anomalies or other interesting events without having to createresource-intensive active channels.
Query viewers combine the SQL-query capability of trends and reports with the viewing and drill-downcapabilities of active channels and data monitors to create flexible, performance-friendly interactivecharts and tables. Query viewers also provide customizability and baselining capabilities to give you along-range overview with access to drill-down details, which enables you to focus on real-time eventtracking without risking performance degradation by creating low-level active channels.
Data gathered by a query viewer can be added to dashboards or published as reports.
Query viewers use the same queries as reports, which use events and other resources, such as trends,active lists, session lists, assets, cases, and notifications, as data sources.
The diagram below shows a query viewer overview.
ESM 101Chapter 8: Monitoring and Investigation
HPE ESM 7.0 Page 88 of 162

Query viewers combine the SQL querying ability of trends and reports with the drill-down capabilities ofactive channels in a single resource. The flexibility of SQL queries with access to drill-down detailsenables you to track how a situation is developing in real time. Querying the focused data set of a trendtable is more performance friendly than creating low-level active channels.
Query Viewers as an Investigation and Analysis ToolUse Query Viewers to investigate situations as they are developing. This section uses query viewerswhen an analyst notices there are a high number of failed user logins.
In this example, we created a dashboard with an embedded query viewer. The query viewer shows thetop 10 users with failed logins in a bar chart. The bar chart enables you to drill down to data gathered ina second query viewer that shows failed logins for a particular user with the time, attacker, and targetinformation in a table.
This example is made up of the following resources:
l Base query: Top 10 Users with Failed Logins
l Main query viewer: Top 10 Users with Failed Logins
l Drilldown query: Failed User Logins Drilldown
l Drilldown query viewer: Failed User Logins Drilldown
ESM 101Chapter 8: Monitoring and Investigation
HPE ESM 7.0 Page 89 of 162
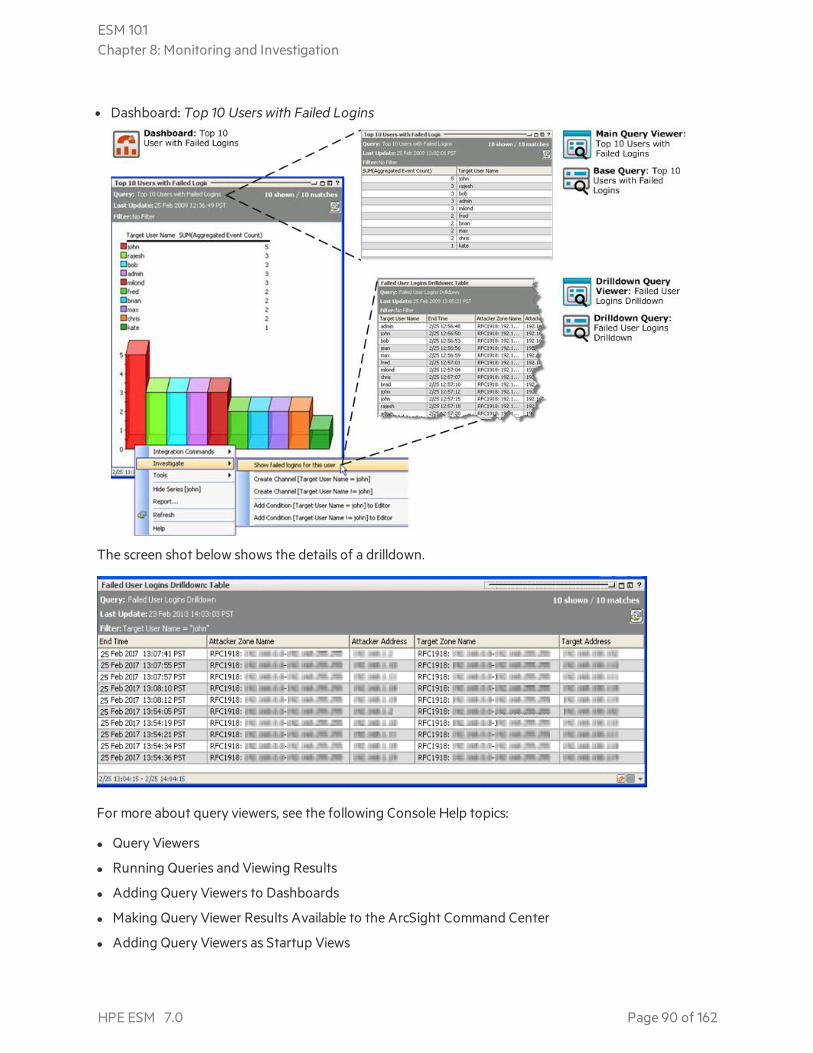
l Dashboard: Top 10 Users with Failed Logins
The screen shot below shows the details of a drilldown.
For more about query viewers, see the following Console Help topics:
l Query Viewers
l Running Queries and Viewing Results
l Adding Query Viewers to Dashboards
l Making Query Viewer Results Available to the ArcSight Command Center
l Adding Query Viewers as Startup Views
ESM 101Chapter 8: Monitoring and Investigation
HPE ESM 7.0 Page 90 of 162

l Generating Reports from Query Viewers
l Defining and Using Baselines
Saved Searches and Search FiltersThrough the use of a flow-based search language, the search feature enables you to specify multiplesearch commands in a pipeline format. Use a simple keyword search or use complex queries that includeBoolean expressions, keywords, fields, and regular expressions. As you create your query expression, aSearch Builder tool provides suggestions through visual representations of conditions you are includingin your query.
You can view search results in a table or histogram format or view them in various chart formats. Searchresults are saved as reports in PDF.
If you think you will use the same query in the future, save it as a search filter or as a saved search. Asearch filter has the same query expression but not the same time range specified in the original query.A saved search saves the query and time range you originally specified. Furthermore, you can schedulea saved search to be run on a regular basis.
For more details about searches and filters, refer to the ArcSight Command Center User’s Guide’schapter on “Searching and Analyzing Events.”
Once the searches and filters are created on the Command Center, these are made available asresources on the ArcSight Console. In the Console, you can organize them into resource groups andcreate resource packages. Refer to the ArcSight Console’s User’s Guide’s chapter on “ManagingResources” for more information.
Distributed Searches Among PeersConfigured peers consist of ArcSight Managers and Loggers. One Manager initiates the peerrelationship by generating credentials and sending these to the target peer. The IP address is used as abasis for generating a unique ID and code used exclusively for peer authentication. This method is moresecure than a username-password type of authentication.
Running search queries are limited to the local system by default. However, with an existing peerconfiguration, you can extend the search to remote peers.
Refer to the Administration section of the ArcSight Command Center User’s Guide for information onhow to configure peers and the Searching for Events section on how to run distributed searches.
ESM 101Chapter 8: Monitoring and Investigation
HPE ESM 7.0 Page 91 of 162
Integration CommandsIntegration commands are a set of tools that make it possible to invoke scripts and utilities from severalplaces in the ArcSight Console, and to provide snap-in views of other applications, such as ArcSightLogger and third-party applications, within the ArcSight Console. This enables you to use the ArcSightConsole as a central command hub for all security-related operations.
Once integrated, the commands, tools, and applications can be launched on demand from within theConsole, such as from a right-click context menu within an events grid.
Integration commands enable you to:
l Build “ESM context-sensitive” commands that can run locally or on multiple, remote target servers,and can be mixed, matched, and re-used with configurations.
l Associate parameters with commands to leverage data gathered by ESM in the context in which thecommands are called. Command parameters make use of Velocity expressions to pick up values froma wide range of ESM fields and resources.
l Define configurations (“families of commands”) for various external applications to specify relevantESM contexts, commands, and, if applicable, remote targets.
Here are some example scenarios of how integration commands can be used to integrate othercommands and applications to expand ESM’s monitoring and investigation capabilities.
Third-Party Integration ScenariosTypical activities for which you might want to build and run commands in the ArcSight Console thatconnect to other applications and tools include:
l Launch third-party Web interfaces
l Launch scripts
l Run external searches
l View submitted tickets
l Get Asset/Vulnerability information
l Get Payload Information
Authorization to send commands to the external application is configured through integrationparameters added to the user resource. For more about setting permissions for integrated commands,see the Console Help topics “Contexts and Parameters” and “Setting User Login Parameters”.
ESM 101Chapter 8: Monitoring and Investigation
HPE ESM 7.0 Page 92 of 162
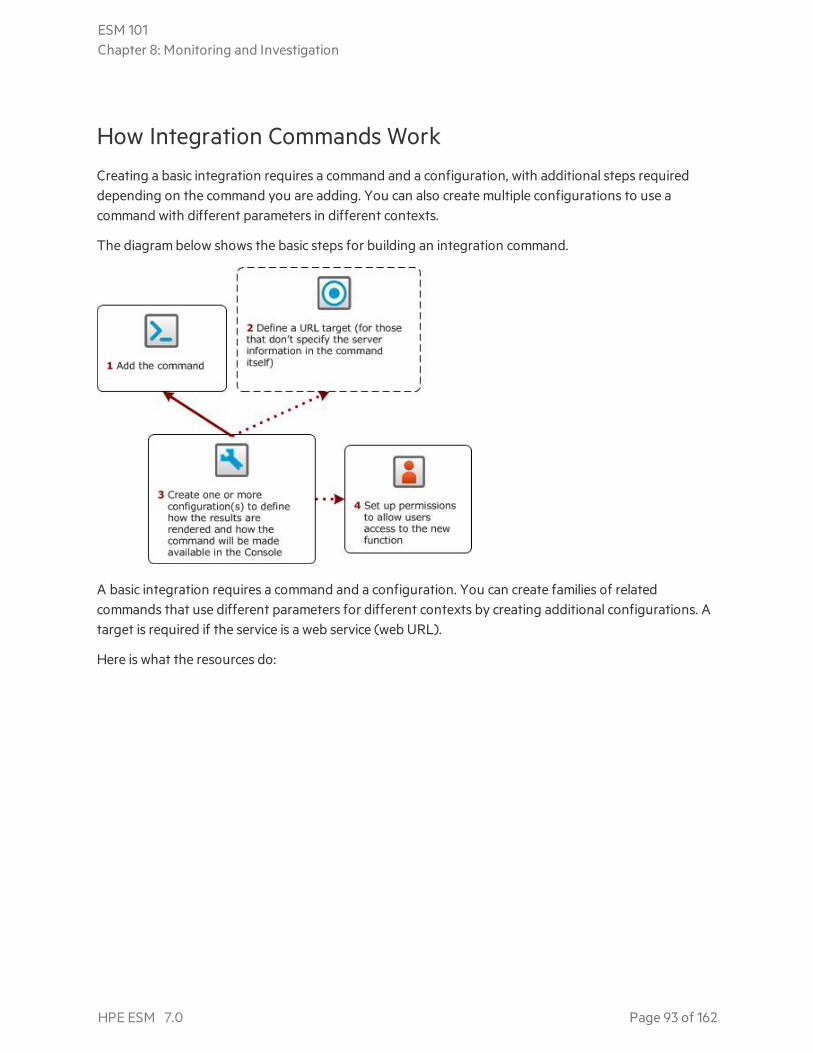
How Integration Commands WorkCreating a basic integration requires a command and a configuration, with additional steps requireddepending on the command you are adding. You can also create multiple configurations to use acommand with different parameters in different contexts.
The diagram below shows the basic steps for building an integration command.
A basic integration requires a command and a configuration. You can create families of relatedcommands that use different parameters for different contexts by creating additional configurations. Atarget is required if the service is a web service (web URL).
Here is what the resources do:
ESM 101Chapter 8: Monitoring and Investigation
HPE ESM 7.0 Page 93 of 162

Resource Description
Integration Command
The integration command resource is where you specify the syntax of the command itself, and the type ofcommand it is, such as Web URL or executable script.
Integration Target
If the command you are integrating is accessed by URL, the integration configuration needs to know thedestination of the command (where the command is run). In the case of a publicly hosted web service, suchas a Google search, you do not need to set up a separate Target resource, because the URL of the service isall the configuration needs to access the service.
A Target resource is only required if there is more than one possible destination for the web service, orvalues required to access the web service, such as host name or IP address, or login credentials.
If you are integrating Logger commands into your setup, you would set up a Target for each Loggerinstance you are integrating.
Integration Configuration
The configuration resource binds a command with how it will be made available in the ArcSight Console,and any applicable external targets. In the configuration resource, you specify:
l The attributes: This specifies general information about the command, including the renderer, whichdescribes how the command results will be displayed depending on the type of command. For example,you can specify whether a URL command invokes a browser internal or external to ESM, or for Connectorcommands that return XML data, and the XML data can be rendered in plain text or formatted as XML.
l The context: The context specifies where in the Console UI the command is made available, forexample, in a viewer (for monitoring and investigation), an asset or asset range resource (for running acommand), or an editor (for correlation authoring).
l The command: Select among existing commands, or create a new one.
l The target: If the service is remotely hosted, select among existing integration targets, or create a newone.
Supported Command TypesYou can build these types of commands into the ArcSight Console:
Command Type Output Results
URL commands provide links to Web page URLs or URIs Browser window
Script commands define an executable script Script/executable output result (action the command takes)
For more information about working with commands, see the topic “Adding and Editing Commands” inthe ArcSight Console Help.
How to Use Available CommandsCommands can be made available in some or all of the following locations in the ArcSight Console.
ESM 101Chapter 8: Monitoring and Investigation
HPE ESM 7.0 Page 94 of 162
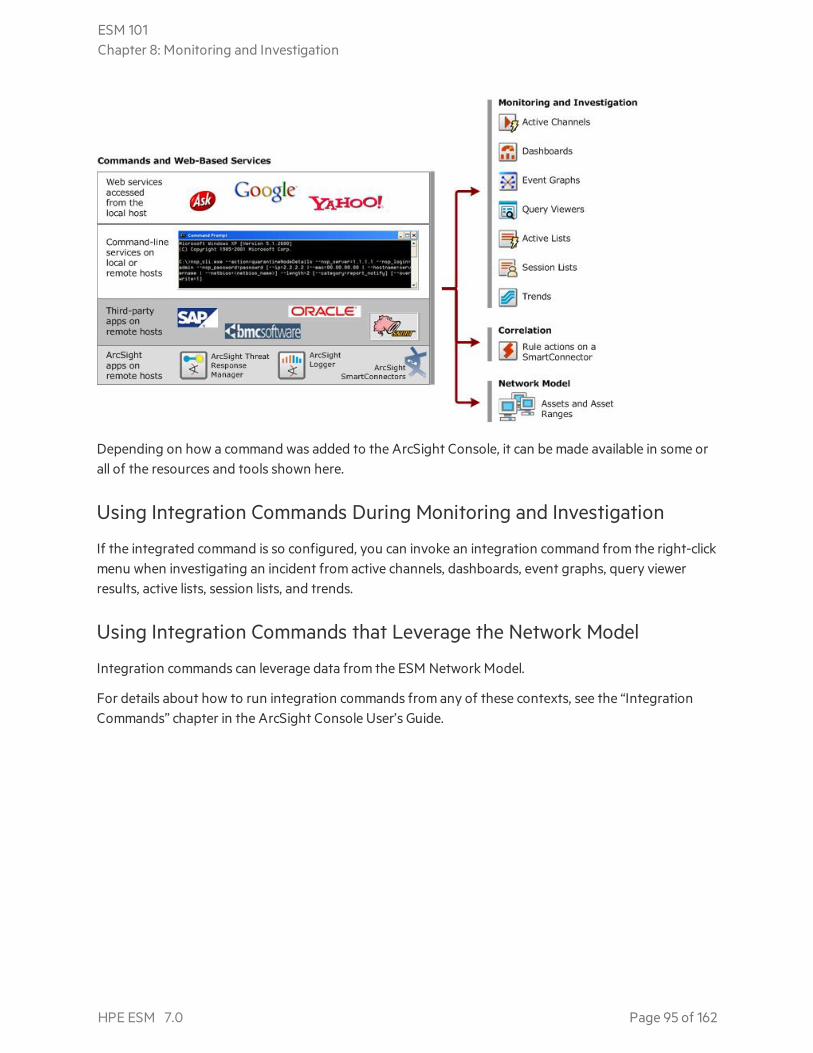
Depending on how a command was added to the ArcSight Console, it can be made available in some orall of the resources and tools shown here.
Using Integration Commands During Monitoring and Investigation
If the integrated command is so configured, you can invoke an integration command from the right-clickmenu when investigating an incident from active channels, dashboards, event graphs, query viewerresults, active lists, session lists, and trends.
Using Integration Commands that Leverage the Network Model
Integration commands can leverage data from the ESM Network Model.
For details about how to run integration commands from any of these contexts, see the “IntegrationCommands” chapter in the ArcSight Console User’s Guide.
ESM 101Chapter 8: Monitoring and Investigation
HPE ESM 7.0 Page 95 of 162
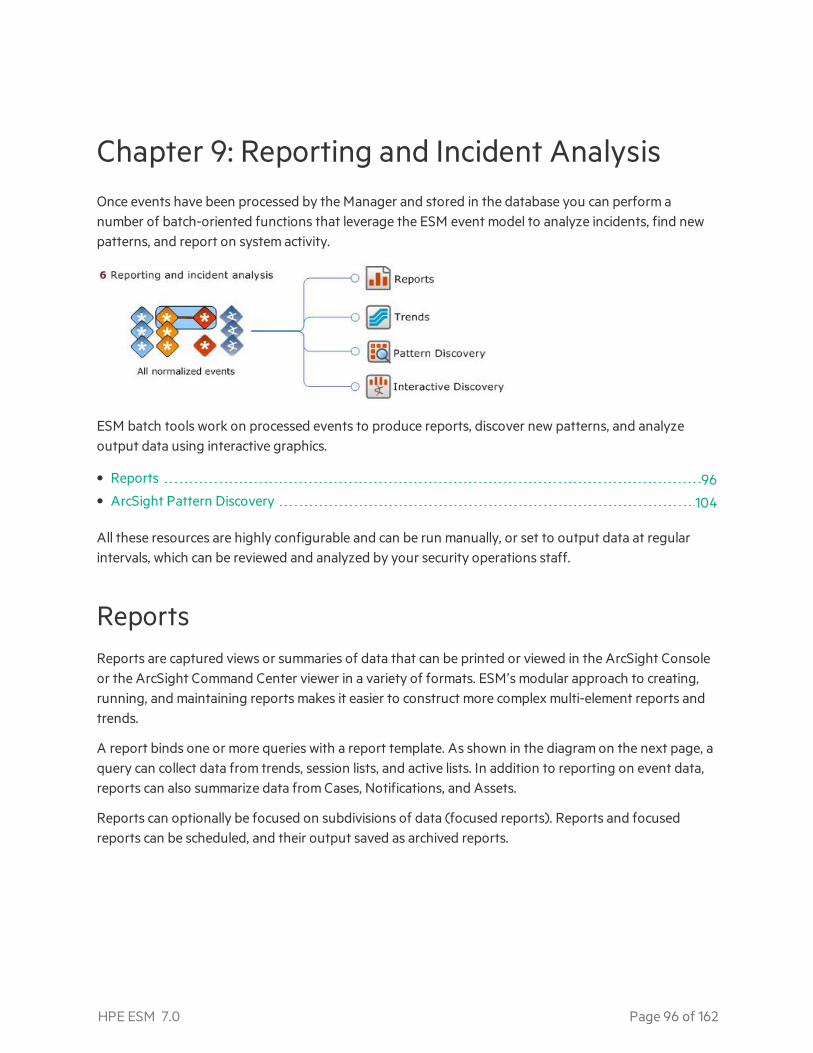
Chapter 9: Reporting and Incident AnalysisOnce events have been processed by the Manager and stored in the database you can perform anumber of batch-oriented functions that leverage the ESM event model to analyze incidents, find newpatterns, and report on system activity.
ESM batch tools work on processed events to produce reports, discover new patterns, and analyzeoutput data using interactive graphics.
• Reports 96• ArcSight Pattern Discovery 104
All these resources are highly configurable and can be run manually, or set to output data at regularintervals, which can be reviewed and analyzed by your security operations staff.
ReportsReports are captured views or summaries of data that can be printed or viewed in the ArcSight Consoleor the ArcSight Command Center viewer in a variety of formats. ESM’s modular approach to creating,running, and maintaining reports makes it easier to construct more complex multi-element reports andtrends.
A report binds one or more queries with a report template. As shown in the diagram on the next page, aquery can collect data from trends, session lists, and active lists. In addition to reporting on event data,reports can also summarize data from Cases, Notifications, and Assets.
Reports can optionally be focused on subdivisions of data (focused reports). Reports and focusedreports can be scheduled, and their output saved as archived reports.
HPE ESM 7.0 Page 96 of 162
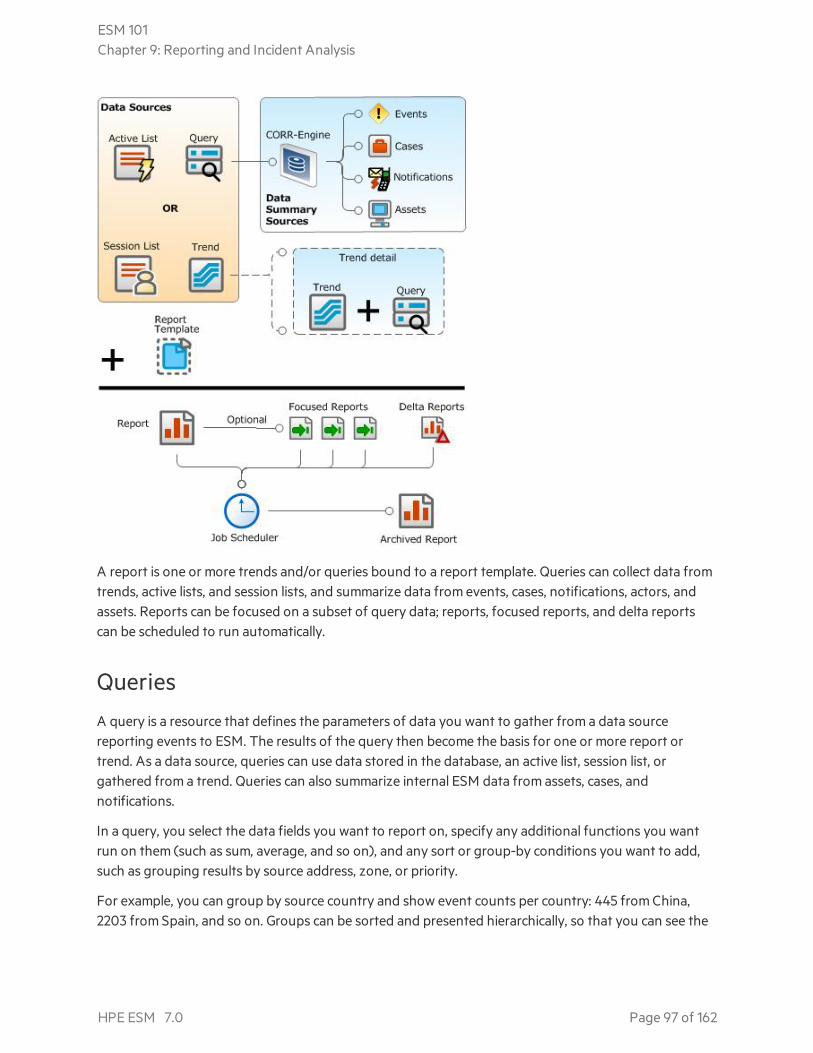
A report is one or more trends and/or queries bound to a report template. Queries can collect data fromtrends, active lists, and session lists, and summarize data from events, cases, notifications, actors, andassets. Reports can be focused on a subset of query data; reports, focused reports, and delta reportscan be scheduled to run automatically.
QueriesA query is a resource that defines the parameters of data you want to gather from a data sourcereporting events to ESM. The results of the query then become the basis for one or more report ortrend. As a data source, queries can use data stored in the database, an active list, session list, orgathered from a trend. Queries can also summarize internal ESM data from assets, cases, andnotifications.
In a query, you select the data fields you want to report on, specify any additional functions you wantrun on them (such as sum, average, and so on), and any sort or group-by conditions you want to add,such as grouping results by source address, zone, or priority.
For example, you can group by source country and show event counts per country: 445 from China,2203 from Spain, and so on. Groups can be sorted and presented hierarchically, so that you can see the
ESM 101Chapter 9: Reporting and Incident Analysis
HPE ESM 7.0 Page 97 of 162
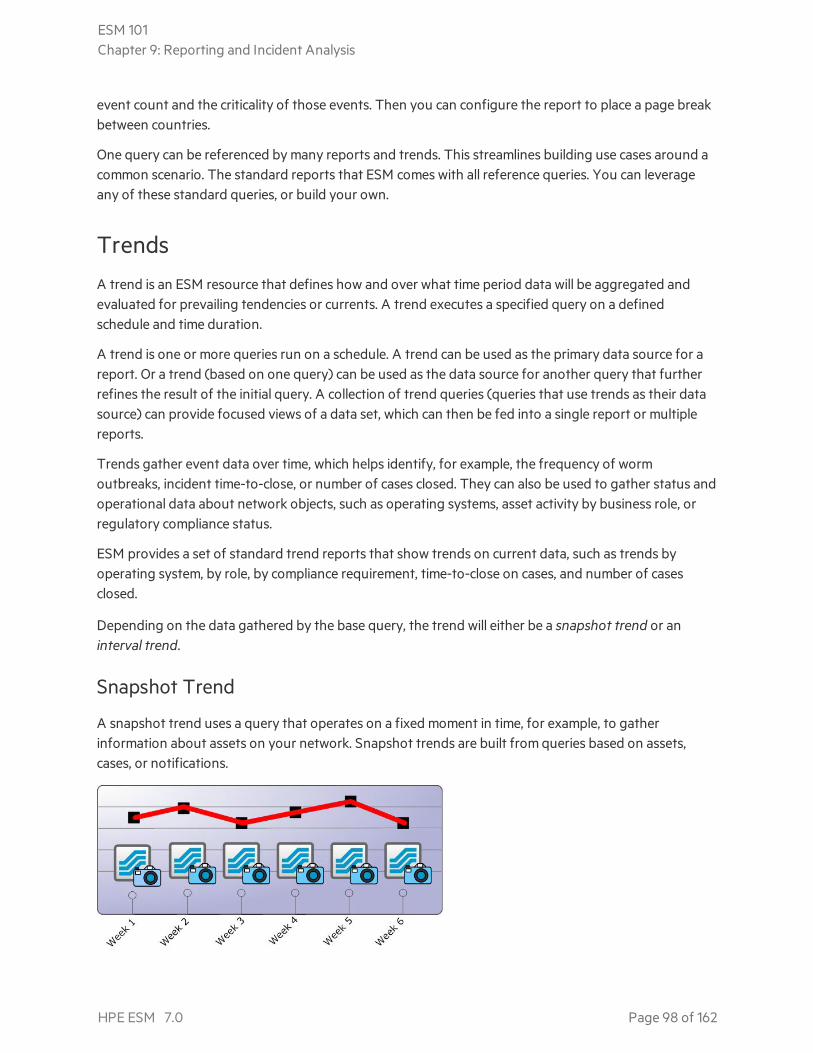
event count and the criticality of those events. Then you can configure the report to place a page breakbetween countries.
One query can be referenced by many reports and trends. This streamlines building use cases around acommon scenario. The standard reports that ESM comes with all reference queries. You can leverageany of these standard queries, or build your own.
TrendsA trend is an ESM resource that defines how and over what time period data will be aggregated andevaluated for prevailing tendencies or currents. A trend executes a specified query on a definedschedule and time duration.
A trend is one or more queries run on a schedule. A trend can be used as the primary data source for areport. Or a trend (based on one query) can be used as the data source for another query that furtherrefines the result of the initial query. A collection of trend queries (queries that use trends as their datasource) can provide focused views of a data set, which can then be fed into a single report or multiplereports.
Trends gather event data over time, which helps identify, for example, the frequency of wormoutbreaks, incident time-to-close, or number of cases closed. They can also be used to gather status andoperational data about network objects, such as operating systems, asset activity by business role, orregulatory compliance status.
ESM provides a set of standard trend reports that show trends on current data, such as trends byoperating system, by role, by compliance requirement, time-to-close on cases, and number of casesclosed.
Depending on the data gathered by the base query, the trend will either be a snapshot trend or aninterval trend.
Snapshot Trend
A snapshot trend uses a query that operates on a fixed moment in time, for example, to gatherinformation about assets on your network. Snapshot trends are built from queries based on assets,cases, or notifications.
ESM 101Chapter 9: Reporting and Incident Analysis
HPE ESM 7.0 Page 98 of 162
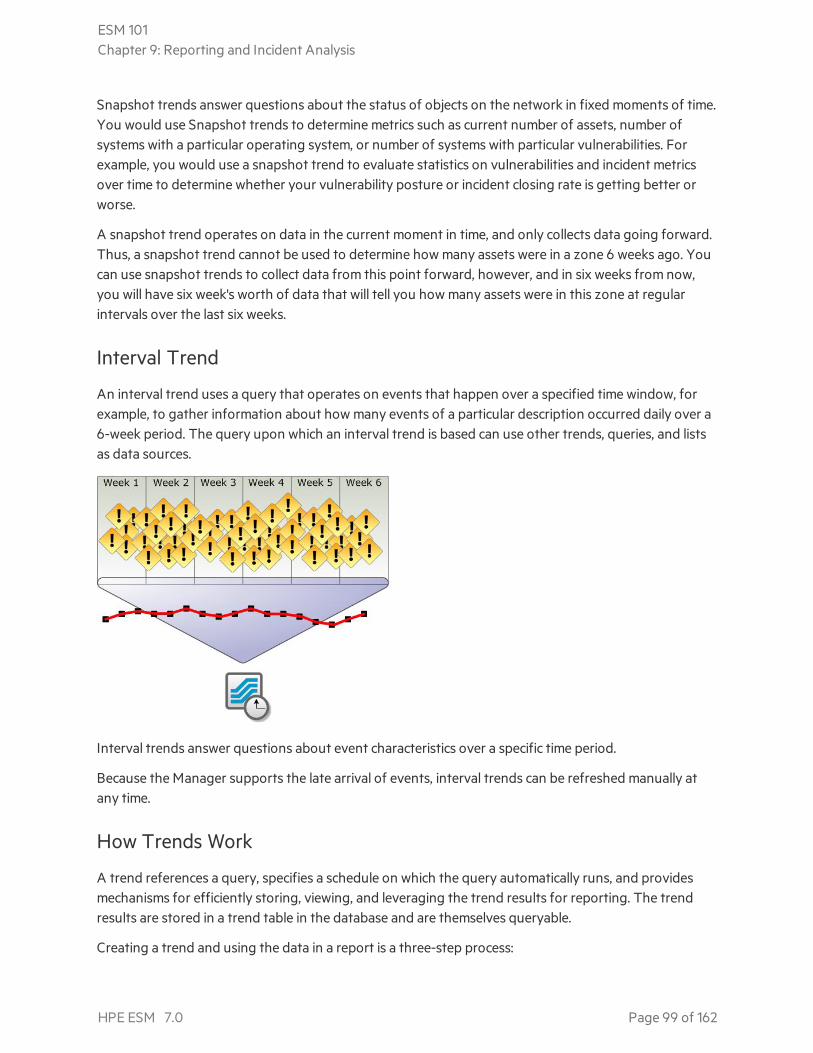
Snapshot trends answer questions about the status of objects on the network in fixed moments of time.You would use Snapshot trends to determine metrics such as current number of assets, number ofsystems with a particular operating system, or number of systems with particular vulnerabilities. Forexample, you would use a snapshot trend to evaluate statistics on vulnerabilities and incident metricsover time to determine whether your vulnerability posture or incident closing rate is getting better orworse.
A snapshot trend operates on data in the current moment in time, and only collects data going forward.Thus, a snapshot trend cannot be used to determine how many assets were in a zone 6 weeks ago. Youcan use snapshot trends to collect data from this point forward, however, and in six weeks from now,you will have six week's worth of data that will tell you how many assets were in this zone at regularintervals over the last six weeks.
Interval Trend
An interval trend uses a query that operates on events that happen over a specified time window, forexample, to gather information about how many events of a particular description occurred daily over a6-week period. The query upon which an interval trend is based can use other trends, queries, and listsas data sources.
Interval trends answer questions about event characteristics over a specific time period.
Because the Manager supports the late arrival of events, interval trends can be refreshed manually atany time.
How Trends Work
A trend references a query, specifies a schedule on which the query automatically runs, and providesmechanisms for efficiently storing, viewing, and leveraging the trend results for reporting. The trendresults are stored in a trend table in the database and are themselves queryable.
Creating a trend and using the data in a report is a three-step process:
ESM 101Chapter 9: Reporting and Incident Analysis
HPE ESM 7.0 Page 99 of 162
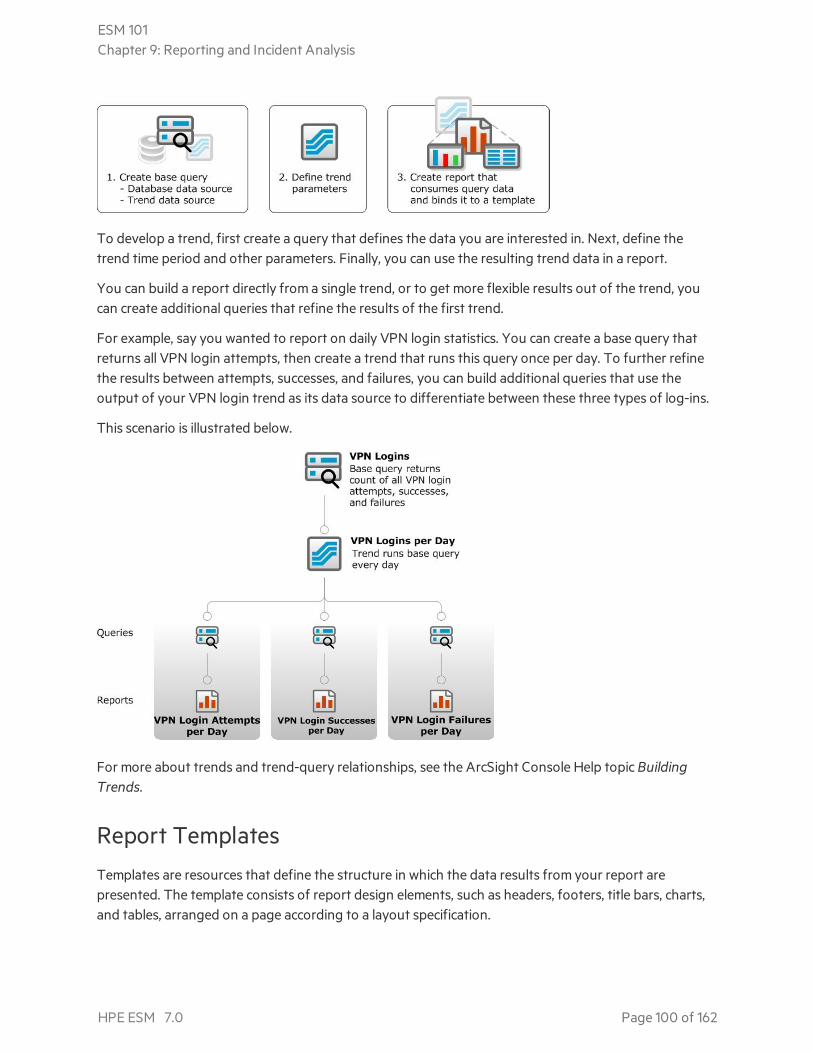
To develop a trend, first create a query that defines the data you are interested in. Next, define thetrend time period and other parameters. Finally, you can use the resulting trend data in a report.
You can build a report directly from a single trend, or to get more flexible results out of the trend, youcan create additional queries that refine the results of the first trend.
For example, say you wanted to report on daily VPN login statistics. You can create a base query thatreturns all VPN login attempts, then create a trend that runs this query once per day. To further refinethe results between attempts, successes, and failures, you can build additional queries that use theoutput of your VPN login trend as its data source to differentiate between these three types of log-ins.
This scenario is illustrated below.
For more about trends and trend-query relationships, see the ArcSight Console Help topic BuildingTrends.
Report TemplatesTemplates are resources that define the structure in which the data results from your report arepresented. The template consists of report design elements, such as headers, footers, title bars, charts,and tables, arranged on a page according to a layout specification.
ESM 101Chapter 9: Reporting and Incident Analysis
HPE ESM 7.0 Page 100 of 162
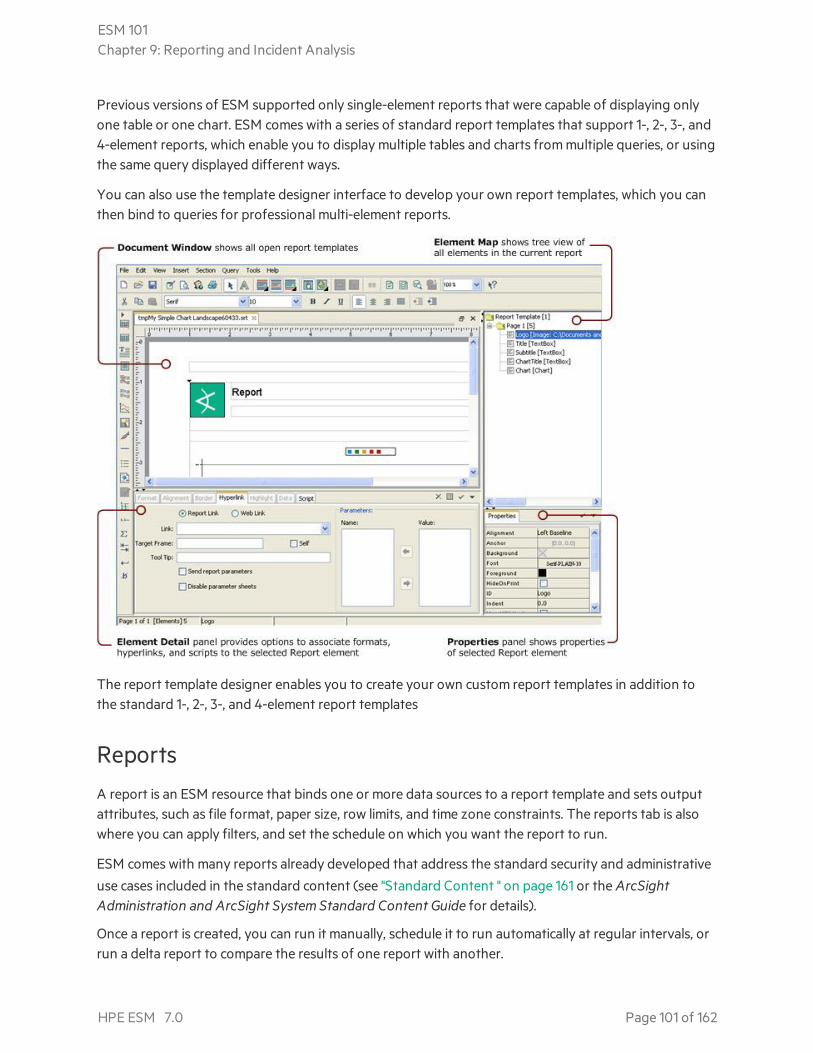
Previous versions of ESM supported only single-element reports that were capable of displaying onlyone table or one chart. ESM comes with a series of standard report templates that support 1-, 2-, 3-, and4-element reports, which enable you to display multiple tables and charts from multiple queries, or usingthe same query displayed different ways.
You can also use the template designer interface to develop your own report templates, which you canthen bind to queries for professional multi-element reports.
The report template designer enables you to create your own custom report templates in addition tothe standard 1-, 2-, 3-, and 4-element report templates
ReportsA report is an ESM resource that binds one or more data sources to a report template and sets outputattributes, such as file format, paper size, row limits, and time zone constraints. The reports tab is alsowhere you can apply filters, and set the schedule on which you want the report to run.
ESM comes with many reports already developed that address the standard security and administrative
use cases included in the standard content (see "Standard Content " on page 161 or the ArcSightAdministration and ArcSight System Standard Content Guide for details).
Once a report is created, you can run it manually, schedule it to run automatically at regular intervals, orrun a delta report to compare the results of one report with another.
ESM 101Chapter 9: Reporting and Incident Analysis
HPE ESM 7.0 Page 101 of 162

All report results are displayed in the ArcSight Console report viewer in the Viewer panel. You can alsorun, archive, and delete reports using the ArcSight Command Center client.
Archived Reports
After running a report, you can elect to save (archive) the report results. This enables you to retrievethe results of a particular report for immediate viewing without having to regenerate the report.Reports that are run on a schedule are saved in the Archives tab so they can be reviewed later, orforwarded to an e-mail list.
Archived reports can also be sent to a notification group after the scheduled report is run.
Delta Reports
A delta report compares the result sets from two different queries run from the same report definitionusing different parameters, such as today's date and yesterday's date. This is useful to compare resultsfrom one time period with another, or one business division with another.
The differences may be presented in a file or as a series of events. Each row represents one event thatdiffered between the two queries. Delta reports have limited presentation features. For details aboutthe features available for delta reports, see the ArcSight Console Help topic Running a Delta Report.
Focused Reports
Focused reports are a type of report that consist of a master report definition and parameters thatfocus on a subset of the data captured by the master report. This enables you to generate a separatereport for each subdivision of data, such as individual zones, based on a single overall query withouthaving to copy and modify the master report every time.
For example, if you need to report total event count for systems with different business roles, you cancreate a master report definition called Total Event Count per Business Role and add a parameter thatpoints to the Business Role asset category group and an inGroup condition that points to it. Addingthe parameter and the inGroup condition make the report "focusable."
If you ran the focused report without narrowing the parameters further, it would return the total event
count for all the systems categorized in any Business Role asset category. If you create a focused reportthat further specifies systems categorized in a particular Business Role asset category, such as
Operations, the result would be the total event count for all Operations systems. You can create anotherfocused report for another business role, such as Revenue Generating systems.
You can save each variation as its own Focused Report, which can be run automatically on a regularschedule like any report. Any updates made to the master report are automatically reflected in thefocused report.
ESM 101Chapter 9: Reporting and Incident Analysis
HPE ESM 7.0 Page 102 of 162
Job SchedulerThe job scheduler is a utility that manages the timetables upon which items that can be scheduled arerun. The job scheduler setup menu is available from the editors of the following resources:
l Reports
l Trends
l Focused reports
l Rules
l Pattern Discovery snapshots
You can schedule a report to be run automatically on a yearly, monthly, weekly, daily, or hourly basis.The results of reports run on a schedule are stored in the Archives tab under the name of the user whoscheduled the report.
The report scheduler is located in the Jobs tab of the Reports resource editor.
Scheduled Jobs Manager
The Scheduled Jobs Manager is a utility that makes it possible to coordinate all jobs on a staggeredschedule. For example, if all reports are scheduled to run at 1:00 a.m., system resources may becomeoverburdened at that time. The Scheduled Jobs Manager is available from the System menu and theScheduled Jobs Manager button ( ) in the System toolbar at the top of the ArcSight Console.
The Scheduled Jobs Manager shows all the jobs currently scheduled to be run and their status for ESMresources and system events. Jobs generated by an ESM resource can be edited by selecting Edit Jobfrom the right-click context menu. Jobs generated by ESM system events cannot be edited.
ESM 101Chapter 9: Reporting and Incident Analysis
HPE ESM 7.0 Page 103 of 162
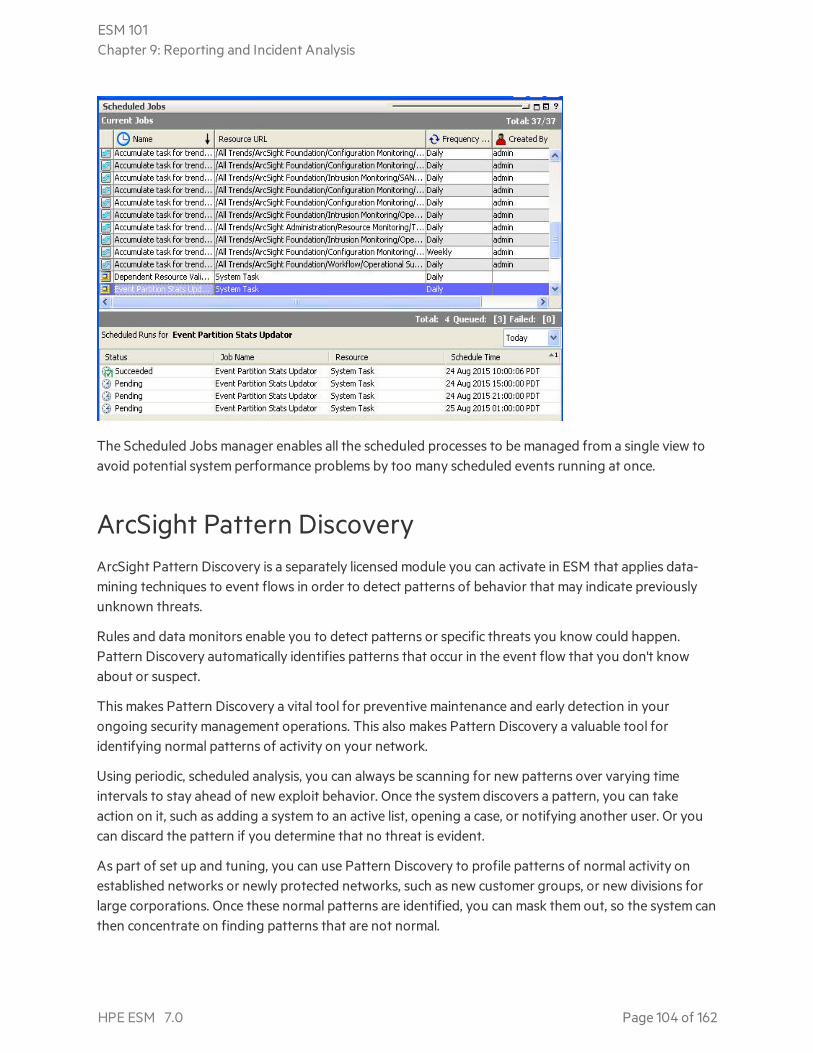
The Scheduled Jobs manager enables all the scheduled processes to be managed from a single view toavoid potential system performance problems by too many scheduled events running at once.
ArcSight Pattern DiscoveryArcSight Pattern Discovery is a separately licensed module you can activate in ESM that applies data-mining techniques to event flows in order to detect patterns of behavior that may indicate previouslyunknown threats.
Rules and data monitors enable you to detect patterns or specific threats you know could happen.Pattern Discovery automatically identifies patterns that occur in the event flow that you don't knowabout or suspect.
This makes Pattern Discovery a vital tool for preventive maintenance and early detection in yourongoing security management operations. This also makes Pattern Discovery a valuable tool foridentifying normal patterns of activity on your network.
Using periodic, scheduled analysis, you can always be scanning for new patterns over varying timeintervals to stay ahead of new exploit behavior. Once the system discovers a pattern, you can takeaction on it, such as adding a system to an active list, opening a case, or notifying another user. Or youcan discard the pattern if you determine that no threat is evident.
As part of set up and tuning, you can use Pattern Discovery to profile patterns of normal activity onestablished networks or newly protected networks, such as new customer groups, or new divisions forlarge corporations. Once these normal patterns are identified, you can mask them out, so the system canthen concentrate on finding patterns that are not normal.
ESM 101Chapter 9: Reporting and Incident Analysis
HPE ESM 7.0 Page 104 of 162
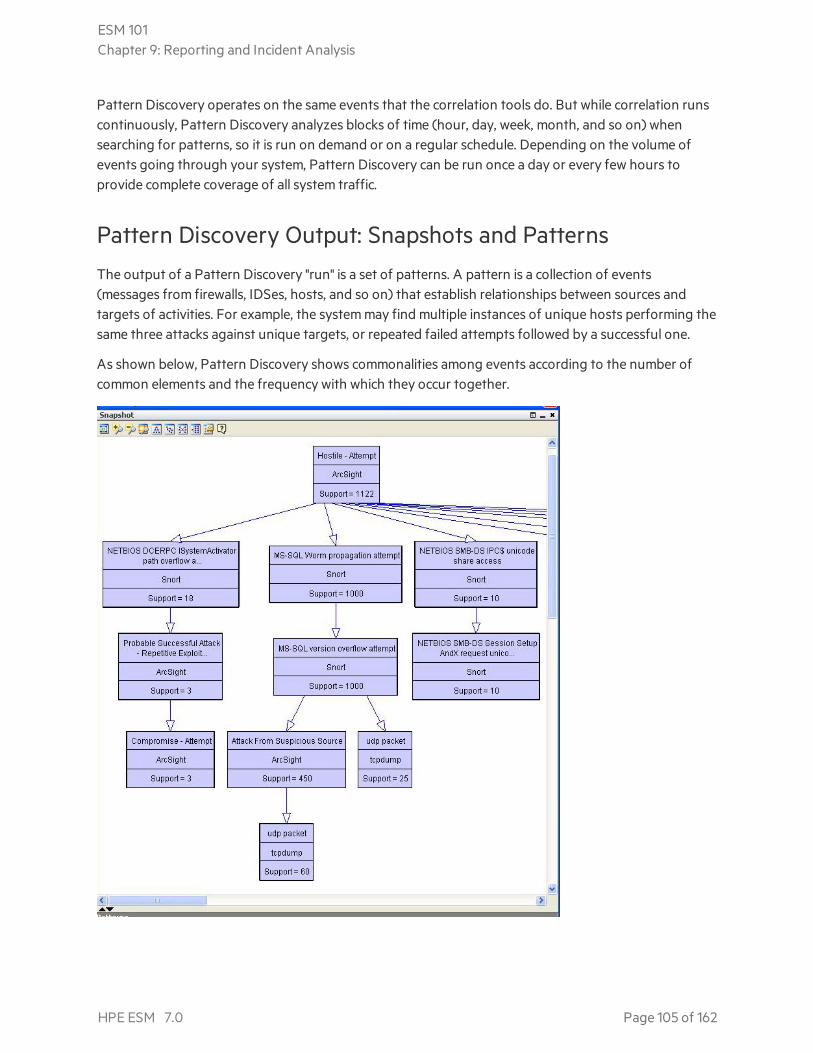
Pattern Discovery operates on the same events that the correlation tools do. But while correlation runscontinuously, Pattern Discovery analyzes blocks of time (hour, day, week, month, and so on) whensearching for patterns, so it is run on demand or on a regular schedule. Depending on the volume ofevents going through your system, Pattern Discovery can be run once a day or every few hours toprovide complete coverage of all system traffic.
Pattern Discovery Output: Snapshots and PatternsThe output of a Pattern Discovery "run" is a set of patterns. A pattern is a collection of events(messages from firewalls, IDSes, hosts, and so on) that establish relationships between sources andtargets of activities. For example, the system may find multiple instances of unique hosts performing thesame three attacks against unique targets, or repeated failed attempts followed by a successful one.
As shown below, Pattern Discovery shows commonalities among events according to the number ofcommon elements and the frequency with which they occur together.
ESM 101Chapter 9: Reporting and Incident Analysis
HPE ESM 7.0 Page 105 of 162

Many different types of security threats generate unique "fingerprints" that Pattern Discovery willcapture. Patterns that represent normal network behavior may reveal characteristics you were unawareof, which can inform your business practices and policies.
For more about Pattern Discovery, see the “Pattern Discovery” topic in in the ArcSight Console User’sGuide or Help.
ESM 101Chapter 9: Reporting and Incident Analysis
HPE ESM 7.0 Page 106 of 162
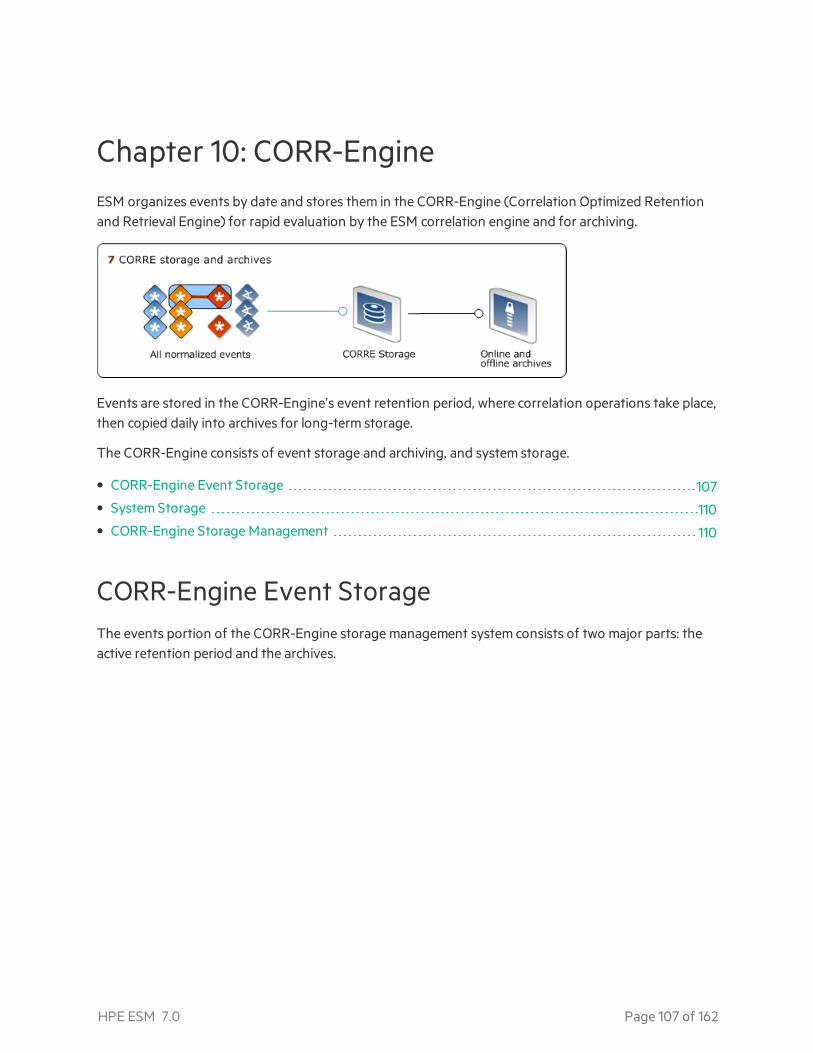
Chapter 10: CORR-EngineESM organizes events by date and stores them in the CORR-Engine (Correlation Optimized Retentionand Retrieval Engine) for rapid evaluation by the ESM correlation engine and for archiving.
Events are stored in the CORR-Engine’s event retention period, where correlation operations take place,then copied daily into archives for long-term storage.
The CORR-Engine consists of event storage and archiving, and system storage.
• CORR-Engine Event Storage 107• System Storage 110• CORR-Engine Storage Management 110
CORR-Engine Event StorageThe events portion of the CORR-Engine storage management system consists of two major parts: theactive retention period and the archives.
HPE ESM 7.0 Page 107 of 162
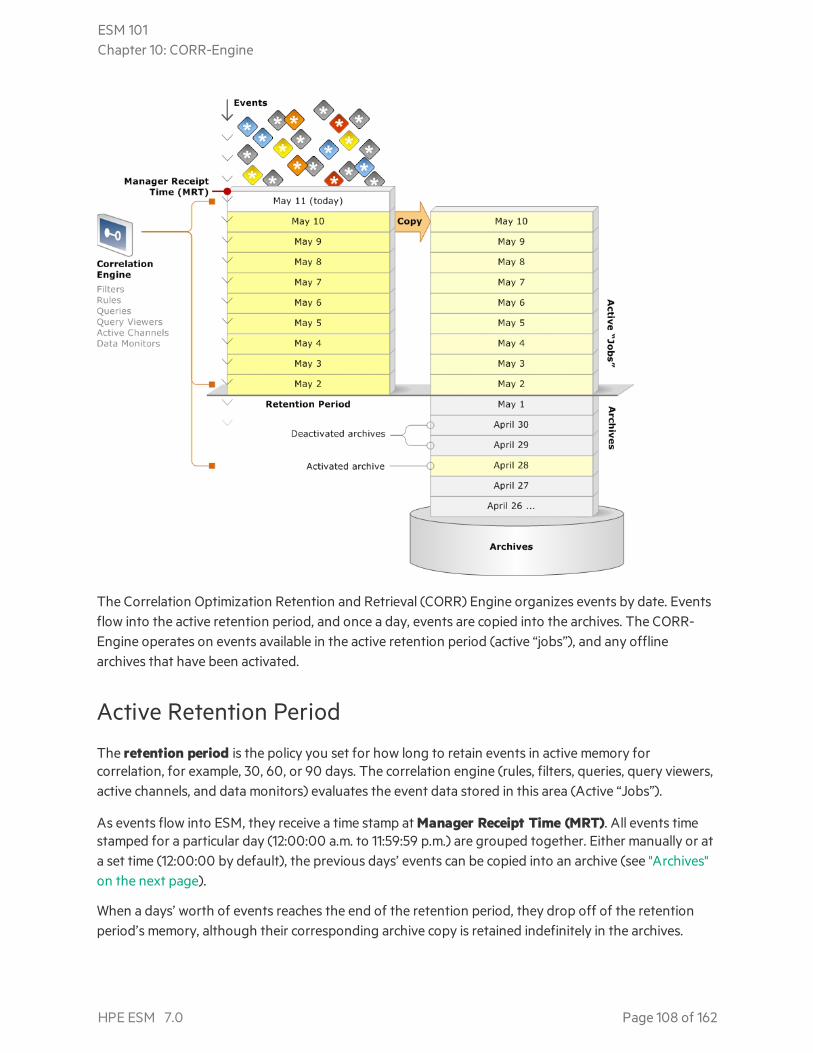
The Correlation Optimization Retention and Retrieval (CORR) Engine organizes events by date. Eventsflow into the active retention period, and once a day, events are copied into the archives. The CORR-Engine operates on events available in the active retention period (active “jobs”), and any offlinearchives that have been activated.
Active Retention Period
The retention period is the policy you set for how long to retain events in active memory forcorrelation, for example, 30, 60, or 90 days. The correlation engine (rules, filters, queries, query viewers,active channels, and data monitors) evaluates the event data stored in this area (Active “Jobs”).
As events flow into ESM, they receive a time stamp at Manager Receipt Time (MRT). All events timestamped for a particular day (12:00:00 a.m. to 11:59:59 p.m.) are grouped together. Either manually or ata set time (12:00:00 by default), the previous days’ events can be copied into an archive (see "Archives"on the next page).
When a days’ worth of events reaches the end of the retention period, they drop off of the retentionperiod’s memory, although their corresponding archive copy is retained indefinitely in the archives.
ESM 101Chapter 10: CORR-Engine
HPE ESM 7.0 Page 108 of 162
Copying a group of events into the active “jobs” archive is a configurable option. If you opt not to save agroup of events in the active “jobs” archive, those events are deleted from the system entirely whenthey time out of the retention period.
ArchivesThe archives are a block of storage within the CORR-Engine for saving copies of events. As long as adays’ worth of events are active in the retention period, their corresponding archive copy is in an activestate, which just means that the original events are still in the retention period’s memory. Correlationhappens on the original events in the retention period, not the active archive copy.
When the original events time out of the active retention period and drop out of active memory, thecorresponding archive copy goes into an archived state, which just means that the original events areno longer in the active memory portion of the CORR-Engine.
At any time, you can reactivate the events in an offline archive, which will make the events available tothe Correlation Engine for evaluation. Events in an activated archive remain stored in the archiveportion of the CORR-Engine, and do not transfer back to the active retention period.
Note that only actual events are stored in the archives. For example, if a single event is aggregatedmultiple times during correlation, the event count as seen in an active channel, query viewer, or reportwill match the number of aggregated events. In storage, that single event will be stored only once andtherefore counted only once.
ESM uses SHA-256 hashing algorithm to validate the integrity of event data archives. See also "Time-and Space-Based Storage Retention" below.
When the user reactivates the events in an offline archive, ESM validates the hashing of the data in thearchive. If the hashes do not match, ESM logs an error message in the logger_server.log file.
Time- and Space-Based Storage RetentionThe CORR-Engine’s event storage operates on two types of retention: time based and space based.They operate in cycles, with time-based retention as the default and space-based retention as aprotection from loss of incoming data if space is beginning to run out.
l Time based retention: a job runs daily to remove aging events (older than retention period).
l Space based retention: when the main storage is about to run out of space, space based retentionwill be triggered. It removes the first day (or first few days) of events to free up enough space tomeet the space requirement. When space is available again, time based retention resumes.
ESM 101Chapter 10: CORR-Engine
HPE ESM 7.0 Page 109 of 162

System StorageThe CORR-Engine has a system storage area, which stores all of ESM’s resources, both ArcSightstandard content and customer-created content.
CORR-Engine Storage ManagementAll the CORR-Engine storage areas are managed by the ArcSight Command Center, ESM’s browser-based interface. The system tracks storage usage, and can be configured to provide notifications tospecified users at certain disk space usage thresholds for both event storage and system storage.
For more about the ArcSight Command Center and how to use it to manage the CORR-Engine, see theArcSight Command Center User’s Guide.
ArcSight Administration content package includes the CORR-Engine system monitoring resources.
For information about standard System or Administration content, refer to the ArcSight Administrationand ArcSight System Standard Content Guide. For information about an optional ArcSight Foundation,refer to the guide for that Foundation. ESM documentation is available on the Protect 724 community.
ESM 101Chapter 10: CORR-Engine
HPE ESM 7.0 Page 110 of 162
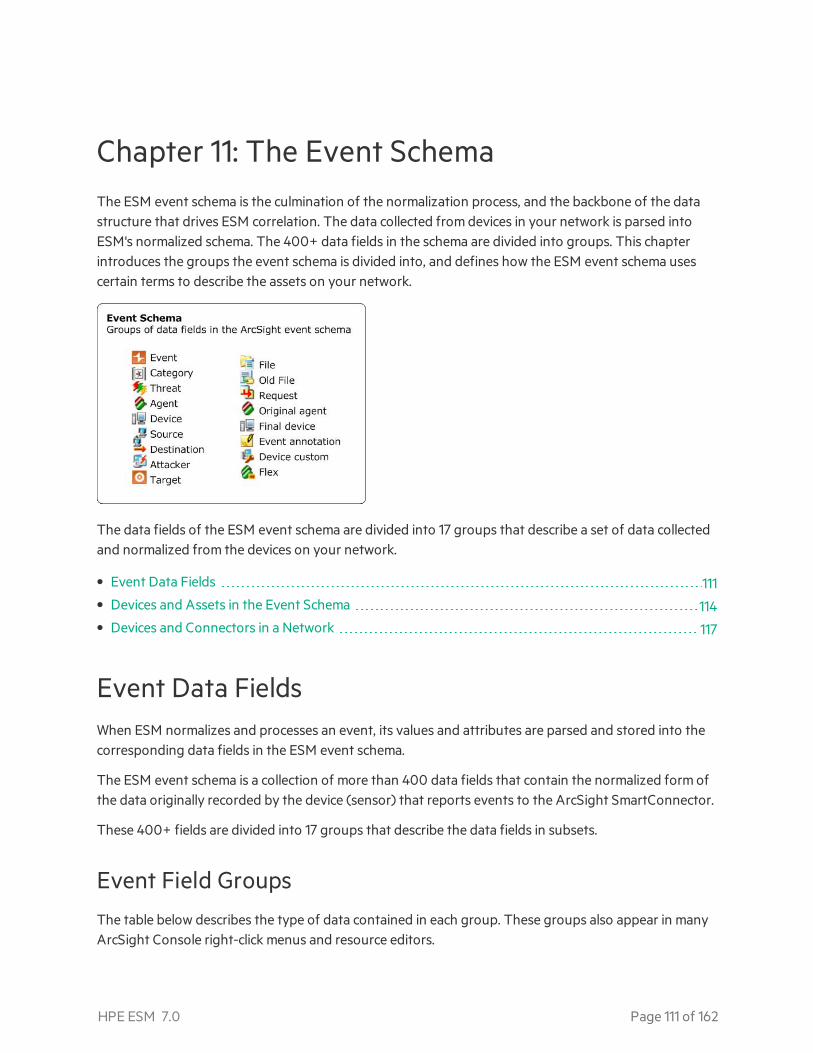
Chapter 11: The Event SchemaThe ESM event schema is the culmination of the normalization process, and the backbone of the datastructure that drives ESM correlation. The data collected from devices in your network is parsed intoESM's normalized schema. The 400+ data fields in the schema are divided into groups. This chapterintroduces the groups the event schema is divided into, and defines how the ESM event schema usescertain terms to describe the assets on your network.
The data fields of the ESM event schema are divided into 17 groups that describe a set of data collectedand normalized from the devices on your network.
• Event Data Fields 111• Devices and Assets in the Event Schema 114• Devices and Connectors in a Network 117
Event Data FieldsWhen ESM normalizes and processes an event, its values and attributes are parsed and stored into thecorresponding data fields in the ESM event schema.
The ESM event schema is a collection of more than 400 data fields that contain the normalized form ofthe data originally recorded by the device (sensor) that reports events to the ArcSight SmartConnector.
These 400+ fields are divided into 17 groups that describe the data fields in subsets.
Event Field GroupsThe table below describes the type of data contained in each group. These groups also appear in manyArcSight Console right-click menus and resource editors.
HPE ESM 7.0 Page 111 of 162

For a complete list of every data field and the type of data each field uses, go to the Reference Guide inthe ArcSight Console Help and click Data Fields.
EventSchemaGroup Icon Description
Event(root)
The fields in the Event group contain general information about the event that ESM uses toidentify and track it.
The event ID is an internal routing identifier that can be used to trace an event through a multi-tiered environment. The Manager Receipt Time logs when the Manager received the event.
Category Category is a general description of the event as defined by the ESM event categories applied to itby the SmartConnector that received it. Categories are Object, Behavior, Outcome, Technique,Device Group, and Significance, as described in "Apply Event Categories " on page 33.
Threat Threat describes ESM's assessment of how important it is that you respond to this event. Thisassessment is described in the values assigned to the event using the priority formula. The priorityformula is described in "Evaluate the Priority Formula" on page 41.
Agent Agent describes the SmartConnector that reported this event to the Manager.
In a multi-Manager architecture, Agent is the SmartConnector that sends the event to theManager. In this case, the agent may be the last in a long line of SmartConnectors that haveforwarded the event up in a multi-Manager hierarchy.
The other fields involved in a device chain are Device, Final device, and Original agent.
Device Device describes characteristics of the real-world sensor that reports the event to aSmartConnector. For example, if one network asset hosts a Syslog, a HIDS, and a card-readersystem, the fields in this group describe which sensor on that host generated the event.
These fields also include values ascribed to that event by the original sensor, such as deviceseverity (see "Event Severity" on page 32), which indicates the sensor's assessment of the event'sthreat level.
In an environment that uses concentrators or analysis engines, these fields describe the firstdevice in the device chain to process the event. The last device in the chain is called the Finaldevice.
Source Source describes the asset that was the origin of the network traffic represented by the event. Inan event that represents an interaction between two network assets, Source is paired withDestination, and together, these fields describe the sender and receiver of the network traffic.
In the case of an event that involves only one asset (such as a periodic system health check), theSource fields will be empty.
Destination Destination describes the asset that was the receiver of the network traffic. In an event thatrepresents an interaction between two network assets, Destination is paired with Source, andtogether, these fields describe the sender and receiver of the network traffic.
In the case of an event that involves only one asset (such as a periodic system health check), theDestination fields describe that asset.
ESM 101Chapter 11: The Event Schema
HPE ESM 7.0 Page 112 of 162
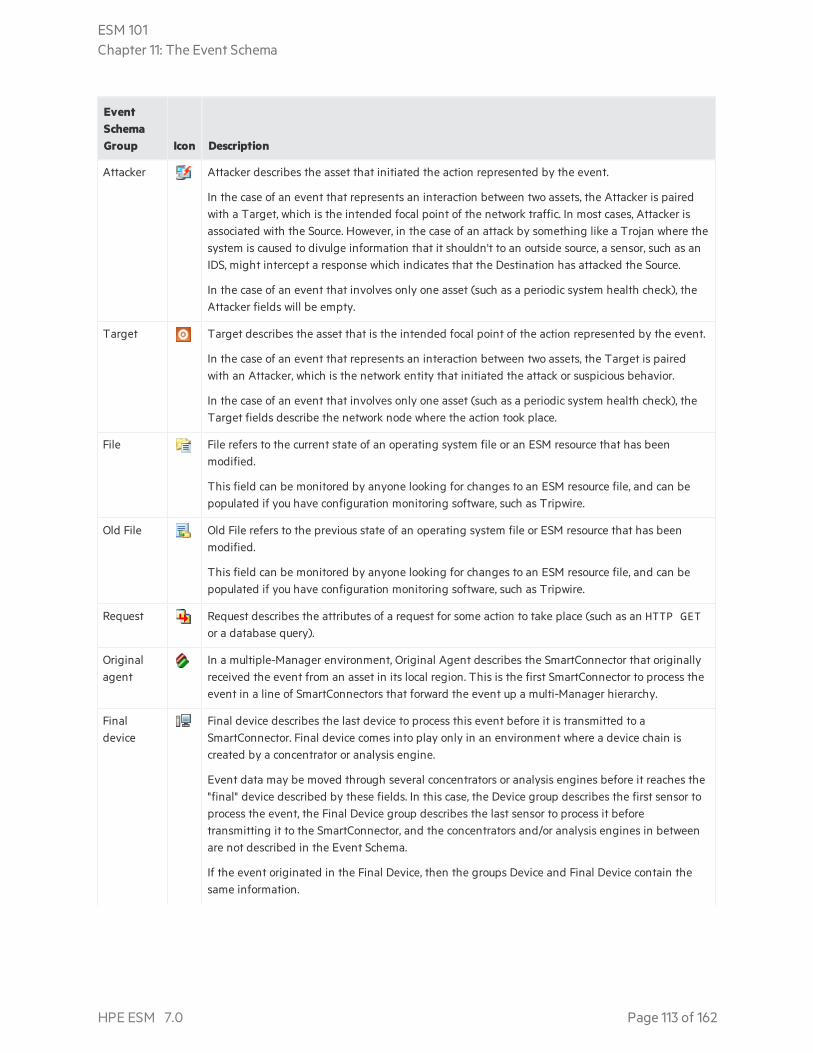
EventSchemaGroup Icon Description
Attacker Attacker describes the asset that initiated the action represented by the event.
In the case of an event that represents an interaction between two assets, the Attacker is pairedwith a Target, which is the intended focal point of the network traffic. In most cases, Attacker isassociated with the Source. However, in the case of an attack by something like a Trojan where thesystem is caused to divulge information that it shouldn't to an outside source, a sensor, such as anIDS, might intercept a response which indicates that the Destination has attacked the Source.
In the case of an event that involves only one asset (such as a periodic system health check), theAttacker fields will be empty.
Target Target describes the asset that is the intended focal point of the action represented by the event.
In the case of an event that represents an interaction between two assets, the Target is pairedwith an Attacker, which is the network entity that initiated the attack or suspicious behavior.
In the case of an event that involves only one asset (such as a periodic system health check), theTarget fields describe the network node where the action took place.
File File refers to the current state of an operating system file or an ESM resource that has beenmodified.
This field can be monitored by anyone looking for changes to an ESM resource file, and can bepopulated if you have configuration monitoring software, such as Tripwire.
Old File Old File refers to the previous state of an operating system file or ESM resource that has beenmodified.
This field can be monitored by anyone looking for changes to an ESM resource file, and can bepopulated if you have configuration monitoring software, such as Tripwire.
Request Request describes the attributes of a request for some action to take place (such as an HTTP GETor a database query).
Originalagent
In a multiple-Manager environment, Original Agent describes the SmartConnector that originallyreceived the event from an asset in its local region. This is the first SmartConnector to process theevent in a line of SmartConnectors that forward the event up a multi-Manager hierarchy.
Finaldevice
Final device describes the last device to process this event before it is transmitted to aSmartConnector. Final device comes into play only in an environment where a device chain iscreated by a concentrator or analysis engine.
Event data may be moved through several concentrators or analysis engines before it reaches the"final" device described by these fields. In this case, the Device group describes the first sensor toprocess the event, the Final Device group describes the last sensor to process it beforetransmitting it to the SmartConnector, and the concentrators and/or analysis engines in betweenare not described in the Event Schema.
If the event originated in the Final Device, then the groups Device and Final Device contain thesame information.
ESM 101Chapter 11: The Event Schema
HPE ESM 7.0 Page 113 of 162
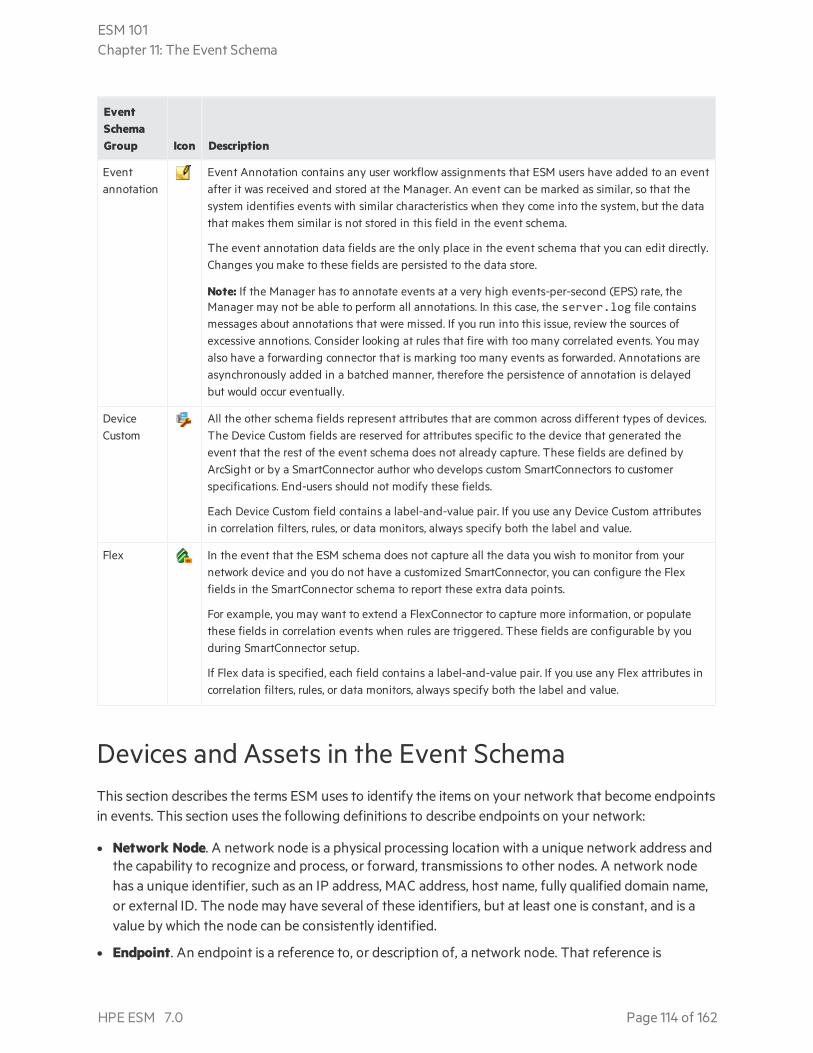
EventSchemaGroup Icon Description
Eventannotation
Event Annotation contains any user workflow assignments that ESM users have added to an eventafter it was received and stored at the Manager. An event can be marked as similar, so that thesystem identifies events with similar characteristics when they come into the system, but the datathat makes them similar is not stored in this field in the event schema.
The event annotation data fields are the only place in the event schema that you can edit directly.Changes you make to these fields are persisted to the data store.
Note: If the Manager has to annotate events at a very high events-per-second (EPS) rate, theManager may not be able to perform all annotations. In this case, the server.log file containsmessages about annotations that were missed. If you run into this issue, review the sources ofexcessive annotions. Consider looking at rules that fire with too many correlated events. You mayalso have a forwarding connector that is marking too many events as forwarded. Annotations areasynchronously added in a batched manner, therefore the persistence of annotation is delayedbut would occur eventually.
DeviceCustom
All the other schema fields represent attributes that are common across different types of devices.The Device Custom fields are reserved for attributes specific to the device that generated theevent that the rest of the event schema does not already capture. These fields are defined byArcSight or by a SmartConnector author who develops custom SmartConnectors to customerspecifications. End-users should not modify these fields.
Each Device Custom field contains a label-and-value pair. If you use any Device Custom attributesin correlation filters, rules, or data monitors, always specify both the label and value.
Flex In the event that the ESM schema does not capture all the data you wish to monitor from yournetwork device and you do not have a customized SmartConnector, you can configure the Flexfields in the SmartConnector schema to report these extra data points.
For example, you may want to extend a FlexConnector to capture more information, or populatethese fields in correlation events when rules are triggered. These fields are configurable by youduring SmartConnector setup.
If Flex data is specified, each field contains a label-and-value pair. If you use any Flex attributes incorrelation filters, rules, or data monitors, always specify both the label and value.
Devices and Assets in the Event SchemaThis section describes the terms ESM uses to identify the items on your network that become endpointsin events. This section uses the following definitions to describe endpoints on your network:
l Network Node. A network node is a physical processing location with a unique network address andthe capability to recognize and process, or forward, transmissions to other nodes. A network nodehas a unique identifier, such as an IP address, MAC address, host name, fully qualified domain name,or external ID. The node may have several of these identifiers, but at least one is constant, and is avalue by which the node can be consistently identified.
l Endpoint. An endpoint is a reference to, or description of, a network node. That reference is
ESM 101Chapter 11: The Event Schema
HPE ESM 7.0 Page 114 of 162
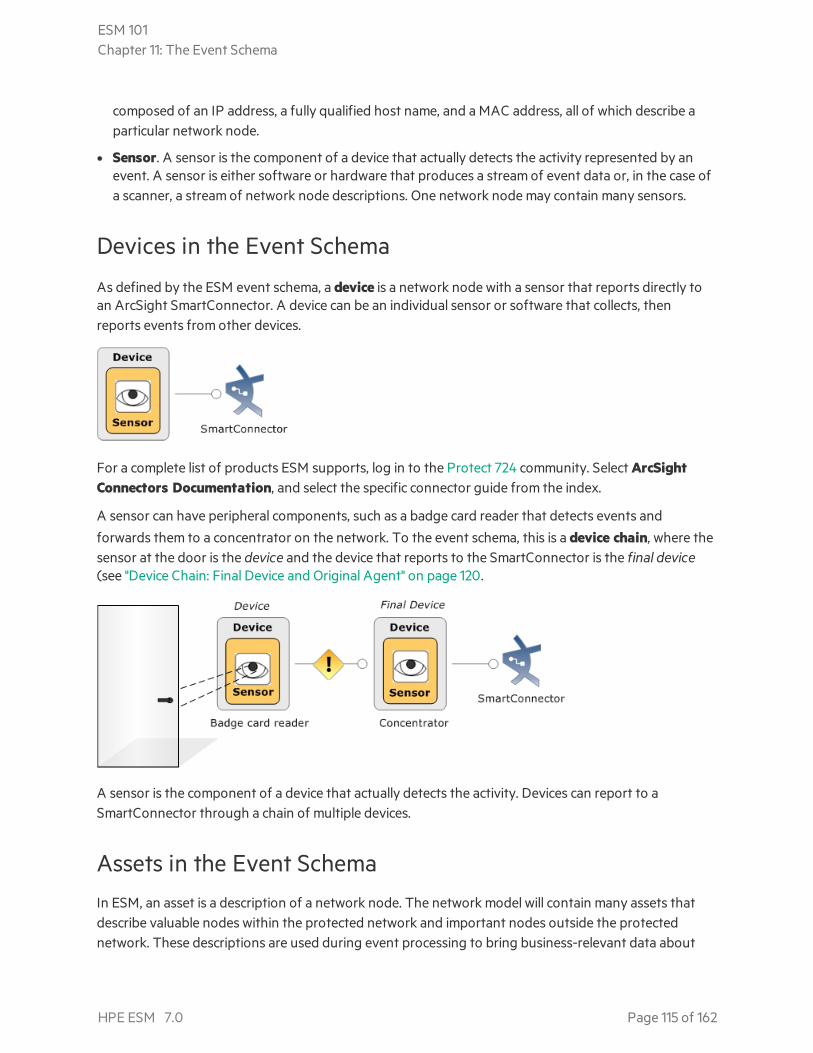
composed of an IP address, a fully qualified host name, and a MAC address, all of which describe aparticular network node.
l Sensor. A sensor is the component of a device that actually detects the activity represented by anevent. A sensor is either software or hardware that produces a stream of event data or, in the case ofa scanner, a stream of network node descriptions. One network node may contain many sensors.
Devices in the Event Schema
As defined by the ESM event schema, a device is a network node with a sensor that reports directly toan ArcSight SmartConnector. A device can be an individual sensor or software that collects, thenreports events from other devices.
For a complete list of products ESM supports, log in to the Protect 724 community. Select ArcSightConnectors Documentation, and select the specific connector guide from the index.
A sensor can have peripheral components, such as a badge card reader that detects events andforwards them to a concentrator on the network. To the event schema, this is a device chain, where thesensor at the door is the device and the device that reports to the SmartConnector is the final device(see "Device Chain: Final Device and Original Agent" on page 120.
A sensor is the component of a device that actually detects the activity. Devices can report to aSmartConnector through a chain of multiple devices.
Assets in the Event SchemaIn ESM, an asset is a description of a network node. The network model will contain many assets thatdescribe valuable nodes within the protected network and important nodes outside the protectednetwork. These descriptions are used during event processing to bring business-relevant data about
ESM 101Chapter 11: The Event Schema
HPE ESM 7.0 Page 115 of 162
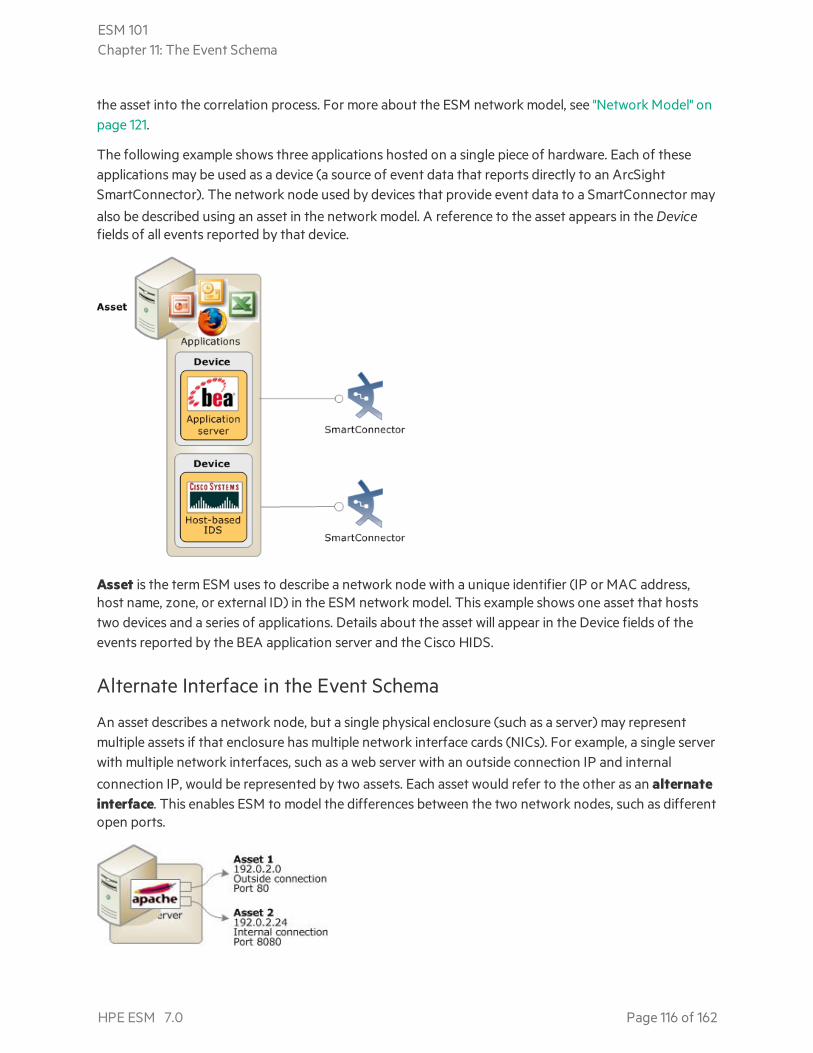
the asset into the correlation process. For more about the ESM network model, see "Network Model" onpage 121.
The following example shows three applications hosted on a single piece of hardware. Each of theseapplications may be used as a device (a source of event data that reports directly to an ArcSightSmartConnector). The network node used by devices that provide event data to a SmartConnector mayalso be described using an asset in the network model. A reference to the asset appears in the Devicefields of all events reported by that device.
Asset is the term ESM uses to describe a network node with a unique identifier (IP or MAC address,host name, zone, or external ID) in the ESM network model. This example shows one asset that hoststwo devices and a series of applications. Details about the asset will appear in the Device fields of theevents reported by the BEA application server and the Cisco HIDS.
Alternate Interface in the Event Schema
An asset describes a network node, but a single physical enclosure (such as a server) may representmultiple assets if that enclosure has multiple network interface cards (NICs). For example, a single serverwith multiple network interfaces, such as a web server with an outside connection IP and internal
connection IP, would be represented by two assets. Each asset would refer to the other as an alternateinterface. This enables ESM to model the differences between the two network nodes, such as differentopen ports.
ESM 101Chapter 11: The Event Schema
HPE ESM 7.0 Page 116 of 162
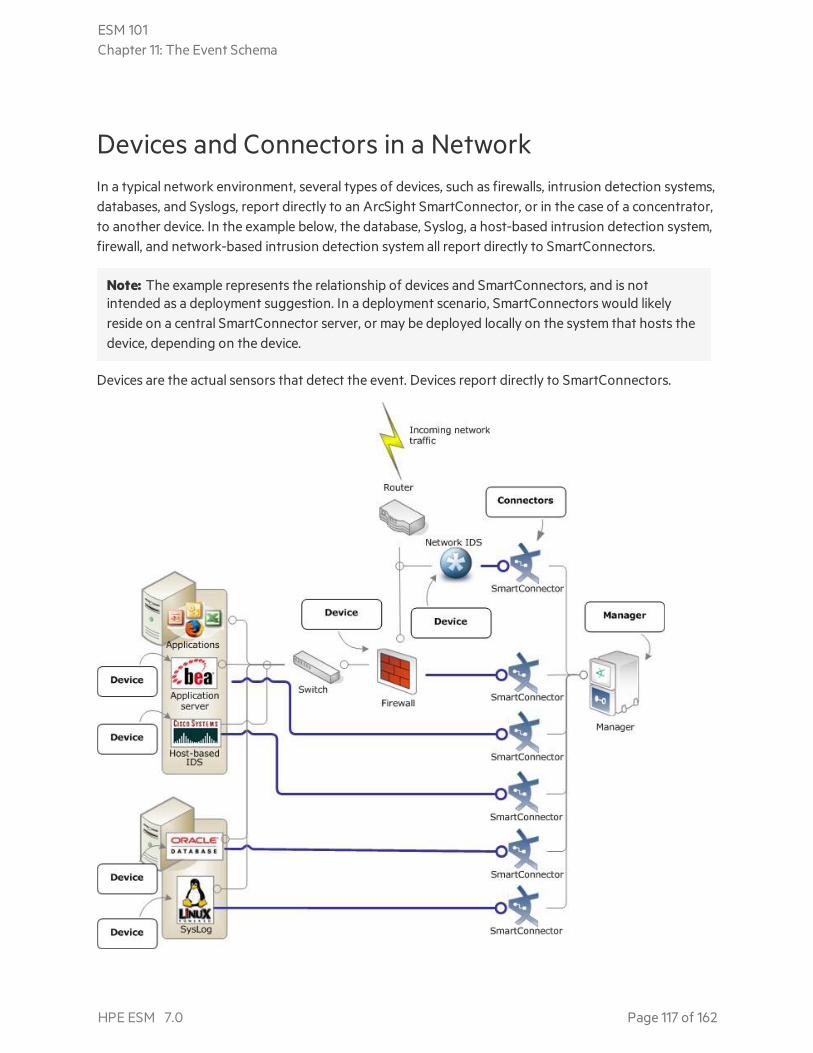
Devices and Connectors in a NetworkIn a typical network environment, several types of devices, such as firewalls, intrusion detection systems,databases, and Syslogs, report directly to an ArcSight SmartConnector, or in the case of a concentrator,to another device. In the example below, the database, Syslog, a host-based intrusion detection system,firewall, and network-based intrusion detection system all report directly to SmartConnectors.
Note: The example represents the relationship of devices and SmartConnectors, and is notintended as a deployment suggestion. In a deployment scenario, SmartConnectors would likelyreside on a central SmartConnector server, or may be deployed locally on the system that hosts thedevice, depending on the device.
Devices are the actual sensors that detect the event. Devices report directly to SmartConnectors.
ESM 101Chapter 11: The Event Schema
HPE ESM 7.0 Page 117 of 162
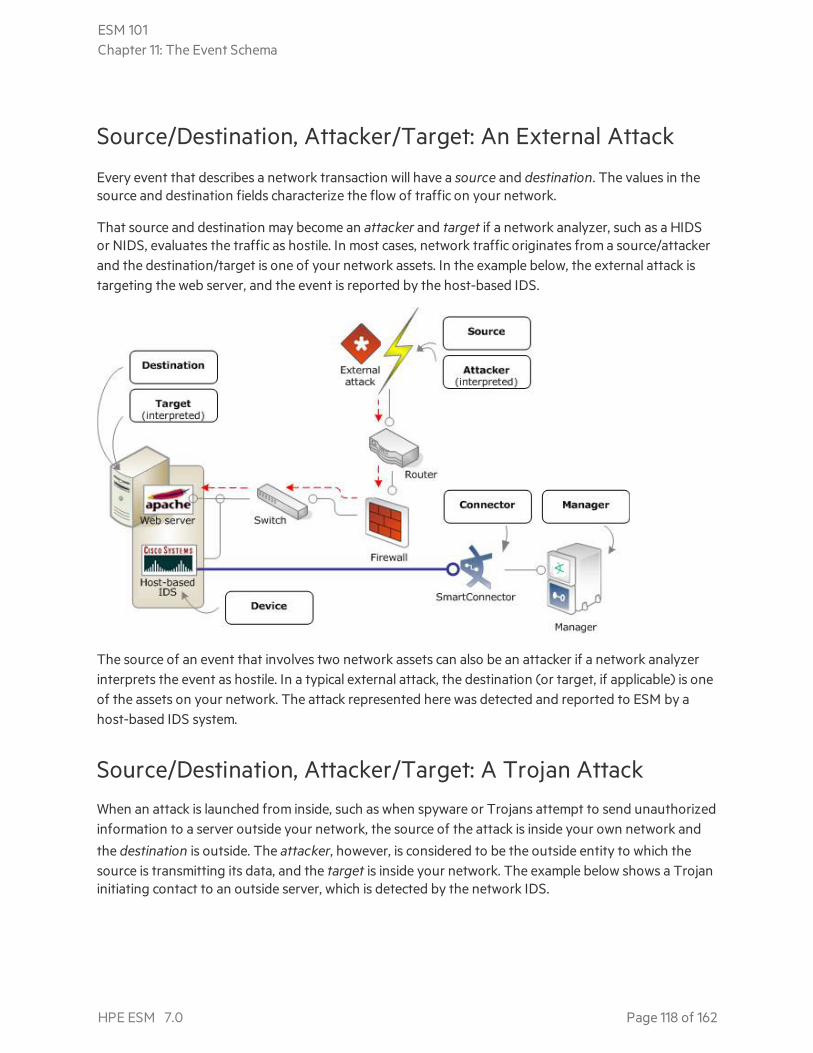
Source/Destination, Attacker/Target: An External Attack
Every event that describes a network transaction will have a source and destination. The values in thesource and destination fields characterize the flow of traffic on your network.
That source and destination may become an attacker and target if a network analyzer, such as a HIDSor NIDS, evaluates the traffic as hostile. In most cases, network traffic originates from a source/attackerand the destination/target is one of your network assets. In the example below, the external attack istargeting the web server, and the event is reported by the host-based IDS.
The source of an event that involves two network assets can also be an attacker if a network analyzerinterprets the event as hostile. In a typical external attack, the destination (or target, if applicable) is oneof the assets on your network. The attack represented here was detected and reported to ESM by ahost-based IDS system.
Source/Destination, Attacker/Target: A Trojan AttackWhen an attack is launched from inside, such as when spyware or Trojans attempt to send unauthorizedinformation to a server outside your network, the source of the attack is inside your own network and
the destination is outside. The attacker, however, is considered to be the outside entity to which thesource is transmitting its data, and the target is inside your network. The example below shows a Trojaninitiating contact to an outside server, which is detected by the network IDS.
ESM 101Chapter 11: The Event Schema
HPE ESM 7.0 Page 118 of 162
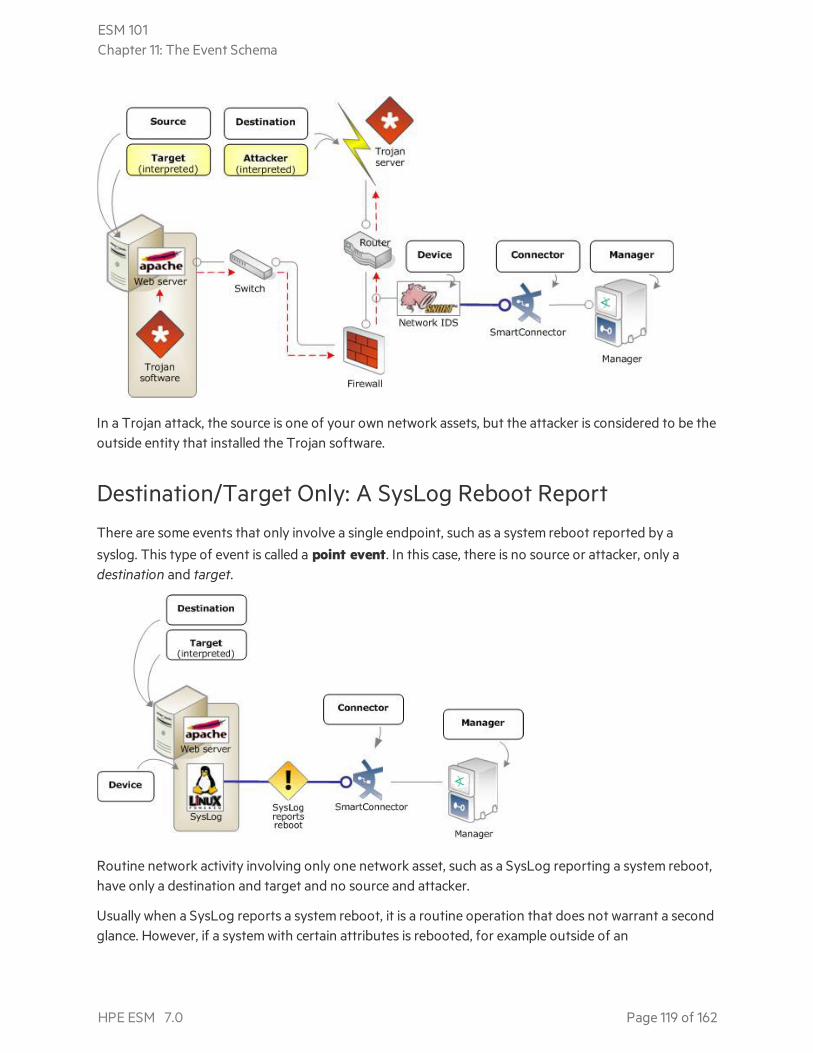
In a Trojan attack, the source is one of your own network assets, but the attacker is considered to be theoutside entity that installed the Trojan software.
Destination/Target Only: A SysLog Reboot ReportThere are some events that only involve a single endpoint, such as a system reboot reported by asyslog. This type of event is called a point event. In this case, there is no source or attacker, only adestination and target.
Routine network activity involving only one network asset, such as a SysLog reporting a system reboot,have only a destination and target and no source and attacker.
Usually when a SysLog reports a system reboot, it is a routine operation that does not warrant a secondglance. However, if a system with certain attributes is rebooted, for example outside of an
ESM 101Chapter 11: The Event Schema
HPE ESM 7.0 Page 119 of 162
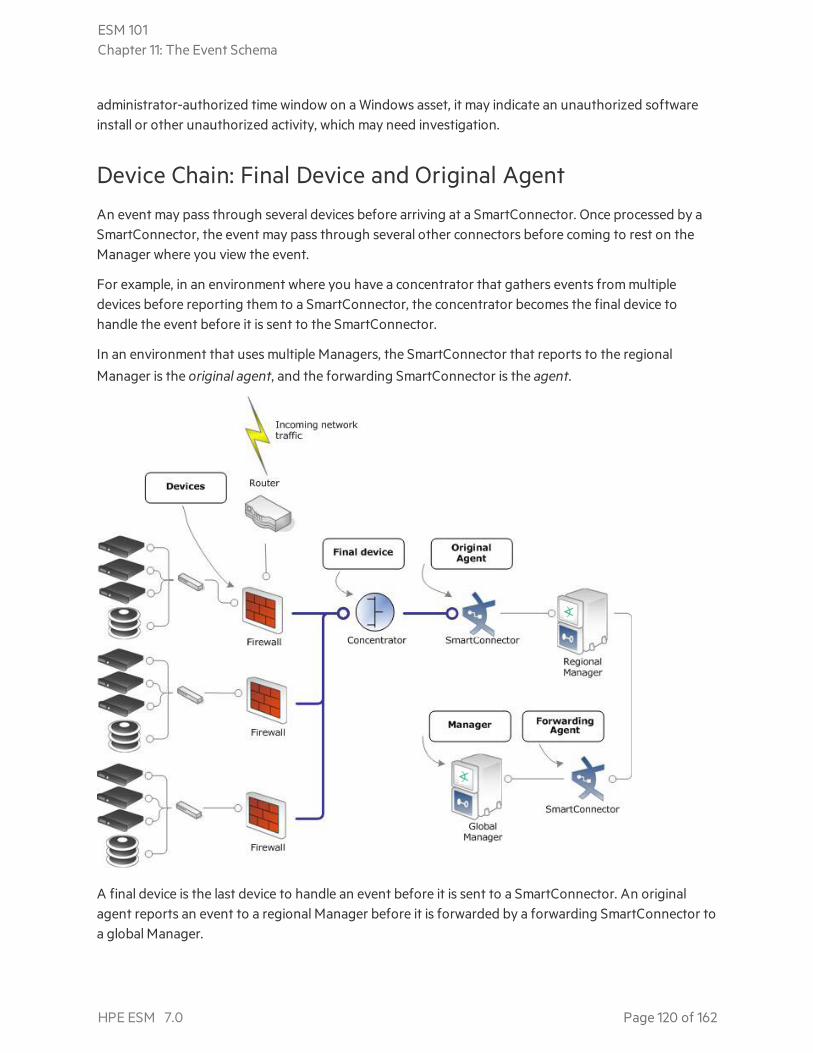
administrator-authorized time window on a Windows asset, it may indicate an unauthorized softwareinstall or other unauthorized activity, which may need investigation.
Device Chain: Final Device and Original AgentAn event may pass through several devices before arriving at a SmartConnector. Once processed by aSmartConnector, the event may pass through several other connectors before coming to rest on theManager where you view the event.
For example, in an environment where you have a concentrator that gathers events from multipledevices before reporting them to a SmartConnector, the concentrator becomes the final device tohandle the event before it is sent to the SmartConnector.
In an environment that uses multiple Managers, the SmartConnector that reports to the regionalManager is the original agent, and the forwarding SmartConnector is the agent.
A final device is the last device to handle an event before it is sent to a SmartConnector. An originalagent reports an event to a regional Manager before it is forwarded by a forwarding SmartConnector toa global Manager.
ESM 101Chapter 11: The Event Schema
HPE ESM 7.0 Page 120 of 162
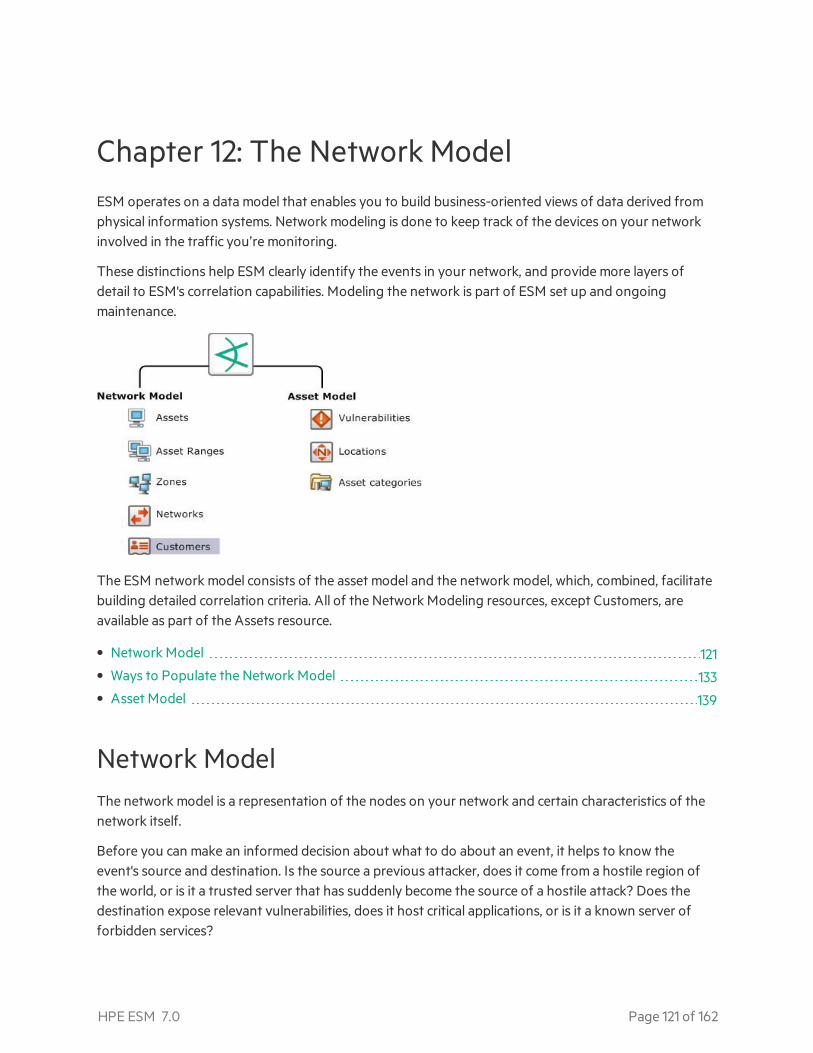
Chapter 12: The Network ModelESM operates on a data model that enables you to build business-oriented views of data derived fromphysical information systems. Network modeling is done to keep track of the devices on your networkinvolved in the traffic you’re monitoring.
These distinctions help ESM clearly identify the events in your network, and provide more layers ofdetail to ESM's correlation capabilities. Modeling the network is part of ESM set up and ongoingmaintenance.
The ESM network model consists of the asset model and the network model, which, combined, facilitatebuilding detailed correlation criteria. All of the Network Modeling resources, except Customers, areavailable as part of the Assets resource.
• Network Model 121• Ways to Populate the Network Model 133• Asset Model 139
Network ModelThe network model is a representation of the nodes on your network and certain characteristics of thenetwork itself.
Before you can make an informed decision about what to do about an event, it helps to know theevent's source and destination. Is the source a previous attacker, does it come from a hostile region ofthe world, or is it a trusted server that has suddenly become the source of a hostile attack? Does thedestination expose relevant vulnerabilities, does it host critical applications, or is it a known server offorbidden services?
HPE ESM 7.0 Page 121 of 162
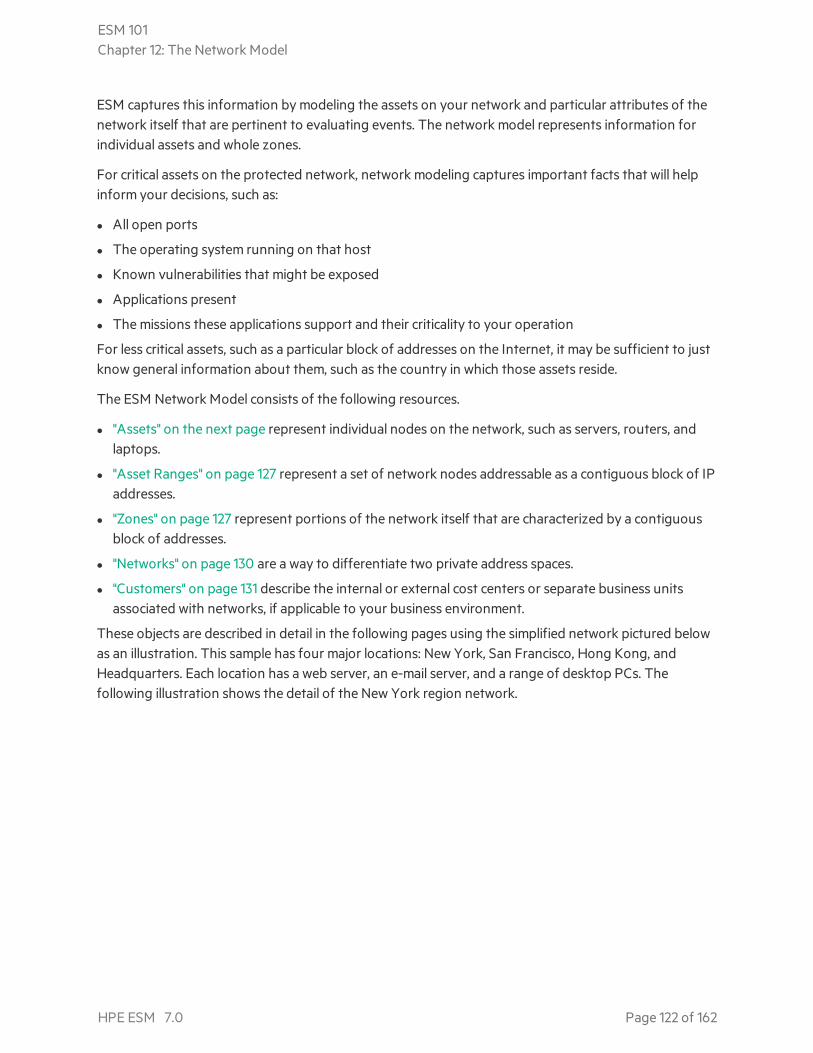
ESM captures this information by modeling the assets on your network and particular attributes of thenetwork itself that are pertinent to evaluating events. The network model represents information forindividual assets and whole zones.
For critical assets on the protected network, network modeling captures important facts that will helpinform your decisions, such as:
l All open ports
l The operating system running on that host
l Known vulnerabilities that might be exposed
l Applications present
l The missions these applications support and their criticality to your operation
For less critical assets, such as a particular block of addresses on the Internet, it may be sufficient to justknow general information about them, such as the country in which those assets reside.
The ESM Network Model consists of the following resources.
l "Assets" on the next page represent individual nodes on the network, such as servers, routers, andlaptops.
l "Asset Ranges" on page 127 represent a set of network nodes addressable as a contiguous block of IPaddresses.
l "Zones" on page 127 represent portions of the network itself that are characterized by a contiguousblock of addresses.
l "Networks" on page 130 are a way to differentiate two private address spaces.
l "Customers" on page 131 describe the internal or external cost centers or separate business unitsassociated with networks, if applicable to your business environment.
These objects are described in detail in the following pages using the simplified network pictured belowas an illustration. This sample has four major locations: New York, San Francisco, Hong Kong, andHeadquarters. Each location has a web server, an e-mail server, and a range of desktop PCs. Thefollowing illustration shows the detail of the New York region network.
ESM 101Chapter 12: The Network Model
HPE ESM 7.0 Page 122 of 162
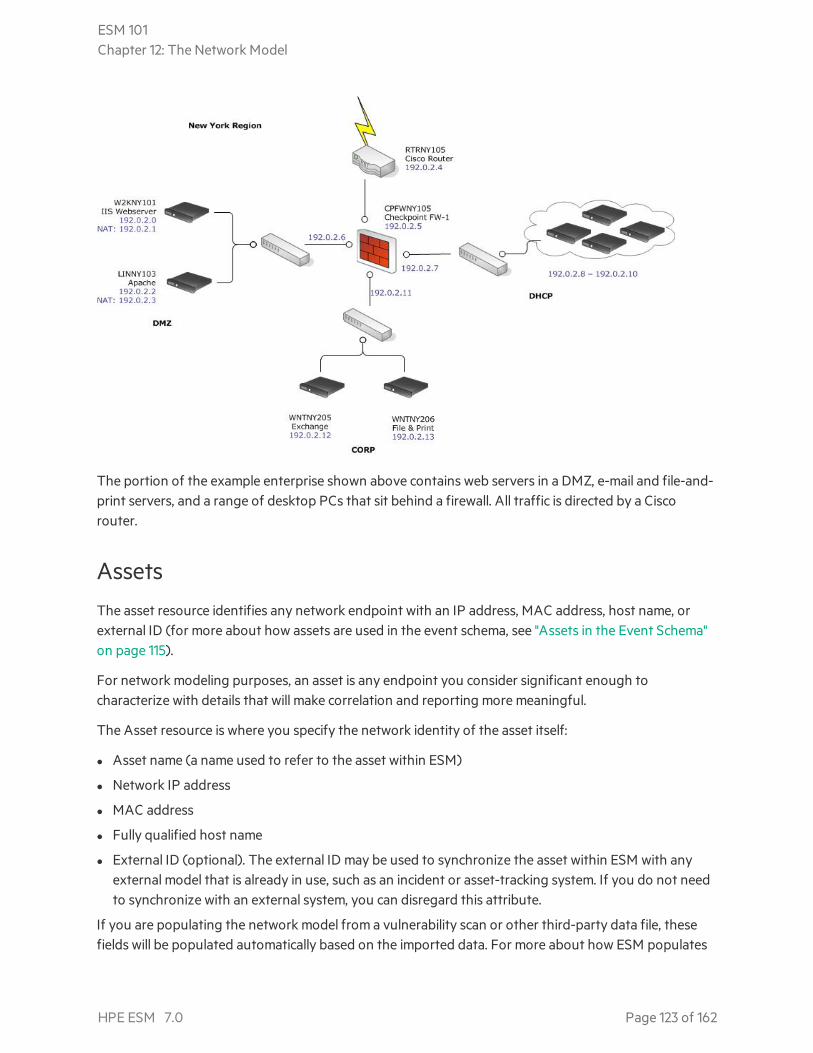
The portion of the example enterprise shown above contains web servers in a DMZ, e-mail and file-and-print servers, and a range of desktop PCs that sit behind a firewall. All traffic is directed by a Ciscorouter.
AssetsThe asset resource identifies any network endpoint with an IP address, MAC address, host name, orexternal ID (for more about how assets are used in the event schema, see "Assets in the Event Schema"on page 115).
For network modeling purposes, an asset is any endpoint you consider significant enough tocharacterize with details that will make correlation and reporting more meaningful.
The Asset resource is where you specify the network identity of the asset itself:
l Asset name (a name used to refer to the asset within ESM)
l Network IP address
l MAC address
l Fully qualified host name
l External ID (optional). The external ID may be used to synchronize the asset within ESM with anyexternal model that is already in use, such as an incident or asset-tracking system. If you do not needto synchronize with an external system, you can disregard this attribute.
If you are populating the network model from a vulnerability scan or other third-party data file, thesefields will be populated automatically based on the imported data. For more about how ESM populates
ESM 101Chapter 12: The Network Model
HPE ESM 7.0 Page 123 of 162
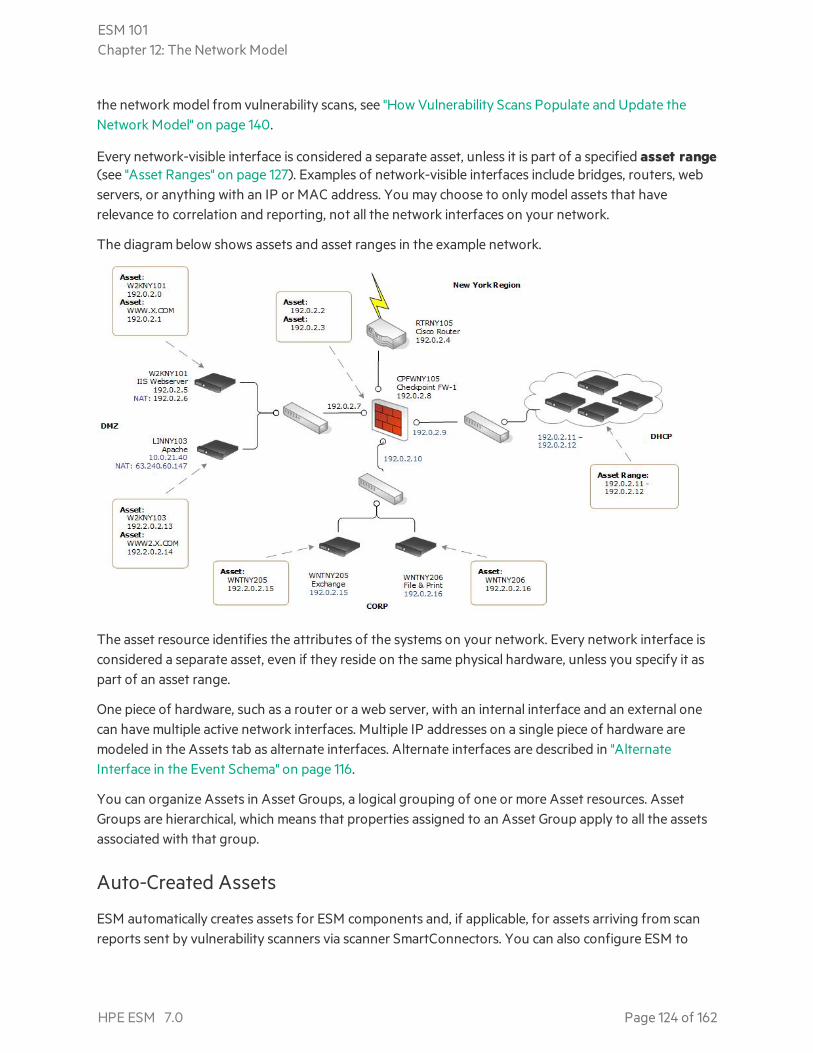
the network model from vulnerability scans, see "How Vulnerability Scans Populate and Update theNetwork Model" on page 140.
Every network-visible interface is considered a separate asset, unless it is part of a specified asset range(see "Asset Ranges" on page 127). Examples of network-visible interfaces include bridges, routers, webservers, or anything with an IP or MAC address. You may choose to only model assets that haverelevance to correlation and reporting, not all the network interfaces on your network.
The diagram below shows assets and asset ranges in the example network.
The asset resource identifies the attributes of the systems on your network. Every network interface isconsidered a separate asset, even if they reside on the same physical hardware, unless you specify it aspart of an asset range.
One piece of hardware, such as a router or a web server, with an internal interface and an external onecan have multiple active network interfaces. Multiple IP addresses on a single piece of hardware aremodeled in the Assets tab as alternate interfaces. Alternate interfaces are described in "AlternateInterface in the Event Schema" on page 116.
You can organize Assets in Asset Groups, a logical grouping of one or more Asset resources. AssetGroups are hierarchical, which means that properties assigned to an Asset Group apply to all the assetsassociated with that group.
Auto-Created Assets
ESM automatically creates assets for ESM components and, if applicable, for assets arriving from scanreports sent by vulnerability scanners via scanner SmartConnectors. You can also configure ESM to
ESM 101Chapter 12: The Network Model
HPE ESM 7.0 Page 124 of 162
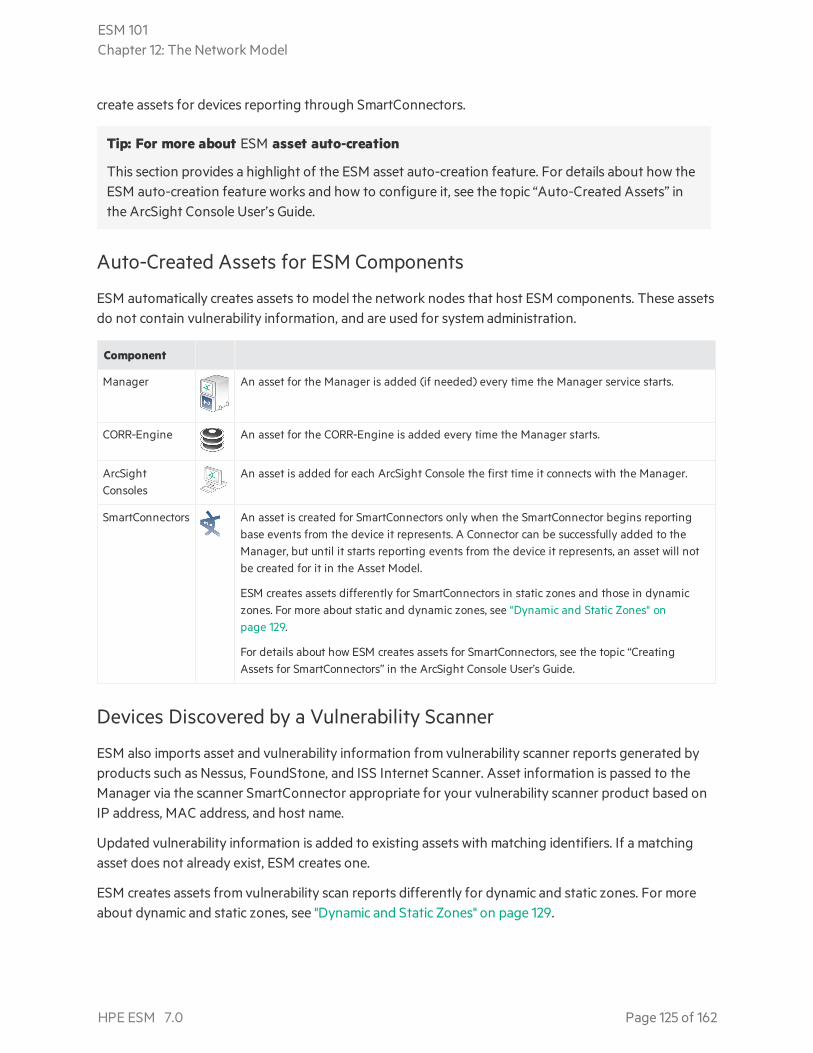
create assets for devices reporting through SmartConnectors.
Tip: For more about ESM asset auto-creation
This section provides a highlight of the ESM asset auto-creation feature. For details about how theESM auto-creation feature works and how to configure it, see the topic “Auto-Created Assets” inthe ArcSight Console User’s Guide.
Auto-Created Assets for ESM Components
ESM automatically creates assets to model the network nodes that host ESM components. These assetsdo not contain vulnerability information, and are used for system administration.
Component
Manager An asset for the Manager is added (if needed) every time the Manager service starts.
CORR-Engine An asset for the CORR-Engine is added every time the Manager starts.
ArcSightConsoles
An asset is added for each ArcSight Console the first time it connects with the Manager.
SmartConnectors An asset is created for SmartConnectors only when the SmartConnector begins reportingbase events from the device it represents. A Connector can be successfully added to theManager, but until it starts reporting events from the device it represents, an asset will notbe created for it in the Asset Model.
ESM creates assets differently for SmartConnectors in static zones and those in dynamiczones. For more about static and dynamic zones, see "Dynamic and Static Zones" onpage 129.
For details about how ESM creates assets for SmartConnectors, see the topic “CreatingAssets for SmartConnectors” in the ArcSight Console User’s Guide.
Devices Discovered by a Vulnerability Scanner
ESM also imports asset and vulnerability information from vulnerability scanner reports generated byproducts such as Nessus, FoundStone, and ISS Internet Scanner. Asset information is passed to theManager via the scanner SmartConnector appropriate for your vulnerability scanner product based onIP address, MAC address, and host name.
Updated vulnerability information is added to existing assets with matching identifiers. If a matchingasset does not already exist, ESM creates one.
ESM creates assets from vulnerability scan reports differently for dynamic and static zones. For moreabout dynamic and static zones, see "Dynamic and Static Zones" on page 129.
ESM 101Chapter 12: The Network Model
HPE ESM 7.0 Page 125 of 162

Devices Reporting Through SmartConnectors
The ESM Administrator can configure the system to also create an asset for each device that reports tothat SmartConnector based on IP address, MAC address, and host name when the Manager receivesevents from SmartConnectors.
This feature makes it possible to add assets to the network model that may not be part of a regularasset scanning report without having to create them individually. Assets created using this method donot contain vulnerability information, although once they are added to the network model, they can besupplemented with matching data that arrives from a scanner report or that you add individually usingthe ArcSight Console.
This option is available in the Manager Configuration Wizard. For more about running the ManagerConfiguration Wizard, see the topic “Reconfiguring ArcSight Manager” in the Administrator’s Guide.
ESM creates assets differently for devices in static zones and those in dynamic zones. For more aboutstatic and dynamic zones, see "Dynamic and Static Zones" on page 129.
Managing Assets in Asset Channels
Asset channels are an organized way to sort through thousands of assets. Asset channels make all theevent sorting capabilities of active channels (see "Active Channels" on page 79) available for sortingthrough thousands of assets.
Once assets are created, you can view a group of assets in an assets channel (right click the asset groupand select Show Assets).
ESM 101Chapter 12: The Network Model
HPE ESM 7.0 Page 126 of 162
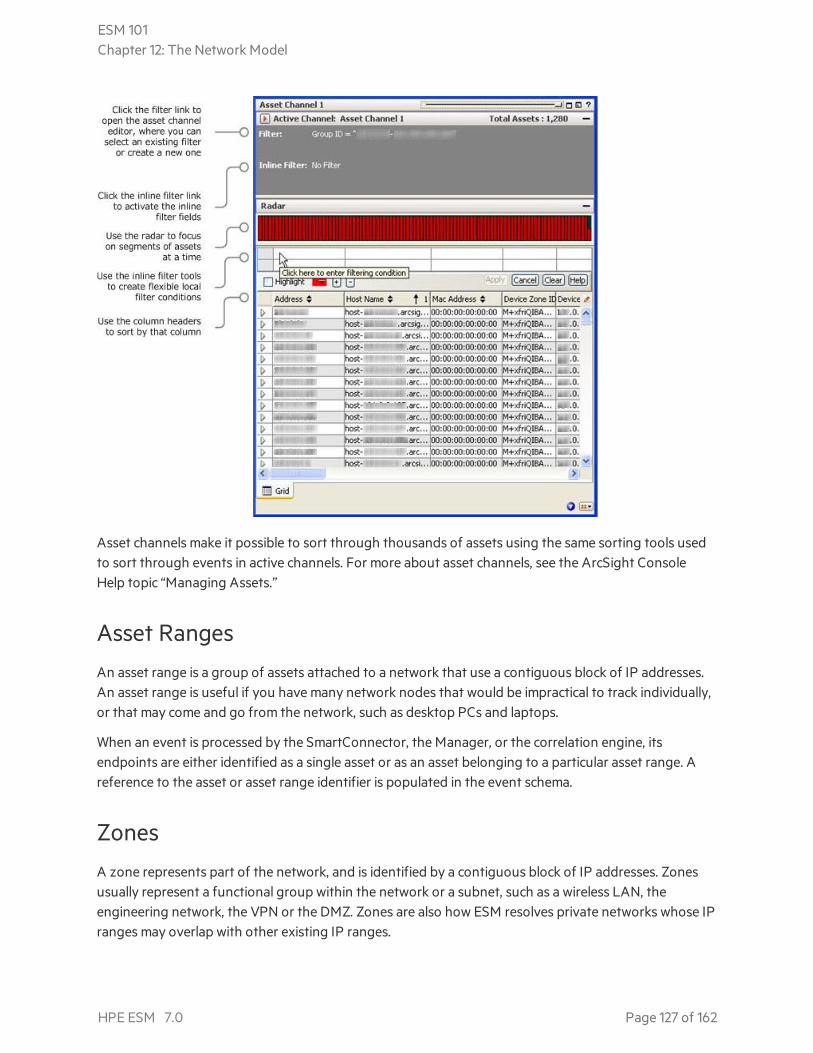
Asset channels make it possible to sort through thousands of assets using the same sorting tools usedto sort through events in active channels. For more about asset channels, see the ArcSight ConsoleHelp topic “Managing Assets.”
Asset RangesAn asset range is a group of assets attached to a network that use a contiguous block of IP addresses.An asset range is useful if you have many network nodes that would be impractical to track individually,or that may come and go from the network, such as desktop PCs and laptops.
When an event is processed by the SmartConnector, the Manager, or the correlation engine, itsendpoints are either identified as a single asset or as an asset belonging to a particular asset range. Areference to the asset or asset range identifier is populated in the event schema.
ZonesA zone represents part of the network, and is identified by a contiguous block of IP addresses. Zonesusually represent a functional group within the network or a subnet, such as a wireless LAN, theengineering network, the VPN or the DMZ. Zones are also how ESM resolves private networks whose IPranges may overlap with other existing IP ranges.
ESM 101Chapter 12: The Network Model
HPE ESM 7.0 Page 127 of 162
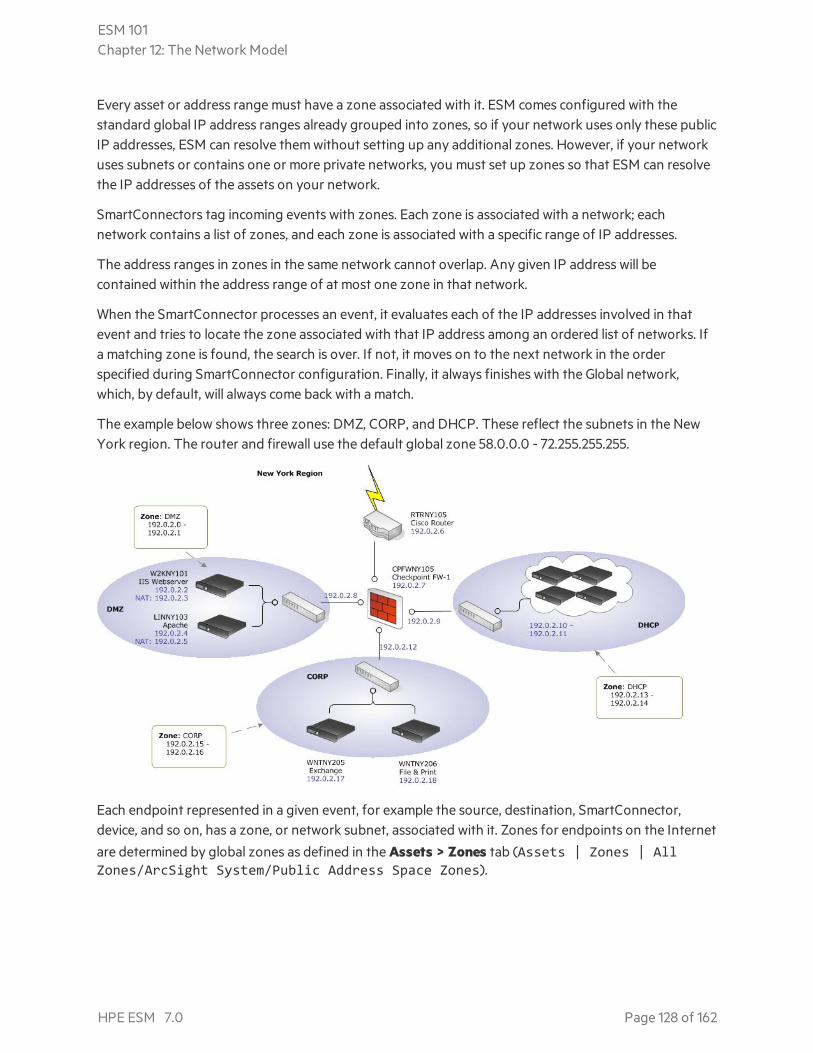
Every asset or address range must have a zone associated with it. ESM comes configured with thestandard global IP address ranges already grouped into zones, so if your network uses only these publicIP addresses, ESM can resolve them without setting up any additional zones. However, if your networkuses subnets or contains one or more private networks, you must set up zones so that ESM can resolvethe IP addresses of the assets on your network.
SmartConnectors tag incoming events with zones. Each zone is associated with a network; eachnetwork contains a list of zones, and each zone is associated with a specific range of IP addresses.
The address ranges in zones in the same network cannot overlap. Any given IP address will becontained within the address range of at most one zone in that network.
When the SmartConnector processes an event, it evaluates each of the IP addresses involved in thatevent and tries to locate the zone associated with that IP address among an ordered list of networks. Ifa matching zone is found, the search is over. If not, it moves on to the next network in the orderspecified during SmartConnector configuration. Finally, it always finishes with the Global network,which, by default, will always come back with a match.
The example below shows three zones: DMZ, CORP, and DHCP. These reflect the subnets in the NewYork region. The router and firewall use the default global zone 58.0.0.0 - 72.255.255.255.
Each endpoint represented in a given event, for example the source, destination, SmartConnector,device, and so on, has a zone, or network subnet, associated with it. Zones for endpoints on the Internet
are determined by global zones as defined in the Assets > Zones tab (Assets | Zones | AllZones/ArcSight System/Public Address Space Zones).
ESM 101Chapter 12: The Network Model
HPE ESM 7.0 Page 128 of 162
Dynamic and Static Zones
Zones are created to model functional portions of the network that share a contiguous block of IPaddresses.
The asset auto-creation feature (see "Auto-Created Assets" on page 124) relies on zones that arealready in place before device discovery occurs, either customer-created zones, or the default zonesthat come with ESM. When you add a SmartConnector, you assign one or more existing Networks tothat Connector. All assets reported by that Connector are then associated with that Network and thezones the Network represents.
ESM differentiates between dynamic zones and static zones to classify the types of assets theyrepresent.
Static Zones
Devices in a static zone use static (constant) IP addresses. This represents devices that stay on thenetwork and use the same IP address for all traffic. In order for ESM to identify assets classified in staticzones, the assets must have either a unique IP address, a unique host name, or both.
Dynamic Zones
Devices in a dynamic zone use dynamic addressing (such as DHCP). Dynamic zones represent assetsthat come and go from the network, such as laptops. ESM requires either a MAC address or a host nameto identify assets in dynamic zones. ESM first looks for a MAC address; if one is not present, it uses thehost name.
Caution: Classifying Zones as Static and Dynamic
It is important that zones are classified properly as dynamic or static.
If a zone is classified as static, but hosts assets that come and go from the network, ESM may not beable to update the network model properly. For example:
l The updated network might have duplicate and disabled assets.
l Other information, such as vulnerability information and open ports, may not get updatedproperly.
Static Assets in Dynamic Zones
If an asset is classified as static, but belongs to a dynamic zone, ESM treats the asset as if it was in astatic zone. See the description and links above for how ESM asset auto-creation feature works forstatic zones.
ESM 101Chapter 12: The Network Model
HPE ESM 7.0 Page 129 of 162
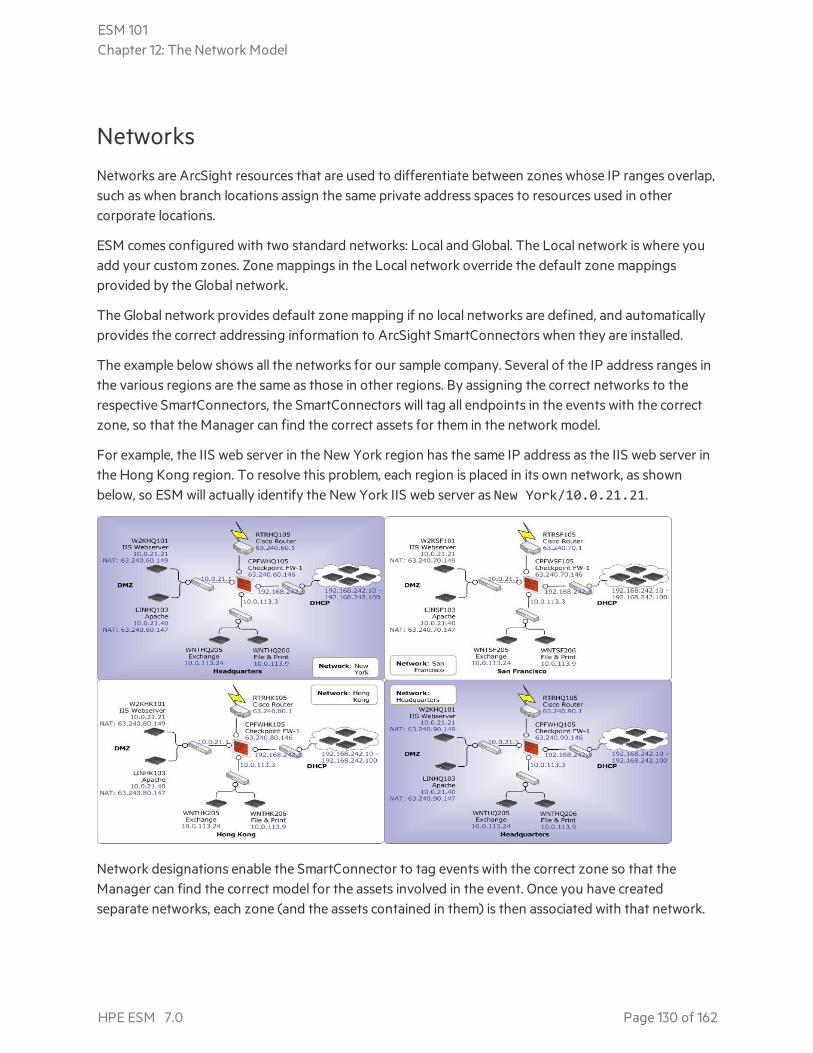
NetworksNetworks are ArcSight resources that are used to differentiate between zones whose IP ranges overlap,such as when branch locations assign the same private address spaces to resources used in othercorporate locations.
ESM comes configured with two standard networks: Local and Global. The Local network is where youadd your custom zones. Zone mappings in the Local network override the default zone mappingsprovided by the Global network.
The Global network provides default zone mapping if no local networks are defined, and automaticallyprovides the correct addressing information to ArcSight SmartConnectors when they are installed.
The example below shows all the networks for our sample company. Several of the IP address ranges inthe various regions are the same as those in other regions. By assigning the correct networks to therespective SmartConnectors, the SmartConnectors will tag all endpoints in the events with the correctzone, so that the Manager can find the correct assets for them in the network model.
For example, the IIS web server in the New York region has the same IP address as the IIS web server inthe Hong Kong region. To resolve this problem, each region is placed in its own network, as shownbelow, so ESM will actually identify the New York IIS web server as New York/10.0.21.21.
Network designations enable the SmartConnector to tag events with the correct zone so that theManager can find the correct model for the assets involved in the event. Once you have createdseparate networks, each zone (and the assets contained in them) is then associated with that network.
ESM 101Chapter 12: The Network Model
HPE ESM 7.0 Page 130 of 162
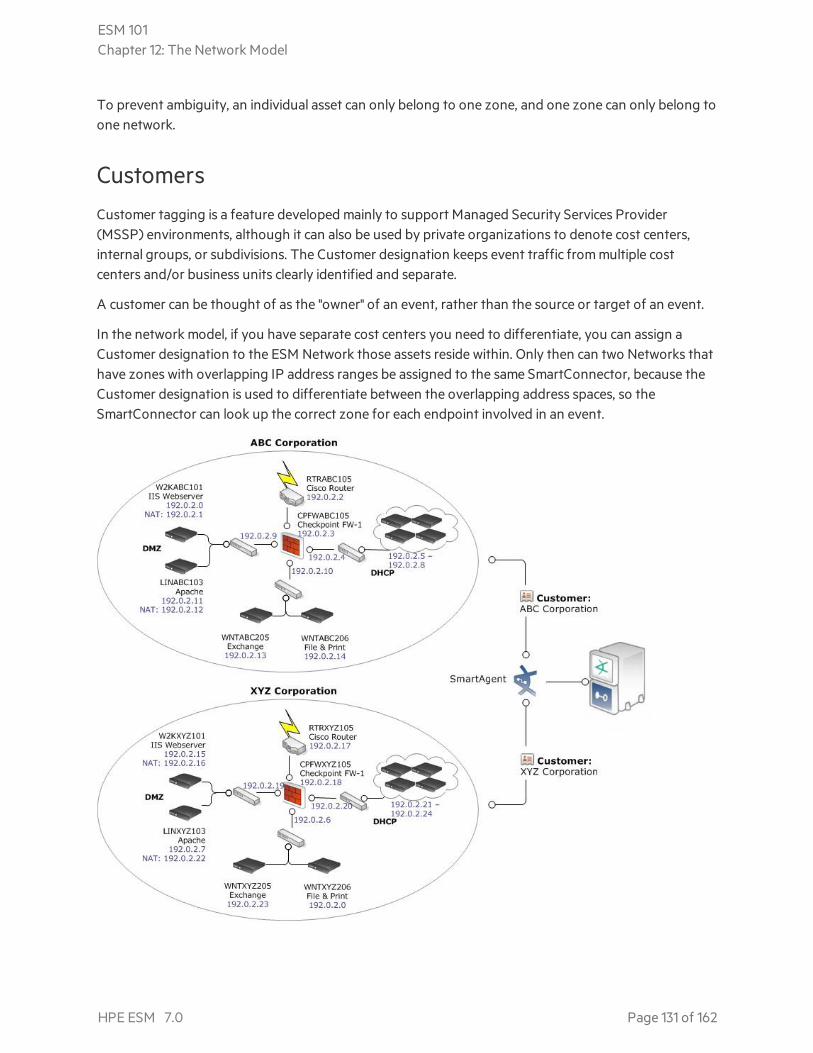
To prevent ambiguity, an individual asset can only belong to one zone, and one zone can only belong toone network.
CustomersCustomer tagging is a feature developed mainly to support Managed Security Services Provider(MSSP) environments, although it can also be used by private organizations to denote cost centers,internal groups, or subdivisions. The Customer designation keeps event traffic from multiple costcenters and/or business units clearly identified and separate.
A customer can be thought of as the "owner" of an event, rather than the source or target of an event.
In the network model, if you have separate cost centers you need to differentiate, you can assign aCustomer designation to the ESM Network those assets reside within. Only then can two Networks thathave zones with overlapping IP address ranges be assigned to the same SmartConnector, because theCustomer designation is used to differentiate between the overlapping address spaces, so theSmartConnector can look up the correct zone for each endpoint involved in an event.
ESM 101Chapter 12: The Network Model
HPE ESM 7.0 Page 131 of 162
The Customer designation is usually used in an Managed Security Services Provider situation to trackassets that belong to a cost center. If you do not have outside customers or an internal system of costcenters to track, you do not need to create Customers.
The Customer attribute is only needed to clarify the zone look-up if the SmartConnector reports overthe same address range but for different networks. The SmartConnector then uses the Customerdesignation to find which network contains the correct zone.
The Manager evaluates Customer tagging in the following order:
1. The SmartConnector determines the Customer for an event using either a Velocity template or afixed mapping. Velocity templates are described in "Velocity Templates" on page 70.
2. If there is a Customer attribute, it is used to find the lookup table to find the correct zone. If there isno Customer field value, the system uses the default look-up table.
3. The look-up table indicates to the SmartConnector which zone to associate with each IP addressbeing processed by the SmartConnector.
The Customer variable can either be a fixed string (such as "ABC Corporation") or a Velocity templatevariable (such as "$company_name") based on one or more fields of the event being tagged. Theresulting string used to tag the event maps directly to an existing Customer resource. For more abouthow ESM uses Velocity templates,"Velocity Templates" on page 70, or the topic Velocity Templates inthe ArcSight Console Help.
Network Modeling Resources Summary
The figure below represents how ESM uses the network model to look up zone designations and locateindividual assets involved in an event. The customer designation is optional depending on whether youwant to specify a cost center to differentiate traffic from one network to the next, such as in anManaged Security Services Provider situation or as an internal cost center.
The diagram below shows how the network model elements interact.
ESM 101Chapter 12: The Network Model
HPE ESM 7.0 Page 132 of 162
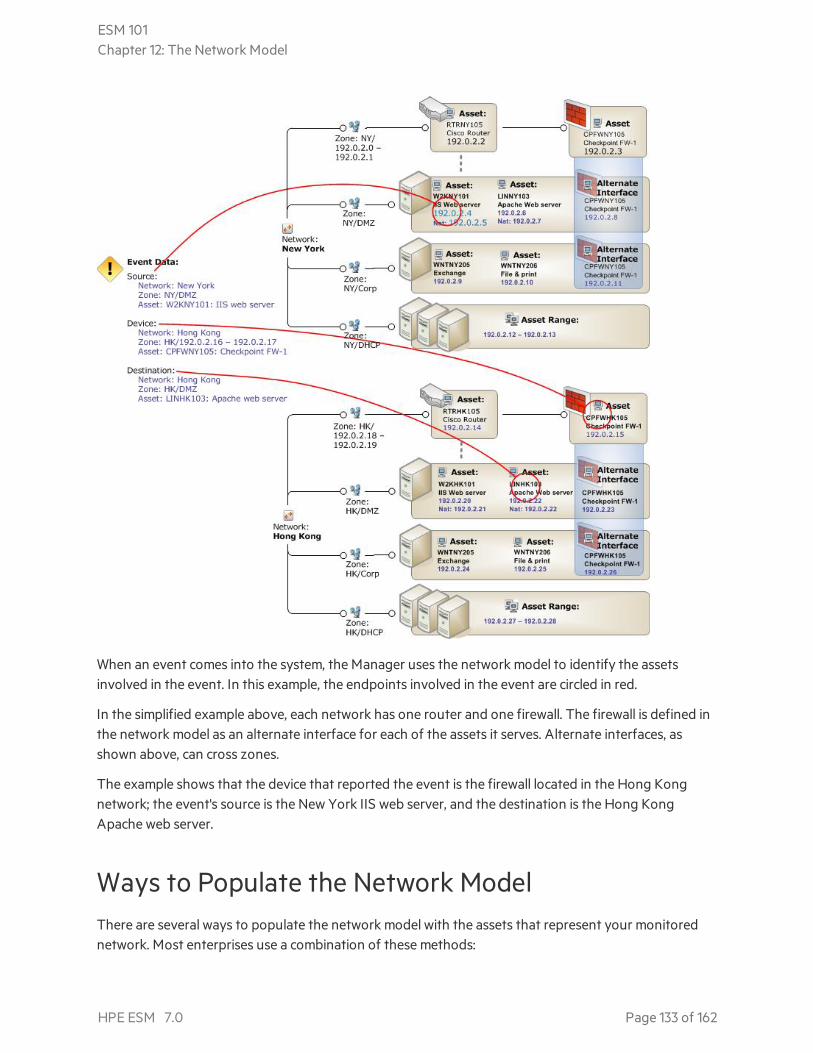
When an event comes into the system, the Manager uses the network model to identify the assetsinvolved in the event. In this example, the endpoints involved in the event are circled in red.
In the simplified example above, each network has one router and one firewall. The firewall is defined inthe network model as an alternate interface for each of the assets it serves. Alternate interfaces, asshown above, can cross zones.
The example shows that the device that reported the event is the firewall located in the Hong Kongnetwork; the event's source is the New York IIS web server, and the destination is the Hong KongApache web server.
Ways to Populate the Network ModelThere are several ways to populate the network model with the assets that represent your monitorednetwork. Most enterprises use a combination of these methods:
ESM 101Chapter 12: The Network Model
HPE ESM 7.0 Page 133 of 162
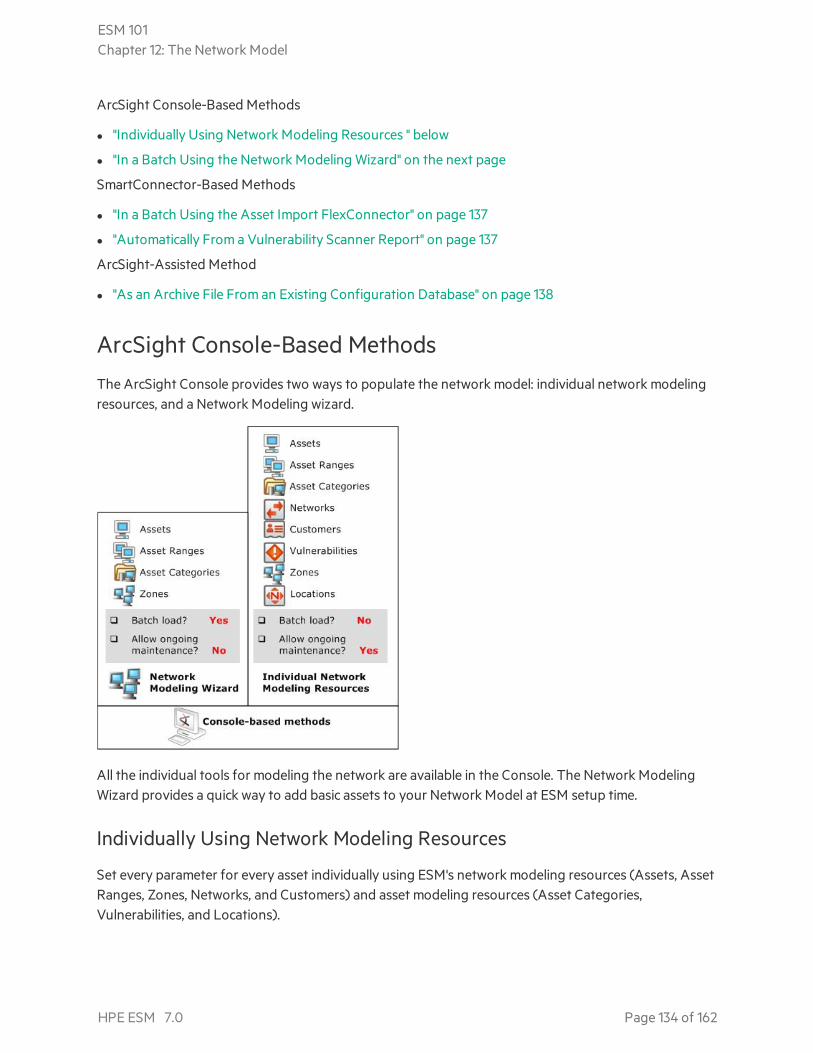
ArcSight Console-Based Methods
l "Individually Using Network Modeling Resources " below
l "In a Batch Using the Network Modeling Wizard" on the next page
SmartConnector-Based Methods
l "In a Batch Using the Asset Import FlexConnector" on page 137
l "Automatically From a Vulnerability Scanner Report" on page 137
ArcSight-Assisted Method
l "As an Archive File From an Existing Configuration Database" on page 138
ArcSight Console-Based MethodsThe ArcSight Console provides two ways to populate the network model: individual network modelingresources, and a Network Modeling wizard.
All the individual tools for modeling the network are available in the Console. The Network ModelingWizard provides a quick way to add basic assets to your Network Model at ESM setup time.
Individually Using Network Modeling Resources
Set every parameter for every asset individually using ESM's network modeling resources (Assets, AssetRanges, Zones, Networks, and Customers) and asset modeling resources (Asset Categories,Vulnerabilities, and Locations).
ESM 101Chapter 12: The Network Model
HPE ESM 7.0 Page 134 of 162
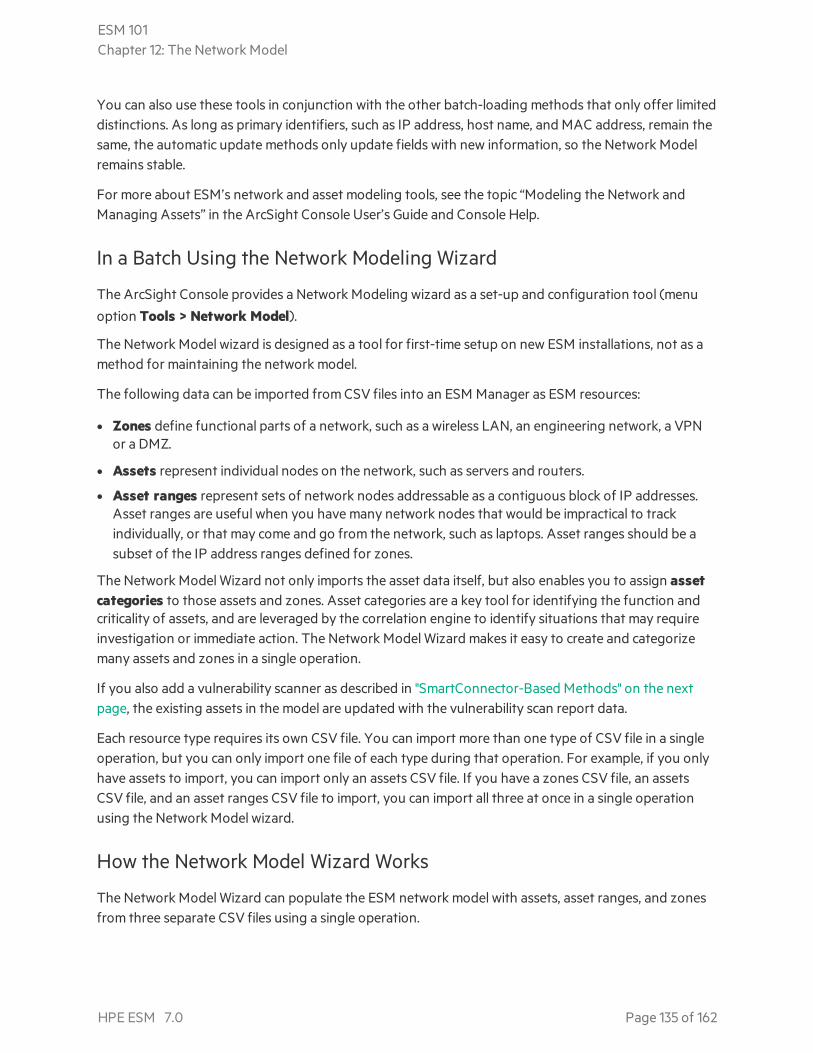
You can also use these tools in conjunction with the other batch-loading methods that only offer limiteddistinctions. As long as primary identifiers, such as IP address, host name, and MAC address, remain thesame, the automatic update methods only update fields with new information, so the Network Modelremains stable.
For more about ESM’s network and asset modeling tools, see the topic “Modeling the Network andManaging Assets” in the ArcSight Console User’s Guide and Console Help.
In a Batch Using the Network Modeling Wizard
The ArcSight Console provides a Network Modeling wizard as a set-up and configuration tool (menuoption Tools > Network Model).
The Network Model wizard is designed as a tool for first-time setup on new ESM installations, not as amethod for maintaining the network model.
The following data can be imported from CSV files into an ESM Manager as ESM resources:
l Zones define functional parts of a network, such as a wireless LAN, an engineering network, a VPNor a DMZ.
l Assets represent individual nodes on the network, such as servers and routers.
l Asset ranges represent sets of network nodes addressable as a contiguous block of IP addresses.Asset ranges are useful when you have many network nodes that would be impractical to trackindividually, or that may come and go from the network, such as laptops. Asset ranges should be asubset of the IP address ranges defined for zones.
The Network Model Wizard not only imports the asset data itself, but also enables you to assign assetcategories to those assets and zones. Asset categories are a key tool for identifying the function andcriticality of assets, and are leveraged by the correlation engine to identify situations that may requireinvestigation or immediate action. The Network Model Wizard makes it easy to create and categorizemany assets and zones in a single operation.
If you also add a vulnerability scanner as described in "SmartConnector-Based Methods" on the nextpage, the existing assets in the model are updated with the vulnerability scan report data.
Each resource type requires its own CSV file. You can import more than one type of CSV file in a singleoperation, but you can only import one file of each type during that operation. For example, if you onlyhave assets to import, you can import only an assets CSV file. If you have a zones CSV file, an assetsCSV file, and an asset ranges CSV file to import, you can import all three at once in a single operationusing the Network Model wizard.
How the Network Model Wizard Works
The Network Model Wizard can populate the ESM network model with assets, asset ranges, and zonesfrom three separate CSV files using a single operation.
ESM 101Chapter 12: The Network Model
HPE ESM 7.0 Page 135 of 162
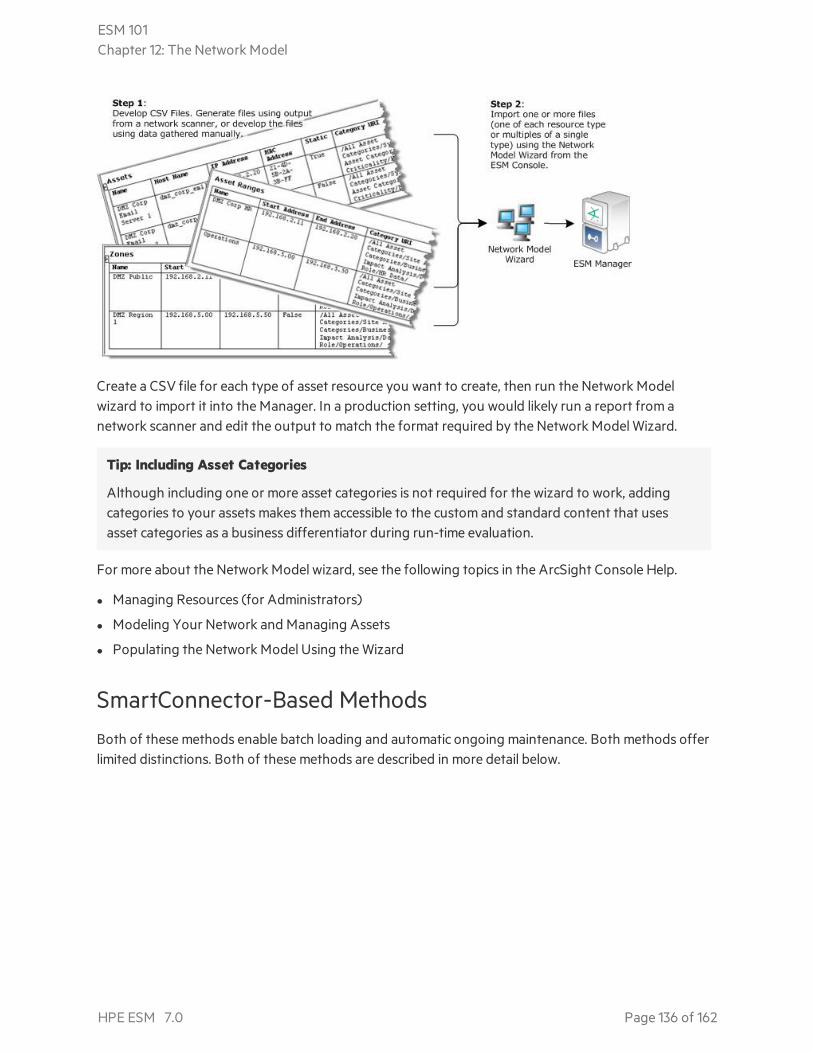
Create a CSV file for each type of asset resource you want to create, then run the Network Modelwizard to import it into the Manager. In a production setting, you would likely run a report from anetwork scanner and edit the output to match the format required by the Network Model Wizard.
Tip: Including Asset Categories
Although including one or more asset categories is not required for the wizard to work, addingcategories to your assets makes them accessible to the custom and standard content that usesasset categories as a business differentiator during run-time evaluation.
For more about the Network Model wizard, see the following topics in the ArcSight Console Help.
l Managing Resources (for Administrators)
l Modeling Your Network and Managing Assets
l Populating the Network Model Using the Wizard
SmartConnector-Based MethodsBoth of these methods enable batch loading and automatic ongoing maintenance. Both methods offerlimited distinctions. Both of these methods are described in more detail below.
ESM 101Chapter 12: The Network Model
HPE ESM 7.0 Page 136 of 162
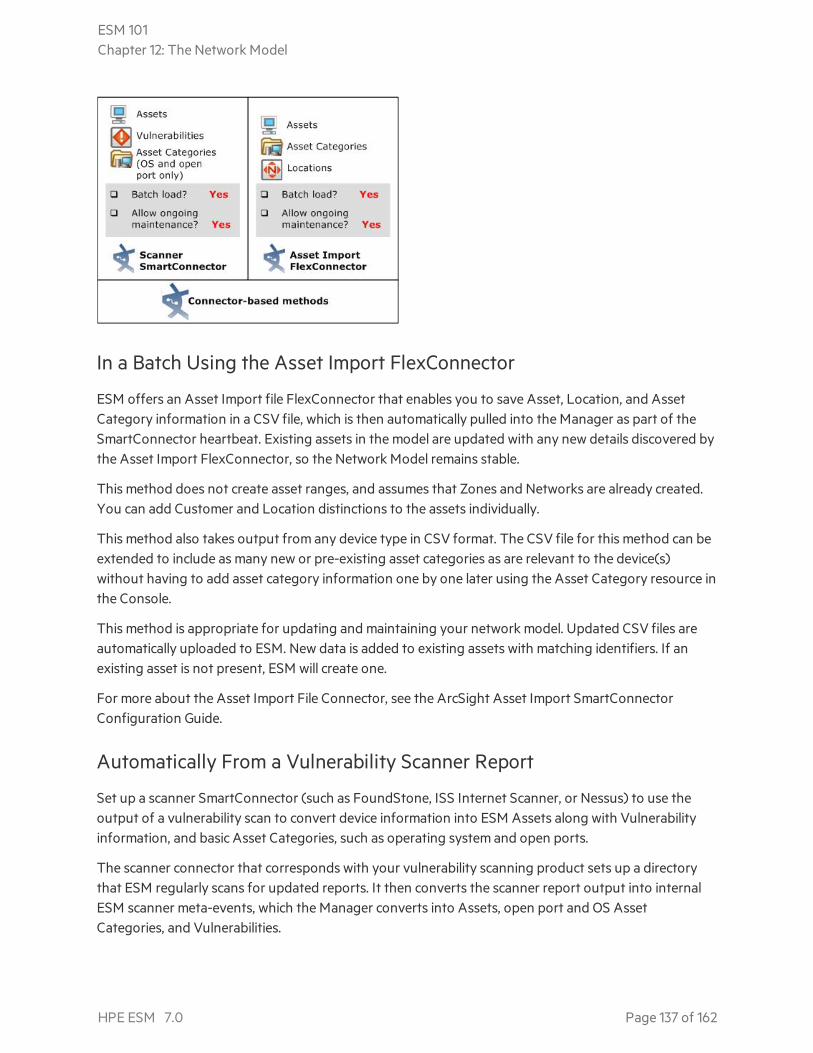
In a Batch Using the Asset Import FlexConnector
ESM offers an Asset Import file FlexConnector that enables you to save Asset, Location, and AssetCategory information in a CSV file, which is then automatically pulled into the Manager as part of theSmartConnector heartbeat. Existing assets in the model are updated with any new details discovered bythe Asset Import FlexConnector, so the Network Model remains stable.
This method does not create asset ranges, and assumes that Zones and Networks are already created.You can add Customer and Location distinctions to the assets individually.
This method also takes output from any device type in CSV format. The CSV file for this method can beextended to include as many new or pre-existing asset categories as are relevant to the device(s)without having to add asset category information one by one later using the Asset Category resource inthe Console.
This method is appropriate for updating and maintaining your network model. Updated CSV files areautomatically uploaded to ESM. New data is added to existing assets with matching identifiers. If anexisting asset is not present, ESM will create one.
For more about the Asset Import File Connector, see the ArcSight Asset Import SmartConnectorConfiguration Guide.
Automatically From a Vulnerability Scanner Report
Set up a scanner SmartConnector (such as FoundStone, ISS Internet Scanner, or Nessus) to use theoutput of a vulnerability scan to convert device information into ESM Assets along with Vulnerabilityinformation, and basic Asset Categories, such as operating system and open ports.
The scanner connector that corresponds with your vulnerability scanning product sets up a directorythat ESM regularly scans for updated reports. It then converts the scanner report output into internalESM scanner meta-events, which the Manager converts into Assets, open port and OS AssetCategories, and Vulnerabilities.
ESM 101Chapter 12: The Network Model
HPE ESM 7.0 Page 137 of 162
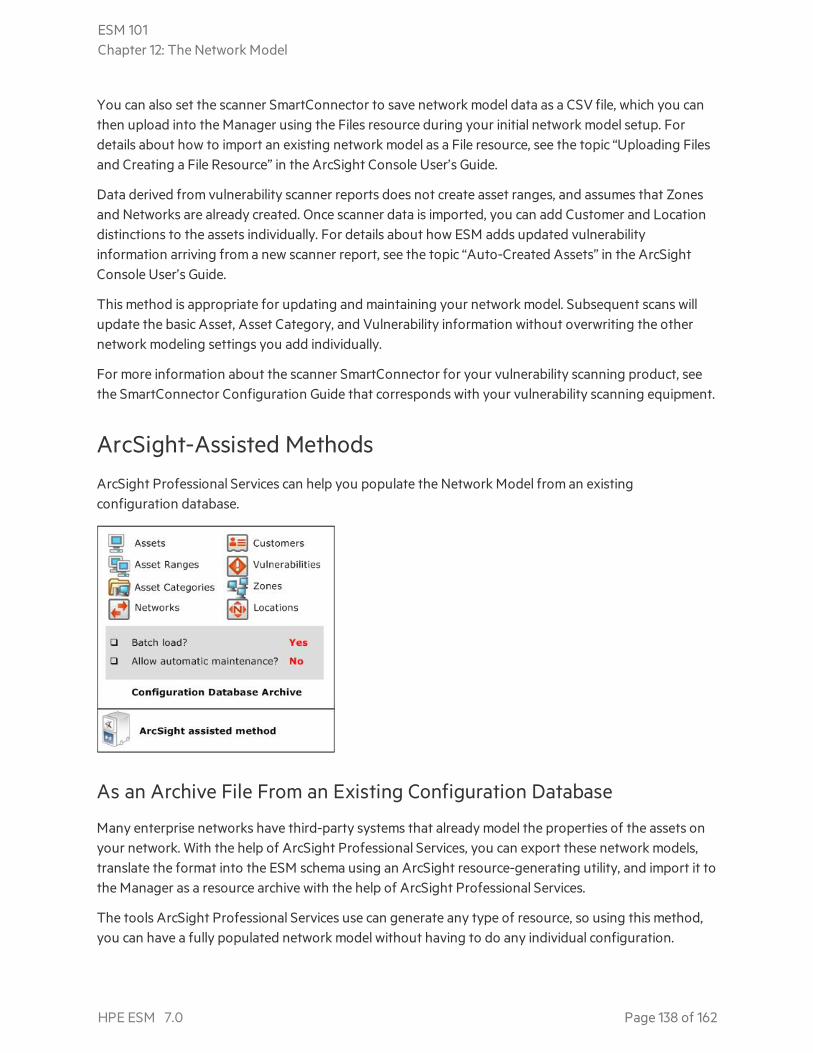
You can also set the scanner SmartConnector to save network model data as a CSV file, which you canthen upload into the Manager using the Files resource during your initial network model setup. Fordetails about how to import an existing network model as a File resource, see the topic “Uploading Filesand Creating a File Resource” in the ArcSight Console User’s Guide.
Data derived from vulnerability scanner reports does not create asset ranges, and assumes that Zonesand Networks are already created. Once scanner data is imported, you can add Customer and Locationdistinctions to the assets individually. For details about how ESM adds updated vulnerabilityinformation arriving from a new scanner report, see the topic “Auto-Created Assets” in the ArcSightConsole User’s Guide.
This method is appropriate for updating and maintaining your network model. Subsequent scans willupdate the basic Asset, Asset Category, and Vulnerability information without overwriting the othernetwork modeling settings you add individually.
For more information about the scanner SmartConnector for your vulnerability scanning product, seethe SmartConnector Configuration Guide that corresponds with your vulnerability scanning equipment.
ArcSight-Assisted MethodsArcSight Professional Services can help you populate the Network Model from an existingconfiguration database.
As an Archive File From an Existing Configuration Database
Many enterprise networks have third-party systems that already model the properties of the assets onyour network. With the help of ArcSight Professional Services, you can export these network models,translate the format into the ESM schema using an ArcSight resource-generating utility, and import it tothe Manager as a resource archive with the help of ArcSight Professional Services.
The tools ArcSight Professional Services use can generate any type of resource, so using this method,you can have a fully populated network model without having to do any individual configuration.
ESM 101Chapter 12: The Network Model
HPE ESM 7.0 Page 138 of 162
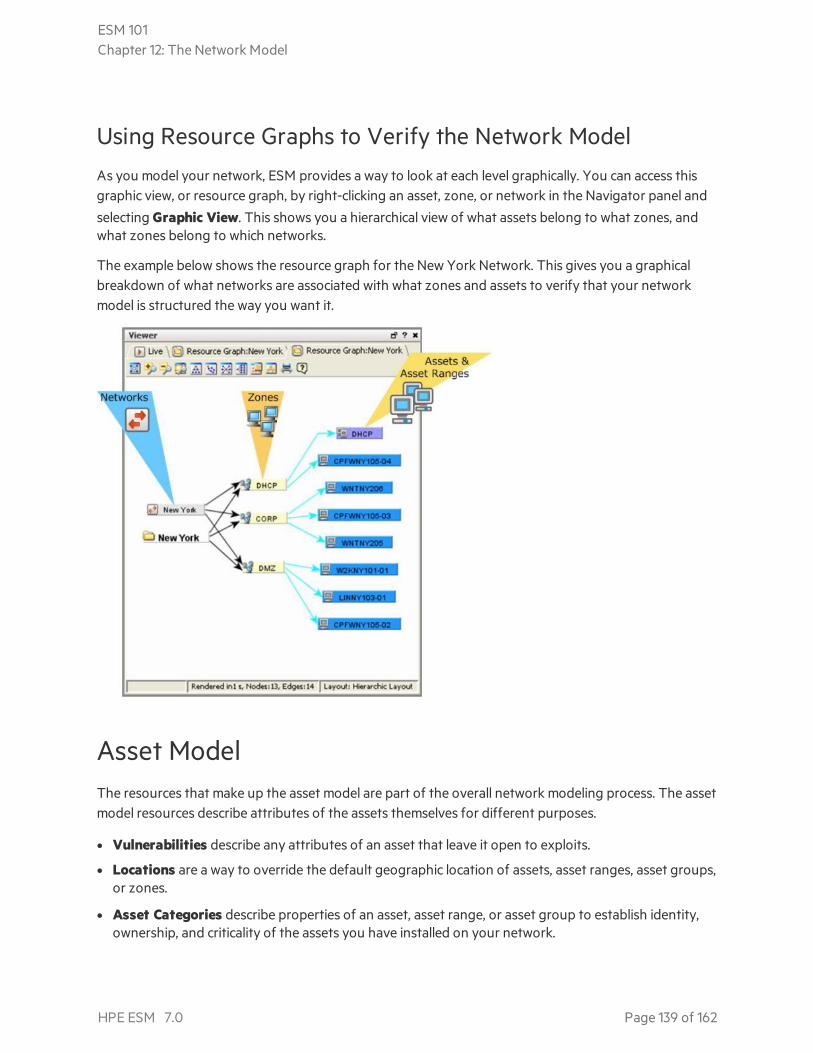
Using Resource Graphs to Verify the Network ModelAs you model your network, ESM provides a way to look at each level graphically. You can access thisgraphic view, or resource graph, by right-clicking an asset, zone, or network in the Navigator panel andselecting Graphic View. This shows you a hierarchical view of what assets belong to what zones, andwhat zones belong to which networks.
The example below shows the resource graph for the New York Network. This gives you a graphicalbreakdown of what networks are associated with what zones and assets to verify that your networkmodel is structured the way you want it.
Asset ModelThe resources that make up the asset model are part of the overall network modeling process. The assetmodel resources describe attributes of the assets themselves for different purposes.
l Vulnerabilities describe any attributes of an asset that leave it open to exploits.
l Locations are a way to override the default geographic location of assets, asset ranges, asset groups,or zones.
l Asset Categories describe properties of an asset, asset range, or asset group to establish identity,ownership, and criticality of the assets you have installed on your network.
ESM 101Chapter 12: The Network Model
HPE ESM 7.0 Page 139 of 162
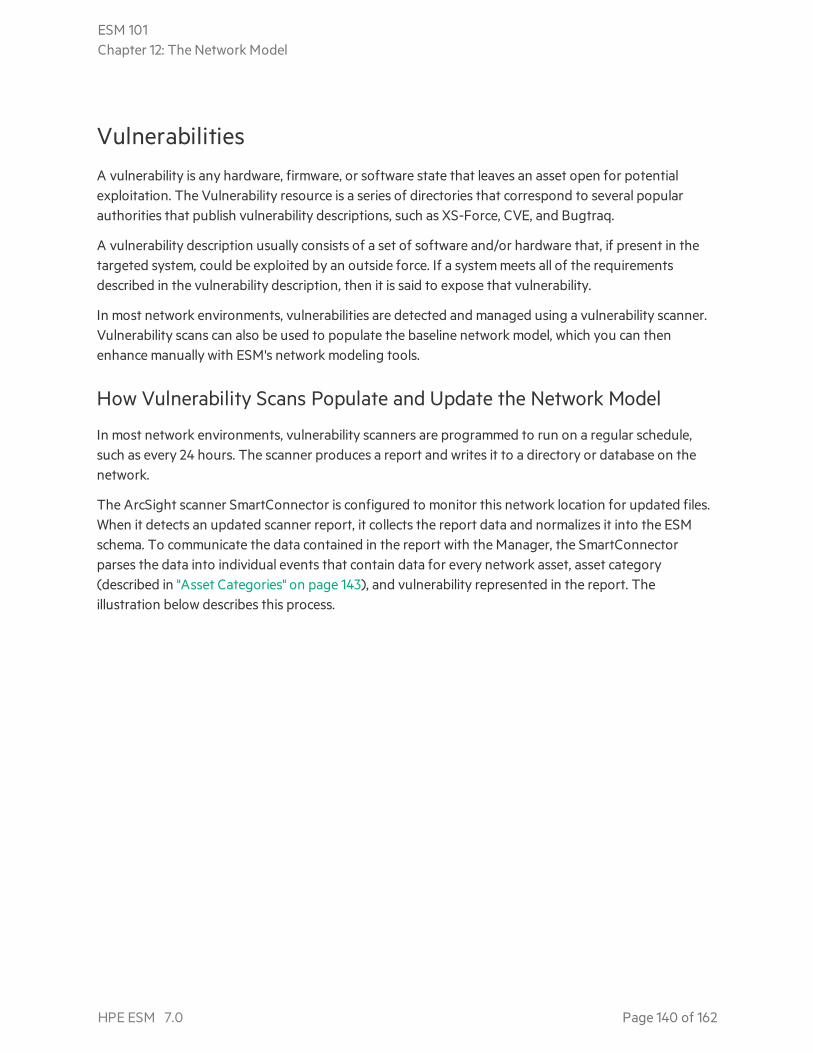
VulnerabilitiesA vulnerability is any hardware, firmware, or software state that leaves an asset open for potentialexploitation. The Vulnerability resource is a series of directories that correspond to several popularauthorities that publish vulnerability descriptions, such as XS-Force, CVE, and Bugtraq.
A vulnerability description usually consists of a set of software and/or hardware that, if present in thetargeted system, could be exploited by an outside force. If a system meets all of the requirementsdescribed in the vulnerability description, then it is said to expose that vulnerability.
In most network environments, vulnerabilities are detected and managed using a vulnerability scanner.Vulnerability scans can also be used to populate the baseline network model, which you can thenenhance manually with ESM's network modeling tools.
How Vulnerability Scans Populate and Update the Network Model
In most network environments, vulnerability scanners are programmed to run on a regular schedule,such as every 24 hours. The scanner produces a report and writes it to a directory or database on thenetwork.
The ArcSight scanner SmartConnector is configured to monitor this network location for updated files.When it detects an updated scanner report, it collects the report data and normalizes it into the ESMschema. To communicate the data contained in the report with the Manager, the SmartConnectorparses the data into individual events that contain data for every network asset, asset category(described in "Asset Categories" on page 143), and vulnerability represented in the report. Theillustration below describes this process.
ESM 101Chapter 12: The Network Model
HPE ESM 7.0 Page 140 of 162
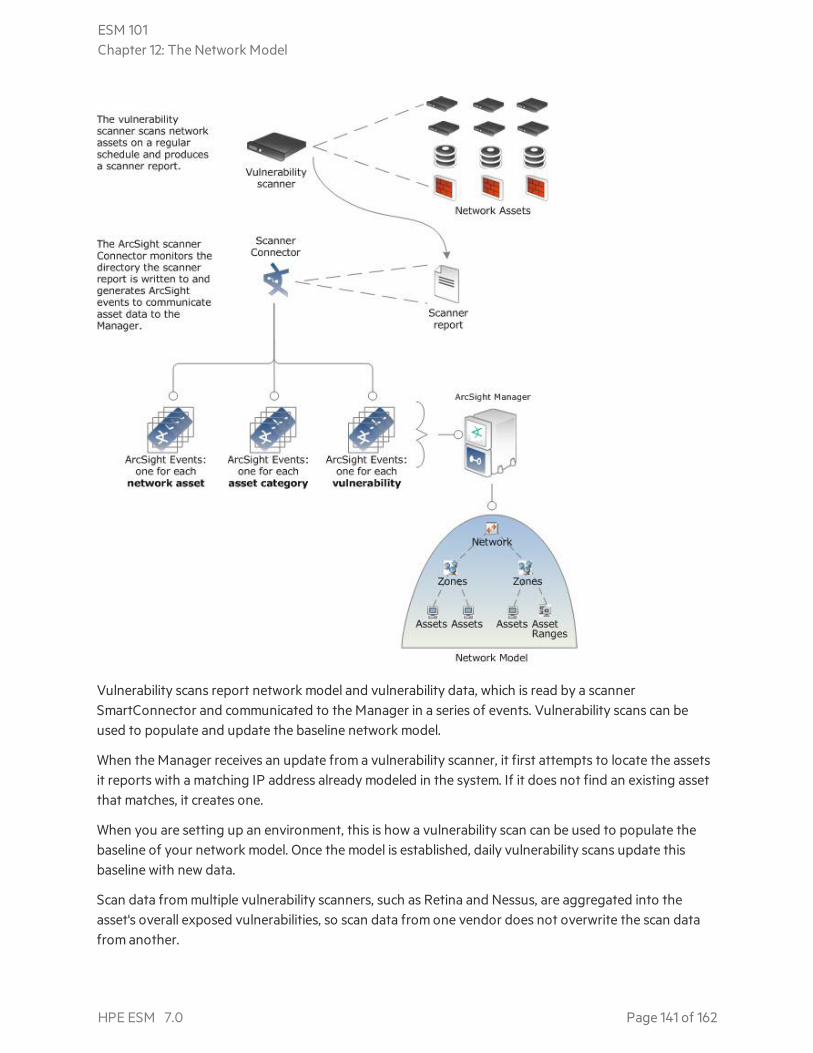
Vulnerability scans report network model and vulnerability data, which is read by a scannerSmartConnector and communicated to the Manager in a series of events. Vulnerability scans can beused to populate and update the baseline network model.
When the Manager receives an update from a vulnerability scanner, it first attempts to locate the assetsit reports with a matching IP address already modeled in the system. If it does not find an existing assetthat matches, it creates one.
When you are setting up an environment, this is how a vulnerability scan can be used to populate thebaseline of your network model. Once the model is established, daily vulnerability scans update thisbaseline with new data.
Scan data from multiple vulnerability scanners, such as Retina and Nessus, are aggregated into theasset's overall exposed vulnerabilities, so scan data from one vendor does not overwrite the scan datafrom another.
ESM 101Chapter 12: The Network Model
HPE ESM 7.0 Page 141 of 162
Reference Pages for Vulnerabilities
The Vulnerability groups that come with the ESM standard content contain links to the vendor websites that publish associated vulnerability data. This helps ensure that users have access to the latestvulnerability data associated with a particular product. For more about reference pages, see "ReferencePages" on page 51.
You can also use reference pages to direct users to more information about equipment leases or assetdetails using an External ID that refers to an internally maintained database. Reference pages can alsobe used to provide additional descriptions of asset categories you create.
Refer to External Databases Using External IDs
If your company maintains a database that describes your network assets with details, such asownership and lease information, you can use ESM's External ID option to refer to those databases.When modeling your assets, include the external ID for that asset in the External ID description line ofthe Asset editor.
Calculating Event Priority
ESM determines the priority of an event using the four factors described in "Evaluate the PriorityFormula" on page 41:
l Model confidence: Model confidence refers to whether or not the target asset has been modeled inESM and to what degree. An asset that has been modeled in ESM using output from a vulnerabilityscanner will report more information, such as vulnerabilities exposed and open ports, and thus have ahigher model confidence rating than an asset that was modeled manually and does not containvulnerability or open port information.
l Relevance: Relevance refers to whether or not an event is relevant to an asset based on whether theevent targets ports and/or known vulnerabilities, and if so, whether those vulnerabilities and/or portsare exposed on the asset.
l Severity: Severity scores are assigned based on the attacker and target's presence in one of ESM'sthreat tracking active lists.
l Asset Criticality: Asset criticality is set by you in the network modeling process by categorizing yourassets in ESM’s criticality asset categories (/System Asset Categories/Criticality/VeryHigh, High, Medium, Low, and Very Low).
The model confidence is higher if an asset is scanned for vulnerabilities and open ports. The relevanceis higher if the attacked port is actually open on the asset, and if the attack is specifically trying to exploitthat vulnerability on that asset.
ESM calculates the priority of an event in part by evaluating whether the targeted port is open, andwhether the target asset exposes the vulnerabilities exploited by a particular attack.
ESM 101Chapter 12: The Network Model
HPE ESM 7.0 Page 142 of 162
The overall event priority is calculated based on agentSeverity (see "Event Severity" on page 32)adjusted by Model Confidence, Relevance, Severity, and Criticality using a detailed formula.
The Vulnerability event field is populated when the target of the event is an asset that exposes avulnerability signature that matches the deviceEventClassID field of the event. This is described inthe Relevance portion of the priority formula in "Evaluate the Priority Formula" on page 41.
Likewise, a vulnerability scan finds open ports and assigns that information to the asset as an assetcategory. For example, if an asset has port 80 open, that asset would be assigned the following assetcategory:
/All Asset Categories/Site Asset Categories/Open Port/TCP/Port 80
For example, a given attack might be known to exploit Bugtraq 2010, CVE-1999-0153, or X-Force 173. Ifthe targeted system exposes either of those vulnerabilities and the attacked port is open on the asset,then a system can assume that the attack is likely to succeed (priority factor 5-yellow or 10-red).Otherwise, the attack will likely fail.
LocationsESM provides a location data store that maps an IP address to the owning body for the block of IPaddresses to which it belongs. Your organization may have finer-grained detail, such as the physicallocation of all of your networks or networks outside your control, or adjustments to the data store thatESM supplies. The Location resource is the way you can override the ESM default location mappingswith location information relevant to your network.
Location is an attribute you can set if the asset you are modeling resides in a geographic location thatdiffers from the location set by the mapping data store that associates IP addresses with locationinformation.
Asset CategoriesAsset categories are ESM resources that describe properties of an asset, such as the operating systemrunning on it, key applications it hosts, its role within the enterprise, and any other properties you wantto consider when evaluating threats or behaviors associated with this asset.
Asset categories model your assets in terms of how they are used. The objective of asset categories is toestablish identity, ownership, and criticality of the assets you have installed on your network. Assetcategories can be applied to assets, asset ranges, and asset groups, or to whole network zones.
Modeling asset categories is a multi-step process that requires you to consider what types ofinformation you wish to track from various assets in your network, and how those assets interrelate.The distinctions you draw in this process become factors for the filters, rules, data monitors, and reportsyou will use or build to correlate events in your network. In this way, asset categories add businessrelevance.
ESM 101Chapter 12: The Network Model
HPE ESM 7.0 Page 143 of 162
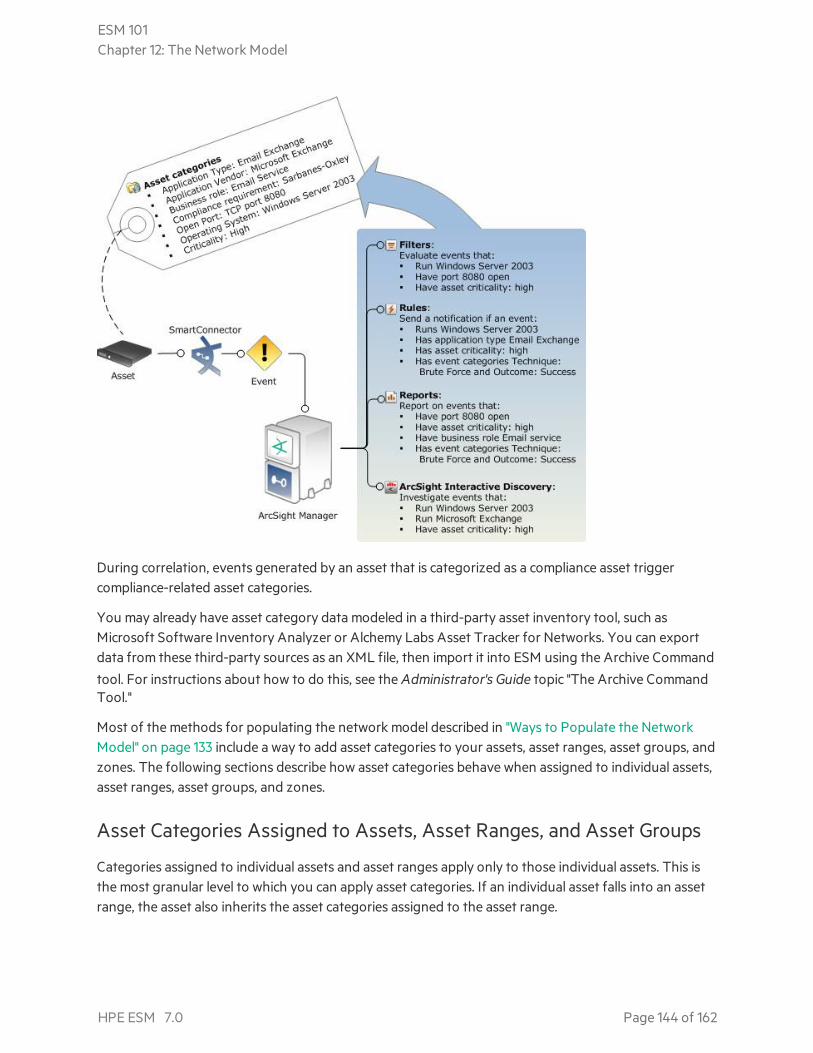
During correlation, events generated by an asset that is categorized as a compliance asset triggercompliance-related asset categories.
You may already have asset category data modeled in a third-party asset inventory tool, such asMicrosoft Software Inventory Analyzer or Alchemy Labs Asset Tracker for Networks. You can exportdata from these third-party sources as an XML file, then import it into ESM using the Archive Command
tool. For instructions about how to do this, see the Administrator's Guide topic "The Archive CommandTool."
Most of the methods for populating the network model described in "Ways to Populate the NetworkModel" on page 133 include a way to add asset categories to your assets, asset ranges, asset groups, andzones. The following sections describe how asset categories behave when assigned to individual assets,asset ranges, asset groups, and zones.
Asset Categories Assigned to Assets, Asset Ranges, and Asset Groups
Categories assigned to individual assets and asset ranges apply only to those individual assets. This isthe most granular level to which you can apply asset categories. If an individual asset falls into an assetrange, the asset also inherits the asset categories assigned to the asset range.
ESM 101Chapter 12: The Network Model
HPE ESM 7.0 Page 144 of 162
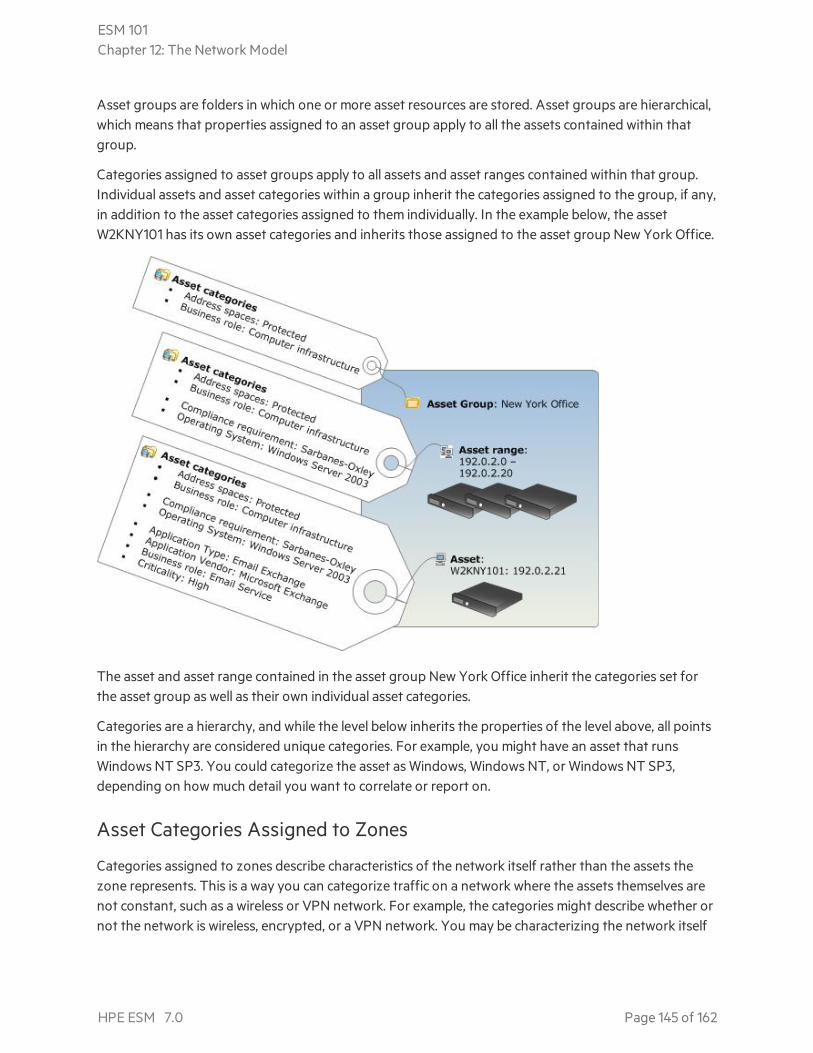
Asset groups are folders in which one or more asset resources are stored. Asset groups are hierarchical,which means that properties assigned to an asset group apply to all the assets contained within thatgroup.
Categories assigned to asset groups apply to all assets and asset ranges contained within that group.Individual assets and asset categories within a group inherit the categories assigned to the group, if any,in addition to the asset categories assigned to them individually. In the example below, the assetW2KNY101 has its own asset categories and inherits those assigned to the asset group New York Office.
The asset and asset range contained in the asset group New York Office inherit the categories set forthe asset group as well as their own individual asset categories.
Categories are a hierarchy, and while the level below inherits the properties of the level above, all pointsin the hierarchy are considered unique categories. For example, you might have an asset that runsWindows NT SP3. You could categorize the asset as Windows, Windows NT, or Windows NT SP3,depending on how much detail you want to correlate or report on.
Asset Categories Assigned to Zones
Categories assigned to zones describe characteristics of the network itself rather than the assets thezone represents. This is a way you can categorize traffic on a network where the assets themselves arenot constant, such as a wireless or VPN network. For example, the categories might describe whether ornot the network is wireless, encrypted, or a VPN network. You may be characterizing the network itself
ESM 101Chapter 12: The Network Model
HPE ESM 7.0 Page 145 of 162
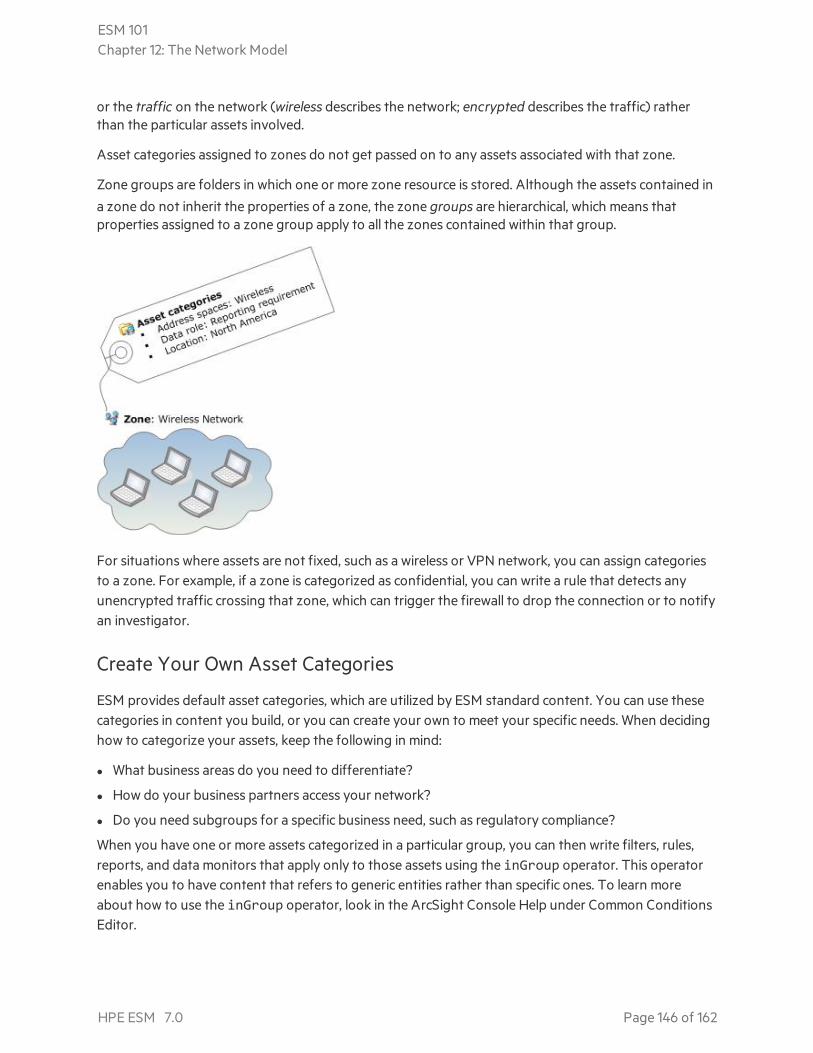
or the traffic on the network (wireless describes the network; encrypted describes the traffic) ratherthan the particular assets involved.
Asset categories assigned to zones do not get passed on to any assets associated with that zone.
Zone groups are folders in which one or more zone resource is stored. Although the assets contained ina zone do not inherit the properties of a zone, the zone groups are hierarchical, which means thatproperties assigned to a zone group apply to all the zones contained within that group.
For situations where assets are not fixed, such as a wireless or VPN network, you can assign categoriesto a zone. For example, if a zone is categorized as confidential, you can write a rule that detects anyunencrypted traffic crossing that zone, which can trigger the firewall to drop the connection or to notifyan investigator.
Create Your Own Asset Categories
ESM provides default asset categories, which are utilized by ESM standard content. You can use thesecategories in content you build, or you can create your own to meet your specific needs. When decidinghow to categorize your assets, keep the following in mind:
l What business areas do you need to differentiate?
l How do your business partners access your network?
l Do you need subgroups for a specific business need, such as regulatory compliance?
When you have one or more assets categorized in a particular group, you can then write filters, rules,reports, and data monitors that apply only to those assets using the inGroup operator. This operatorenables you to have content that refers to generic entities rather than specific ones. To learn moreabout how to use the inGroup operator, look in the ArcSight Console Help under Common ConditionsEditor.
ESM 101Chapter 12: The Network Model
HPE ESM 7.0 Page 146 of 162
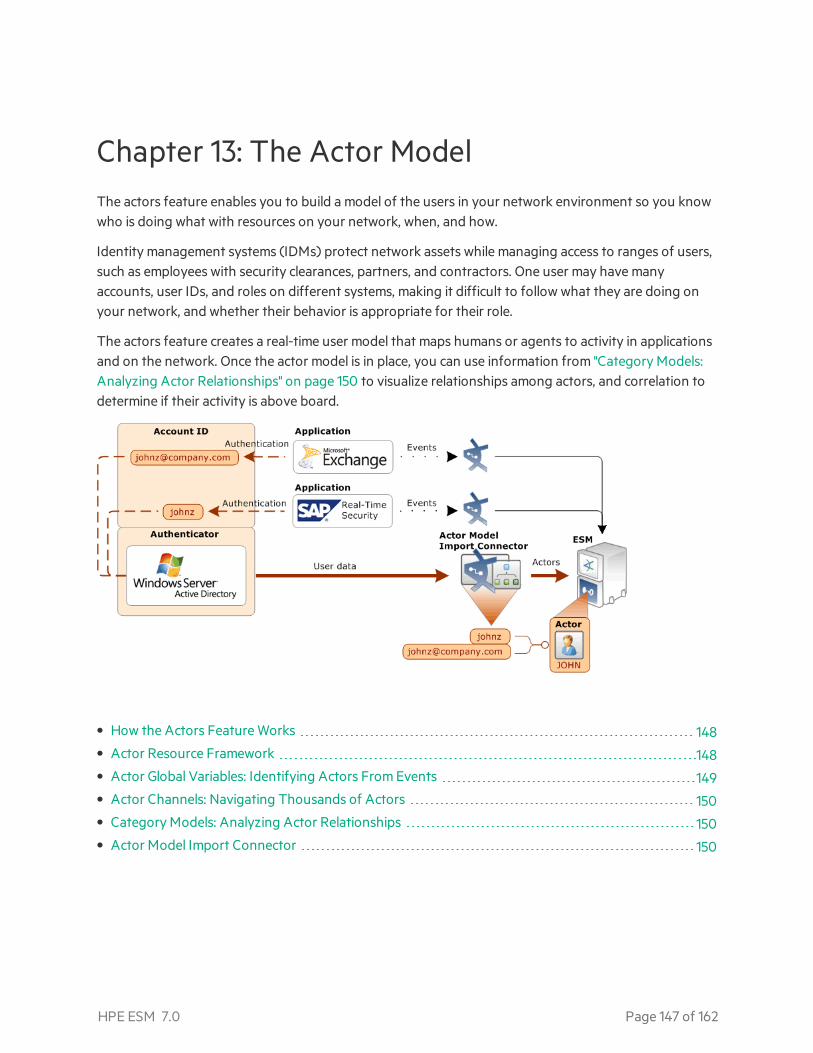
Chapter 13: The Actor ModelThe actors feature enables you to build a model of the users in your network environment so you knowwho is doing what with resources on your network, when, and how.
Identity management systems (IDMs) protect network assets while managing access to ranges of users,such as employees with security clearances, partners, and contractors. One user may have manyaccounts, user IDs, and roles on different systems, making it difficult to follow what they are doing onyour network, and whether their behavior is appropriate for their role.
The actors feature creates a real-time user model that maps humans or agents to activity in applicationsand on the network. Once the actor model is in place, you can use information from "Category Models:Analyzing Actor Relationships" on page 150 to visualize relationships among actors, and correlation todetermine if their activity is above board.
• How the Actors Feature Works 148• Actor Resource Framework 148• Actor Global Variables: Identifying Actors From Events 149• Actor Channels: Navigating Thousands of Actors 150• Category Models: Analyzing Actor Relationships 150• Actor Model Import Connector 150
HPE ESM 7.0 Page 147 of 162
How the Actors Feature WorksSimilar to how ArcSight SmartConnectors normalize event data from different devices into a commondata schema, the Actors feature normalizes user information stored in different formats in differentauthentication data stores to create a profile that identifies users on your network.
In the example diagram in "The Actor Model" on the previous page, ESM receives the actor data fromthe Microsoft Active Directory system via the "Actor Model Import Connector" on page 150. Eventsarrive from applications that all use different data stores to authenticate user activity, which all usedifferent account IDs to identify the user John Zed. ESM identifies the activity as all belonging to thesame actor. That actor is represented in ESM as JOHN.
The actors feature is supported internally using the "Actor Resource Framework" below, a series ofinternal look-up tables maintained by regular updates from the Actor Model Import connector.
As part of setting up the actors feature, you also configure an applications and authenticators active listto identify the mapping between the applications in your network environment and the data stores theyuse to authenticate users. In the example shown in "The Actor Model" on the previous page, WindowsServer Active Directory is the authentication data source for Microsoft Exchange and SAP Real-TimeSecurity.
Once the actor model is in place, ESM provides modeling and visualization tools that can depict directand indirect relationships between actors in the Actor model.
Actors and category models provide real-time, drill-down views of users and their activities beyond whatis possible with custom-created session lists for identity correlation.
For testing purposes, you can also manually add actors to ESM. You can also import or redefine views ofuser groups and relationships with category models.
Actor Resource FrameworkAs shown below, when events arrive at the Manager, resources that use conditions or select fieldsinvoke one or more of the actor global variables provided in ESM standard content. These globalvariables and the actor data maintained in the Actor Resource Framework provide several ways toidentify actors using whatever user identity attributes are available in events arriving from differentapplications from across the network.
The global variables first look up the authenticator using the device-specific data, such as vendor andproduct information in the event, then look up the relevant user information from the Actor ResourceFramework tables to positively identify the actor.
Below is a detailed look at how the Actors feature works.
ESM 101Chapter 13: The Actor Model
HPE ESM 7.0 Page 148 of 162
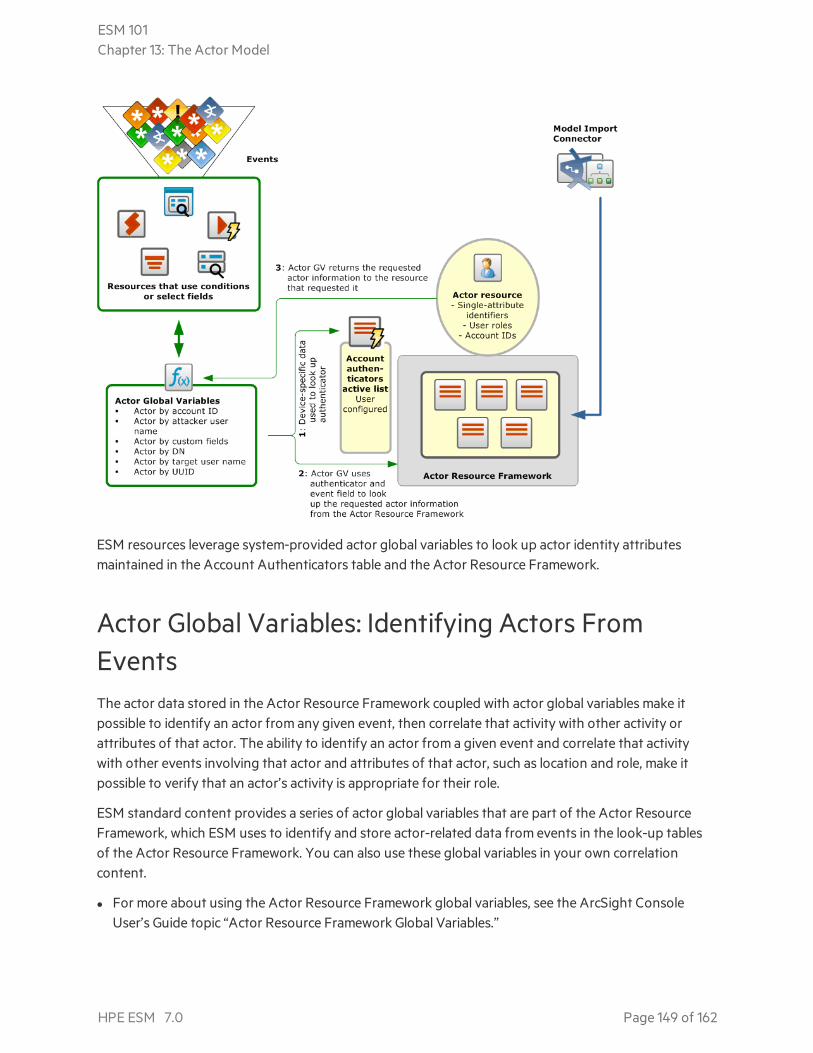
ESM resources leverage system-provided actor global variables to look up actor identity attributesmaintained in the Account Authenticators table and the Actor Resource Framework.
Actor Global Variables: Identifying Actors FromEventsThe actor data stored in the Actor Resource Framework coupled with actor global variables make itpossible to identify an actor from any given event, then correlate that activity with other activity orattributes of that actor. The ability to identify an actor from a given event and correlate that activitywith other events involving that actor and attributes of that actor, such as location and role, make itpossible to verify that an actor’s activity is appropriate for their role.
ESM standard content provides a series of actor global variables that are part of the Actor ResourceFramework, which ESM uses to identify and store actor-related data from events in the look-up tablesof the Actor Resource Framework. You can also use these global variables in your own correlationcontent.
l For more about using the Actor Resource Framework global variables, see the ArcSight ConsoleUser’s Guide topic “Actor Resource Framework Global Variables.”
ESM 101Chapter 13: The Actor Model
HPE ESM 7.0 Page 149 of 162
l For an outline of how to construct your own actor global variables, see the ArcSight Console User’sGuide topic “Leveraging Actor Data Using Variables.”
Actor Channels: Navigating Thousands of ActorsESM provides actor channels, which present all the actors in your actor model in a single, scrollable view.Like active channels, you can apply local filters to actor channels to find actors with certain attributes.
Actor channels are the only way to see actor models that contain 1,000 or more members, becausedisplay space in the Navigator panel is limited. You can also use actor channels for viewing actor modelswith fewer than 1,000 members.
For more about viewing actors in actor channels, see the ArcSight Console User’s Guide topic “ViewingActors in an Actor Channel.”
Category Models: Analyzing Actor RelationshipsOnce you have actor information created, you can make logical groupings to represent relationshipsamong actors and actor attributes using category models.
Category models can reflect direct actor relationships, such as reporting hierarchies, or relationshipsbetween actors who share common attributes, such as actors in a particular location. For reportinghierarchies, your model can consist of a top-to-bottom structure (by Manager), or its reverse (byAssistant). Category models can also reflect relationships between actors using custom attributesdefined by the user.
You can use category models to visualize these relationships, then leverage the data gathered in themusing the HasRelationship function in local and global variables.
You can use this model to group and visualize users in your organization in numerous ways, such asreporting structures, organizational units, or role-based functions, then use these relationships asparameters in user-defined monitoring, analysis, and correlation.
Actor Model Import ConnectorThe ArcSight Actor Model Import connector support bulk import of user accounts from multipleidentity management systems, such as Microsoft Active Directory.
The Actor Model Import connector imports the user data into the actors resource, where it is leveragedby the infrastructure within ESM that identifies and tracks user activity. Correlated and normalized dataabout user activity is then available for monitoring and investigation, further correlation, and reporting.
ESM 101Chapter 13: The Actor Model
HPE ESM 7.0 Page 150 of 162

The actor model used to describe users is automatically populated with the attributes configured for itby the Actor Model Import connector when ESM establishes a connection with the connector.
In addition to the basic single-value attributes, each actor is likely to have multi-value attributes,specifically multiple account IDs, and multiple roles, which are tracked using your IDM system. Thesemulti-value attributes can appear differently in events coming from different devices. In some cases,such as a non-IT-related role, the information is not included in event data at all, but is still valuableinformation to help identify users and correlate their activity to help ensure appropriate behavior andaccess to resources hosted on the network.
ESM 101Chapter 13: The Actor Model
HPE ESM 7.0 Page 151 of 162

Chapter 14: Managing Resources and StandardContentThis section defines what ESM means by resources, and describes the tools available to manage andaccess them. It also introduces standard content and its intended uses.
• ESM Resources 152• Packages 157• Content Management 159• Access Control Lists (ACLs) 159• Standard Content 161
ESM ResourcesESM manages the logic used to process events using objects called resources. A resource defines theproperties, values, and relationships used to configure the functions ESM performs. Resources can alsobe the output of a configuration that has been executed on events (such as archived reports, or PatternDiscovery snapshots and patterns). Resources are used for displaying and analyzing events, andcontribute to generating additional events that are used internally by ESM for correlation oradministration.
ESM resources are accessed in the Navigator panel of the ArcSight Console.
Resources appear as objects in the navigation panel of the ArcSight Console and are stored in thedatabase. Resource objects can be imported and exported from the system for sharing among multipleManagers, and can be archived for storage and data retrieval.
Resources are stored hierarchically in groups that share common properties, and they can haverelationships with other resources that share common dependencies.
Resources that define properties, values, and relationships and evaluate events during the event life
cycle as part of a use case are also referred to as content. Content is designed to address specific usagescenarios. ESM installs a predefined set of standard content for basic functions and systemadministration, and offers a series of content packages you can install that address common businessand security cases. You can also use ESM's content authoring tools to develop your own contenttailored to your business environment. For more about ESM standard content, see "Standard Content "on page 161.
HPE ESM 7.0 Page 152 of 162

File ResourceA File is an ESM resource that contains a non-ESM object, which other resources can access to provideusers with more information or to perform special functions. Files can be used to contain scripts, utilities,data files, templates, or any general purpose file. Files are also what make the objects they containtransportable across multiple Managers.
For example, you can write a rule that, when triggered, executes a script to initiate a process on yournetwork. The script can be contained in a File resource so it can be transported from one Managerinstance to another using the Packages resource. Once at the destination Manager system, the contentsof the file must be extracted to the file system, where its function can be accessed by the resources onthat Manager.
Standard content includes two files, which supply Velocity template macros for use by the vulnerabilitymapping system.
For more about Files, see the topic Managing Files in the ArcSight Console Help. For more about the fileresources that accompany standard content, see the ArcSight Administration and ArcSight SystemStandard Content Guide.
The ArcSight Archive UtilityThe ArcSight Archive utility is a multi-function command-line tool that can be used by ArcSightAdministrators to perform routine maintenance, such as back-up and restore. The archive utility isanother way, besides Packages, that authors can propagate content among multiple Managers, or toconfigure one Manager with the same content as another.
When you export a resource using the Archive utility, it may have dependencies on other resources. Forexample, a rule may use (refer to) three filters. When the rule is exported using the archive utility, youshould also export the three filters it depends upon, so the join between them is preserved. Packagesmaintain these relationships automatically.
For more about the archive utility, see Archiving Resources in Chapter 3, "Resources," of the ESMAdministrator's Guide.
Resource GraphsYou can use a graph view to see the dependencies one resource has on other resources. To generate a
graph view, right-click an individual resource in the Navigator panel and select Graph View. Theresource graph will be rendered in the Viewer panel.
The example resource graph below shows the rule Hostile - Attempt that is part of the threat escalationsystem in the standard content (/All Rules/ArcSight System/Threat Tracking/Hostile -Attempt) and the active lists it reads from.
ESM 101Chapter 14: Managing Resources and Standard Content
HPE ESM 7.0 Page 153 of 162
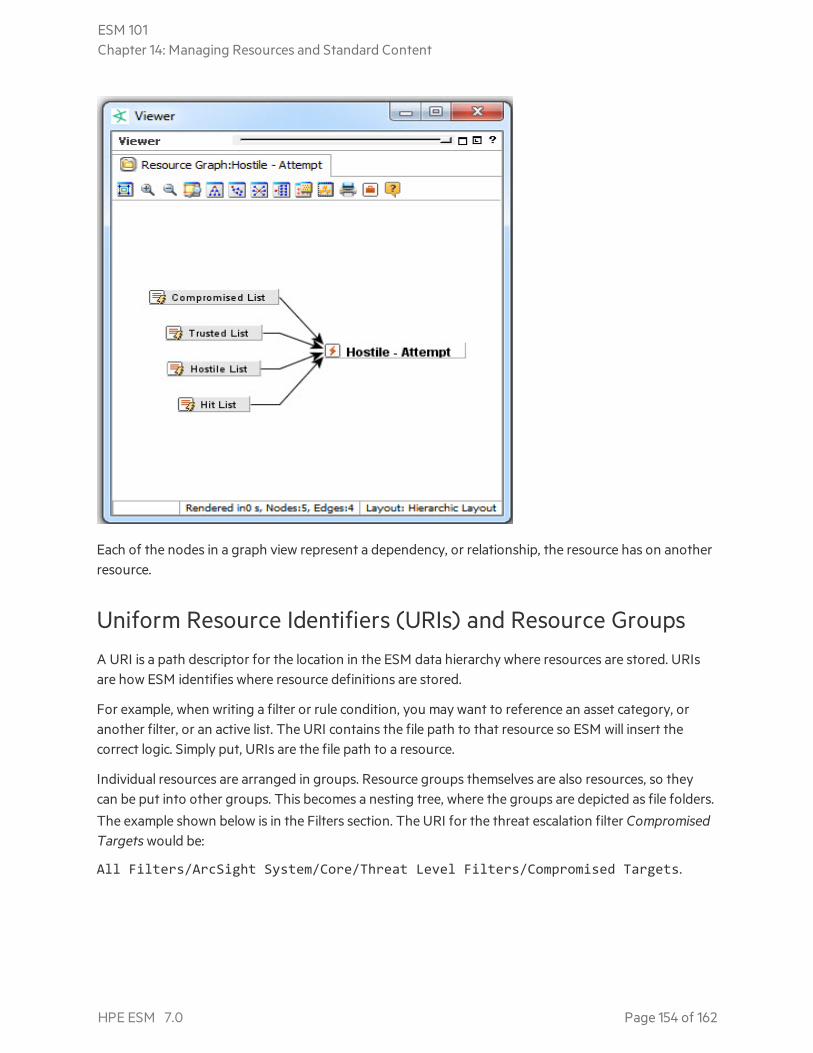
Each of the nodes in a graph view represent a dependency, or relationship, the resource has on anotherresource.
Uniform Resource Identifiers (URIs) and Resource GroupsA URI is a path descriptor for the location in the ESM data hierarchy where resources are stored. URIsare how ESM identifies where resource definitions are stored.
For example, when writing a filter or rule condition, you may want to reference an asset category, oranother filter, or an active list. The URI contains the file path to that resource so ESM will insert thecorrect logic. Simply put, URIs are the file path to a resource.
Individual resources are arranged in groups. Resource groups themselves are also resources, so theycan be put into other groups. This becomes a nesting tree, where the groups are depicted as file folders.
The example shown below is in the Filters section. The URI for the threat escalation filter CompromisedTargets would be:
All Filters/ArcSight System/Core/Threat Level Filters/Compromised Targets.
ESM 101Chapter 14: Managing Resources and Standard Content
HPE ESM 7.0 Page 154 of 162
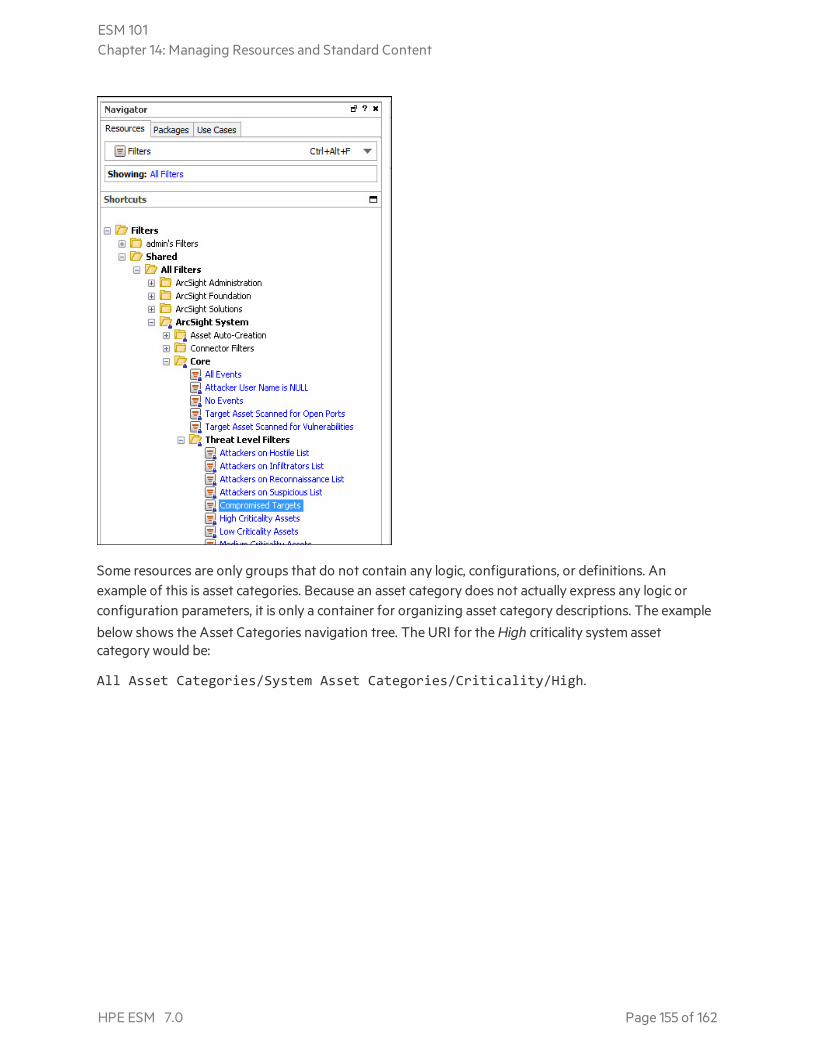
Some resources are only groups that do not contain any logic, configurations, or definitions. Anexample of this is asset categories. Because an asset category does not actually express any logic orconfiguration parameters, it is only a container for organizing asset category descriptions. The examplebelow shows the Asset Categories navigation tree. The URI for the High criticality system assetcategory would be:
All Asset Categories/System Asset Categories/Criticality/High.
ESM 101Chapter 14: Managing Resources and Standard Content
HPE ESM 7.0 Page 155 of 162
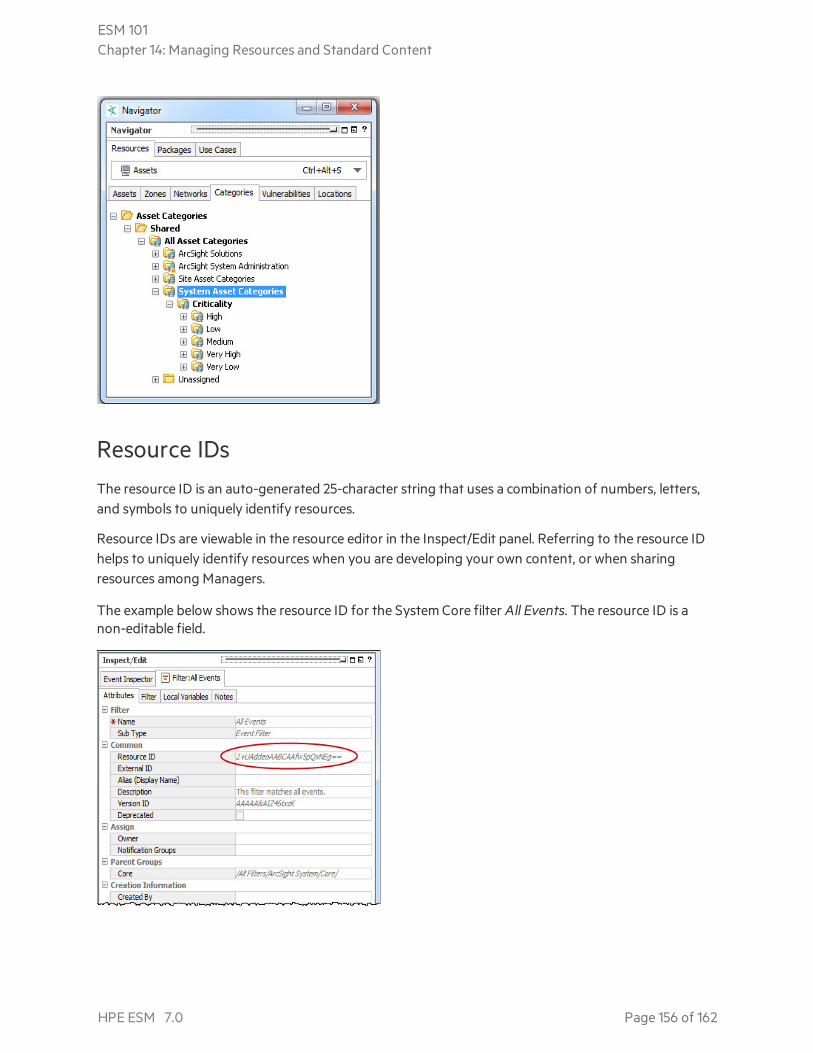
Resource IDsThe resource ID is an auto-generated 25-character string that uses a combination of numbers, letters,and symbols to uniquely identify resources.
Resource IDs are viewable in the resource editor in the Inspect/Edit panel. Referring to the resource IDhelps to uniquely identify resources when you are developing your own content, or when sharingresources among Managers.
The example below shows the resource ID for the System Core filter All Events. The resource ID is anon-editable field.
ESM 101Chapter 14: Managing Resources and Standard Content
HPE ESM 7.0 Page 156 of 162
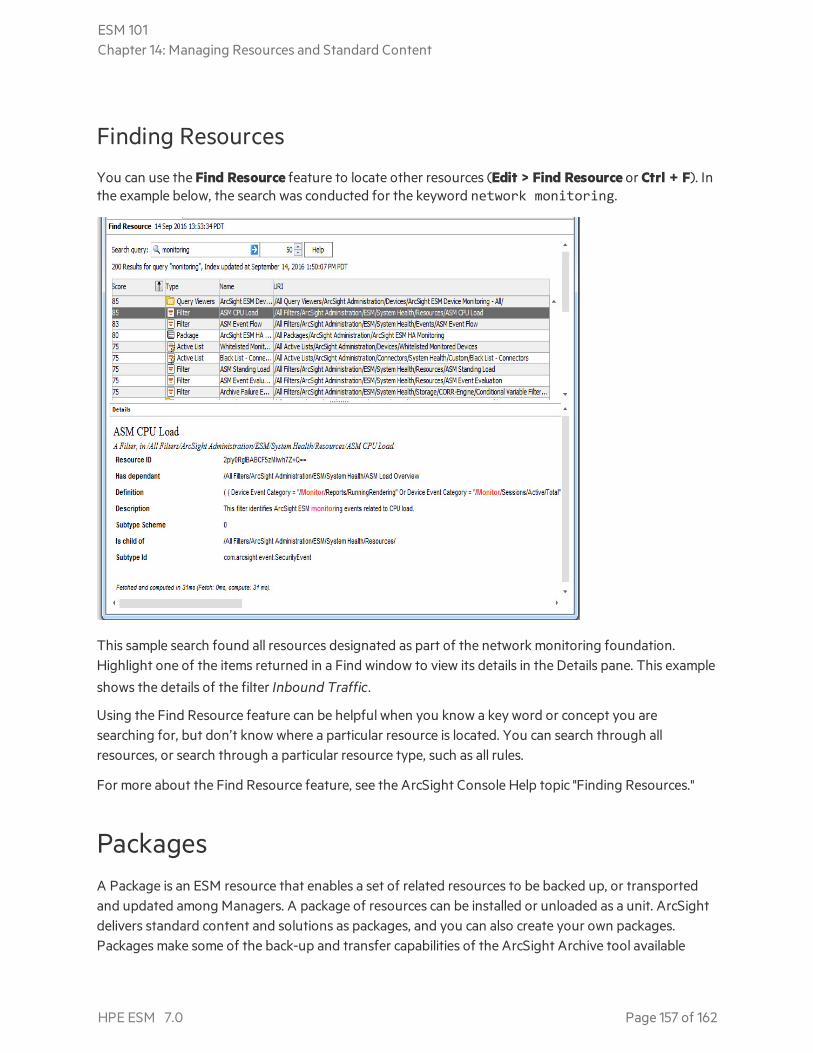
Finding Resources
You can use the Find Resource feature to locate other resources (Edit > Find Resource or Ctrl + F). Inthe example below, the search was conducted for the keyword network monitoring.
This sample search found all resources designated as part of the network monitoring foundation.Highlight one of the items returned in a Find window to view its details in the Details pane. This example
shows the details of the filter Inbound Traffic.
Using the Find Resource feature can be helpful when you know a key word or concept you aresearching for, but don’t know where a particular resource is located. You can search through allresources, or search through a particular resource type, such as all rules.
For more about the Find Resource feature, see the ArcSight Console Help topic "Finding Resources."
PackagesA Package is an ESM resource that enables a set of related resources to be backed up, or transportedand updated among Managers. A package of resources can be installed or unloaded as a unit. ArcSightdelivers standard content and solutions as packages, and you can also create your own packages.Packages make some of the back-up and transfer capabilities of the ArcSight Archive tool available
ESM 101Chapter 14: Managing Resources and Standard Content
HPE ESM 7.0 Page 157 of 162

through the Console user interface. Packages are also created for the purposes of contentsyncrhonization, a function of configured ESM peers where one Manager is the publisher of all content.When the content is packaged specifically for synchronization, the publisher pushes packages tosubscribers.
Packages are transported in a file called a bundle (with the extension .arb), which contains one or morepackages. You can import and export bundles and install and uninstall the packages that the bundlescontain. When you import a bundle, the .arb source file is saved as a File resource (see "File Resource" onpage 153).
Packages can be used to transport content for a family of use cases, and they can also be used totransport blocks of unrelated resources, or a core of common resources that can be leveraged by otheruse cases. The Packages resource editor also manages dependencies on resources located in otherpackages.
Package States: Imported and InstalledA package can exist in two states in the ArcSight Console: imported and installed.
A package that has been installed loads its resources into the database and makes them accessible inthe Navigator panel resource tree. The package icon in the Navigator panel package view will appearblue.
If a package has been imported, it will be visible in the Package view in the Navigator panel, but theresources it contains will not be available in the resource tree view. The package icon in the packageview will appear grey.
If you do not want the package to be available in any form, you can delete the package.
You can create, export, and import packages in order to share resources among multiple Managers.When a package is imported from one Manager to another, it must also be installed to make itsresources available in the Navigator panel resource tree.
ESM 101Chapter 14: Managing Resources and Standard Content
HPE ESM 7.0 Page 158 of 162

Package ViewA key value provided by packages is their ability to manage dependencies among other relatedresources when preparing sets of related resources for backup or transport to another Manager.
The resource tree contains a tab that provides a view of the all resources that are associated withpackages. This view also provides access to tools with which you can import, install, and exportpackages, edit, uninstall, and delete packages, and create new packages. The dependency view toggleshows required packages, which are packages on which another package depends:
Toggling the dependency view off shows only the contents of the package itself.
The Packages view in the Navigator panel provides access to all the resources that are part of a packagein a single view. The package management tools to create new packages and edit existing ones areavailable from the package right-click menu.
For more about using Packages, see the topic "Managing Packages" in the ArcSight Console Help.
Content ManagementYou can leverage peer relationships if you want a hierarchical structure where a single Manager is thesource of ESM content (the publisher) and peers the recipients of such content (subscribers). In thiscase, the content management feature gives you the ability to “push” ESM content in the form ofpackages on a regular schedule or manually, as required.
For information on peer configuration and content management, refer to the ArcSight CommandCenter User’s Guide.
Access Control Lists (ACLs)ESM manages user access to resources using Access Control Lists (ACLs). ACLs are applied to usergroups, which allows the users in that group to have read/write access to the resources specified by theACL.
ESM 101Chapter 14: Managing Resources and Standard Content
HPE ESM 7.0 Page 159 of 162

You can further refine access to individual resources by specifying what user groups can haveread/write access to it.
Subgroups inherit the ACL settings of their parent groups. If a resource is assigned to more than oneuser group, the ACL is the combined list of those two groups.
Users and user groups and the ACLs to which they have access are also managed by the ArcSightCommand Center. See the topic “Managing Users” in the ArcSight Command Center User’s Guide.
For more about ACLs, see the topic "Access Control Lists" in the ArcSight Console User’s Guide.
User Access ControlsWhen you add users and user groups, you use the user ACL Editor to set access levels to individualresource groups. You can also set user group membership, specific event privileges, and sortable fieldset access. The ACL Editor provides access to:
l Access Privileges. This tab shows which user groups you belong to.
l User Permissions. Users can view the resource groups they have read and/or write access to.Administrators can edit these privileges.
l Event Privileges. This tab specifies filters the user group uses. Users in this group will only seeevents that match the filter conditions specified here.
l Sortable Field Sets. This tab specifies the sortable field sets the user group uses. Users in thisgroup will only see the fields specified by these field sets. This enables you to protect data in sensitiveevent fields while providing users with different security clearances access to the comprehensiveevent stream. For more about sortable field sets, see "Sortable Field Sets" on page 83, or look in theArcSight Console Help under Sortable Field Sets.
Resource Access ControlsEvery resource group has an ACL (list of user groups that have access to it), which determines whichuser groups have permission to view and edit the resources contained in that resource group.
ACL EditorAccess to both types of access controls (user and resource) is managed by the ACL Editor. Every user
and resource group provides access to the ACL Editor using the right-click command Edit AccessControl from the Navigator panel.
ESM 101Chapter 14: Managing Resources and Standard Content
HPE ESM 7.0 Page 160 of 162

Standard ContentESM comes with a series of coordinated resources that address common enterprise network securityand management tasks.
These resources under ArcSight Administration and ArcSight System are installed automatically withESM to provide essential system health and status operations. These resource systems are referred tocollectively as standard content.
Most branches in the resource tree (except ArcSight Solutions) contain standard content, a coordinatedset of resources that address common security scenarios and facilitate basic ESM functions. For moreinformation, refer to the ArcSight Administration and ArcSight System Standard Content Guide.
ESM 101Chapter 14: Managing Resources and Standard Content
HPE ESM 7.0 Page 161 of 162

Send Documentation FeedbackIf you have comments about this document, you can contact the documentation team by email. If anemail client is configured on this system, click the link above and an email window opens with thefollowing information in the subject line:
Feedback on ESM 101 (ESM 7.0)
Just add your feedback to the email and click send.
If no email client is available, copy the information above to a new message in a web mail client, and sendyour feedback to [email protected].
We appreciate your feedback!
HPE ESM 7.0 Page 162 of 162