Embed Size (px)
Citation preview
HPE Reference Architecture for ProLiant DL580 Gen9 and Microsoft SQL Server 2016 OLTP database consolidation
Technical white paper
Technical white paper
Contents Executive summary ................................................................................................................................................................................................................................................................................................................................ 3 Introduction ................................................................................................................................................................................................................................................................................................................................................... 3 Solution overview ..................................................................................................................................................................................................................................................................................................................................... 4
HPE ProLiant DL580 Gen9 server ................................................................................................................................................................................................................................................................................... 4 HPE NVMe PCIe SSDs .................................................................................................................................................................................................................................................................................................................. 5 HPE NVMe PCIe Workload Accelerator ........................................................................................................................................................................................................................................................................ 5
Solution components ............................................................................................................................................................................................................................................................................................................................ 7 Hardware ................................................................................................................................................................................................................................................................................................................................................... 7 Software ..................................................................................................................................................................................................................................................................................................................................................... 7 Application software ....................................................................................................................................................................................................................................................................................................................... 7
Best practices and configuration guidance for the solution ............................................................................................................................................................................................................................. 7 HPE ProLiant DL580 Gen9 ..................................................................................................................................................................................................................................................................................................... 7 NVMe PCIe Workload Accelerator configuration ................................................................................................................................................................................................................................................. 8 SQL Server configuration guidance .................................................................................................................................................................................................................................................................................. 8
Capacity and sizing ................................................................................................................................................................................................................................................................................................................................ 8 Workload description and test methodology........................................................................................................................................................................................................................................................... 8 NVMe characterization ................................................................................................................................................................................................................................................................................................................. 9 SQL memory characterization ........................................................................................................................................................................................................................................................................................... 13 HPE ProLiant DL580 Gen9 system and SQL settings characterization results ................................................................................................................................................................. 16 SQL backup tests........................................................................................................................................................................................................................................................................................................................... 18 SQL index rebuild tests ............................................................................................................................................................................................................................................................................................................ 20 Processor comparison (Broadwell versus Haswell) ....................................................................................................................................................................................................................................... 20 Analysis and recommendations ....................................................................................................................................................................................................................................................................................... 21
Summary ...................................................................................................................................................................................................................................................................................................................................................... 22 Appendix A: Bill of materials ...................................................................................................................................................................................................................................................................................................... 22 Appendix B: FIO tool command line configuration for disk I/O benchmarking ........................................................................................................................................................................... 23 Appendix C: Understanding hardware and software NUMA in SQL Server 2016 and how to set affinity on Broadwell .................................................................... 24 Appendix D: Creating a custom soft-NUMA configuration ........................................................................................................................................................................................................................... 25 Resources and additional links ................................................................................................................................................................................................................................................................................................ 27
Technical white paper Page 3
Executive summary Demands for database implementations continue to escalate. Faster transaction processing speeds, scalable capacity, and increased flexibility are required to meet the needs of today’s business. Many businesses are still running older versions of Microsoft® SQL Server on older infrastructure. As hardware continues to age and older SQL Server versions reach end-of-life (EOL), SQL admins often run into performance and scalability issues. To solve these issues, customers often refresh their platforms and consolidate databases as a way to improve performance and resource utilization. This also, if designed properly, usually results in reduced operating costs and accommodates future data growth.
SQL Server database consolidation can be achieved through three ways – virtualization, instance consolidation, and database consolidation. The HPE ProLiant DL580 Gen9 server is an ideal choice for your demanding and data-intensive resources, addressing key technology trends, such as in-memory computing for accelerated data analytics, in-server flash storage for accelerating data processing, co-processors and GPUs for accelerating data processing, high-density memory and I/O scalability for application consolidation. In addition, the DL580 Gen9 includes system Reliability, Availability, and Serviceability (RAS) features, such as HPE Advanced Error Recovery, HPE Memory Quarantine, and HPE Advanced Error Containment, which Microsoft SQL Server 2016 supports.
This Reference Architecture will demonstrate a highly optimized configuration for a mid-range multiple database consolidation with Microsoft SQL Server 2016 and Windows Server® 2016 on an HPE ProLiant DL580 Gen9 server with a hybrid storage solution of write-intensive NVMe PCIe SSDs and Workload Accelerators to achieve almost 62K batch requests per second with an OLTP workload, gaining 26% in performance over a misconfigured SQL server.
This RA also addresses customer challenges and how to deal with slow SQL backups and index rebuilds performed during daily maintenance windows. We will analyze database performances using specific SQL command switches to improve throughput thus shortening the duration of these important tasks while business databases are either offline or online.
Microsoft SQL Server 2016 realizes additional performance and scalability benefits by upgrading to the latest processors. The testing showed a 20% gain in performance for an OLTP workload on Intel® Xeon® v4 (Broadwell) over v3 (Haswell) processors in an HPE ProLiant DL580 Gen9 server.
Target audience: This Hewlett Packard Enterprise Reference Architecture white paper is designed for IT professionals who use, program, manage, or administer large databases that require high availability and performance. Specifically, this information is intended for those who evaluate, recommend, or design new IT high-performance architectures.
This white paper describes testing completed in September 2016.
Document purpose: The purpose of this document is to describe a Reference Architecture, highlighting benefits and key implementation details to technical audiences.
Introduction As the demands for higher processing and scale-up capabilities grow, older platforms have reached their limits in scalability and performance. The purpose of this Reference Architecture is to provide an example platform for customers to use when designing a high-performance SQL Server database server to support database (DB) consolidation initiatives or new business requests that require high performance, transactional database support. We will discuss the results and analysis for several key decision points that SQL architects must consider in designing their SQL Server database environment. These include the following:
• Perform characterization configuration including two HPE NVMe PCIe offerings to determine the best storage layout for the OLTP database files.
• Determine the least amount of memory required by SQL while maintaining reasonable performance and reducing initial server cost.
• Compare optimized performance results of a multi-database, single instance consolidation scenario over a default installation of SQL Server.
• Characterize workload performance during concurrent backup jobs.
• Characterize workload performance during concurrent online index rebuilds.
• Compare performance of an Intel E7 v4 processor (Broadwell) based Gen9 server against its Intel E7 v3 (Haswell) predecessor.
Technical white paper Page 4
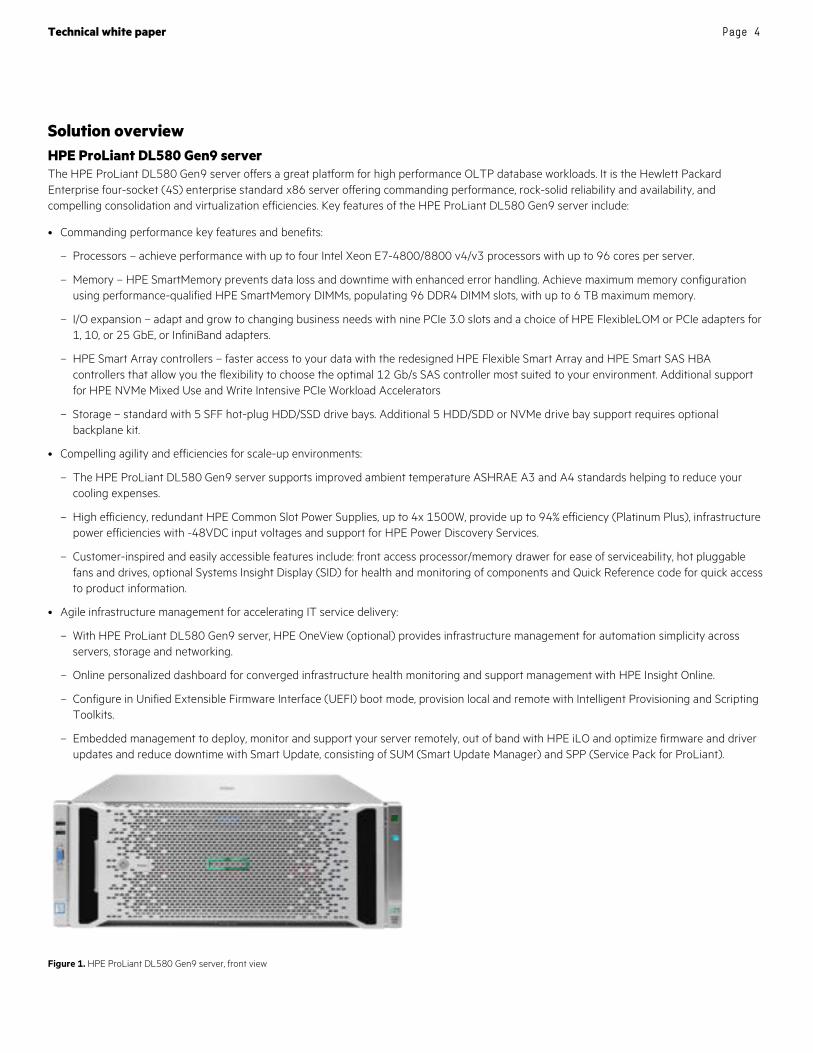
Solution overview HPE ProLiant DL580 Gen9 server The HPE ProLiant DL580 Gen9 server offers a great platform for high performance OLTP database workloads. It is the Hewlett Packard Enterprise four-socket (4S) enterprise standard x86 server offering commanding performance, rock-solid reliability and availability, and compelling consolidation and virtualization efficiencies. Key features of the HPE ProLiant DL580 Gen9 server include:
• Commanding performance key features and benefits:
– Processors – achieve performance with up to four Intel Xeon E7-4800/8800 v4/v3 processors with up to 96 cores per server.
– Memory – HPE SmartMemory prevents data loss and downtime with enhanced error handling. Achieve maximum memory configuration using performance-qualified HPE SmartMemory DIMMs, populating 96 DDR4 DIMM slots, with up to 6 TB maximum memory.
– I/O expansion – adapt and grow to changing business needs with nine PCIe 3.0 slots and a choice of HPE FlexibleLOM or PCIe adapters for 1, 10, or 25 GbE, or InfiniBand adapters.
– HPE Smart Array controllers – faster access to your data with the redesigned HPE Flexible Smart Array and HPE Smart SAS HBA controllers that allow you the flexibility to choose the optimal 12 Gb/s SAS controller most suited to your environment. Additional support for HPE NVMe Mixed Use and Write Intensive PCIe Workload Accelerators
– Storage – standard with 5 SFF hot-plug HDD/SSD drive bays. Additional 5 HDD/SDD or NVMe drive bay support requires optional backplane kit.
• Compelling agility and efficiencies for scale-up environments:
– The HPE ProLiant DL580 Gen9 server supports improved ambient temperature ASHRAE A3 and A4 standards helping to reduce your cooling expenses.
– High efficiency, redundant HPE Common Slot Power Supplies, up to 4x 1500W, provide up to 94% efficiency (Platinum Plus), infrastructure power efficiencies with -48VDC input voltages and support for HPE Power Discovery Services.
– Customer-inspired and easily accessible features include: front access processor/memory drawer for ease of serviceability, hot pluggable fans and drives, optional Systems Insight Display (SID) for health and monitoring of components and Quick Reference code for quick access to product information.
• Agile infrastructure management for accelerating IT service delivery:
– With HPE ProLiant DL580 Gen9 server, HPE OneView (optional) provides infrastructure management for automation simplicity across servers, storage and networking.
– Online personalized dashboard for converged infrastructure health monitoring and support management with HPE Insight Online.
– Configure in Unified Extensible Firmware Interface (UEFI) boot mode, provision local and remote with Intelligent Provisioning and Scripting Toolkits.
– Embedded management to deploy, monitor and support your server remotely, out of band with HPE iLO and optimize firmware and driver updates and reduce downtime with Smart Update, consisting of SUM (Smart Update Manager) and SPP (Service Pack for ProLiant).
Figure 1. HPE ProLiant DL580 Gen9 server, front view
Technical white paper Page 5
HPE NVMe PCIe SSDs The introduction of Non-Volatile Memory Express (NVMe) interface architecture propelled the disk drive technology to the next era of extremely high performing storage products. With significantly high bandwidth/IOPS and very low latency, HPE NVME PCIe SSD products are designed to take advantage of its exceptional properties to provide efficient access to your business data. The HPE SSD portfolio offers three broad categories of SSDs based on target workloads: Read Intensive, Write Intensive, and Mixed Use. The Write Intensive NVMe SSDs selected for this Reference Architecture are designed to have the highest write performance which is best suited for online transactional processing environments. The table below shows the relative performance data between drives in the SSD portfolio. See the “Resources and additional links” section for the full HPE SSD Data Sheet.
Table 1. Write performance comparison example between HPE Write Intensive (WI) 800GB SSDs
Random test HPE WI NVME SSD HPE WI 12G SAS SSD HPE WI 6G SAS SSD
Sequential writes (MB/S) 1,700 580 370
Random writes (IOPS) 99,000 68,000 46,500
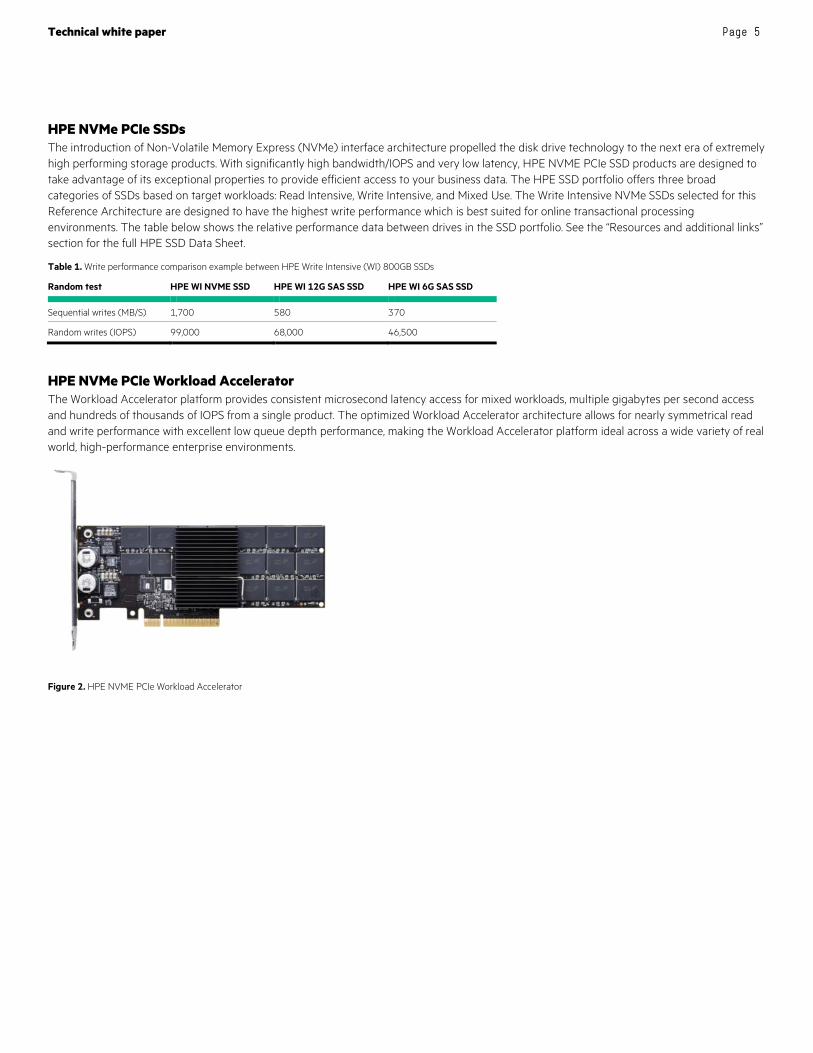
HPE NVMe PCIe Workload Accelerator The Workload Accelerator platform provides consistent microsecond latency access for mixed workloads, multiple gigabytes per second access and hundreds of thousands of IOPS from a single product. The optimized Workload Accelerator architecture allows for nearly symmetrical read and write performance with excellent low queue depth performance, making the Workload Accelerator platform ideal across a wide variety of real world, high-performance enterprise environments.
Figure 2. HPE NVME PCIe Workload Accelerator
Technical white paper Page 6
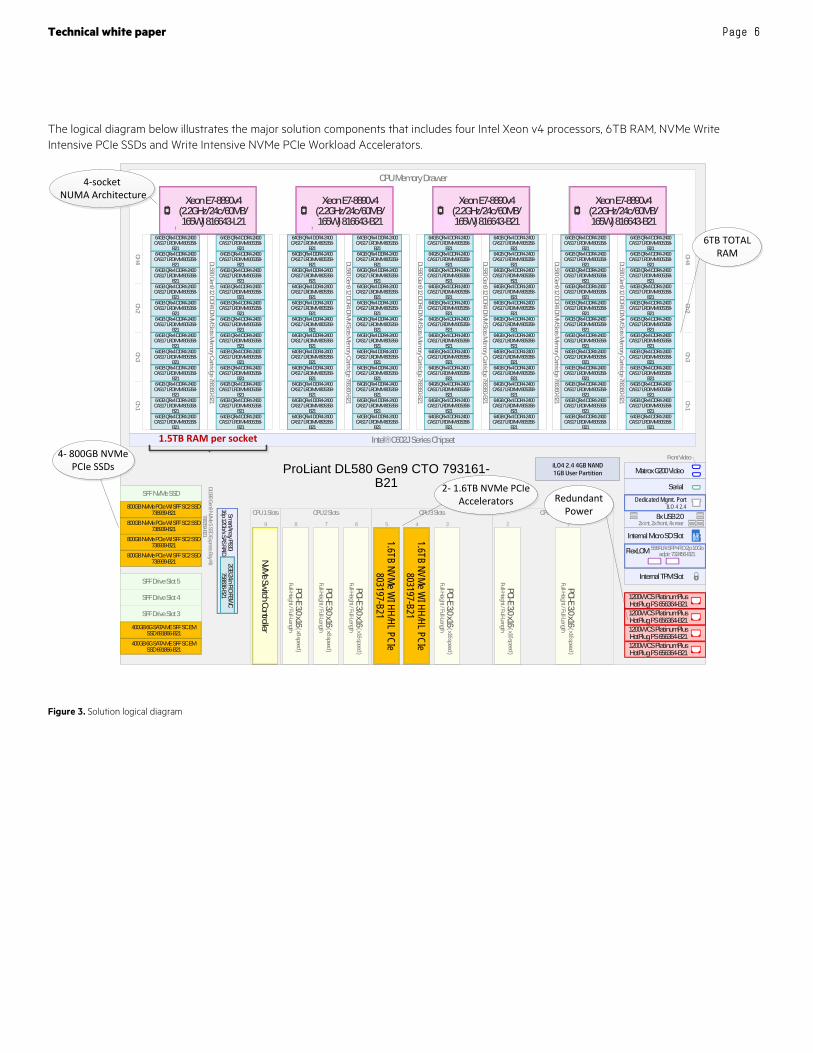
The logical diagram below illustrates the major solution components that includes four Intel Xeon v4 processors, 6TB RAM, NVMe Write Intensive PCIe SSDs and Write Intensive NVMe PCIe Workload Accelerators.
SmartArray P830i16p 12Gb/s SAS RAID
Optional Cache Slot
4GB FBWC
ProLiant DL580 Gen9 CTO 793161-B21
FlexLOM Slot
Internal TPM Slot
534FLR-SFP+2x 10Gbit FlexFabFlexLOM Slot 331FLR
4x Gbit LANFlexLOM Slot
SFF Drive Slot 1
SFF Drive Slot 2
SFF Drive Slot 3
SFF Drive Slot 4
SFF Drive Slot 5
Optional 2nd SFF Storage Cage
CPU 4 SlotsCPU 3 SlotsCPU 2 Slots6 5
Full -Height / Full -LengthPCI-E 3.0 x16
( x8 speed )
3
CPU 1 Slots9
Full-Height / Full-LengthPCI-E 3.0 x16
( x 16 speed )
8 7 4
Full-Height / Full-LengthPCI- E 3.0 x16
( x16 speed )
Full-Height / Full-LengthPCI-E 3.0 x16
( x8 speed )
Full-Height / Full-LengthPCI-E 3.0 x16
( x8 speed )
Full-Height / Full-LengthPCI-E 3.0 x16
( x8 speed )
Full-Height / Full-LengthPCI- E 3. 0 x16
( x16 speed )
1
Full- Height / Full -LengthPCI -E 3 .0 x16
( x16 speed )
2
Full-Height / Full-LengthPCI-E 3.0 x16
( x16 speed )
Front Video
Matrox G200 Video
Serial
Dedicated iLO 4 2.0
Internal Micro SD Slot
2x int, 2x front, 4x rear8x USB 2.0
Optional Power Supply Slot
Optional Power Supply Slot
Power Supply
Power Supply
1GB User PartitioniLO4 2.0 4GB NAND
Intel® C602J Series Chipset
CPU Slot 1 CPU Slot 2 CPU Slot 3 CPU Slot 4
Optional Memory Cartridge Slot 2
Ch 3Ch 1
CH 4Ch 2
Ch 3Ch 1
CH 4Ch 2
5E6J
4A2G
3L1C
8F7K
9 B11 H
10M12D
5E6J
4A2G
3L1C
8F7K
9B11H
10M12D
CPU Memory Drawer
Optional Memory Cartridge Slot 4
Optional Memory Cartridge Slot 5
Optional Memory Cartridge Slot 6
Optional Memory Cartridge Slot 7
Optional Memory Cartridge Slot 8
SFF NVMe SSD
SFF NVMe SSD
SFF NVMe SSD
SFF NVMe SSD
DL580 Gen9 NVMe 5 SSD Express Bay Kit 788359-B21
SFF NVMe SSD
1200W CS PlatinumPlus HotPlug PS 656364-B211200W CS PlatinumPlus HotPlug PS 656364-B211200W CS PlatinumPlus HotPlug PS 656364-B211200W CS PlatinumPlus HotPlug PS 656364-B21
800GB NVMe PCIe WI SFF SC2 SSD 736939-B21
800GB NVMe PCIe WI SFF SC2 SSD 736939-B21
800GB NVMe PCIe WI SFF SC2 SSD 736939-B21
800GB NVMe PCIe WI SFF SC2 SSD 736939-B21
400GB 6G SATA ME SFF SC EM SSD 691866-B21
400GB 6G SATA ME SFF SC EM SSD 691866-B21
1 .6TB NVMe WI HH/HL PCIe
803197-B21
1.6TB NVMe WI HH/HL PCIe
803197-B21
NVMe Switch Controller
5E6J
4A2G
3 L1C
8F7K
9 B11H
10M12D
DL580 Gen9 12 DDR4 DIMM Slots Memory Cartridge 788360-B21 5E6J
4A2 G
3L1C
8F7K
9B11H
10M12D
DL580 Gen9 12 DDR4 DIMM Slots Memory Cartridge 788360-B21 5E6J
4A2G
3L1C
8F7K
9B11H
10M12D
DL580 Gen9 12 DDR4 DIMM Slots Memory Cartridge 788360-B21 5E6 J
4A2G
3L1C
8F7K
9B11H
10M12D
DL580 Gen9 12 DDR4 DIMM Slots Memory Cartridge 788360-B 215E6J
4 A2G
3 L1C
8F7K
9B11H
10M12D
DL580 Gen9 12 DDR4 DIMM Slots Memory Cartridge 788360- B21 5E6J
4A2G
3L1C
8F7K
9B11H
10M12D
DL580 Gen9 12 DDR4 DIMM Slots Memory Cartridge 788360-B21
18Core
Xeon E7-8890v4 (2.2GHz/24c/60MB/165W) 816643-L21 18
Core
Xeon E7-8890v4 (2.2GHz/24c/60MB/165W) 816643-B21 18
Core
Xeon E7-8890v4 (2.2GHz/24c/60MB/165W) 816643-B21 18
Core
Xeon E7-8890v4 (2.2GHz/24c/60MB/165W) 816643-B21
64GB QRx4 DDR4-2400 CAS17 LRDIMM 805358-
B2164GB QRx4 DDR4-2400 CAS17 LRDIMM 805358-
B2164GB QRx4 DDR4-2400 CAS17 LRDIMM 805358-
B2164GB QRx4 DDR4-2400 CAS17 LRDIMM 805358-
B2164GB QRx4 DDR4-2400 CAS17 LRDIMM 805358-
B2164GB QRx4 DDR4-2400 CAS17 LRDIMM 805358-
B2164GB QRx4 DDR4-2400 CAS17 LRDIMM 805358-
B2164GB QRx4 DDR4-2400 CAS17 LRDIMM 805358-
B2164GB QRx4 DDR4-2400 CAS17 LRDIMM 805358-
B2164GB QRx4 DDR4-2400 CAS17 LRDIMM 805358-
B2164GB QRx4 DDR4-2400 CAS17 LRDIMM 805358-
B2164GB QRx4 DDR4-2400 CAS17 LRDIMM 805358-
B21
64GB QRx4 DDR4-2400 CAS17 LRDIMM 805358-
B2164GB QRx4 DDR4-2400 CAS17 LRDIMM 805358-
B2164GB QRx4 DDR4-2400 CAS17 LRDIMM 805358-
B2164GB QRx4 DDR4-2400 CAS17 LRDIMM 805358-
B2164GB QRx4 DDR4-2400 CAS17 LRDIMM 805358-
B2164GB QRx4 DDR4-2400 CAS17 LRDIMM 805358-
B2164GB QRx4 DDR4-2400 CAS17 LRDIMM 805358-
B2164GB QRx4 DDR4-2400 CAS17 LRDIMM 805358-
B2164GB QRx4 DDR4-2400 CAS17 LRDIMM 805358-
B2164GB QRx4 DDR4-2400 CAS17 LRDIMM 805358-
B2164GB QRx4 DDR4-2400 CAS17 LRDIMM 805358-
B21
64GB QRx4 DDR4-2400 CAS17 LRDIMM 805358-
B2164GB QRx4 DDR4-2400 CAS17 LRDIMM 805358-
B21
64GB QRx4 DDR4-2400 CAS17 LRDIMM 805358-
B21
64GB QRx4 DDR4-2400 CAS17 LRDIMM 805358-
B2164GB QRx4 DDR4-2400 CAS17 LRDIMM 805358-
B21
64GB QRx4 DDR4-2400 CAS17 LRDIMM 805358-
B2164GB QRx4 DDR4-2400 CAS17 LRDIMM 805358-
B2164GB QRx4 DDR4-2400 CAS17 LRDIMM 805358-
B2164GB QRx4 DDR4-2400 CAS17 LRDIMM 805358-
B21
64GB QRx4 DDR4-2400 CAS17 LRDIMM 805358-
B21
64GB QRx4 DDR4-2400 CAS17 LRDIMM 805358-
B21
64GB QRx4 DDR4-2400 CAS17 LRDIMM 805358-
B21
64GB QRx4 DDR4-2400 CAS17 LRDIMM 805358-
B21
64GB QRx4 DDR4-2400 CAS17 LRDIMM 805358-
B21
64GB QRx4 DDR4-2400 CAS17 LRDIMM 805358-
B2164GB QRx4 DDR4-2400 CAS17 LRDIMM 805358-
B2164GB QRx4 DDR4-2400 CAS17 LRDIMM 805358-
B21
64GB QRx4 DDR4-2400 CAS17 LRDIMM 805358-
B21
64GB QRx4 DDR4-2400 CAS17 LRDIMM 805358-
B21
64GB QRx4 DDR4-2400 CAS17 LRDIMM 805358-
B21
64GB QRx4 DDR4-2400 CAS17 LRDIMM 805358-
B21
64GB QRx4 DDR4-2400 CAS17 LRDIMM 805358-
B21
64GB QRx4 DDR4-2400 CAS17 LRDIMM 805358-
B21
64GB QRx4 DDR4-2400 CAS17 LRDIMM 805358-
B21
64GB QRx4 DDR4-2400 CAS17 LRDIMM 805358-
B21
64GB QRx4 DDR4-2400 CAS17 LRDIMM 805358-
B2164GB QRx4 DDR4-2400 CAS17 LRDIMM 805358-
B2164GB QRx4 DDR4-2400 CAS17 LRDIMM 805358-
B2164GB QRx4 DDR4-2400 CAS17 LRDIMM 805358-
B2164GB QRx4 DDR4-2400 CAS17 LRDIMM 805358-
B21
64GB QRx4 DDR4-2400 CAS17 LRDIMM 805358-
B21
64GB QRx4 DDR4-2400 CAS17 LRDIMM 805358-
B21
64GB QRx4 DDR4-2400 CAS17 LRDIMM 805358-
B21
64GB QRx4 DDR4-2400 CAS17 LRDIMM 805358-
B21
64GB QRx4 DDR4-2400 CAS17 LRDIMM 805358-
B21
64GB QRx4 DDR4-2400 CAS17 LRDIMM 805358-
B21
64GB QRx4 DDR4-2400 CAS17 LRDIMM 805358-
B21
64GB QRx4 DDR4-2400 CAS17 LRDIMM 805358-
B2164GB QRx4 DDR4-2400 CAS17 LRDIMM 805358-
B2164GB QRx4 DDR4-2400 CAS17 LRDIMM 805358-
B21
64GB QRx4 DDR4-2400 CAS17 LRDIMM 805358-
B2164GB QRx4 DDR4-2400 CAS17 LRDIMM 805358-
B2164GB QRx4 DDR4-2400 CAS17 LRDIMM 805358-
B2164GB QRx4 DDR4-2400 CAS17 LRDIMM 805358-
B2164GB QRx4 DDR4-2400 CAS17 LRDIMM 805358-
B2164GB QRx4 DDR4-2400 CAS17 LRDIMM 805358-
B2164GB QRx4 DDR4-2400 CAS17 LRDIMM 805358-
B2164GB QRx4 DDR4-2400 CAS17 LRDIMM 805358-
B2164GB QRx4 DDR4-2400 CAS17 LRDIMM 805358-
B21
64GB QRx4 DDR4-2400 CAS17 LRDIMM 805358-
B21
64GB QRx4 DDR4-2400 CAS17 LRDIMM 805358-
B2164GB QRx4 DDR4-2400 CAS17 LRDIMM 805358-
B2164GB QRx4 DDR4-2400 CAS17 LRDIMM 805358-
B2164GB QRx4 DDR4-2400 CAS17 LRDIMM 805358-
B21
64GB QRx4 DDR4-2400 CAS17 LRDIMM 805358-
B2164GB QRx4 DDR4-2400 CAS17 LRDIMM 805358-
B21
64GB QRx4 DDR4-2400 CAS17 LRDIMM 805358-
B2164GB QRx4 DDR4-2400 CAS17 LRDIMM 805358-
B2164GB QRx4 DDR4-2400 CAS17 LRDIMM 805358-
B2164GB QRx4 DDR4-2400 CAS17 LRDIMM 805358-
B21
64GB QRx4 DDR4-2400 CAS17 LRDIMM 805358-
B2164GB QRx4 DDR4-2400 CAS17 LRDIMM 805358-
B2164GB QRx4 DDR4-2400 CAS17 LRDIMM 805358-
B2164GB QRx4 DDR4-2400 CAS17 LRDIMM 805358-
B21
64GB QRx4 DDR4-2400 CAS17 LRDIMM 805358-
B21
64GB QRx4 DDR4-2400 CAS17 LRDIMM 805358-
B21
64GB QRx4 DDR4-2400 CAS17 LRDIMM 805358-
B21
64GB QRx4 DDR4-2400 CAS17 LRDIMM 805358-
B21
64GB QRx4 DDR4-2400 CAS17 LRDIMM 805358-
B21
64GB QRx4 DDR4-2400 CAS17 LRDIMM 805358-
B2164GB QRx4 DDR4-2400 CAS17 LRDIMM 805358-
B2164GB QRx4 DDR4-2400 CAS17 LRDIMM 805358-
B2164GB QRx4 DDR4-2400 CAS17 LRDIMM 805358-
B21
2GB 24in FIO FBWC
758836-B21
4- 800GB NVMe PCIe SSDs
2- 1.6TB NVMe PCIe Accelerators
4-socket NUMA Architecture
1.5TB RAM per socket
6TB TOTAL RAM
Redundant Power
556FLR-SFP+FIO 2p 10Gb adptr 732456-B21FlexLOM
ILO 4 2.4Dedicated Mgmt. Port
iLO4 2.4 4GB NAND1GB User Partition
Figure 3. Solution logical diagram
Technical white paper Page 7
Solution components Hardware HPE ProLiant DL580 Gen9 server configuration This HPE ProLiant DL580 Gen9 database server configuration is based on internal, direct-attached storage. We evaluated different storage options and used a hybrid internal storage configuration to demonstrate the performance characteristics of the different disk options and to establish an optimum hybrid configuration using different models working together. In addition, the testing evaluated two server processor family options for the HPE ProLiant Gen9 server. Both the Intel Xeon E7 v3 and v4 processor families were tested. This testing demonstrated the relative performance between the processor models and overall benefits of deploying newer processor architectures.
The HPE ProLiant DL580 Gen9 Broadwell-based server was configured with the following components:
• Four 24-core Intel Xeon E7-8890 v4 processors at 2.20GHz
• 6TB memory (96 x 64GB HPE DDR4 SmartMemory LRDIMMs)
• 2 x 400GB 6G SATA ME 2.5in SC EM SSD (OS)
• 2 HPE 1.6TB NVMe Write-Intensive PCIe Workload Accelerators in RAID1
• 4 x 800GB NVMe PCIe Write-intensive SFF SC2 SSD in RAID10
The HPE ProLiant DL580 Gen9 Haswell-based server was configured with the following components:
• Four 18-core Intel Xeon E7-8890 v3 processors at 2.50 GHz
• 6TB memory (96 x 64GB HPE DDR4 SmartMemory LRDIMMs)
• 2 x 400GB 6G SATA ME 2.5in SC EM SSD (OS)
• 2 HPE 1.6TB NVMe Write-Intensive PCIe Workload Accelerators in RAID1
• 4 x 800GB NVMe PCIe Write-intensive SFF SC2 SSD in RAID10
Software • Microsoft Windows Server 2016 RTM
• Microsoft SQL Server 2016 RTM/CU1
Application software The SQL Server version used for this testing was Microsoft SQL Server 2016 (RTM) – 13.0.1601.5 with Cumulative Update 1 - 13.00.2149.0. This version was installed on the DL580 Gen9 using Microsoft Windows Server 2016 RTM.
Best practices and configuration guidance for the solution HPE ProLiant DL580 Gen9 Initial setup for the DL580 Gen9 server consisted of various BIOS and SQL settings. The following BIOS settings were configured as derived from the HPE best practices on DL580 Gen9 servers white paper.
• Hyper-Threading – Enabled
• Intel Turbo Boost – Enabled
• HPE Power Profile – Maximum Performance
• NUMA Group Size Optimization – Clustered (default)
• QPI Snoop configuration – Cluster-on-Die
Technical white paper Page 8
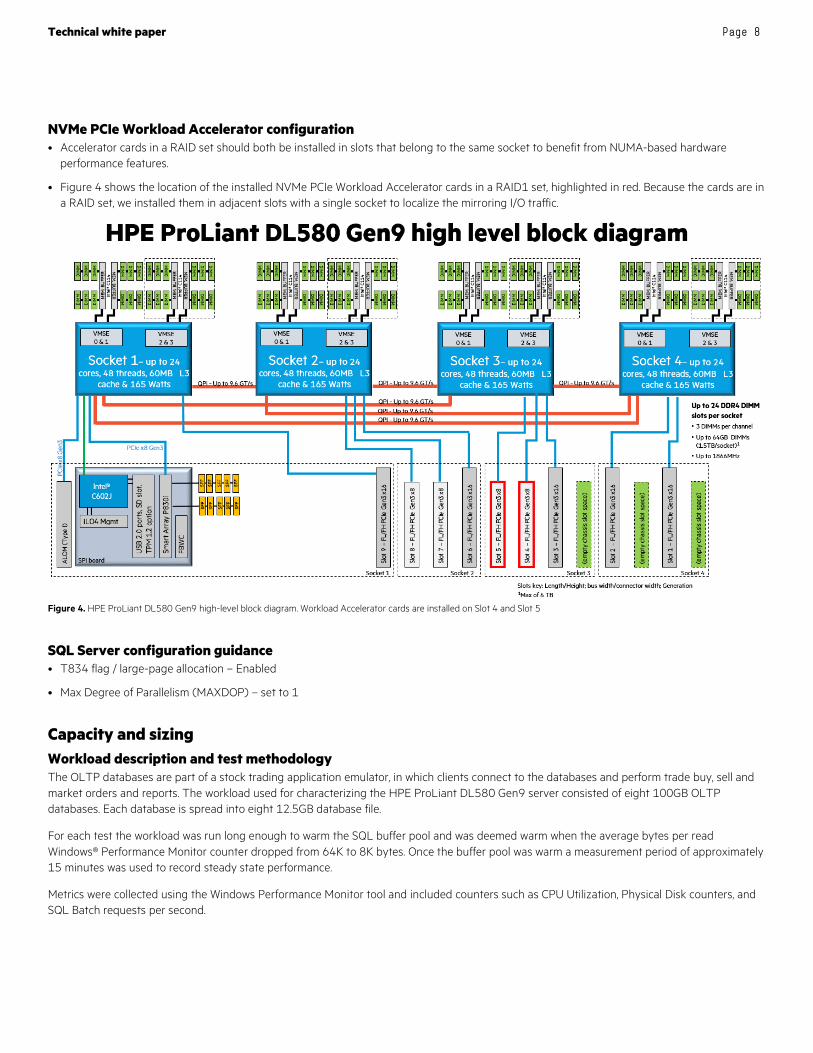
NVMe PCIe Workload Accelerator configuration • Accelerator cards in a RAID set should both be installed in slots that belong to the same socket to benefit from NUMA-based hardware
performance features.
• Figure 4 shows the location of the installed NVMe PCIe Workload Accelerator cards in a RAID1 set, highlighted in red. Because the cards are in a RAID set, we installed them in adjacent slots with a single socket to localize the mirroring I/O traffic.
Figure 4. HPE ProLiant DL580 Gen9 high-level block diagram. Workload Accelerator cards are installed on Slot 4 and Slot 5
SQL Server configuration guidance • T834 flag / large-page allocation – Enabled
• Max Degree of Parallelism (MAXDOP) – set to 1
Capacity and sizing Workload description and test methodology The OLTP databases are part of a stock trading application emulator, in which clients connect to the databases and perform trade buy, sell and market orders and reports. The workload used for characterizing the HPE ProLiant DL580 Gen9 server consisted of eight 100GB OLTP databases. Each database is spread into eight 12.5GB database file.
For each test the workload was run long enough to warm the SQL buffer pool and was deemed warm when the average bytes per read Windows® Performance Monitor counter dropped from 64K to 8K bytes. Once the buffer pool was warm a measurement period of approximately 15 minutes was used to record steady state performance.
Metrics were collected using the Windows Performance Monitor tool and included counters such as CPU Utilization, Physical Disk counters, and SQL Batch requests per second.
Technical white paper Page 9
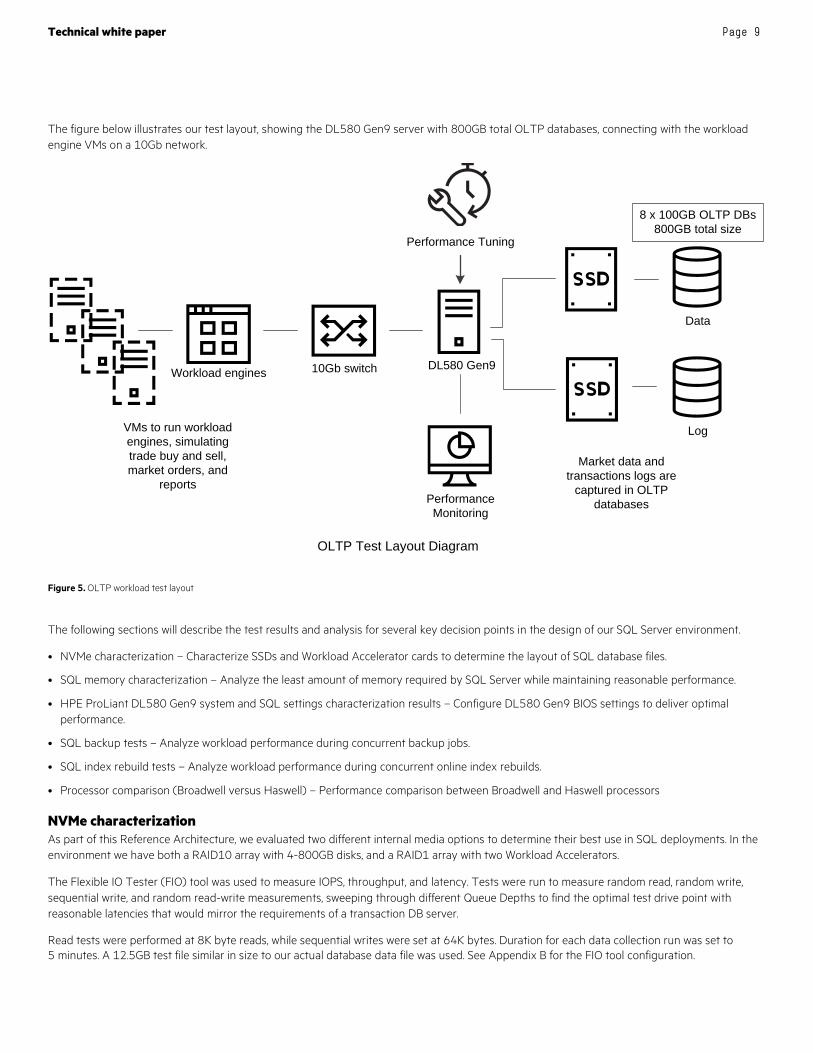
The figure below illustrates our test layout, showing the DL580 Gen9 server with 800GB total OLTP databases, connecting with the workload engine VMs on a 10Gb network.
Figure 5. OLTP workload test layout
The following sections will describe the test results and analysis for several key decision points in the design of our SQL Server environment.
• NVMe characterization – Characterize SSDs and Workload Accelerator cards to determine the layout of SQL database files.
• SQL memory characterization – Analyze the least amount of memory required by SQL Server while maintaining reasonable performance.
• HPE ProLiant DL580 Gen9 system and SQL settings characterization results – Configure DL580 Gen9 BIOS settings to deliver optimal performance.
• SQL backup tests – Analyze workload performance during concurrent backup jobs.
• SQL index rebuild tests – Analyze workload performance during concurrent online index rebuilds.
• Processor comparison (Broadwell versus Haswell) – Performance comparison between Broadwell and Haswell processors
NVMe characterization As part of this Reference Architecture, we evaluated two different internal media options to determine their best use in SQL deployments. In the environment we have both a RAID10 array with 4-800GB disks, and a RAID1 array with two Workload Accelerators.
The Flexible IO Tester (FIO) tool was used to measure IOPS, throughput, and latency. Tests were run to measure random read, random write, sequential write, and random read-write measurements, sweeping through different Queue Depths to find the optimal test drive point with reasonable latencies that would mirror the requirements of a transaction DB server.
Read tests were performed at 8K byte reads, while sequential writes were set at 64K bytes. Duration for each data collection run was set to 5 minutes. A 12.5GB test file similar in size to our actual database data file was used. See Appendix B for the FIO tool configuration.
10Gb switch
OLTP Test Layout Diagram
VMs to run workload engines, simulating trade buy and sell, market orders, and
reports
8 x 100GB OLTP DBs800GB total size
Performance Tuning
Performance Monitoring
Data
Log
DL580 Gen9Workload engines
Market data and transactions logs are
captured in OLTP databases
Technical white paper Page 10
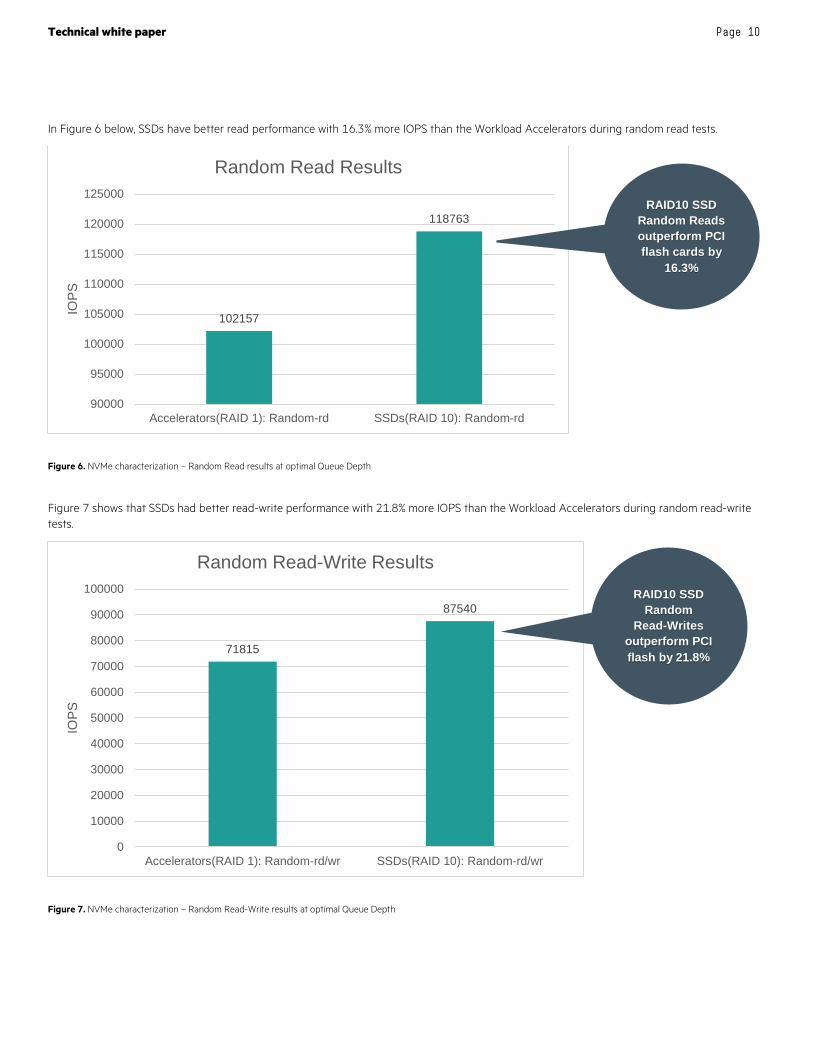
In Figure 6 below, SSDs have better read performance with 16.3% more IOPS than the Workload Accelerators during random read tests.
Figure 6. NVMe characterization – Random Read results at optimal Queue Depth
Figure 7 shows that SSDs had better read-write performance with 21.8% more IOPS than the Workload Accelerators during random read-write tests.
Figure 7. NVMe characterization – Random Read-Write results at optimal Queue Depth
102157
118763
90000
95000
100000
105000
110000
115000
120000
125000
Accelerators(RAID 1): Random-rd SSDs(RAID 10): Random-rd
IOPS
Random Read Results
71815
87540
0
10000
20000
30000
40000
50000
60000
70000
80000
90000
100000
Accelerators(RAID 1): Random-rd/wr SSDs(RAID 10): Random-rd/wr
IOPS
Random Read-Write Results
RAID10 SSD Random Reads outperform PCI flash cards by
16.3%
RAID10 SSD Random
Read-Writes outperform PCI flash by 21.8%
Technical white paper Page 11
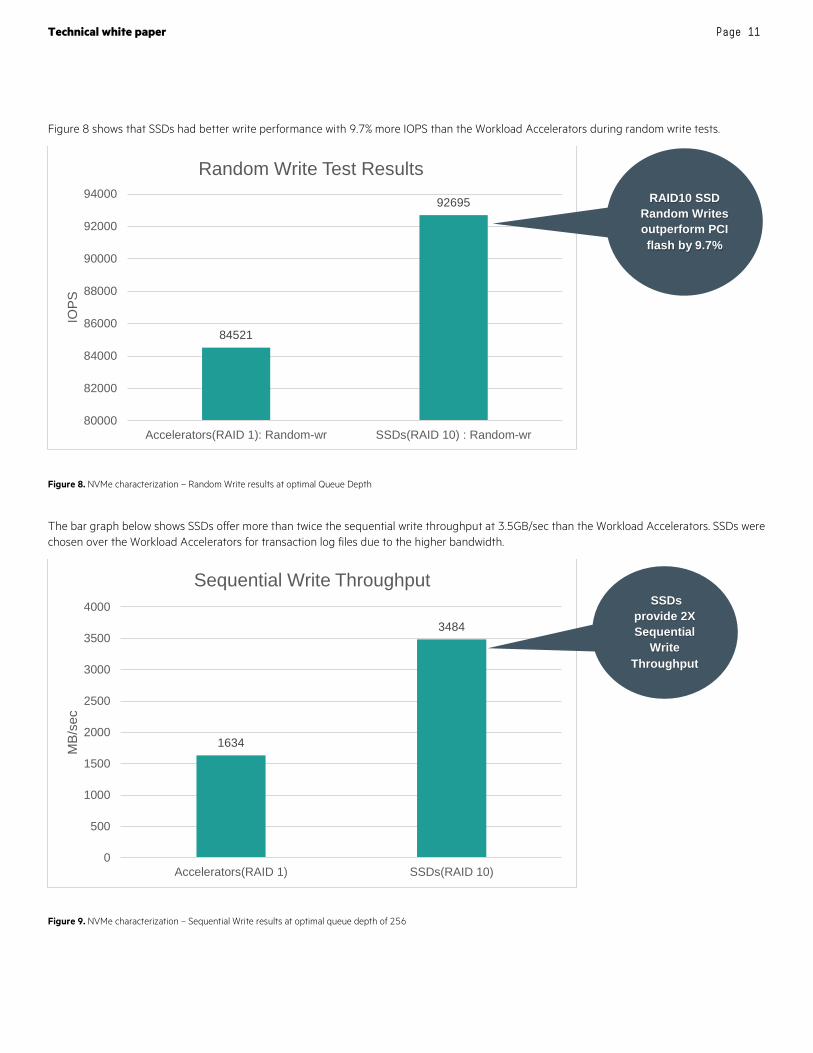
Figure 8 shows that SSDs had better write performance with 9.7% more IOPS than the Workload Accelerators during random write tests.
Figure 8. NVMe characterization – Random Write results at optimal Queue Depth
The bar graph below shows SSDs offer more than twice the sequential write throughput at 3.5GB/sec than the Workload Accelerators. SSDs were chosen over the Workload Accelerators for transaction log files due to the higher bandwidth.
Figure 9. NVMe characterization – Sequential Write results at optimal queue depth of 256
84521
92695
80000
82000
84000
86000
88000
90000
92000
94000
Accelerators(RAID 1): Random-wr SSDs(RAID 10) : Random-wr
IOPS
Random Write Test Results
1634
3484
0
500
1000
1500
2000
2500
3000
3500
4000
Accelerators(RAID 1) SSDs(RAID 10)
MB/
sec
Sequential Write Throughput SSDs
provide 2X Sequential
Write Throughput
RAID10 SSD Random Writes outperform PCI flash by 9.7%
Technical white paper Page 12
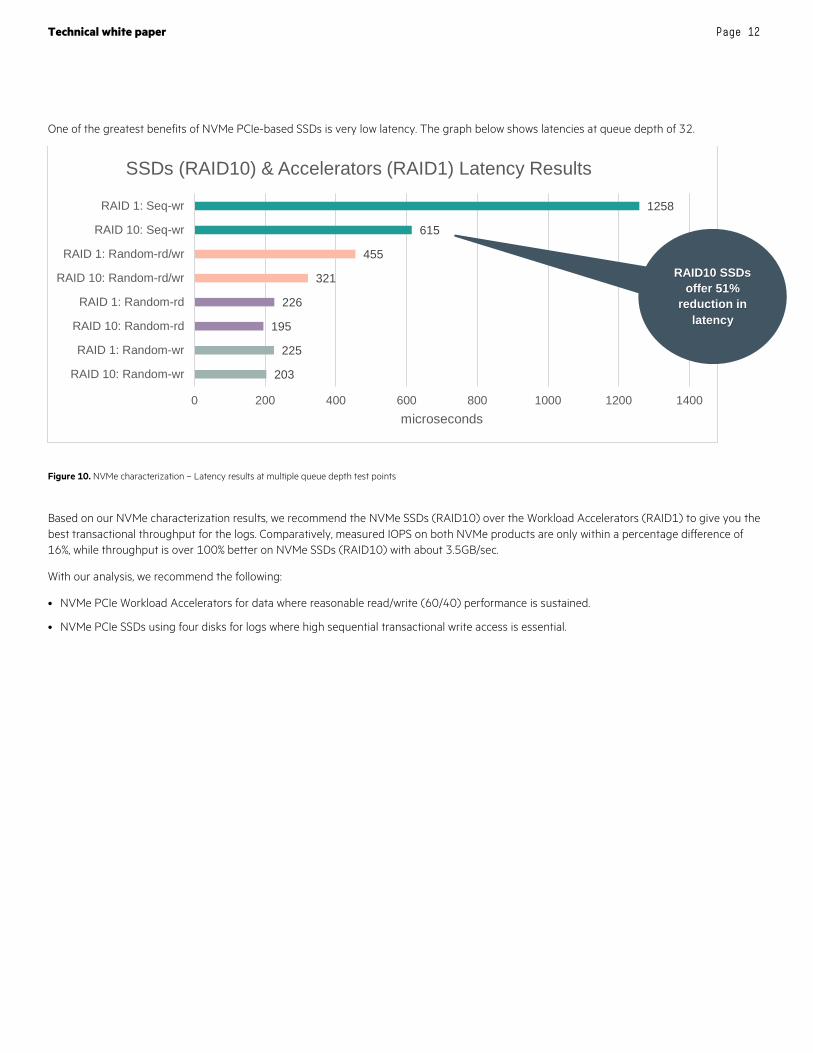
One of the greatest benefits of NVMe PCIe-based SSDs is very low latency. The graph below shows latencies at queue depth of 32.
Figure 10. NVMe characterization – Latency results at multiple queue depth test points
Based on our NVMe characterization results, we recommend the NVMe SSDs (RAID10) over the Workload Accelerators (RAID1) to give you the best transactional throughput for the logs. Comparatively, measured IOPS on both NVMe products are only within a percentage difference of 16%, while throughput is over 100% better on NVMe SSDs (RAID10) with about 3.5GB/sec.
With our analysis, we recommend the following:
• NVMe PCIe Workload Accelerators for data where reasonable read/write (60/40) performance is sustained.
• NVMe PCIe SSDs using four disks for logs where high sequential transactional write access is essential.
203
225
195
226
321
455
615
1258
0 200 400 600 800 1000 1200 1400
RAID 10: Random-wr
RAID 1: Random-wr
RAID 10: Random-rd
RAID 1: Random-rd
RAID 10: Random-rd/wr
RAID 1: Random-rd/wr
RAID 10: Seq-wr
RAID 1: Seq-wr
microseconds
SSDs (RAID10) & Accelerators (RAID1) Latency Results
RAID10 SSDs offer 51%
reduction in latency
Technical white paper Page 13
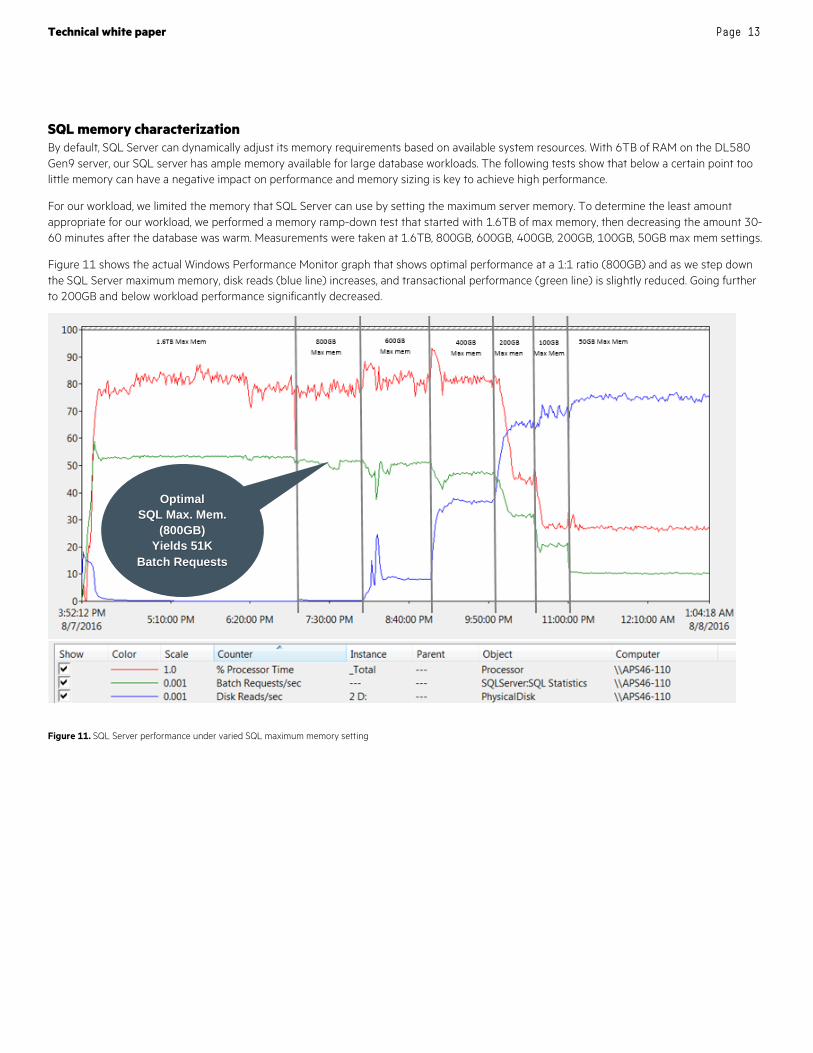
SQL memory characterization By default, SQL Server can dynamically adjust its memory requirements based on available system resources. With 6TB of RAM on the DL580 Gen9 server, our SQL server has ample memory available for large database workloads. The following tests show that below a certain point too little memory can have a negative impact on performance and memory sizing is key to achieve high performance.
For our workload, we limited the memory that SQL Server can use by setting the maximum server memory. To determine the least amount appropriate for our workload, we performed a memory ramp-down test that started with 1.6TB of max memory, then decreasing the amount 30-60 minutes after the database was warm. Measurements were taken at 1.6TB, 800GB, 600GB, 400GB, 200GB, 100GB, 50GB max mem settings.
Figure 11 shows the actual Windows Performance Monitor graph that shows optimal performance at a 1:1 ratio (800GB) and as we step down the SQL Server maximum memory, disk reads (blue line) increases, and transactional performance (green line) is slightly reduced. Going further to 200GB and below workload performance significantly decreased.
Figure 11. SQL Server performance under varied SQL maximum memory setting
Optimal SQL Max. Mem.
(800GB) Yields 51K
Batch Requests
Technical white paper Page 14
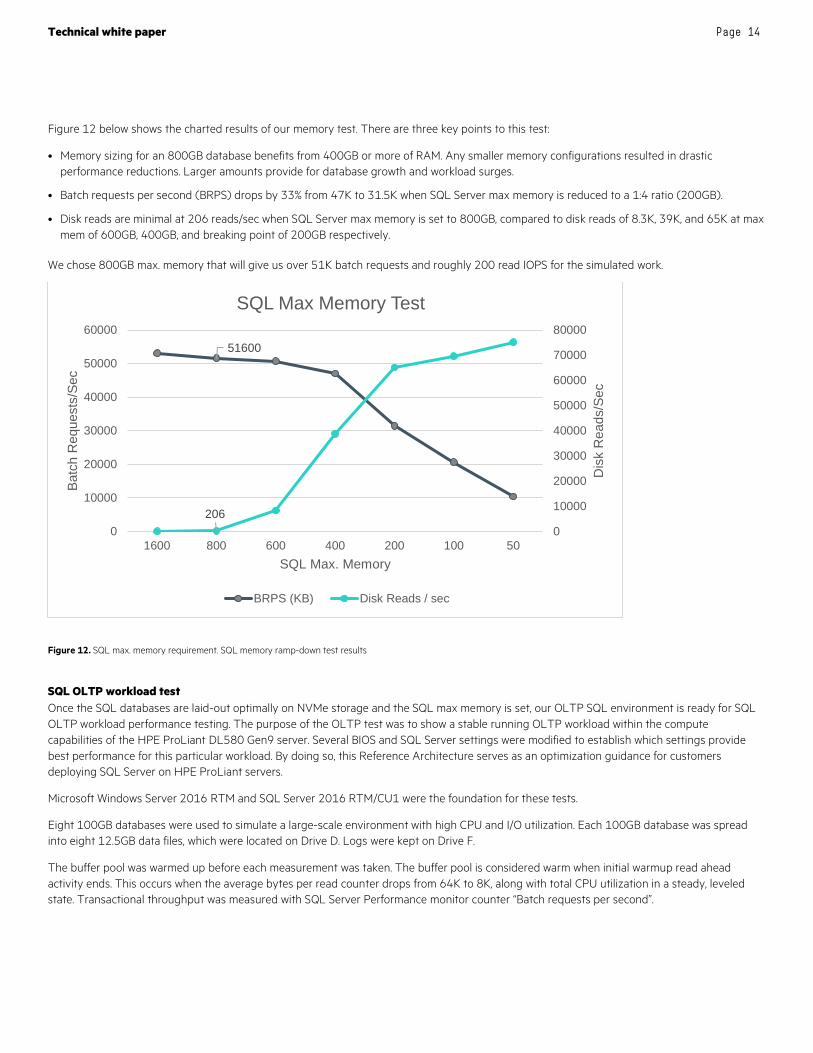
Figure 12 below shows the charted results of our memory test. There are three key points to this test:
• Memory sizing for an 800GB database benefits from 400GB or more of RAM. Any smaller memory configurations resulted in drastic performance reductions. Larger amounts provide for database growth and workload surges.
• Batch requests per second (BRPS) drops by 33% from 47K to 31.5K when SQL Server max memory is reduced to a 1:4 ratio (200GB).
• Disk reads are minimal at 206 reads/sec when SQL Server max memory is set to 800GB, compared to disk reads of 8.3K, 39K, and 65K at max mem of 600GB, 400GB, and breaking point of 200GB respectively.
We chose 800GB max. memory that will give us over 51K batch requests and roughly 200 read IOPS for the simulated work.
Figure 12. SQL max. memory requirement. SQL memory ramp-down test results
SQL OLTP workload test Once the SQL databases are laid-out optimally on NVMe storage and the SQL max memory is set, our OLTP SQL environment is ready for SQL OLTP workload performance testing. The purpose of the OLTP test was to show a stable running OLTP workload within the compute capabilities of the HPE ProLiant DL580 Gen9 server. Several BIOS and SQL Server settings were modified to establish which settings provide best performance for this particular workload. By doing so, this Reference Architecture serves as an optimization guidance for customers deploying SQL Server on HPE ProLiant servers.
Microsoft Windows Server 2016 RTM and SQL Server 2016 RTM/CU1 were the foundation for these tests.
Eight 100GB databases were used to simulate a large-scale environment with high CPU and I/O utilization. Each 100GB database was spread into eight 12.5GB data files, which were located on Drive D. Logs were kept on Drive F.
The buffer pool was warmed up before each measurement was taken. The buffer pool is considered warm when initial warmup read ahead activity ends. This occurs when the average bytes per read counter drops from 64K to 8K, along with total CPU utilization in a steady, leveled state. Transactional throughput was measured with SQL Server Performance monitor counter “Batch requests per second”.
51600
2060
10000
20000
30000
40000
50000
60000
70000
80000
0
10000
20000
30000
40000
50000
60000
1600 800 600 400 200 100 50
Dis
k R
eads
/Sec
Batc
h R
eque
sts/
Sec
SQL Max. Memory
SQL Max Memory Test
BRPS (KB) Disk Reads / sec
Technical white paper Page 15
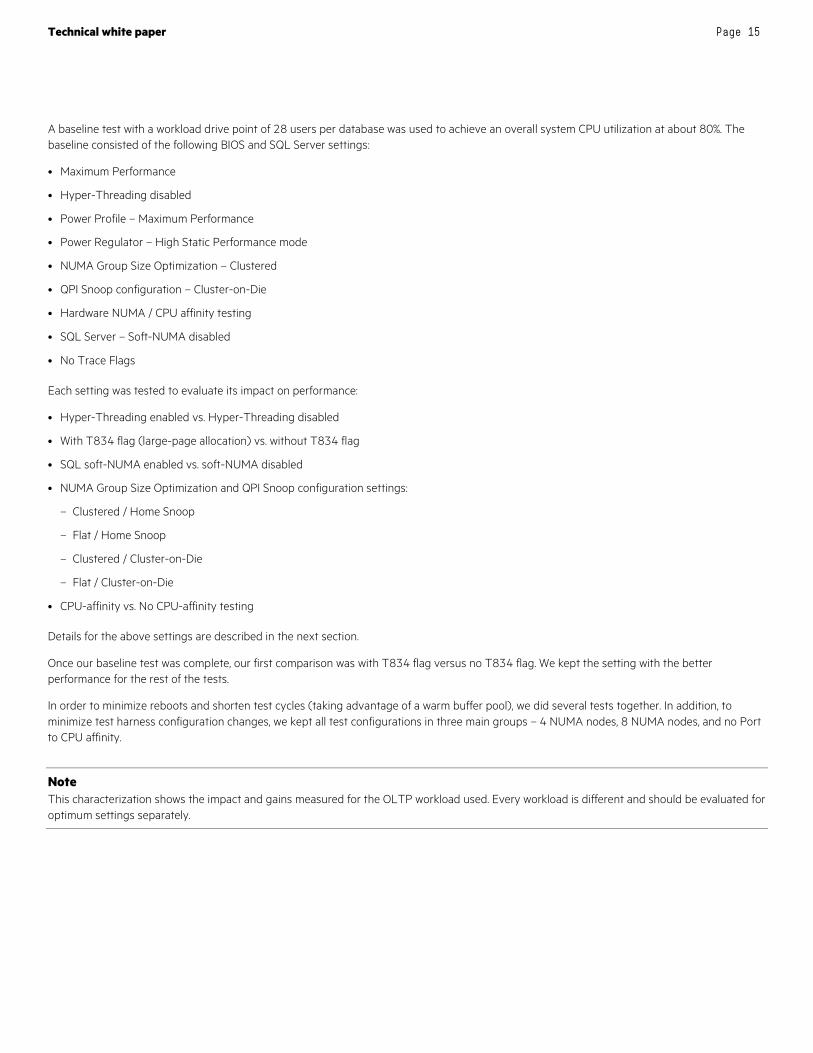
A baseline test with a workload drive point of 28 users per database was used to achieve an overall system CPU utilization at about 80%. The baseline consisted of the following BIOS and SQL Server settings:
• Maximum Performance
• Hyper-Threading disabled
• Power Profile – Maximum Performance
• Power Regulator – High Static Performance mode
• NUMA Group Size Optimization – Clustered
• QPI Snoop configuration – Cluster-on-Die
• Hardware NUMA / CPU affinity testing
• SQL Server – Soft-NUMA disabled
• No Trace Flags
Each setting was tested to evaluate its impact on performance:
• Hyper-Threading enabled vs. Hyper-Threading disabled
• With T834 flag (large-page allocation) vs. without T834 flag
• SQL soft-NUMA enabled vs. soft-NUMA disabled
• NUMA Group Size Optimization and QPI Snoop configuration settings:
– Clustered / Home Snoop
– Flat / Home Snoop
– Clustered / Cluster-on-Die
– Flat / Cluster-on-Die
• CPU-affinity vs. No CPU-affinity testing
Details for the above settings are described in the next section.
Once our baseline test was complete, our first comparison was with T834 flag versus no T834 flag. We kept the setting with the better performance for the rest of the tests.
In order to minimize reboots and shorten test cycles (taking advantage of a warm buffer pool), we did several tests together. In addition, to minimize test harness configuration changes, we kept all test configurations in three main groups – 4 NUMA nodes, 8 NUMA nodes, and no Port to CPU affinity.
Note This characterization shows the impact and gains measured for the OLTP workload used. Every workload is different and should be evaluated for optimum settings separately.
Technical white paper Page 16
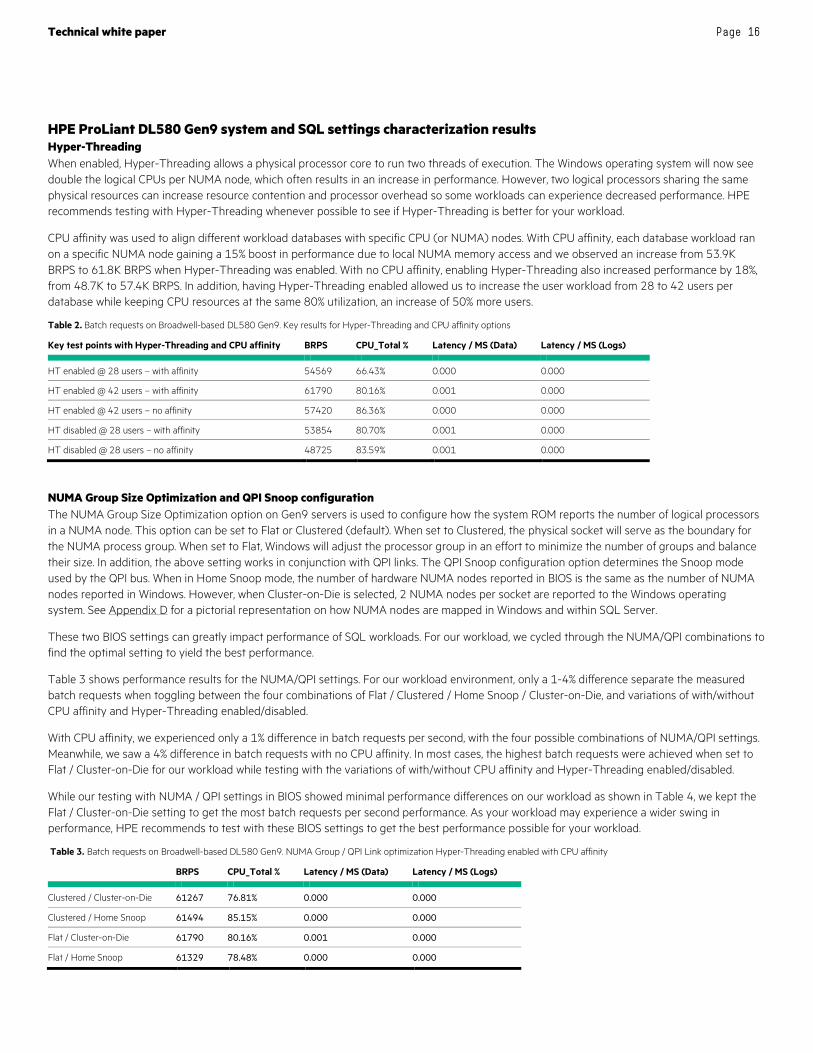
HPE ProLiant DL580 Gen9 system and SQL settings characterization results Hyper-Threading When enabled, Hyper-Threading allows a physical processor core to run two threads of execution. The Windows operating system will now see double the logical CPUs per NUMA node, which often results in an increase in performance. However, two logical processors sharing the same physical resources can increase resource contention and processor overhead so some workloads can experience decreased performance. HPE recommends testing with Hyper-Threading whenever possible to see if Hyper-Threading is better for your workload.
CPU affinity was used to align different workload databases with specific CPU (or NUMA) nodes. With CPU affinity, each database workload ran on a specific NUMA node gaining a 15% boost in performance due to local NUMA memory access and we observed an increase from 53.9K BRPS to 61.8K BRPS when Hyper-Threading was enabled. With no CPU affinity, enabling Hyper-Threading also increased performance by 18%, from 48.7K to 57.4K BRPS. In addition, having Hyper-Threading enabled allowed us to increase the user workload from 28 to 42 users per database while keeping CPU resources at the same 80% utilization, an increase of 50% more users.
Table 2. Batch requests on Broadwell-based DL580 Gen9. Key results for Hyper-Threading and CPU affinity options
Key test points with Hyper-Threading and CPU affinity BRPS CPU_Total % Latency / MS (Data) Latency / MS (Logs)
HT enabled @ 28 users – with affinity 54569 66.43% 0.000 0.000
HT enabled @ 42 users – with affinity 61790 80.16% 0.001 0.000
HT enabled @ 42 users – no affinity 57420 86.36% 0.000 0.000
HT disabled @ 28 users – with affinity 53854 80.70% 0.001 0.000
HT disabled @ 28 users – no affinity 48725 83.59% 0.001 0.000
NUMA Group Size Optimization and QPI Snoop configuration The NUMA Group Size Optimization option on Gen9 servers is used to configure how the system ROM reports the number of logical processors in a NUMA node. This option can be set to Flat or Clustered (default). When set to Clustered, the physical socket will serve as the boundary for the NUMA process group. When set to Flat, Windows will adjust the processor group in an effort to minimize the number of groups and balance their size. In addition, the above setting works in conjunction with QPI links. The QPI Snoop configuration option determines the Snoop mode used by the QPI bus. When in Home Snoop mode, the number of hardware NUMA nodes reported in BIOS is the same as the number of NUMA nodes reported in Windows. However, when Cluster-on-Die is selected, 2 NUMA nodes per socket are reported to the Windows operating system. See Appendix D for a pictorial representation on how NUMA nodes are mapped in Windows and within SQL Server.
These two BIOS settings can greatly impact performance of SQL workloads. For our workload, we cycled through the NUMA/QPI combinations to find the optimal setting to yield the best performance.
Table 3 shows performance results for the NUMA/QPI settings. For our workload environment, only a 1-4% difference separate the measured batch requests when toggling between the four combinations of Flat / Clustered / Home Snoop / Cluster-on-Die, and variations of with/without CPU affinity and Hyper-Threading enabled/disabled.
With CPU affinity, we experienced only a 1% difference in batch requests per second, with the four possible combinations of NUMA/QPI settings. Meanwhile, we saw a 4% difference in batch requests with no CPU affinity. In most cases, the highest batch requests were achieved when set to Flat / Cluster-on-Die for our workload while testing with the variations of with/without CPU affinity and Hyper-Threading enabled/disabled.
While our testing with NUMA / QPI settings in BIOS showed minimal performance differences on our workload as shown in Table 4, we kept the Flat / Cluster-on-Die setting to get the most batch requests per second performance. As your workload may experience a wider swing in performance, HPE recommends to test with these BIOS settings to get the best performance possible for your workload.
Table 3. Batch requests on Broadwell-based DL580 Gen9. NUMA Group / QPI Link optimization Hyper-Threading enabled with CPU affinity
BRPS CPU_Total % Latency / MS (Data) Latency / MS (Logs)
Clustered / Cluster-on-Die 61267 76.81% 0.000 0.000
Clustered / Home Snoop 61494 85.15% 0.000 0.000
Flat / Cluster-on-Die 61790 80.16% 0.001 0.000
Flat / Home Snoop 61329 78.48% 0.000 0.000
Technical white paper Page 17
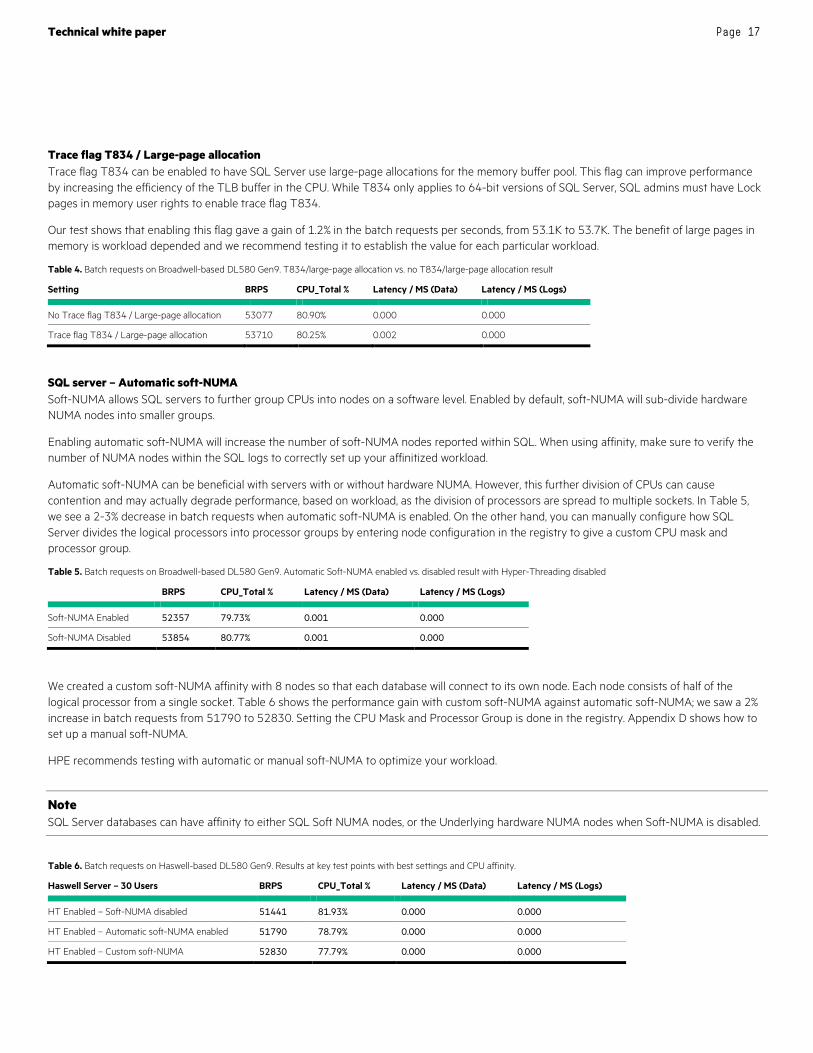
Trace flag T834 / Large-page allocation Trace flag T834 can be enabled to have SQL Server use large-page allocations for the memory buffer pool. This flag can improve performance by increasing the efficiency of the TLB buffer in the CPU. While T834 only applies to 64-bit versions of SQL Server, SQL admins must have Lock pages in memory user rights to enable trace flag T834.
Our test shows that enabling this flag gave a gain of 1.2% in the batch requests per seconds, from 53.1K to 53.7K. The benefit of large pages in memory is workload depended and we recommend testing it to establish the value for each particular workload.
Table 4. Batch requests on Broadwell-based DL580 Gen9. T834/large-page allocation vs. no T834/large-page allocation result
Setting BRPS CPU_Total % Latency / MS (Data) Latency / MS (Logs)
No Trace flag T834 / Large-page allocation 53077 80.90% 0.000 0.000
Trace flag T834 / Large-page allocation 53710 80.25% 0.002 0.000
SQL server – Automatic soft-NUMA Soft-NUMA allows SQL servers to further group CPUs into nodes on a software level. Enabled by default, soft-NUMA will sub-divide hardware NUMA nodes into smaller groups.
Enabling automatic soft-NUMA will increase the number of soft-NUMA nodes reported within SQL. When using affinity, make sure to verify the number of NUMA nodes within the SQL logs to correctly set up your affinitized workload.
Automatic soft-NUMA can be beneficial with servers with or without hardware NUMA. However, this further division of CPUs can cause contention and may actually degrade performance, based on workload, as the division of processors are spread to multiple sockets. In Table 5, we see a 2-3% decrease in batch requests when automatic soft-NUMA is enabled. On the other hand, you can manually configure how SQL Server divides the logical processors into processor groups by entering node configuration in the registry to give a custom CPU mask and processor group.
Table 5. Batch requests on Broadwell-based DL580 Gen9. Automatic Soft-NUMA enabled vs. disabled result with Hyper-Threading disabled
BRPS CPU_Total % Latency / MS (Data) Latency / MS (Logs)
Soft-NUMA Enabled 52357 79.73% 0.001 0.000
Soft-NUMA Disabled 53854 80.77% 0.001 0.000
We created a custom soft-NUMA affinity with 8 nodes so that each database will connect to its own node. Each node consists of half of the logical processor from a single socket. Table 6 shows the performance gain with custom soft-NUMA against automatic soft-NUMA; we saw a 2% increase in batch requests from 51790 to 52830. Setting the CPU Mask and Processor Group is done in the registry. Appendix D shows how to set up a manual soft-NUMA.
HPE recommends testing with automatic or manual soft-NUMA to optimize your workload.
Note SQL Server databases can have affinity to either SQL Soft NUMA nodes, or the Underlying hardware NUMA nodes when Soft-NUMA is disabled.
Table 6. Batch requests on Haswell-based DL580 Gen9. Results at key test points with best settings and CPU affinity.
Haswell Server – 30 Users BRPS CPU_Total % Latency / MS (Data) Latency / MS (Logs)
HT Enabled – Soft-NUMA disabled 51441 81.93% 0.000 0.000
HT Enabled – Automatic soft-NUMA enabled 51790 78.79% 0.000 0.000
HT Enabled – Custom soft-NUMA 52830 77.79% 0.000 0.000
Technical white paper Page 18
Hardware NUMA / CPU affinity SQL Server is a NUMA-aware application that requires no special configuration to take advantage of NUMA-based hardware. On NUMA hardware, processors are grouped together along with their own memory and I/O channels. Each group is called a NUMA node. A NUMA node can access its local memory, and can also access memory from other NUMA nodes. However, access to local memory is faster than using the remote memory from other NUMA nodes. Thus, the name Non-Uniform Memory Access architecture.
With an affinity over non-affinity workload, we experienced a gain of 8%-11% in batch requests, depending on the Hyper-Threading setting. With Hyper-Threading enabled, we measured an 8% improvement; and, with Hyper-Threading disabled, we measured an 11% improvement, based on the data in Table 2.
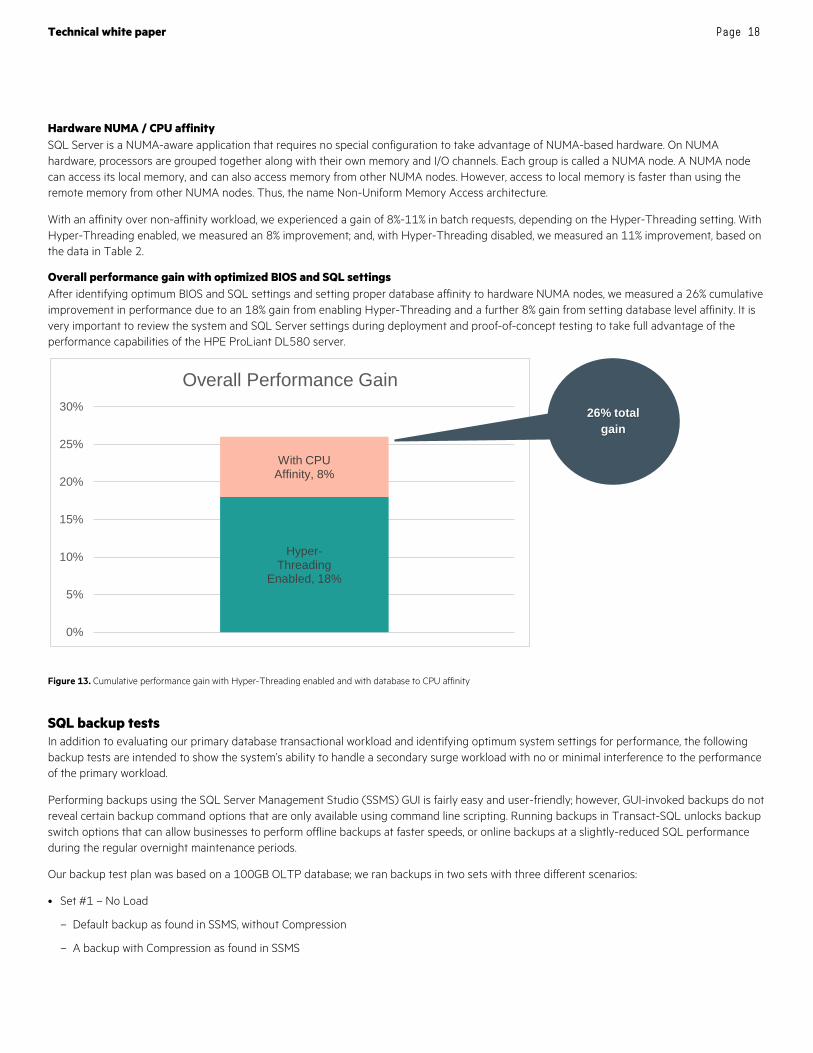
Overall performance gain with optimized BIOS and SQL settings After identifying optimum BIOS and SQL settings and setting proper database affinity to hardware NUMA nodes, we measured a 26% cumulative improvement in performance due to an 18% gain from enabling Hyper-Threading and a further 8% gain from setting database level affinity. It is very important to review the system and SQL Server settings during deployment and proof-of-concept testing to take full advantage of the performance capabilities of the HPE ProLiant DL580 server.
Figure 13. Cumulative performance gain with Hyper-Threading enabled and with database to CPU affinity
SQL backup tests In addition to evaluating our primary database transactional workload and identifying optimum system settings for performance, the following backup tests are intended to show the system’s ability to handle a secondary surge workload with no or minimal interference to the performance of the primary workload.
Performing backups using the SQL Server Management Studio (SSMS) GUI is fairly easy and user-friendly; however, GUI-invoked backups do not reveal certain backup command options that are only available using command line scripting. Running backups in Transact-SQL unlocks backup switch options that can allow businesses to perform offline backups at faster speeds, or online backups at a slightly-reduced SQL performance during the regular overnight maintenance periods.
Our backup test plan was based on a 100GB OLTP database; we ran backups in two sets with three different scenarios:
• Set #1 – No Load
– Default backup as found in SSMS, without Compression
– A backup with Compression as found in SSMS
Hyper-Threading
Enabled, 18%
With CPU Affinity, 8%
0%
5%
10%
15%
20%
25%
30%
Overall Performance Gain26% total
gain
Technical white paper Page 19
– A compressed backup with switch options:
blocksize=65536
maxtransfersize=4194304
buffercount=300
• Set #2 – With OLTP workload running
– Default backup as found in SSMS, without Compression
– A backup with Compression as found in SSMS
– A compressed backup with switch options:
blocksize=65536
maxtransfersize=4194304
buffercount=300
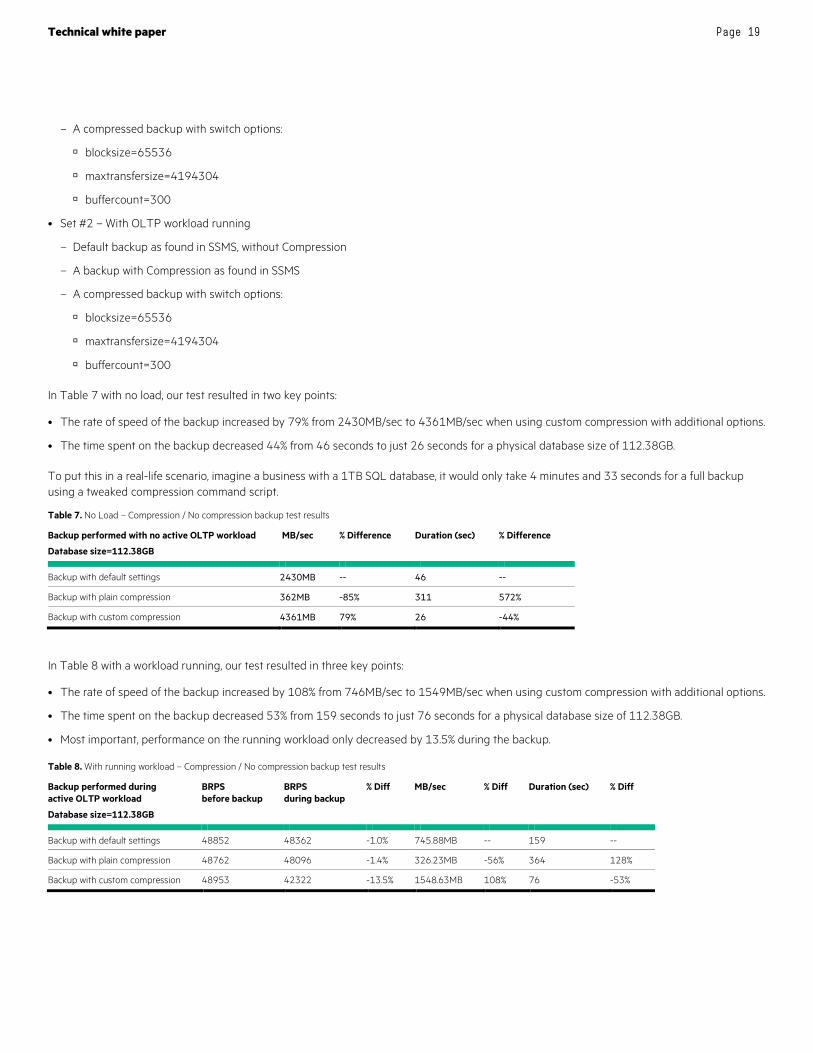
In Table 7 with no load, our test resulted in two key points:
• The rate of speed of the backup increased by 79% from 2430MB/sec to 4361MB/sec when using custom compression with additional options.
• The time spent on the backup decreased 44% from 46 seconds to just 26 seconds for a physical database size of 112.38GB.
To put this in a real-life scenario, imagine a business with a 1TB SQL database, it would only take 4 minutes and 33 seconds for a full backup using a tweaked compression command script.
Table 7. No Load – Compression / No compression backup test results
Backup performed with no active OLTP workload
Database size=112.38GB
MB/sec % Difference Duration (sec) % Difference
Backup with default settings 2430MB -- 46 --
Backup with plain compression 362MB -85% 311 572%
Backup with custom compression 4361MB 79% 26 -44%
In Table 8 with a workload running, our test resulted in three key points:
• The rate of speed of the backup increased by 108% from 746MB/sec to 1549MB/sec when using custom compression with additional options.
• The time spent on the backup decreased 53% from 159 seconds to just 76 seconds for a physical database size of 112.38GB.
• Most important, performance on the running workload only decreased by 13.5% during the backup.
Table 8. With running workload – Compression / No compression backup test results
Backup performed during active OLTP workload
Database size=112.38GB
BRPS before backup
BRPS during backup
% Diff MB/sec % Diff Duration (sec) % Diff
Backup with default settings 48852 48362 -1.0% 745.88MB -- 159 --
Backup with plain compression 48762 48096 -1.4% 326.23MB -56% 364 128%
Backup with custom compression 48953 42322 -13.5% 1548.63MB 108% 76 -53%
Technical white paper Page 20
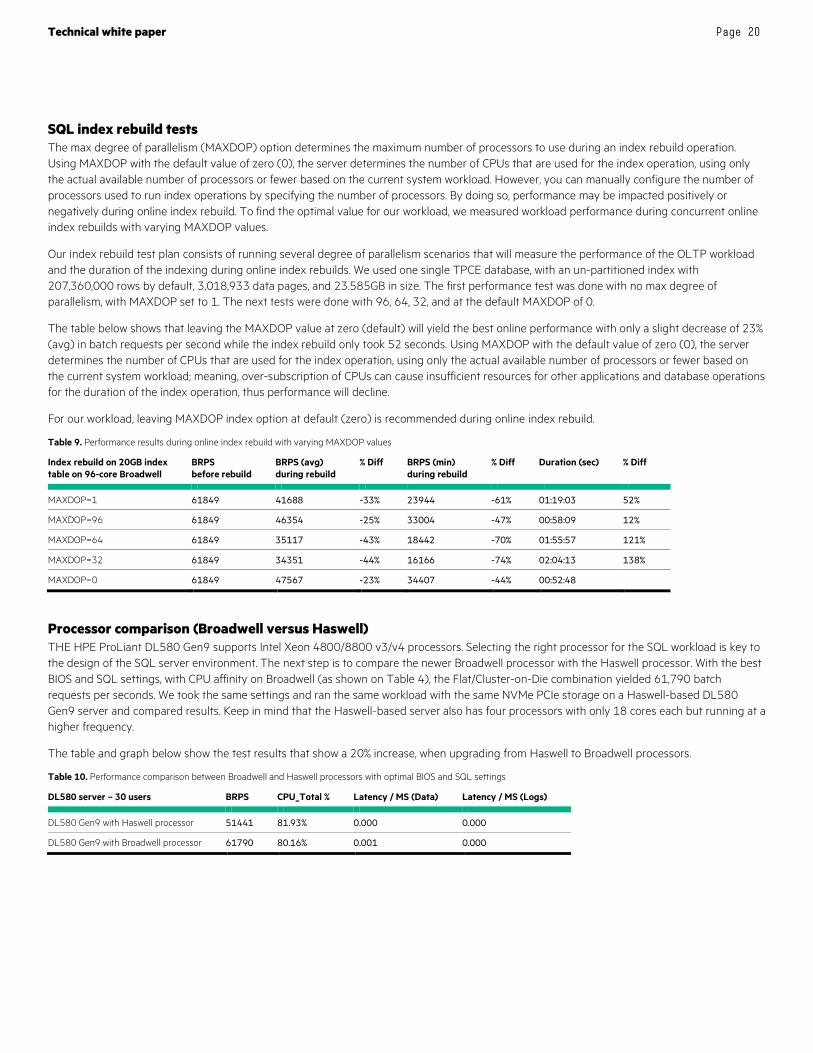
SQL index rebuild tests The max degree of parallelism (MAXDOP) option determines the maximum number of processors to use during an index rebuild operation. Using MAXDOP with the default value of zero (0), the server determines the number of CPUs that are used for the index operation, using only the actual available number of processors or fewer based on the current system workload. However, you can manually configure the number of processors used to run index operations by specifying the number of processors. By doing so, performance may be impacted positively or negatively during online index rebuild. To find the optimal value for our workload, we measured workload performance during concurrent online index rebuilds with varying MAXDOP values.
Our index rebuild test plan consists of running several degree of parallelism scenarios that will measure the performance of the OLTP workload and the duration of the indexing during online index rebuilds. We used one single TPCE database, with an un-partitioned index with 207,360,000 rows by default, 3,018,933 data pages, and 23.585GB in size. The first performance test was done with no max degree of parallelism, with MAXDOP set to 1. The next tests were done with 96, 64, 32, and at the default MAXDOP of 0.
The table below shows that leaving the MAXDOP value at zero (default) will yield the best online performance with only a slight decrease of 23% (avg) in batch requests per second while the index rebuild only took 52 seconds. Using MAXDOP with the default value of zero (0), the server determines the number of CPUs that are used for the index operation, using only the actual available number of processors or fewer based on the current system workload; meaning, over-subscription of CPUs can cause insufficient resources for other applications and database operations for the duration of the index operation, thus performance will decline.
For our workload, leaving MAXDOP index option at default (zero) is recommended during online index rebuild.
Table 9. Performance results during online index rebuild with varying MAXDOP values
Index rebuild on 20GB index table on 96-core Broadwell
BRPS before rebuild
BRPS (avg) during rebuild
% Diff BRPS (min) during rebuild
% Diff Duration (sec) % Diff
MAXDOP=1 61849 41688 -33% 23944 -61% 01:19:03 52%
MAXDOP=96 61849 46354 -25% 33004 -47% 00:58:09 12%
MAXDOP=64 61849 35117 -43% 18442 -70% 01:55:57 121%
MAXDOP=32 61849 34351 -44% 16166 -74% 02:04:13 138%
MAXDOP=0 61849 47567 -23% 34407 -44% 00:52:48
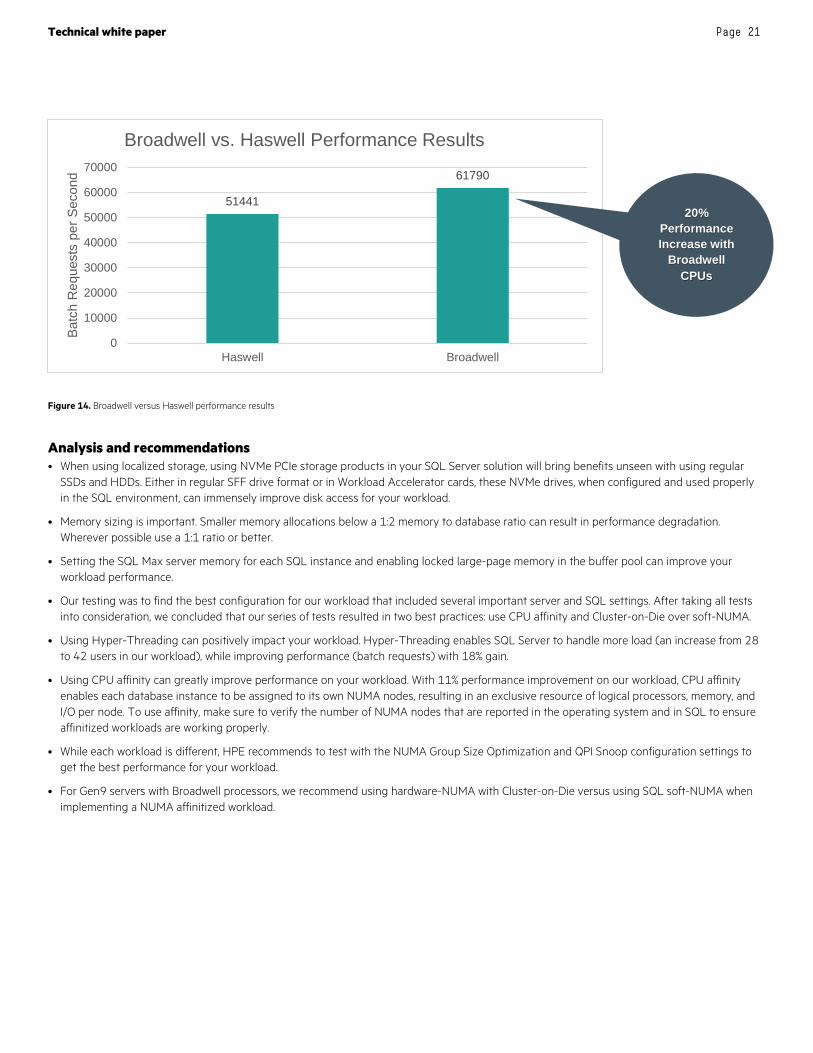
Processor comparison (Broadwell versus Haswell) THE HPE ProLiant DL580 Gen9 supports Intel Xeon 4800/8800 v3/v4 processors. Selecting the right processor for the SQL workload is key to the design of the SQL server environment. The next step is to compare the newer Broadwell processor with the Haswell processor. With the best BIOS and SQL settings, with CPU affinity on Broadwell (as shown on Table 4), the Flat/Cluster-on-Die combination yielded 61,790 batch requests per seconds. We took the same settings and ran the same workload with the same NVMe PCIe storage on a Haswell-based DL580 Gen9 server and compared results. Keep in mind that the Haswell-based server also has four processors with only 18 cores each but running at a higher frequency.
The table and graph below show the test results that show a 20% increase, when upgrading from Haswell to Broadwell processors.
Table 10. Performance comparison between Broadwell and Haswell processors with optimal BIOS and SQL settings
DL580 server – 30 users BRPS CPU_Total % Latency / MS (Data) Latency / MS (Logs)
DL580 Gen9 with Haswell processor 51441 81.93% 0.000 0.000
DL580 Gen9 with Broadwell processor 61790 80.16% 0.001 0.000
Technical white paper Page 21
Figure 14. Broadwell versus Haswell performance results
Analysis and recommendations • When using localized storage, using NVMe PCIe storage products in your SQL Server solution will bring benefits unseen with using regular
SSDs and HDDs. Either in regular SFF drive format or in Workload Accelerator cards, these NVMe drives, when configured and used properly in the SQL environment, can immensely improve disk access for your workload.
• Memory sizing is important. Smaller memory allocations below a 1:2 memory to database ratio can result in performance degradation. Wherever possible use a 1:1 ratio or better.
• Setting the SQL Max server memory for each SQL instance and enabling locked large-page memory in the buffer pool can improve your workload performance.
• Our testing was to find the best configuration for our workload that included several important server and SQL settings. After taking all tests into consideration, we concluded that our series of tests resulted in two best practices: use CPU affinity and Cluster-on-Die over soft-NUMA.
• Using Hyper-Threading can positively impact your workload. Hyper-Threading enables SQL Server to handle more load (an increase from 28 to 42 users in our workload), while improving performance (batch requests) with 18% gain.
• Using CPU affinity can greatly improve performance on your workload. With 11% performance improvement on our workload, CPU affinity enables each database instance to be assigned to its own NUMA nodes, resulting in an exclusive resource of logical processors, memory, and I/O per node. To use affinity, make sure to verify the number of NUMA nodes that are reported in the operating system and in SQL to ensure affinitized workloads are working properly.
• While each workload is different, HPE recommends to test with the NUMA Group Size Optimization and QPI Snoop configuration settings to get the best performance for your workload.
• For Gen9 servers with Broadwell processors, we recommend using hardware-NUMA with Cluster-on-Die versus using SQL soft-NUMA when implementing a NUMA affinitized workload.
51441
61790
0
10000
20000
30000
40000
50000
60000
70000
Haswell Broadwell
Batc
h R
eque
sts
per S
econ
d
Broadwell vs. Haswell Performance Results
20% Performance Increase with
Broadwell CPUs
Technical white paper Page 22
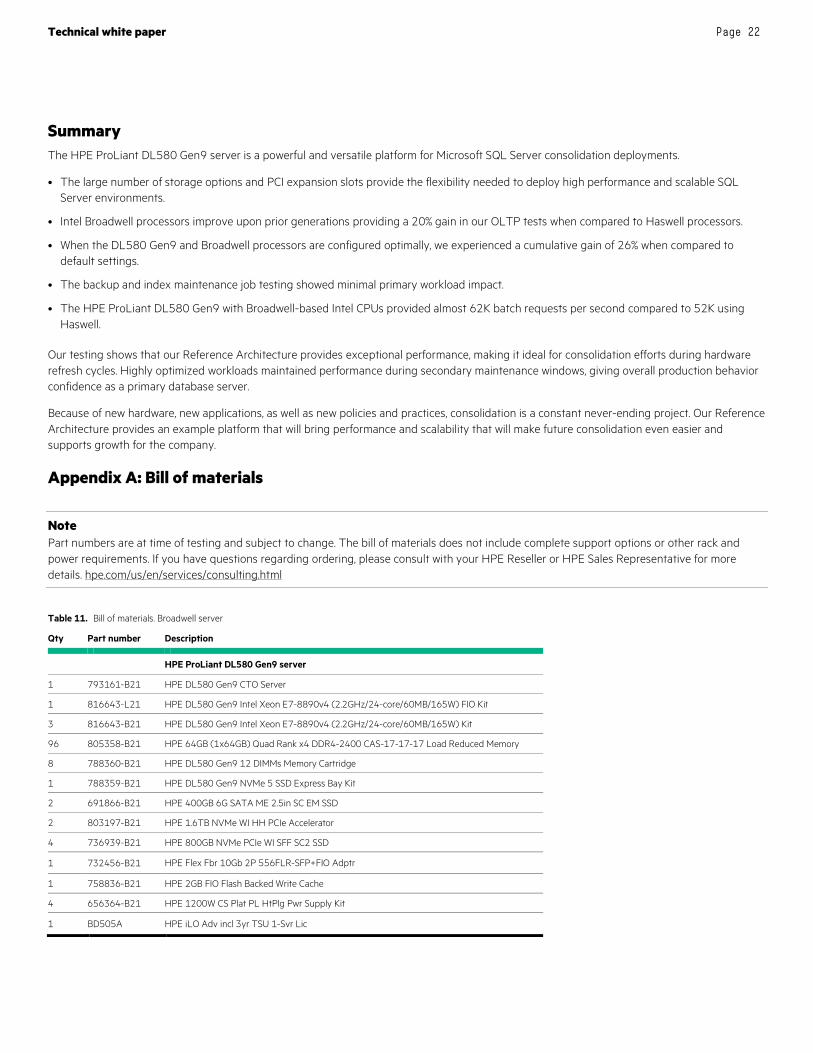
Summary The HPE ProLiant DL580 Gen9 server is a powerful and versatile platform for Microsoft SQL Server consolidation deployments.
• The large number of storage options and PCI expansion slots provide the flexibility needed to deploy high performance and scalable SQL Server environments.
• Intel Broadwell processors improve upon prior generations providing a 20% gain in our OLTP tests when compared to Haswell processors.
• When the DL580 Gen9 and Broadwell processors are configured optimally, we experienced a cumulative gain of 26% when compared to default settings.
• The backup and index maintenance job testing showed minimal primary workload impact.
• The HPE ProLiant DL580 Gen9 with Broadwell-based Intel CPUs provided almost 62K batch requests per second compared to 52K using Haswell.
Our testing shows that our Reference Architecture provides exceptional performance, making it ideal for consolidation efforts during hardware refresh cycles. Highly optimized workloads maintained performance during secondary maintenance windows, giving overall production behavior confidence as a primary database server.
Because of new hardware, new applications, as well as new policies and practices, consolidation is a constant never-ending project. Our Reference Architecture provides an example platform that will bring performance and scalability that will make future consolidation even easier and supports growth for the company.
Appendix A: Bill of materials
Note Part numbers are at time of testing and subject to change. The bill of materials does not include complete support options or other rack and power requirements. If you have questions regarding ordering, please consult with your HPE Reseller or HPE Sales Representative for more details. hpe.com/us/en/services/consulting.html
Table 11. Bill of materials. Broadwell server
Qty Part number Description
HPE ProLiant DL580 Gen9 server
1 793161-B21 HPE DL580 Gen9 CTO Server
1 816643-L21 HPE DL580 Gen9 Intel Xeon E7-8890v4 (2.2GHz/24-core/60MB/165W) FIO Kit
3 816643-B21 HPE DL580 Gen9 Intel Xeon E7-8890v4 (2.2GHz/24-core/60MB/165W) Kit
96 805358-B21 HPE 64GB (1x64GB) Quad Rank x4 DDR4-2400 CAS-17-17-17 Load Reduced Memory
8 788360-B21 HPE DL580 Gen9 12 DIMMs Memory Cartridge
1 788359-B21 HPE DL580 Gen9 NVMe 5 SSD Express Bay Kit
2 691866-B21 HPE 400GB 6G SATA ME 2.5in SC EM SSD
2 803197-B21 HPE 1.6TB NVMe WI HH PCIe Accelerator
4 736939-B21 HPE 800GB NVMe PCIe WI SFF SC2 SSD
1 732456-B21 HPE Flex Fbr 10Gb 2P 556FLR-SFP+FIO Adptr
1 758836-B21 HPE 2GB FIO Flash Backed Write Cache
4 656364-B21 HPE 1200W CS Plat PL HtPlg Pwr Supply Kit
1 BD505A HPE iLO Adv incl 3yr TSU 1-Svr Lic
Technical white paper Page 23
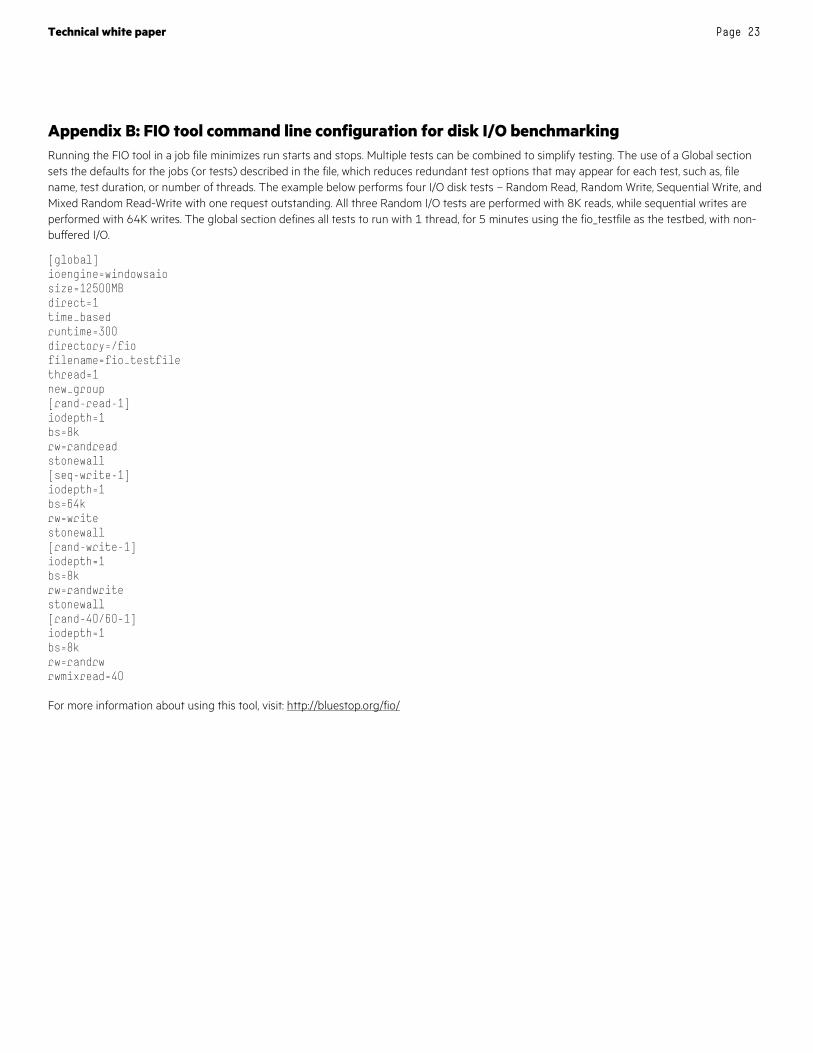
Appendix B: FIO tool command line configuration for disk I/O benchmarking Running the FIO tool in a job file minimizes run starts and stops. Multiple tests can be combined to simplify testing. The use of a Global section sets the defaults for the jobs (or tests) described in the file, which reduces redundant test options that may appear for each test, such as, file name, test duration, or number of threads. The example below performs four I/O disk tests – Random Read, Random Write, Sequential Write, and Mixed Random Read-Write with one request outstanding. All three Random I/O tests are performed with 8K reads, while sequential writes are performed with 64K writes. The global section defines all tests to run with 1 thread, for 5 minutes using the fio_testfile as the testbed, with non-buffered I/O.
[global] ioengine=windowsaio size=12500MB direct=1 time_based runtime=300 directory=/fio filename=fio_testfile thread=1 new_group [rand-read-1] iodepth=1 bs=8k rw=randread stonewall [seq-write-1] iodepth=1 bs=64k rw=write stonewall [rand-write-1] iodepth=1 bs=8k rw=randwrite stonewall [rand-40/60-1] iodepth=1 bs=8k rw=randrw rwmixread=40 For more information about using this tool, visit: http://bluestop.org/fio/
Technical white paper Page 24
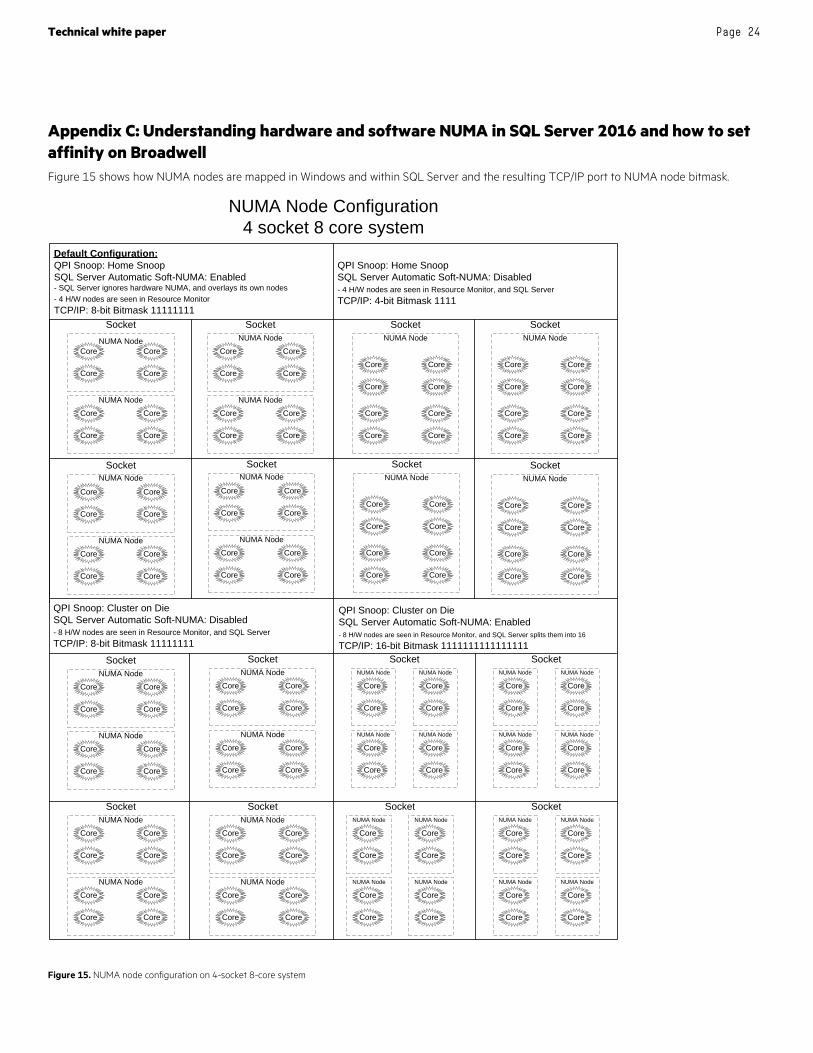
Appendix C: Understanding hardware and software NUMA in SQL Server 2016 and how to set affinity on Broadwell Figure 15 shows how NUMA nodes are mapped in Windows and within SQL Server and the resulting TCP/IP port to NUMA node bitmask.
NUMA Node Configuration 4 socket 8 core system
Default Configuration: QPI Snoop: Home SnoopSQL Server Automatic Soft-NUMA: Enabled- SQL Server ignores hardware NUMA, and overlays its own nodes- 4 H/W nodes are seen in Resource MonitorTCP/IP: 8-bit Bitmask 11111111
NUMA NodeSocket
NUMA Node
Core
Core
Core
Core
Core
Core
Core
Core
Socket
NUMA Node
Core
Core
Core
Core
Core
Core
Core
Core
Socket
NUMA Node
Core
Core
Core
Core
Core
Core
Core
Core
Socket
NUMA Node
Core
Core
Core
Core
Core
Core
Core
Core
NUMA Node NUMA Node
NUMA Node NUMA Node
QPI Snoop: Home SnoopSQL Server Automatic Soft-NUMA: Disabled- 4 H/W nodes are seen in Resource Monitor, and SQL ServerTCP/IP: 4-bit Bitmask 1111
QPI Snoop: Cluster on DieSQL Server Automatic Soft-NUMA: Disabled- 8 H/W nodes are seen in Resource Monitor, and SQL ServerTCP/IP: 8-bit Bitmask 11111111
QPI Snoop: Cluster on DieSQL Server Automatic Soft-NUMA: Enabled- 8 H/W nodes are seen in Resource Monitor, and SQL Server splits them into 16
TCP/IP: 16-bit Bitmask 1111111111111111
SocketNUMA Node
Core
Core
Core
Core
Core
Core
Core
Core
SocketNUMA Node
Core
Core
Core
Core
Core
Core
Core
Core
SocketNUMA Node
Core
Core
Core
Core
Core
Core
Core
Core
SocketNUMA Node
Core
Core
Core
Core
Core
Core
Core
Core
Socket
NUMA Node
Core
Core
Core
Core
Core
Core
Core
Core
NUMA Node
Socket
NUMA Node
Core
Core
Core
Core
Core
Core
Core
Core
NUMA Node
Socket
NUMA Node
Core
Core
Core
Core
Core
Core
Core
Core
NUMA NodeSocket
NUMA Node
Core
Core
Core
Core
Core
Core
Core
Core
NUMA Node
Socket
Core
Core
NUMA Node
Core
Core
NUMA Node
Core
Core
NUMA Node
Core
Core
NUMA Node
Socket
Core
Core
NUMA Node
Core
Core
NUMA Node
Core
Core
NUMA Node
Core
Core
NUMA Node
Socket
Core
Core
NUMA Node
Core
Core
NUMA Node
Core
Core
NUMA Node
Core
Core
NUMA Node
Socket
Core
Core
NUMA Node
Core
Core
NUMA Node
Core
Core
NUMA Node
Core
Core
NUMA Node
Figure 15. NUMA node configuration on 4-socket 8-core system
Technical white paper Page 25
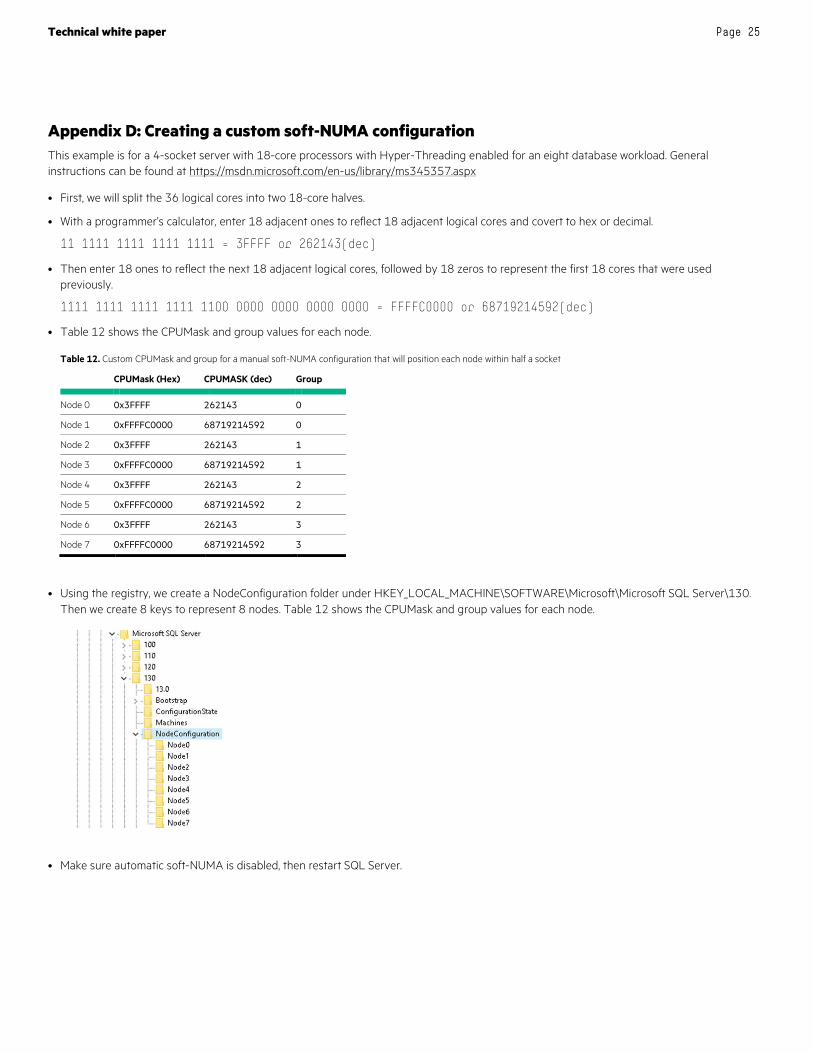
Appendix D: Creating a custom soft-NUMA configuration This example is for a 4-socket server with 18-core processors with Hyper-Threading enabled for an eight database workload. General instructions can be found at https://msdn.microsoft.com/en-us/library/ms345357.aspx
• First, we will split the 36 logical cores into two 18-core halves.
• With a programmer’s calculator, enter 18 adjacent ones to reflect 18 adjacent logical cores and covert to hex or decimal.
11 1111 1111 1111 1111 = 3FFFF or 262143(dec)
• Then enter 18 ones to reflect the next 18 adjacent logical cores, followed by 18 zeros to represent the first 18 cores that were used previously.
1111 1111 1111 1111 1100 0000 0000 0000 0000 = FFFFC0000 or 68719214592(dec)
• Table 12 shows the CPUMask and group values for each node.
Table 12. Custom CPUMask and group for a manual soft-NUMA configuration that will position each node within half a socket
CPUMask (Hex) CPUMASK (dec) Group
Node 0 0x3FFFF 262143 0
Node 1 0xFFFFC0000 68719214592 0
Node 2 0x3FFFF 262143 1
Node 3 0xFFFFC0000 68719214592 1
Node 4 0x3FFFF 262143 2
Node 5 0xFFFFC0000 68719214592 2
Node 6 0x3FFFF 262143 3
Node 7 0xFFFFC0000 68719214592 3
• Using the registry, we create a NodeConfiguration folder under HKEY_LOCAL_MACHINE\SOFTWARE\Microsoft\Microsoft SQL Server\130. Then we create 8 keys to represent 8 nodes. Table 12 shows the CPUMask and group values for each node.
• Make sure automatic soft-NUMA is disabled, then restart SQL Server.
Technical white paper Page 26
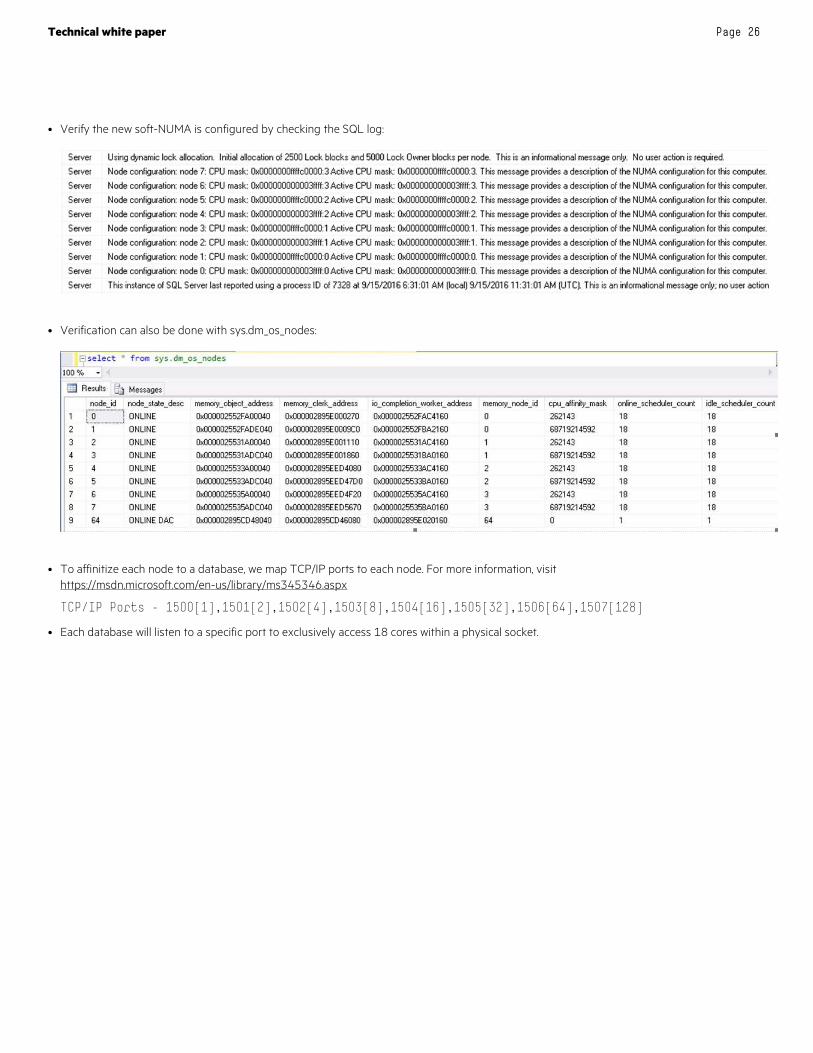
• Verify the new soft-NUMA is configured by checking the SQL log:
• Verification can also be done with sys.dm_os_nodes:
• To affinitize each node to a database, we map TCP/IP ports to each node. For more information, visit https://msdn.microsoft.com/en-us/library/ms345346.aspx
TCP/IP Ports - 1500[1],1501[2],1502[4],1503[8],1504[16],1505[32],1506[64],1507[128]
• Each database will listen to a specific port to exclusively access 18 cores within a physical socket.
Technical white paper Page 27
Sign up for updates
© Copyright 2016 Hewlett Packard Enterprise Development LP. The information contained herein is subject to change without notice. The only warranties for Hewlett Packard Enterprise products and services are set forth in the express warranty statements accompanying such products and services. Nothing herein should be construed as constituting an additional warranty. Hewlett Packard Enterprise shall not be liable for technical or editorial errors or omissions contained herein.
Microsoft, Windows Server, and Windows are either registered trademarks or trademarks of Microsoft Corporation in the United States and/or other countries. Intel and Xeon are trademarks of Intel Corporation in the U.S. and other countries.
4AA6-8301ENW, October 2016
Resources and additional links HPE ProLiant DL580 Gen9 server hpe.com/servers/dl580
HPE Reference Architectures hpe.com/info/ra
HPE Servers hpe.com/servers
HPE Storage hpe.com/storage
HPE Networking hpe.com/networking
HPE Technology Consulting Services hpe.com/us/en/services/consulting.html
HPE SSD Data Sheet http://h20195.www2.hpe.com/V2/GetDocument.aspx?docname=4AA4-7186ENW
Best practices configuring the HPE ProLiant DL560 and DL580 Gen9 Servers with Windows Server http://h20195.www2.hpe.com/v2/GetDocument.aspx?docname=4AA5-1110ENW
To help us improve our documents, please provide feedback at hpe.com/contact/feedback.