Embed Size (px)
Citation preview
HP Performance Advisor User Guide
1 HP Performance Advisor 2.0.
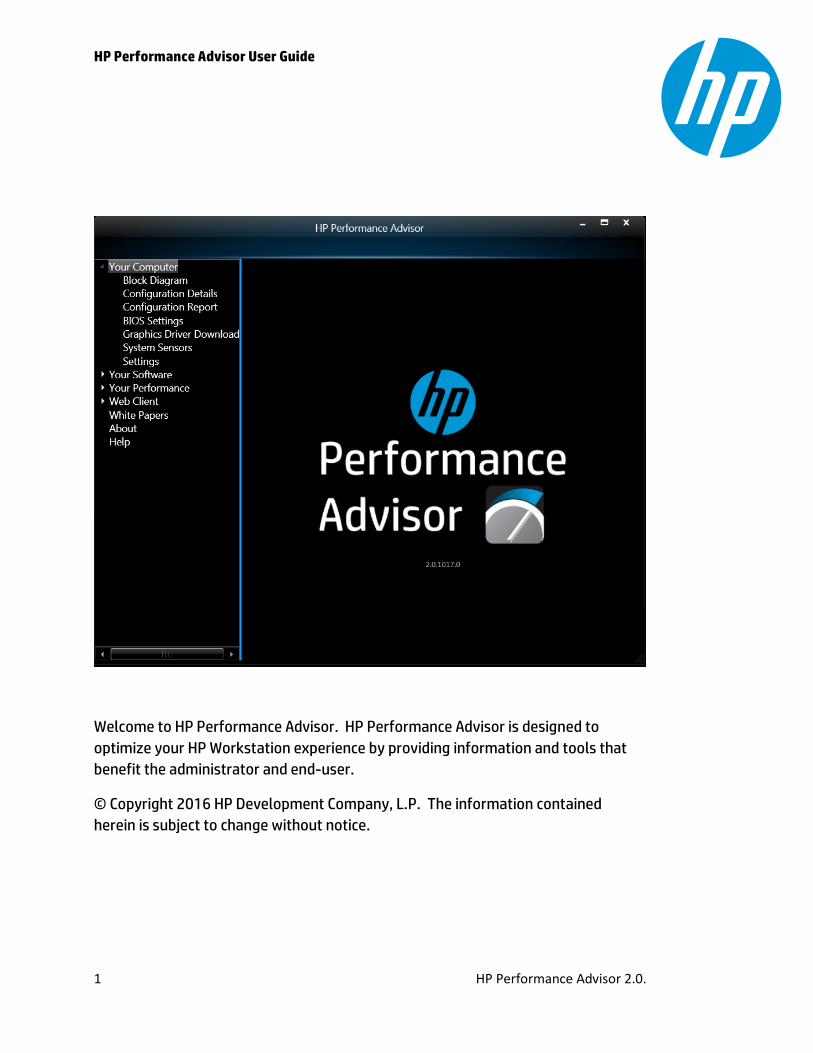
Welcome to HP Performance Advisor. HP Performance Advisor is designed to
optimize your HP Workstation experience by providing information and tools that
benefit the administrator and end-user.
© Copyright 2016 HP Development Company, L.P. The information contained
herein is subject to change without notice.

HP Performance Advisor User Guide
2 HP Performance Advisor 2.0.
Contents
Getting Started ...................................................................................................................... 3
New features ......................................................................................................................... 3
Administrator privileges ........................................................................................................ 3
Internet access ...................................................................................................................... 3
Launching HP Performance Advisor ...................................................................................... 4
Task View Navigation Bar ...................................................................................................... 5
Notification area icon ............................................................................................................ 6
Close window and terminate application .............................................................................. 6
Improvement Program .......................................................................................................... 6
Block Diagram ........................................................................................................................ 7
Configuration Details ............................................................................................................. 8
Configuration Report ............................................................................................................. 9
System BIOS ......................................................................................................................... 10
Graphics Driver Download ................................................................................................... 11
System Sensors .................................................................................................................... 12
Show All Supported Vendors ............................................................................................... 13
GPU Utilization window ....................................................................................................... 15
Memory Graph .................................................................................................................... 16
Workstation Monitor - Record Performance Data .............................................................. 17
Workstation Monitor - Play back Performance Data .......................................................... 18
Manage CPU Affinity ........................................................................................................... 20
Windows Experience Index ................................................................................................. 21
Remote web client console ................................................................................................. 22
Remote overview ................................................................................................................ 23
HTTP listener mode ............................................................................................................. 23
White Paper Index ............................................................................................................... 24
Table of figures. ................................................................................................................... 25
HP Performance Advisor User Guide
3 HP Performance Advisor 2.0.
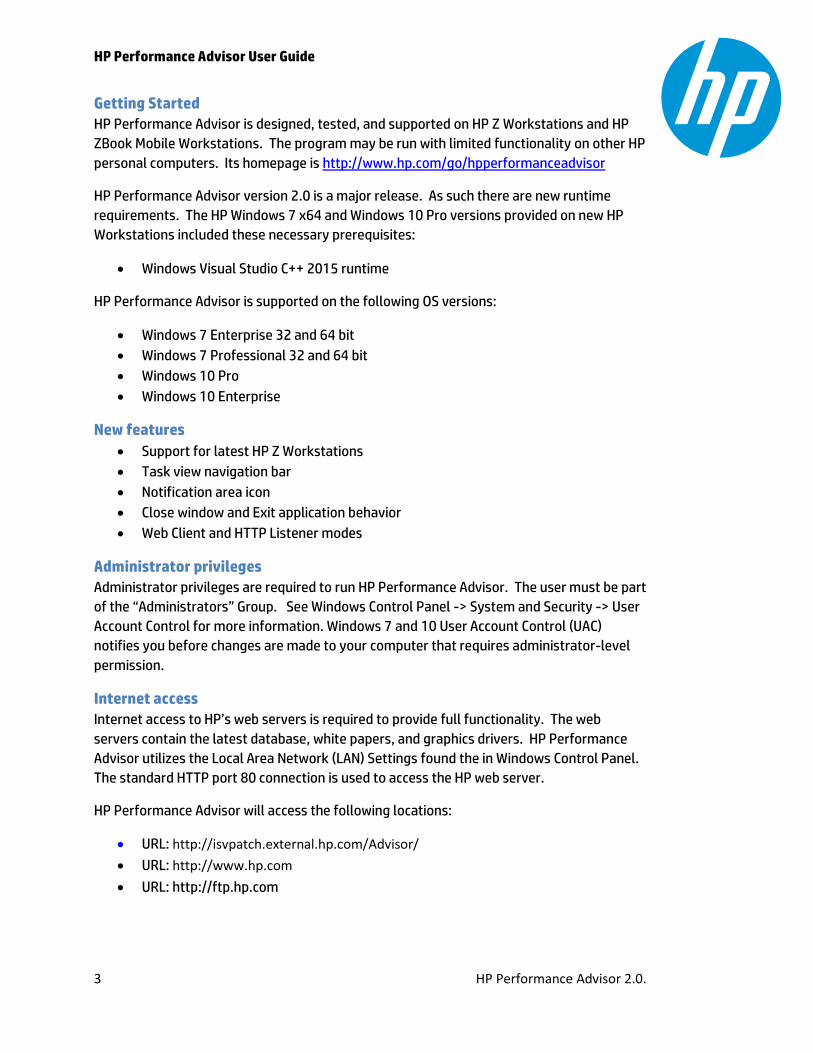
Getting Started
HP Performance Advisor is designed, tested, and supported on HP Z Workstations and HP
ZBook Mobile Workstations. The program may be run with limited functionality on other HP
personal computers. Its homepage is http://www.hp.com/go/hpperformanceadvisor
HP Performance Advisor version 2.0 is a major release. As such there are new runtime
requirements. The HP Windows 7 x64 and Windows 10 Pro versions provided on new HP
Workstations included these necessary prerequisites:
Windows Visual Studio C++ 2015 runtime
HP Performance Advisor is supported on the following OS versions:
Windows 7 Enterprise 32 and 64 bit
Windows 7 Professional 32 and 64 bit
Windows 10 Pro
Windows 10 Enterprise
New features
Support for latest HP Z Workstations
Task view navigation bar
Notification area icon
Close window and Exit application behavior
Web Client and HTTP Listener modes
Administrator privileges
Administrator privileges are required to run HP Performance Advisor. The user must be part
of the “Administrators” Group. See Windows Control Panel -> System and Security -> User
Account Control for more information. Windows 7 and 10 User Account Control (UAC)
notifies you before changes are made to your computer that requires administrator-level
permission.
Internet access
Internet access to HP’s web servers is required to provide full functionality. The web
servers contain the latest database, white papers, and graphics drivers. HP Performance
Advisor utilizes the Local Area Network (LAN) Settings found the in Windows Control Panel.
The standard HTTP port 80 connection is used to access the HP web server.
HP Performance Advisor will access the following locations:
URL: http://isvpatch.external.hp.com/Advisor/
URL: http://www.hp.com
URL: http://ftp.hp.com
HP Performance Advisor User Guide
4 HP Performance Advisor 2.0.
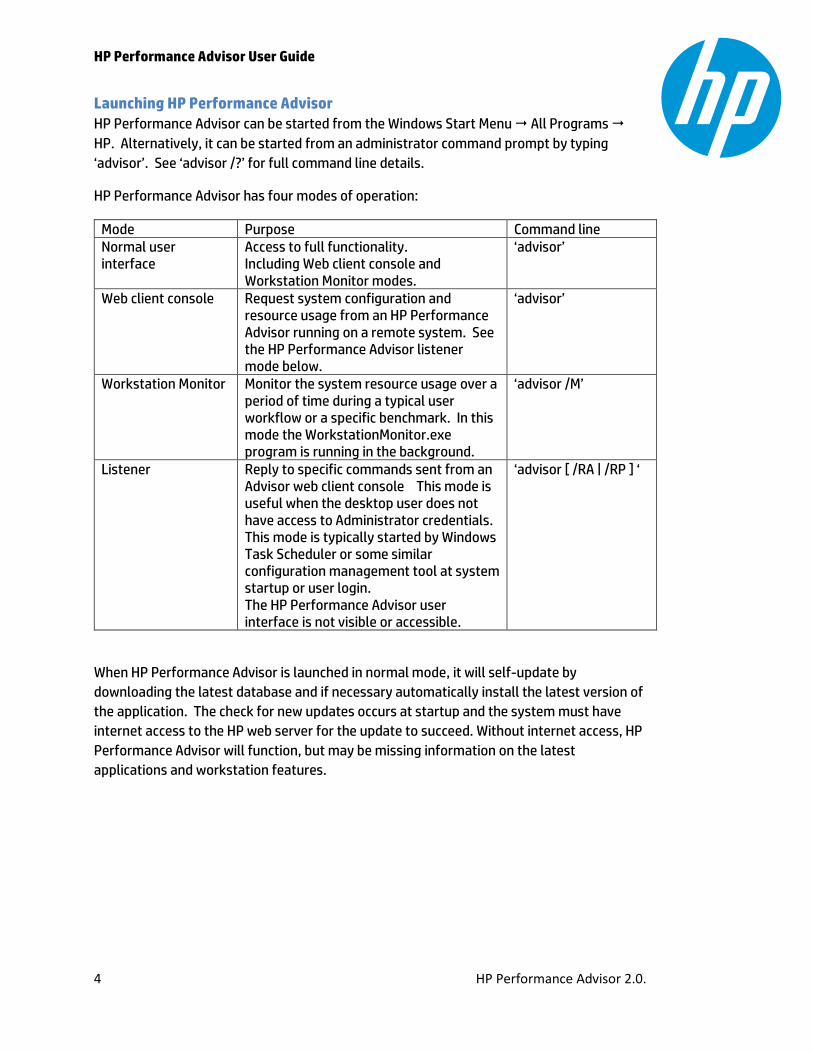
Launching HP Performance Advisor HP Performance Advisor can be started from the Windows Start Menu All Programs
HP. Alternatively, it can be started from an administrator command prompt by typing
‘advisor’. See ‘advisor /?’ for full command line details.
HP Performance Advisor has four modes of operation:
Mode Purpose Command line Normal user interface
Access to full functionality. Including Web client console and Workstation Monitor modes.
‘advisor’
Web client console
Request system configuration and resource usage from an HP Performance Advisor running on a remote system. See the HP Performance Advisor listener mode below.
‘advisor’
Workstation Monitor Monitor the system resource usage over a period of time during a typical user workflow or a specific benchmark. In this mode the WorkstationMonitor.exe program is running in the background.
‘advisor /M’
Listener Reply to specific commands sent from an Advisor web client console This mode is useful when the desktop user does not have access to Administrator credentials. This mode is typically started by Windows Task Scheduler or some similar configuration management tool at system startup or user login. The HP Performance Advisor user interface is not visible or accessible.
‘advisor [ /RA | /RP ] ‘
When HP Performance Advisor is launched in normal mode, it will self-update by
downloading the latest database and if necessary automatically install the latest version of
the application. The check for new updates occurs at startup and the system must have
internet access to the HP web server for the update to succeed. Without internet access, HP
Performance Advisor will function, but may be missing information on the latest
applications and workstation features.
HP Performance Advisor User Guide
5 HP Performance Advisor 2.0.
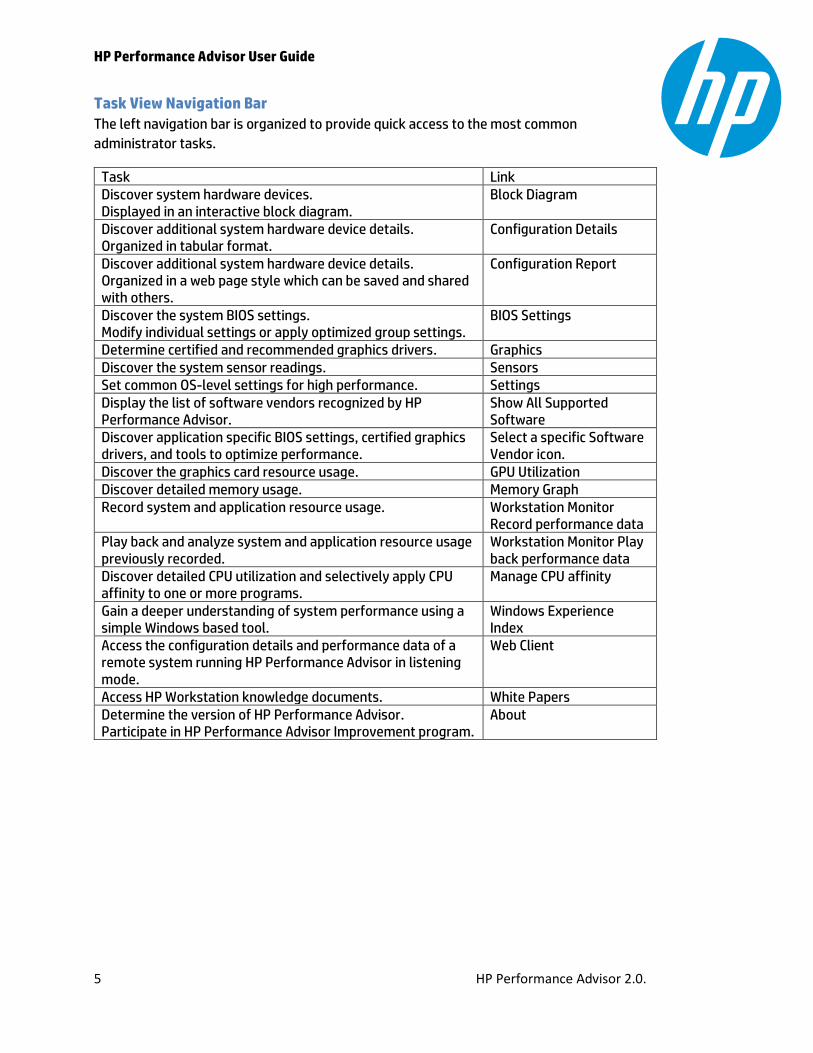
Task View Navigation Bar
The left navigation bar is organized to provide quick access to the most common
administrator tasks.
Task Link Discover system hardware devices. Displayed in an interactive block diagram.
Block Diagram
Discover additional system hardware device details. Organized in tabular format.
Configuration Details
Discover additional system hardware device details. Organized in a web page style which can be saved and shared with others.
Configuration Report
Discover the system BIOS settings. Modify individual settings or apply optimized group settings.
BIOS Settings
Determine certified and recommended graphics drivers. Graphics Discover the system sensor readings. Sensors Set common OS-level settings for high performance. Settings Display the list of software vendors recognized by HP Performance Advisor.
Show All Supported Software
Discover application specific BIOS settings, certified graphics drivers, and tools to optimize performance.
Select a specific Software Vendor icon.
Discover the graphics card resource usage. GPU Utilization Discover detailed memory usage. Memory Graph Record system and application resource usage. Workstation Monitor
Record performance data Play back and analyze system and application resource usage previously recorded.
Workstation Monitor Play back performance data
Discover detailed CPU utilization and selectively apply CPU affinity to one or more programs.
Manage CPU affinity
Gain a deeper understanding of system performance using a simple Windows based tool.
Windows Experience Index
Access the configuration details and performance data of a remote system running HP Performance Advisor in listening mode.
Web Client
Access HP Workstation knowledge documents. White Papers Determine the version of HP Performance Advisor. Participate in HP Performance Advisor Improvement program.
About
HP Performance Advisor User Guide
6 HP Performance Advisor 2.0.
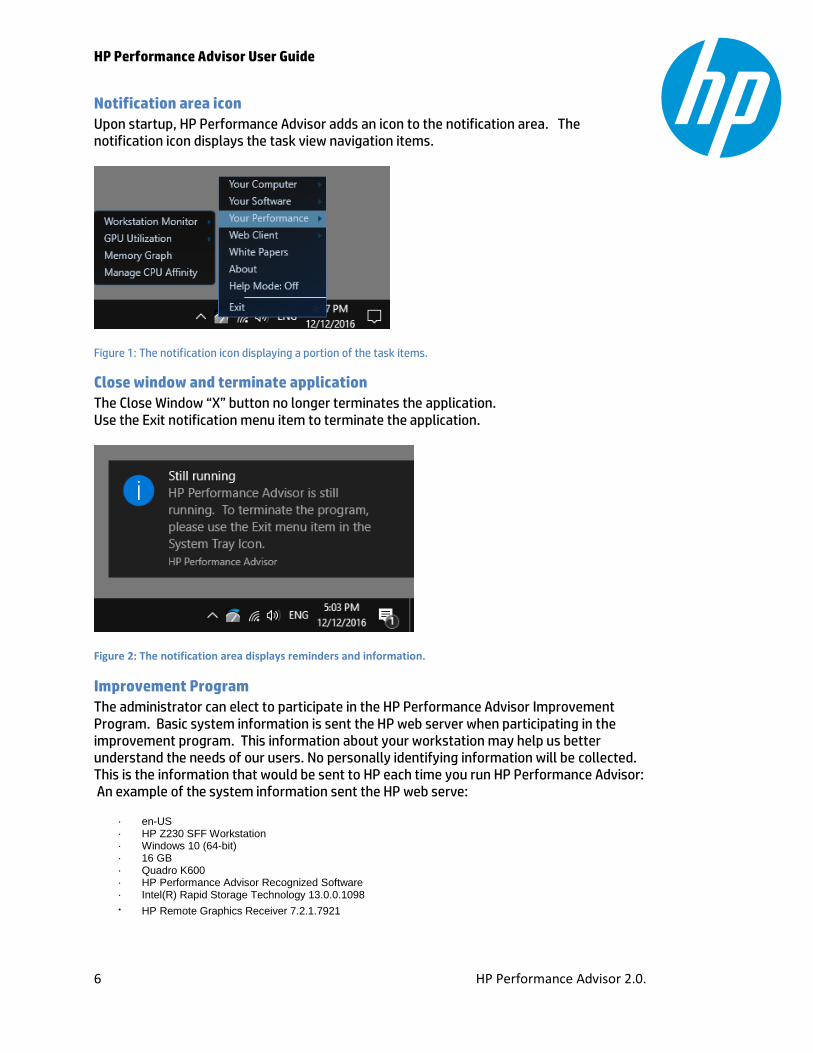
Notification area icon
Upon startup, HP Performance Advisor adds an icon to the notification area. The notification icon displays the task view navigation items.
Figure 1: The notification icon displaying a portion of the task items.
Close window and terminate application
The Close Window “X” button no longer terminates the application. Use the Exit notification menu item to terminate the application.
Figure 2: The notification area displays reminders and information.
Improvement Program
The administrator can elect to participate in the HP Performance Advisor Improvement Program. Basic system information is sent the HP web server when participating in the improvement program. This information about your workstation may help us better understand the needs of our users. No personally identifying information will be collected. This is the information that would be sent to HP each time you run HP Performance Advisor: An example of the system information sent the HP web serve:
· en-US · HP Z230 SFF Workstation · Windows 10 (64-bit) · 16 GB · Quadro K600 · HP Performance Advisor Recognized Software · Intel(R) Rapid Storage Technology 13.0.0.1098
· HP Remote Graphics Receiver 7.2.1.7921 program. T
HP Performance Advisor User Guide
7 HP Performance Advisor 2.0.
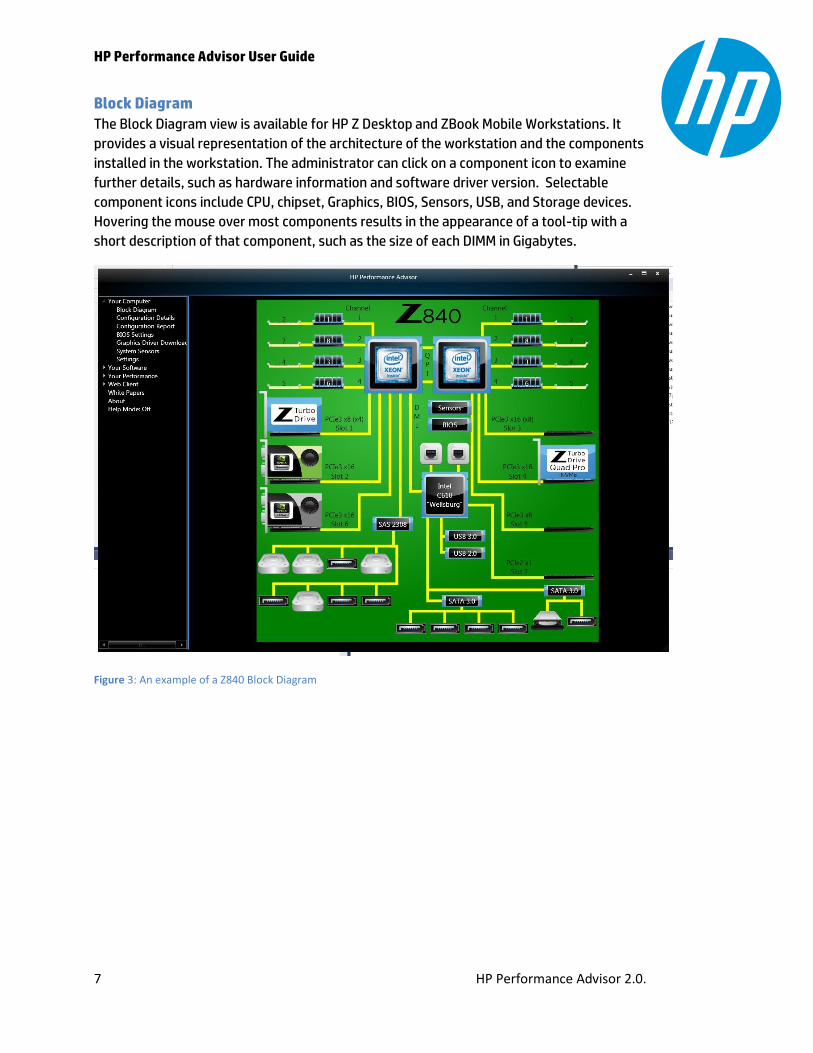
Block Diagram
The Block Diagram view is available for HP Z Desktop and ZBook Mobile Workstations. It
provides a visual representation of the architecture of the workstation and the components
installed in the workstation. The administrator can click on a component icon to examine
further details, such as hardware information and software driver version. Selectable
component icons include CPU, chipset, Graphics, BIOS, Sensors, USB, and Storage devices.
Hovering the mouse over most components results in the appearance of a tool-tip with a
short description of that component, such as the size of each DIMM in Gigabytes.
Figure 3: An example of a Z840 Block Diagram
HP Performance Advisor User Guide
8 HP Performance Advisor 2.0.
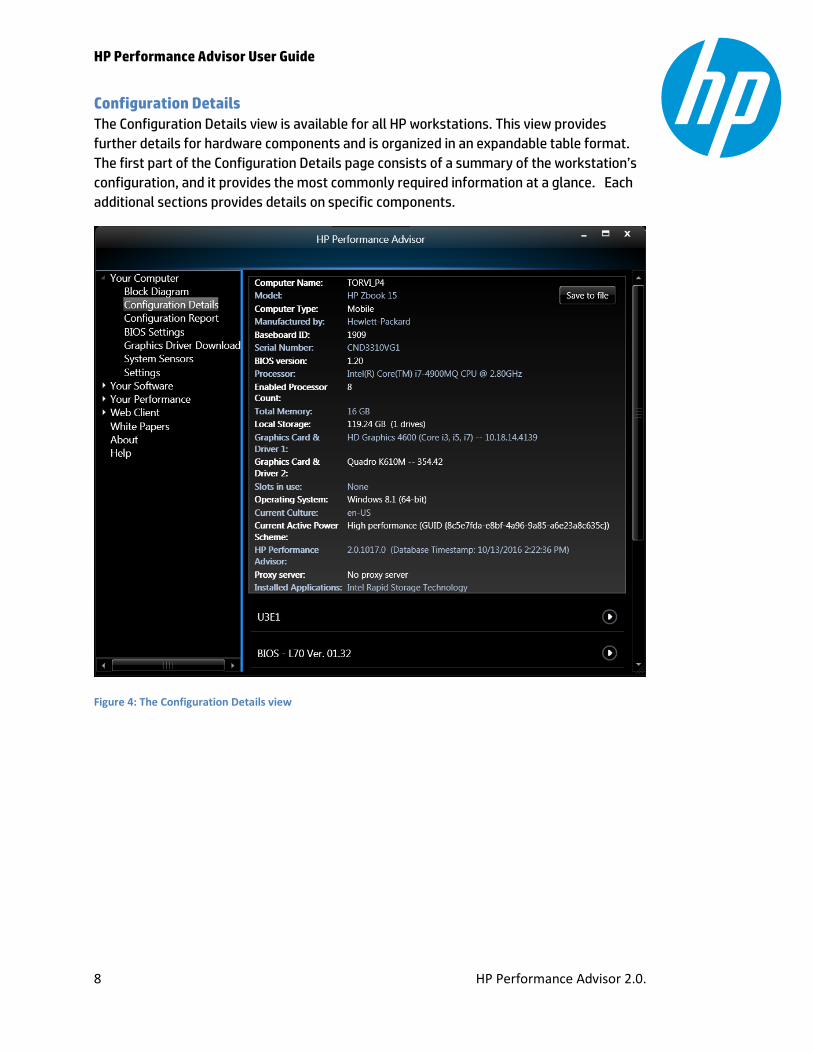
Configuration Details
The Configuration Details view is available for all HP workstations. This view provides
further details for hardware components and is organized in an expandable table format.
The first part of the Configuration Details page consists of a summary of the workstation’s
configuration, and it provides the most commonly required information at a glance. Each
additional sections provides details on specific components.
Figure 4: The Configuration Details view

HP Performance Advisor User Guide
9 HP Performance Advisor 2.0.
Configuration Report
The Configuration Report view is available for all HP workstations. This view provides
further details for hardware components in a contiguous document format. This document
carries almost everything there is to know about the workstation, and is therefore a useful
tool for communicating your system’s configuration to a support engineer, for example.
Buttons in the lower-right corner change the visual style, and a slider adjusts the font size
for legibility. The search button is located on the lower left corner.
The configuration report can be saved to file in XAML or text format, by clicking on the Save
to file but ton. The XAML formatted file can be viewed in most web browsers.
Figure 5: The Configuration Report view.

HP Performance Advisor User Guide
10 HP Performance Advisor 2.0.
System BIOS
The system BIOS Settings view provides functionality similar to F10 Setup. The
administrator can view and modify BIOS settings, load a predefined optimized settings
group, create a custom group, and restore factory defaults. Any BIOS changes made here
will take effect on rebooting the workstation. The BIOS Settings window can be reached
from the main navigation tree, the block diagram, and software vendor windows.
Figure 6: System BIOS management window
HP Performance Advisor User Guide
11 HP Performance Advisor 2.0.
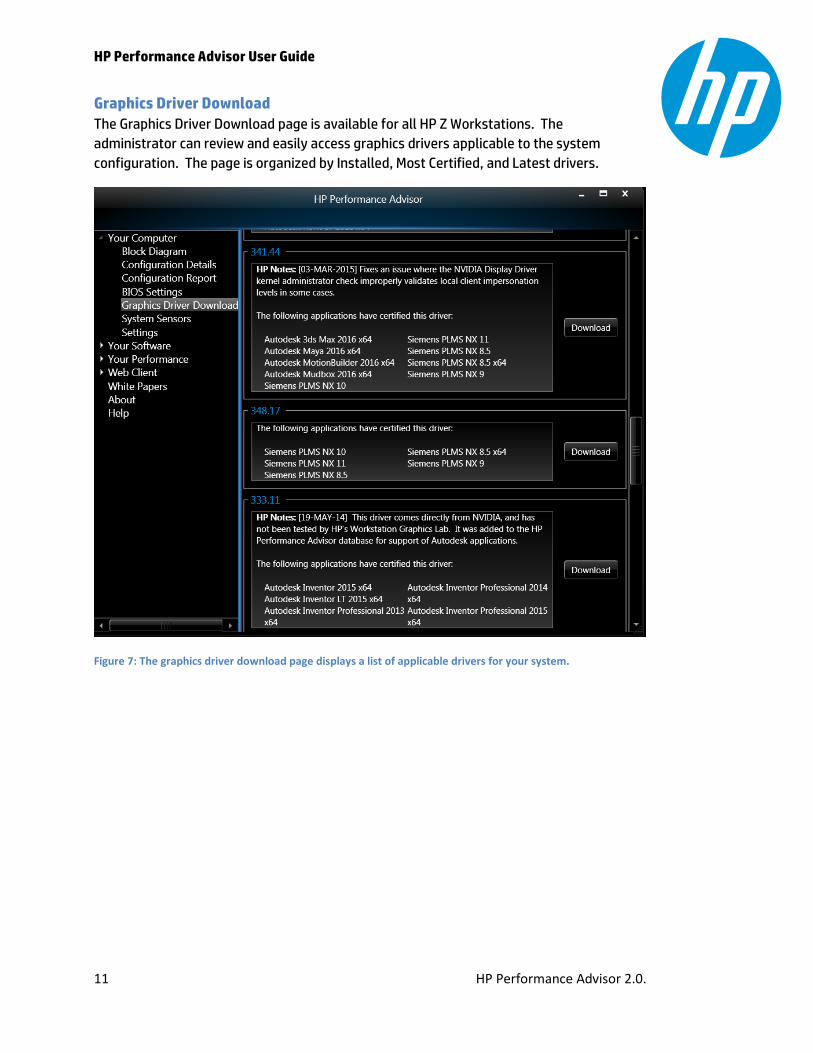
Graphics Driver Download
The Graphics Driver Download page is available for all HP Z Workstations. The
administrator can review and easily access graphics drivers applicable to the system
configuration. The page is organized by Installed, Most Certified, and Latest drivers.
Figure 7: The graphics driver download page displays a list of applicable drivers for your system.
HP Performance Advisor User Guide
12 HP Performance Advisor 2.0.
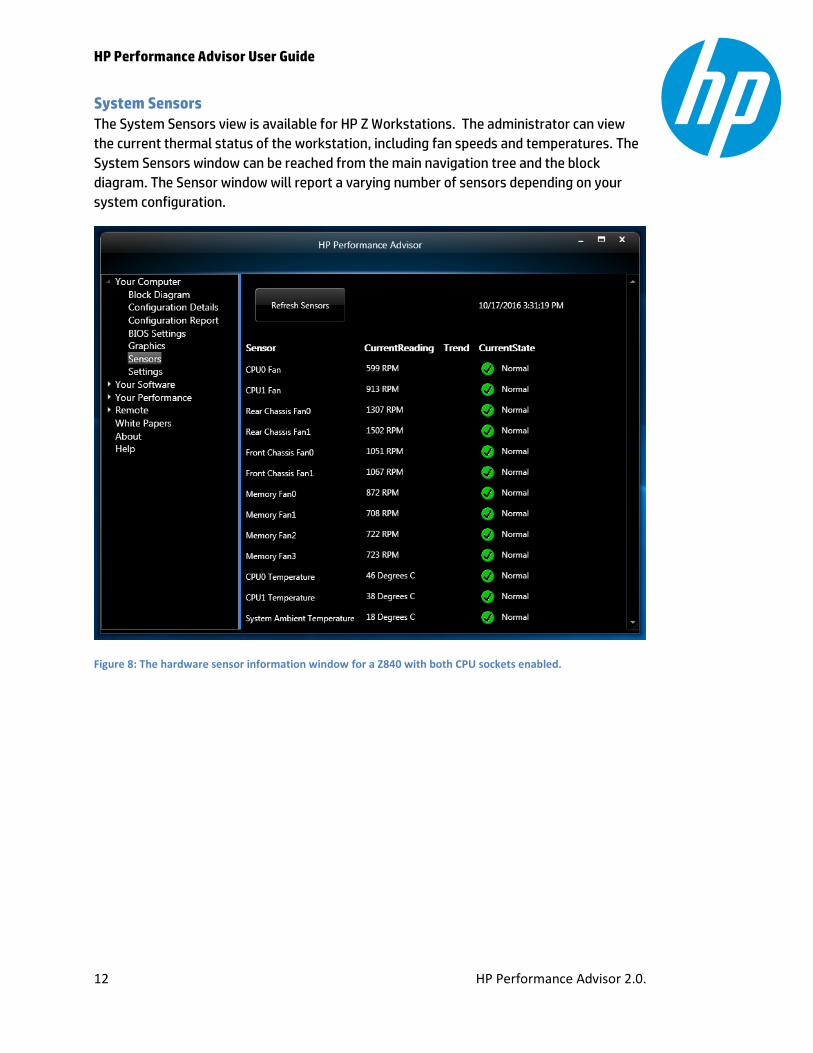
System Sensors
The System Sensors view is available for HP Z Workstations. The administrator can view
the current thermal status of the workstation, including fan speeds and temperatures. The
System Sensors window can be reached from the main navigation tree and the block
diagram. The Sensor window will report a varying number of sensors depending on your
system configuration.
Figure 8: The hardware sensor information window for a Z840 with both CPU sockets enabled.
HP Performance Advisor User Guide
13 HP Performance Advisor 2.0.
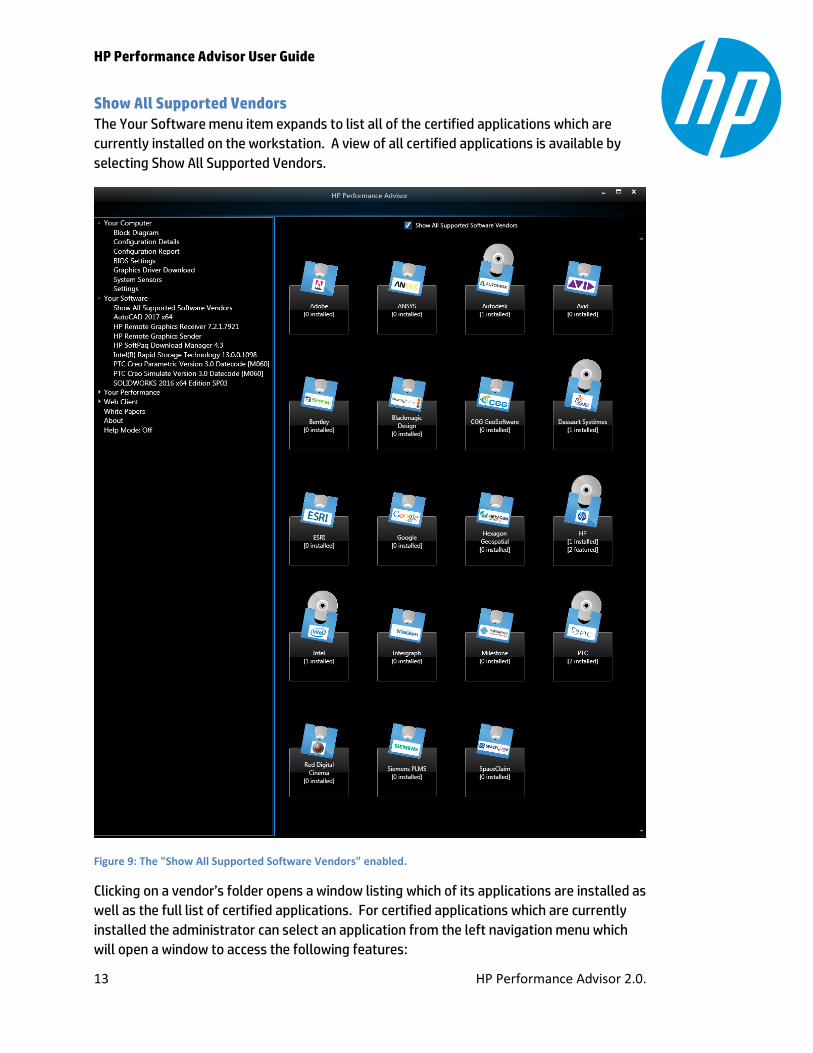
Show All Supported Vendors
The Your Software menu item expands to list all of the certified applications which are
currently installed on the workstation. A view of all certified applications is available by
selecting Show All Supported Vendors.
Figure 9: The "Show All Supported Software Vendors" enabled.
Clicking on a vendor’s folder opens a window listing which of its applications are installed as
well as the full list of certified applications. For certified applications which are currently
installed the administrator can select an application from the left navigation menu which
will open a window to access the following features:
HP Performance Advisor User Guide
14 HP Performance Advisor 2.0.
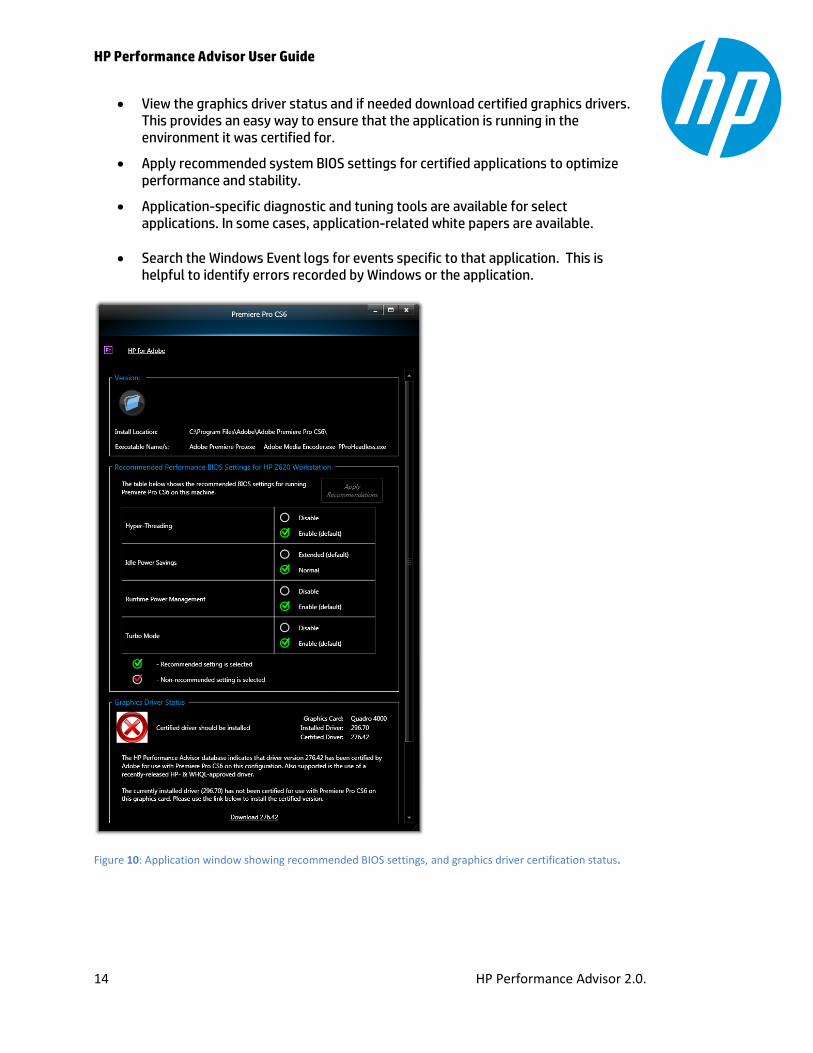
View the graphics driver status and if needed download certified graphics drivers. This provides an easy way to ensure that the application is running in the environment it was certified for.
Apply recommended system BIOS settings for certified applications to optimize performance and stability.
Application-specific diagnostic and tuning tools are available for select applications. In some cases, application-related white papers are available.
Search the Windows Event logs for events specific to that application. This is helpful to identify errors recorded by Windows or the application.
Figure 10: Application window showing recommended BIOS settings, and graphics driver certification status.
HP Performance Advisor User Guide
15 HP Performance Advisor 2.0.
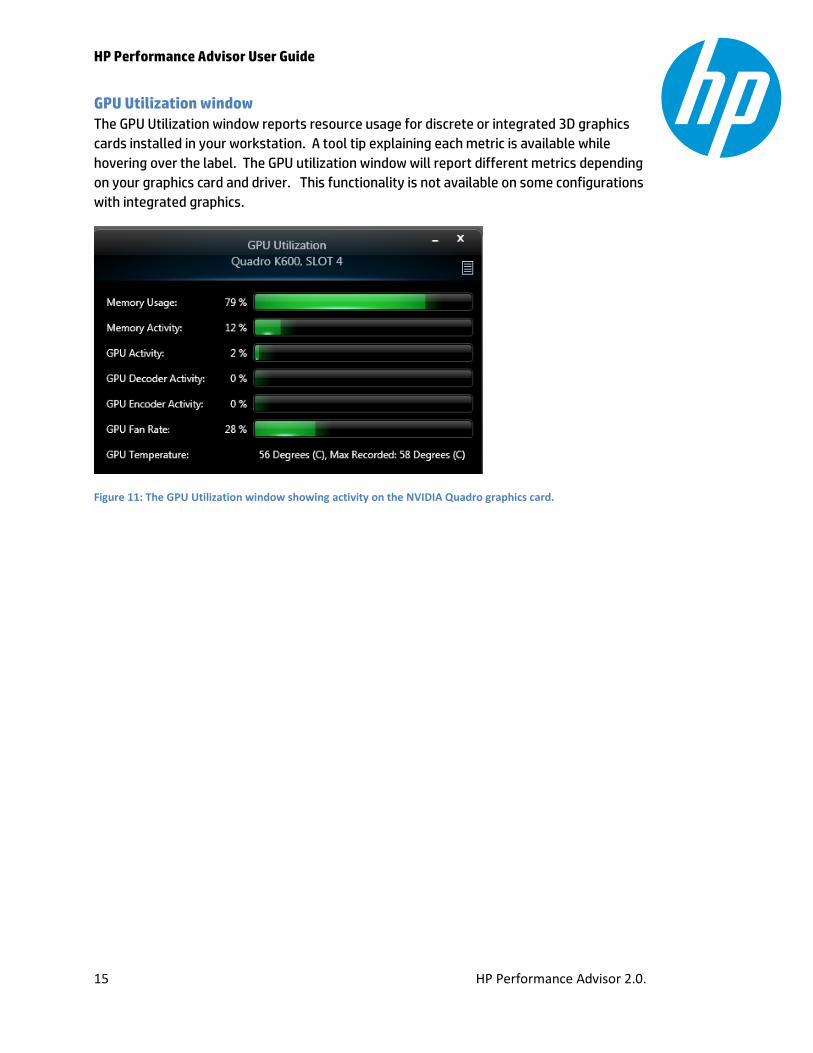
GPU Utilization window
The GPU Utilization window reports resource usage for discrete or integrated 3D graphics
cards installed in your workstation. A tool tip explaining each metric is available while
hovering over the label. The GPU utilization window will report different metrics depending
on your graphics card and driver. This functionality is not available on some configurations
with integrated graphics.
Figure 11: The GPU Utilization window showing activity on the NVIDIA Quadro graphics card.
HP Performance Advisor User Guide
16 HP Performance Advisor 2.0.
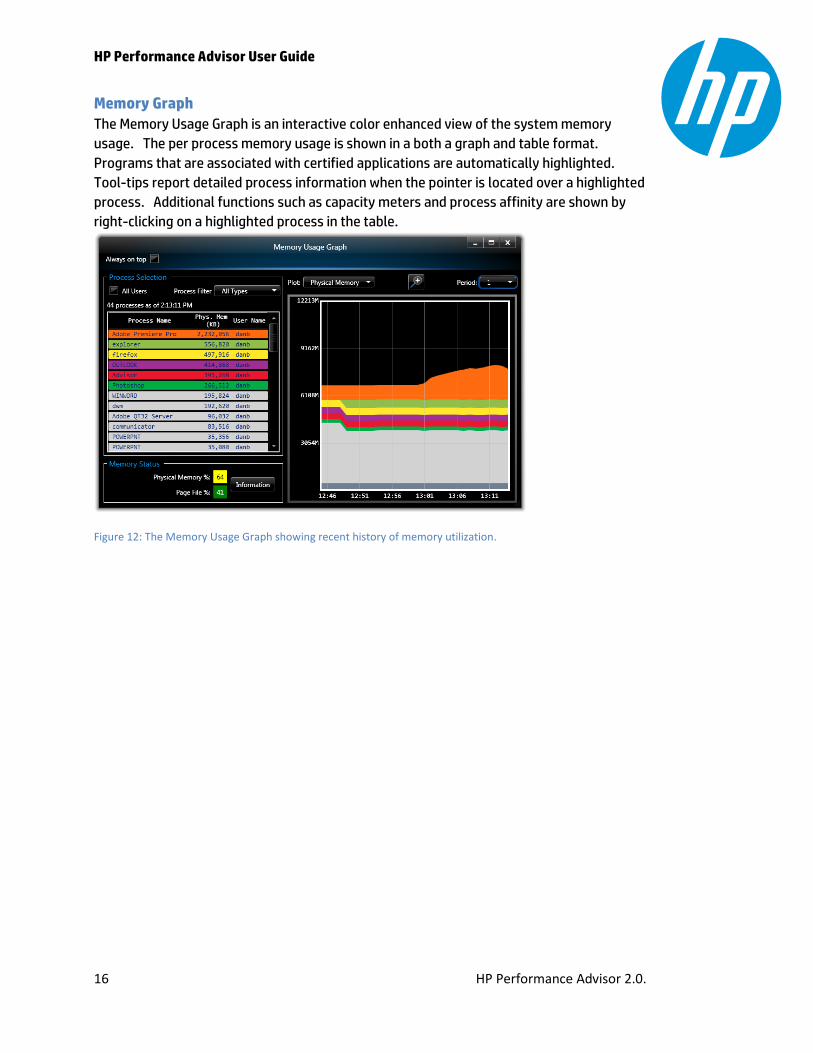
Memory Graph
The Memory Usage Graph is an interactive color enhanced view of the system memory
usage. The per process memory usage is shown in a both a graph and table format.
Programs that are associated with certified applications are automatically highlighted.
Tool-tips report detailed process information when the pointer is located over a highlighted
process. Additional functions such as capacity meters and process affinity are shown by
right-clicking on a highlighted process in the table.
Figure 12: The Memory Usage Graph showing recent history of memory utilization.
HP Performance Advisor User Guide
17 HP Performance Advisor 2.0.
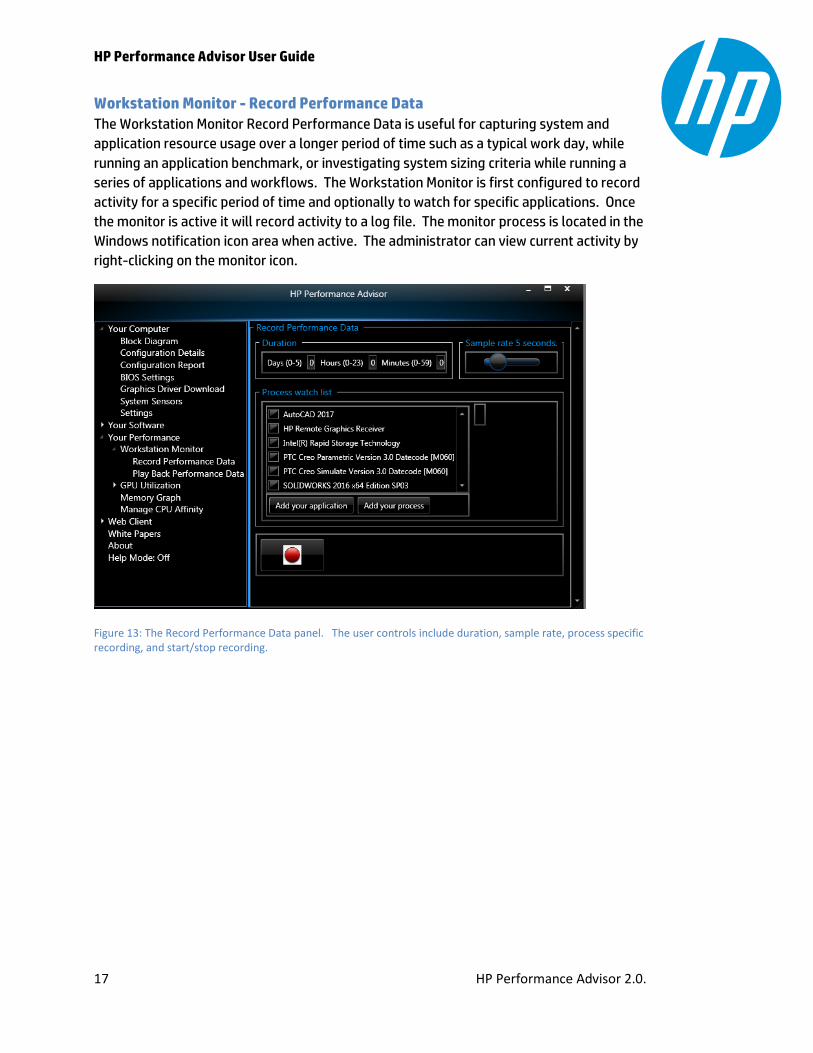
Workstation Monitor - Record Performance Data
The Workstation Monitor Record Performance Data is useful for capturing system and
application resource usage over a longer period of time such as a typical work day, while
running an application benchmark, or investigating system sizing criteria while running a
series of applications and workflows. The Workstation Monitor is first configured to record
activity for a specific period of time and optionally to watch for specific applications. Once
the monitor is active it will record activity to a log file. The monitor process is located in the
Windows notification icon area when active. The administrator can view current activity by
right-clicking on the monitor icon.
Figure 13: The Record Performance Data panel. The user controls include duration, sample rate, process specific recording, and start/stop recording.
HP Performance Advisor User Guide
18 HP Performance Advisor 2.0.
Workstation Monitor - Play back Performance Data
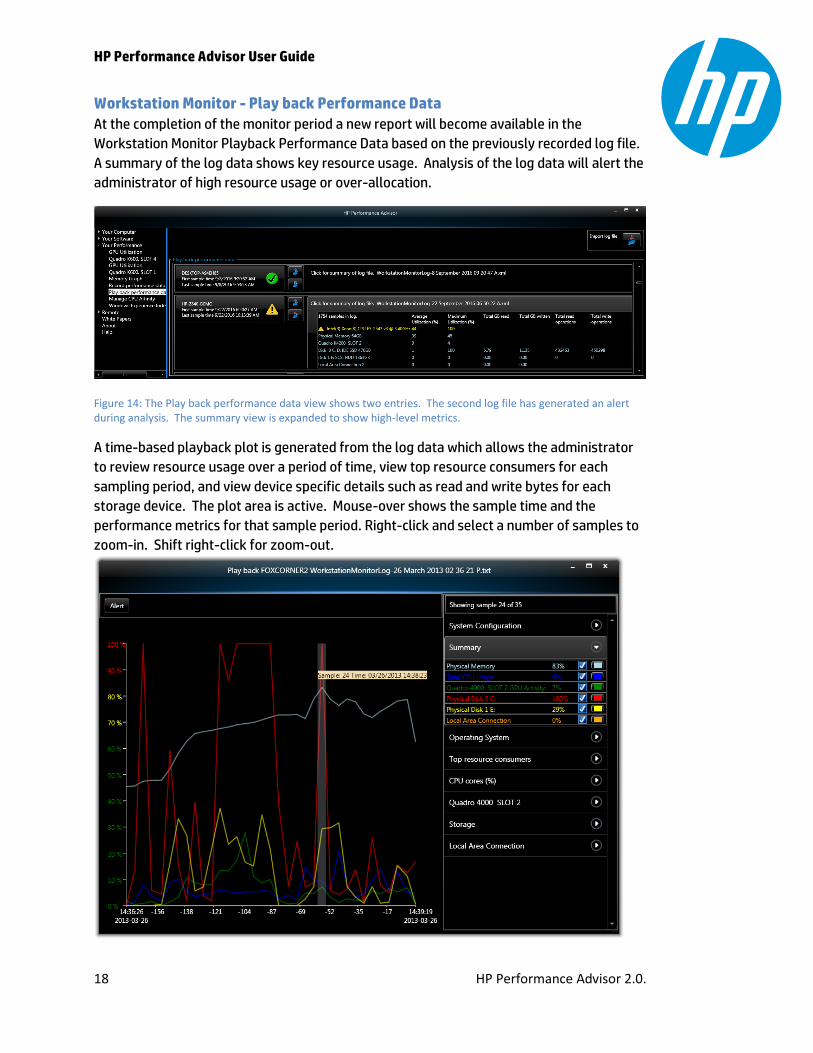
At the completion of the monitor period a new report will become available in the
Workstation Monitor Playback Performance Data based on the previously recorded log file.
A summary of the log data shows key resource usage. Analysis of the log data will alert the
administrator of high resource usage or over-allocation.
Figure 14: The Play back performance data view shows two entries. The second log file has generated an alert during analysis. The summary view is expanded to show high-level metrics.
A time-based playback plot is generated from the log data which allows the administrator
to review resource usage over a period of time, view top resource consumers for each
sampling period, and view device specific details such as read and write bytes for each
storage device. The plot area is active. Mouse-over shows the sample time and the
performance metrics for that sample period. Right-click and select a number of samples to
zoom-in. Shift right-click for zoom-out.

HP Performance Advisor User Guide
19 HP Performance Advisor 2.0.
Figure 15: A Workstation Monitor play back showing system activity. In this case, application performance was limited by the performance of the hard drive (red line).

HP Performance Advisor User Guide
20 HP Performance Advisor 2.0.
Manage CPU Affinity
The Manage CPU Affinity window allows you to allocate a subset of the logical processors to
a specific program or process. While HP Performance Advisor is running it will assign
processor affinity to the user-selected process that is currently active or to a new user-
selected process that becomes active.
Figure 16: The Manage CPU Affinity window showing per CPU core utilization. Followed by controls to manage process CPU affinity. In this case, application MicrosoftEdge.exe is currently active on the eligible CPU cores 2 through 4.

HP Performance Advisor User Guide
21 HP Performance Advisor 2.0.
Windows Experience Index
The Windows Experience Index is useful for establishing a base rating and then running it
periodically as new software, driver, OS, or hardware components are added or modified.
HP Performance Advisor exposes details of the WEI results showing specific sub-scores that
have been run on each of the main components. Windows Experience Index is supported on
Windows 7.
Figure 17: The Windows Experience Index window
HP Performance Advisor User Guide
22 HP Performance Advisor 2.0.
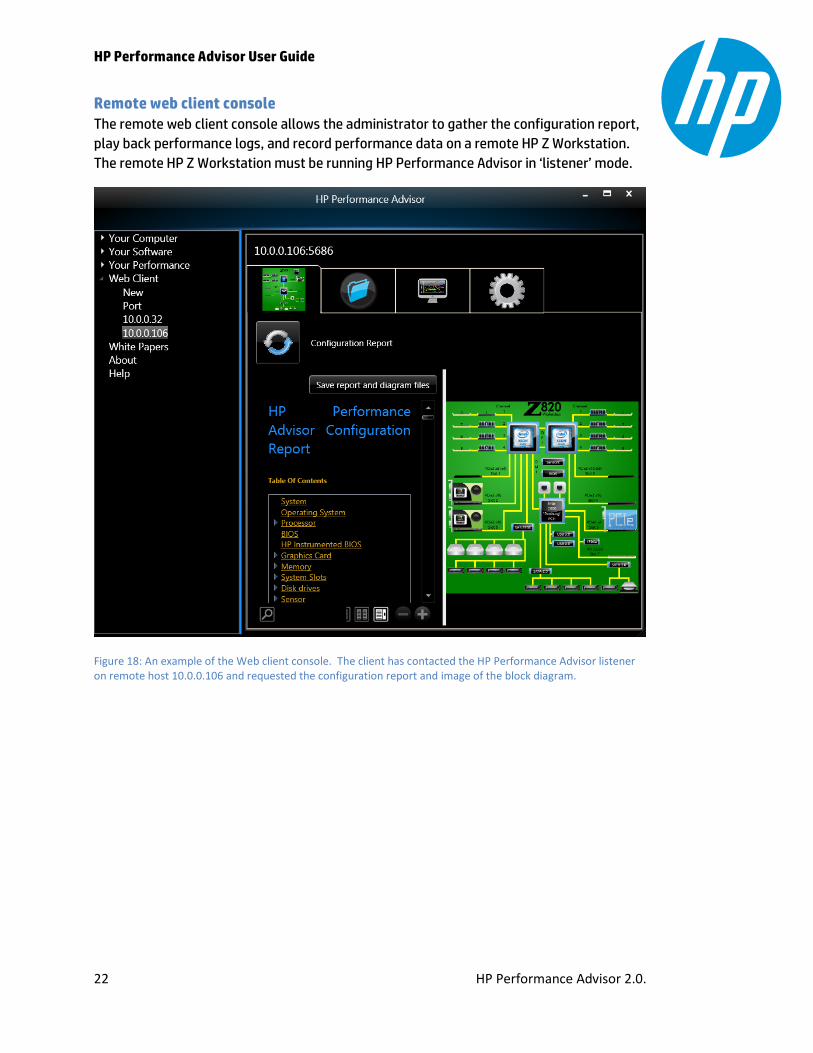
Remote web client console
The remote web client console allows the administrator to gather the configuration report,
play back performance logs, and record performance data on a remote HP Z Workstation.
The remote HP Z Workstation must be running HP Performance Advisor in ‘listener’ mode.
Figure 18: An example of the Web client console. The client has contacted the HP Performance Advisor listener on remote host 10.0.0.106 and requested the configuration report and image of the block diagram.
HP Performance Advisor User Guide
23 HP Performance Advisor 2.0.
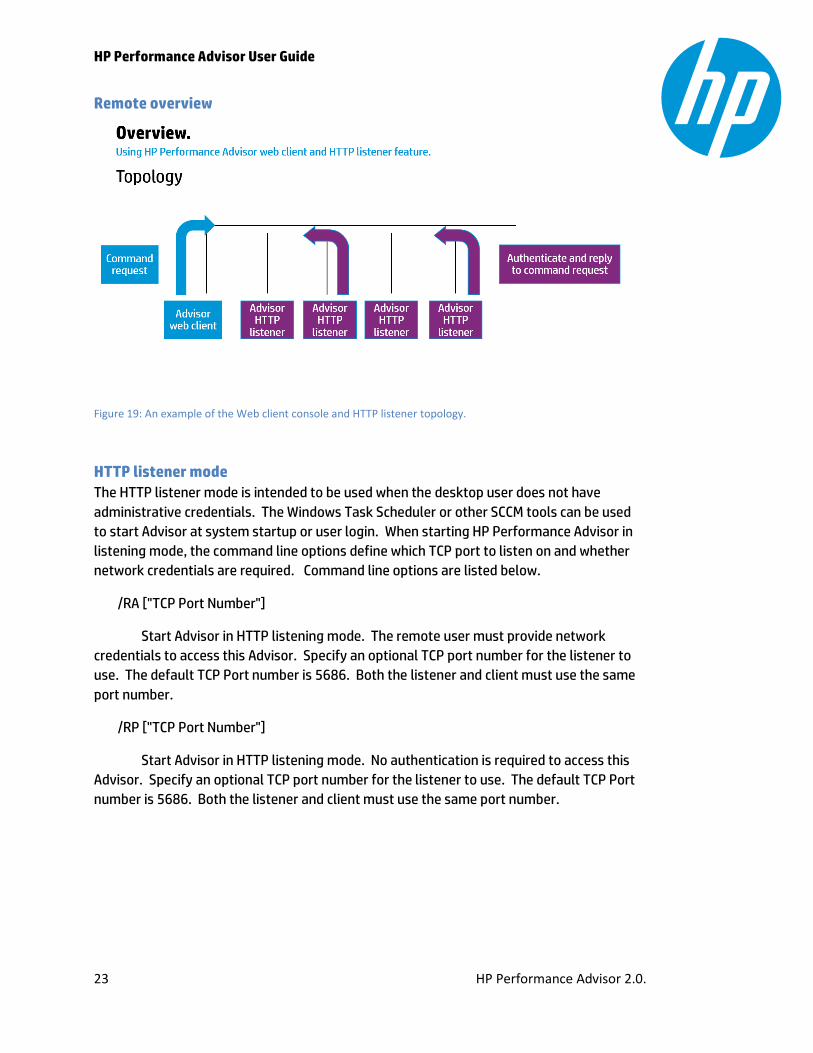
Remote overview
Figure 19: An example of the Web client console and HTTP listener topology.
HTTP listener mode
The HTTP listener mode is intended to be used when the desktop user does not have
administrative credentials. The Windows Task Scheduler or other SCCM tools can be used
to start Advisor at system startup or user login. When starting HP Performance Advisor in
listening mode, the command line options define which TCP port to listen on and whether
network credentials are required. Command line options are listed below.
/RA ["TCP Port Number"]
Start Advisor in HTTP listening mode. The remote user must provide network
credentials to access this Advisor. Specify an optional TCP port number for the listener to
use. The default TCP Port number is 5686. Both the listener and client must use the same
port number.
/RP ["TCP Port Number"]
Start Advisor in HTTP listening mode. No authentication is required to access this
Advisor. Specify an optional TCP port number for the listener to use. The default TCP Port
number is 5686. Both the listener and client must use the same port number.
HP Performance Advisor User Guide
24 HP Performance Advisor 2.0.
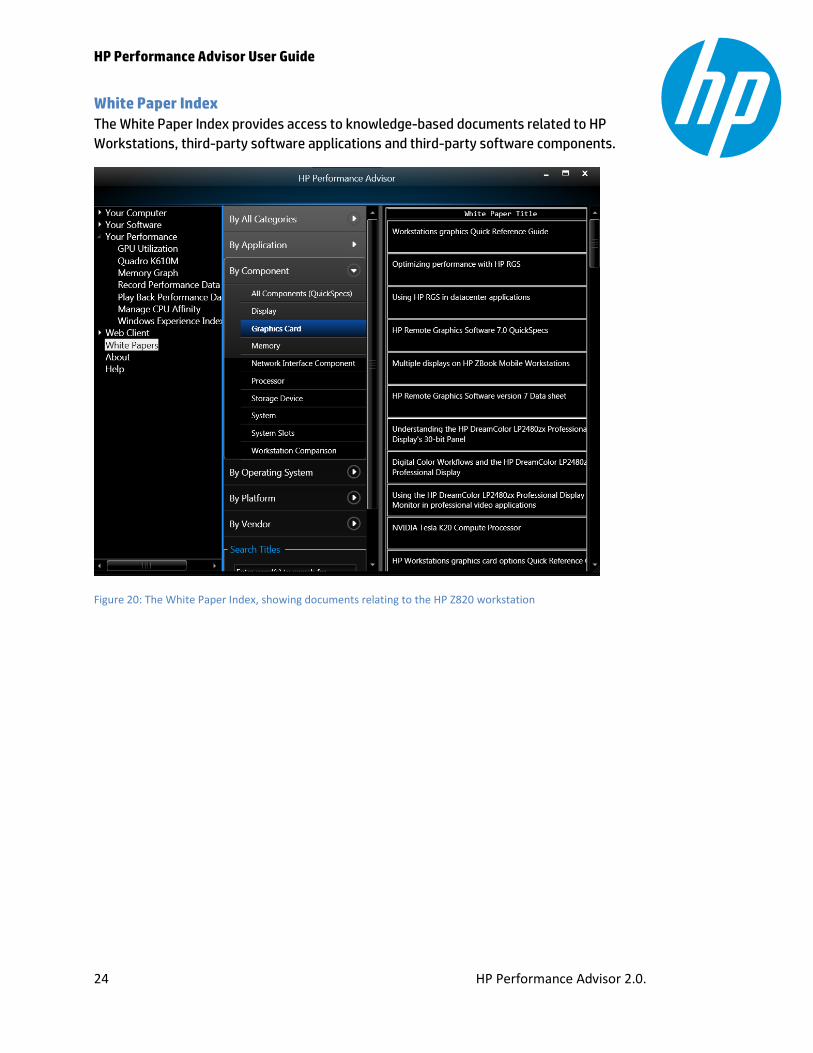
White Paper Index
The White Paper Index provides access to knowledge-based documents related to HP
Workstations, third-party software applications and third-party software components.
Figure 20: The White Paper Index, showing documents relating to the HP Z820 workstation
HP Performance Advisor User Guide
25 HP Performance Advisor 2.0.
Table of figures.
Figure 1: The notification icon displaying a portion of the task items. .................................... 6
Figure 2: The notification area displays reminders and information. ....................................... 6
Figure 3: An example of a Z840 Block Diagram ......................................................................... 7
Figure 4: The Configuration Details view .................................................................................. 8
Figure 5: The Configuration Report view. ................................................................................. 9
Figure 6: System BIOS management window ......................................................................... 10
Figure 7: The graphics driver download page displays a list of applicable drivers for your
system...................................................................................................................................... 11
Figure 8: The hardware sensor information window for a Z840 with both CPU sockets
enabled. ................................................................................................................................... 12
Figure 9: The "Show All Supported Software Vendors" enabled. ........................................... 13
Figure 10: Application window showing recommended BIOS settings, and graphics driver
certification status. .................................................................................................................. 14
Figure 11: The GPU Utilization window showing activity on the NVIDIA Quadro graphics card.
................................................................................................................................................. 15
Figure 12: The Memory Usage Graph showing recent history of memory utilization. ........... 16
Figure 13: The Record Performance Data panel. The user controls include duration, sample
rate, process specific recording, and start/stop recording. .................................................... 17
Figure 14: The Play back performance data view shows two entries. The second log file has
generated an alert during analysis. The summary view is expanded to show high-level
metrics. .................................................................................................................................... 18
Figure 15: A Workstation Monitor play back showing system activity. In this case, application
performance was limited by the performance of the hard drive (red line). ........................... 19
Figure 16: The Manage CPU Affinity window showing per CPU core utilization. Followed by
controls to manage process CPU affinity. In this case, application MicrosoftEdge.exe is
currently active on the eligible CPU cores 2 through 4. .......................................................... 20
Figure 17: The Windows Experience Index window ................................................................ 21
Figure 18: An example of the Web client console. The client has contacted the HP
Performance Advisor listener on remote host 10.0.0.106 and requested the configuration
report and image of the block diagram. .................................................................................. 22
Figure 19: An example of the Web client console and HTTP listener topology. ..................... 23
Figure 20: The White Paper Index, showing documents relating to the HP Z820 workstation
................................................................................................................................................. 24


![HP Z210 SFF Workstationisvpatch.external.hp.com/Advisor/drvlib/docs/Z210SFF.pdfForm Factor Small Form Factor Operating Systems Preinstalled: Genuine Windows® 7 Ultimate 64-bit] QuickSpecs](https://img.pdfslide.us/doc/110x75/5f2d4dd29135a0292c2b1a97/hp-z210-sff-form-factor-small-form-factor-operating-systems-preinstalled-genuine.jpg)