Embed Size (px)
Citation preview
HP Project and Portfolio Management CenterSoftware Version: 9.20
Deployment Best Practices Guide
Document Release Date: February 2013
Software Release Date: February 2013

Legal Notices
Warranty
The only warranties for HP products and services are set forth in the express warranty statements accompanying such products and services. Nothing herein should be construed as constituting an additional warranty. HP shall not be liable for technical or editorial errors or omissions contained herein.
The information contained herein is subject to change without notice.
Restricted Rights Legend
Confidential computer software. Valid license from HP required for possession, use or copying. Consistent with FAR 12.211 and 12.212, Commercial Computer Software, Computer Software Documentation, and Technical Data for Commercial Items are licensed to the U.S. Government under vendor's standard commercial license.
Copyright Notices
© Copyright 1997-2013 Hewlett-Packard Development Company, L.P.
Trademark Notices
Adobe® is a trademark of Adobe Systems Incorporated.
Intel®, Intel® Itanium®, Intel® Xeon®, and Pentium® are trademarks of Intel Corporation in the U.S. and other countries.
Microsoft®, Windows®, Windows® XP, and Windows Vista® are U.S. registered trademarks of Microsoft Corporation.
Oracle and Java are registered trademarks of Oracle and/or its affiliates.
UNIX® is a registered trademark of The Open Group.
2
Documentation Updates
This manual’s title page contains the following identifying information:
Software version number, which indicates the software version
Document release date, which changes each time the document is updated
Software release date, which indicates the release date of this version of the software
To check for recent updates, or to verify that you are using the most recent edition of a document, go to:
h20230.www2.hp.com/selfsolve/manuals
You will also receive updated or new editions if you subscribe to the appropriate product support service. Contact your HP sales representative for details.
3

Support
You can visit the HP Software Support Web site at:
hp.com/go/hpsoftwaresupport
HP Software Support Online provides an efficient way to access interactive technical support tools. As a valued support customer, you can benefit by using the support site to:
Search for knowledge documents of interest
Submit and track support cases and enhancement requests
Download software patches
Manage support contracts
Look up HP support contacts
Review information about available services
Enter into discussions with other software customers
Research and register for software training
Most of the support areas require that you register as an HP Passport user and sign in. Many also require a support contract.
To find more information about access levels, go to:
h20230.www2.hp.com/new_access_levels.jsp
To register for an HP Passport ID, go to:
h20229.www2.hp.com/passport-registration.html
4
Contents
1 Introduction . . . . . . . . . . . . . . . . . . . . . . . . . . . . . . . . . . . . . . . . . . . . . . . . . . . . . . . . . . . . . . . . . . . . . . . . . . . . . . . 7
PPM Center Configuration . . . . . . . . . . . . . . . . . . . . . . . . . . . . . . . . . . . . . . . . . . . . . . . . . . . . . . . . . . . . . . . . . . . 8
Server Cluster Configuration. . . . . . . . . . . . . . . . . . . . . . . . . . . . . . . . . . . . . . . . . . . . . . . . . . . . . . . . . . . . . . . 8
2 Deployment Recommendations . . . . . . . . . . . . . . . . . . . . . . . . . . . . . . . . . . . . . . . . . . . . . . . . . . . . . . . . . . . . . . 11
Services Isolation . . . . . . . . . . . . . . . . . . . . . . . . . . . . . . . . . . . . . . . . . . . . . . . . . . . . . . . . . . . . . . . . . . . . . . . . . 12
Optimizing Services for Your Deployment . . . . . . . . . . . . . . . . . . . . . . . . . . . . . . . . . . . . . . . . . . . . . . . . . . . . . 13
Background Service Scheduling . . . . . . . . . . . . . . . . . . . . . . . . . . . . . . . . . . . . . . . . . . . . . . . . . . . . . . . . . . . 13
Schedule Services Page . . . . . . . . . . . . . . . . . . . . . . . . . . . . . . . . . . . . . . . . . . . . . . . . . . . . . . . . . . . . . . . 14
Running Heavy Services . . . . . . . . . . . . . . . . . . . . . . . . . . . . . . . . . . . . . . . . . . . . . . . . . . . . . . . . . . . . . . 14
Load Balancing . . . . . . . . . . . . . . . . . . . . . . . . . . . . . . . . . . . . . . . . . . . . . . . . . . . . . . . . . . . . . . . . . . . . . . . . . . . 15
Configuring PPM Center with a Load Balancer . . . . . . . . . . . . . . . . . . . . . . . . . . . . . . . . . . . . . . . . . . . . . . . 15
Application Server. . . . . . . . . . . . . . . . . . . . . . . . . . . . . . . . . . . . . . . . . . . . . . . . . . . . . . . . . . . . . . . . . . . . . . . . . 16
PPM Server in a Virtualized Environment . . . . . . . . . . . . . . . . . . . . . . . . . . . . . . . . . . . . . . . . . . . . . . . . . . . . . . 17
Web Tier . . . . . . . . . . . . . . . . . . . . . . . . . . . . . . . . . . . . . . . . . . . . . . . . . . . . . . . . . . . . . . . . . . . . . . . . . . . . . . . . 18
External Web Server Configuration . . . . . . . . . . . . . . . . . . . . . . . . . . . . . . . . . . . . . . . . . . . . . . . . . . . . . . . . 18
PPM Server Memory Management. . . . . . . . . . . . . . . . . . . . . . . . . . . . . . . . . . . . . . . . . . . . . . . . . . . . . . . . . . . . 19
Watchdog Tool . . . . . . . . . . . . . . . . . . . . . . . . . . . . . . . . . . . . . . . . . . . . . . . . . . . . . . . . . . . . . . . . . . . . . . . . 19
Heap Sizing . . . . . . . . . . . . . . . . . . . . . . . . . . . . . . . . . . . . . . . . . . . . . . . . . . . . . . . . . . . . . . . . . . . . . . . . . . . 20
Portlet Performance. . . . . . . . . . . . . . . . . . . . . . . . . . . . . . . . . . . . . . . . . . . . . . . . . . . . . . . . . . . . . . . . . . . . . . . . 21
Workflow Configuration and Performance. . . . . . . . . . . . . . . . . . . . . . . . . . . . . . . . . . . . . . . . . . . . . . . . . . . . . . 24
Preproduction Performance Testing . . . . . . . . . . . . . . . . . . . . . . . . . . . . . . . . . . . . . . . . . . . . . . . . . . . . . . . . . . . 25
3 Monitoring PPM Center Performance . . . . . . . . . . . . . . . . . . . . . . . . . . . . . . . . . . . . . . . . . . . . . . . . . . . . . . . . . 27
Post-Deployment Performance Monitoring . . . . . . . . . . . . . . . . . . . . . . . . . . . . . . . . . . . . . . . . . . . . . . . . . . . . . 28
PPM Center Factors to Monitor and Track . . . . . . . . . . . . . . . . . . . . . . . . . . . . . . . . . . . . . . . . . . . . . . . . . . . . . . 29
Workload Considerations and Capacity Planning. . . . . . . . . . . . . . . . . . . . . . . . . . . . . . . . . . . . . . . . . . . . . . . . . 31
Monitoring and Analysis Tools. . . . . . . . . . . . . . . . . . . . . . . . . . . . . . . . . . . . . . . . . . . . . . . . . . . . . . . . . . . . . . . 32
5
PPM Center Monitors . . . . . . . . . . . . . . . . . . . . . . . . . . . . . . . . . . . . . . . . . . . . . . . . . . . . . . . . . . . . . . . . . . . . . . 33
Action Monitor . . . . . . . . . . . . . . . . . . . . . . . . . . . . . . . . . . . . . . . . . . . . . . . . . . . . . . . . . . . . . . . . . . . . . . . . 33
Portlet Monitor . . . . . . . . . . . . . . . . . . . . . . . . . . . . . . . . . . . . . . . . . . . . . . . . . . . . . . . . . . . . . . . . . . . . . . . . 33
Server Performance Reports . . . . . . . . . . . . . . . . . . . . . . . . . . . . . . . . . . . . . . . . . . . . . . . . . . . . . . . . . . . . . . 34
Background Services Monitor . . . . . . . . . . . . . . . . . . . . . . . . . . . . . . . . . . . . . . . . . . . . . . . . . . . . . . . . . . . . . 34
Services Audit Results Page . . . . . . . . . . . . . . . . . . . . . . . . . . . . . . . . . . . . . . . . . . . . . . . . . . . . . . . . . . . . . . 34
4 Solution Configurations and Customer Examples . . . . . . . . . . . . . . . . . . . . . . . . . . . . . . . . . . . . . . . . . . . . . . . 35
Solution Configurations . . . . . . . . . . . . . . . . . . . . . . . . . . . . . . . . . . . . . . . . . . . . . . . . . . . . . . . . . . . . . . . . . . . . 35
Solution Configuration 1 . . . . . . . . . . . . . . . . . . . . . . . . . . . . . . . . . . . . . . . . . . . . . . . . . . . . . . . . . . . . . . . . . 36
Solution Configuration 2 . . . . . . . . . . . . . . . . . . . . . . . . . . . . . . . . . . . . . . . . . . . . . . . . . . . . . . . . . . . . . . . . . 38
Solution Configuration 3 . . . . . . . . . . . . . . . . . . . . . . . . . . . . . . . . . . . . . . . . . . . . . . . . . . . . . . . . . . . . . . . . . 39
Examples from the Field . . . . . . . . . . . . . . . . . . . . . . . . . . . . . . . . . . . . . . . . . . . . . . . . . . . . . . . . . . . . . . . . . . . . 41
Customer 1 Example . . . . . . . . . . . . . . . . . . . . . . . . . . . . . . . . . . . . . . . . . . . . . . . . . . . . . . . . . . . . . . . . . . . . 41
Customer 2 Example . . . . . . . . . . . . . . . . . . . . . . . . . . . . . . . . . . . . . . . . . . . . . . . . . . . . . . . . . . . . . . . . . . . . 42
Customer 3 Example . . . . . . . . . . . . . . . . . . . . . . . . . . . . . . . . . . . . . . . . . . . . . . . . . . . . . . . . . . . . . . . . . . . . 43
Index . . . . . . . . . . . . . . . . . . . . . . . . . . . . . . . . . . . . . . . . . . . . . . . . . . . . . . . . . . . . . . . . . . . . . . . . . . . . . . . . . . . . . . 45
6
1 Introduction
Hewlett-Packard (HP) is committed to helping you deliver optimal performance for your PPM Center implementation. To that end, HP has built a team devoted solely to performance work. That team is call the Performance Center of Excellence (PCoE). To help you get the most out of PPM Center, the PCoE, along with other teams and customers, has compiled a set of recommendations, best practices, and examples, which are described in this document.
You can optimize PPM Center performance using many methods. Much of the detailed information about performance tuning and configuration is addressed in depth in the Installation and Administration Guide.
7
PPM Center Configuration
Because PPM Center is extremely flexible, you can configure it to meet the demands of your organization. Your configuration choices can improve user load distribution, transaction capacity, and system performance. The degree of improvement depends on many factors, including available resources.
PPM Center configurations require the following:
Server Cluster Configuration
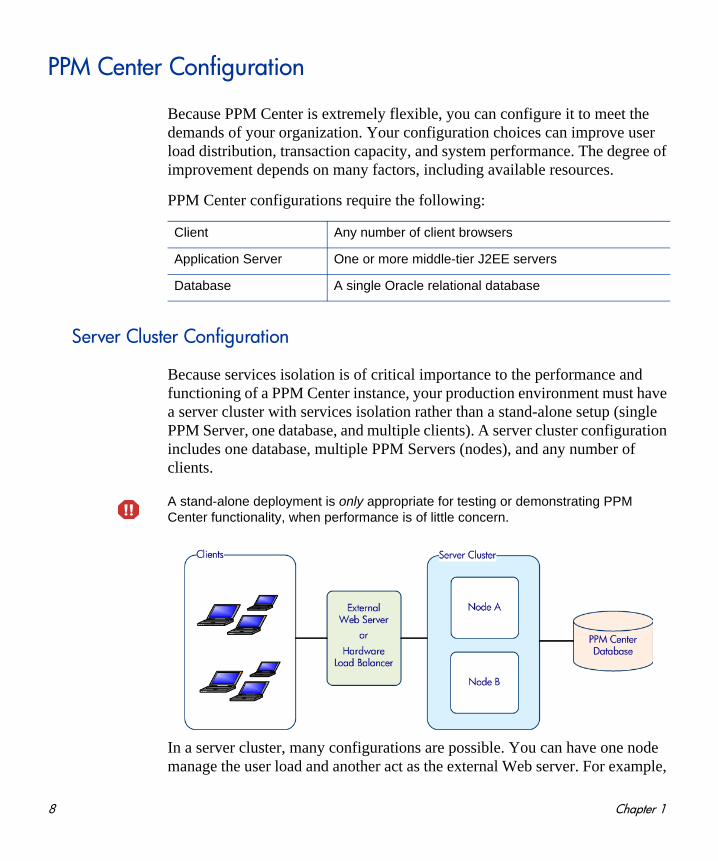
Because services isolation is of critical importance to the performance and functioning of a PPM Center instance, your production environment must have a server cluster with services isolation rather than a stand-alone setup (single PPM Server, one database, and multiple clients). A server cluster configuration includes one database, multiple PPM Servers (nodes), and any number of clients.
In a server cluster, many configurations are possible. You can have one node manage the user load and another act as the external Web server. For example,
Client Any number of client browsers
Application Server One or more middle-tier J2EE servers
Database A single Oracle relational database
A stand-alone deployment is only appropriate for testing or demonstrating PPM Center functionality, when performance is of little concern.
8 Chapter 1

you could have multiple nodes, each on a separate machine, an external Web server on a dedicated machine, and the Oracle database on yet another machine.
The program code, reports, execution logs, and attachments files can reside on any of the machines in your PPM Center configuration. The Oracle database stores all other data.
The number of machines you use and where you place the various components is up to you and the needs of your company. There are no additional PPM Center licensing charges for using multiple nodes or Web servers.
HP recommends that instead of relying on PPM Center’s internal web server, you configure an external Web server to use with PPM Center. For a list of supported web servers, see the System Requirements and Compatibility Matrix document.
Introduction 9

10 Chapter 1
2 Deployment Recommendations
Your deployment options and configuration choices can significantly affect PPM Center performance. HP recommends that you read this chapter and that you set up a test implementation to determine how to best deploy your PPM Center system.
11
Services Isolation
PPM Center has many asynchronous background services that process data “behind the scenes” while the application is running. Depending on data characteristics of your PPM Center deployment, the overhead of these services in terms of CPU and memory demand are difficult to estimate. To reduce the impact of services on user response times, HP strongly recommends that you isolate the services on a separate JVM within the PPM Center server cluster.
Services isolation does not require isolation of services onto separate physical servers. A node that you dedicate to services can reside on the same machine that hosts nodes handling user traffic. Even in a shared host model, there is benefit if higher performance-risk services, which tend to be CPU-bound on the application tier, have a separate node.
PPM Center server clustering does not differentiate between primary or backup nodes in terms of configuration. The first node to start up attempts to be the “service primary.” If a node that is considered to be a “backup” starts first, then it is the primary. The objective is to earmark a subset of nodes in the server cluster as services-capable. All of the nodes are peers, and “ownership” of services is based simply on startup order.
HP recommends that you devote at least one PPM Center node to process PPM Center background services. (For an example, see Solution Configuration 1 on page 36.)
Dedicating one PPM Center node to your services enables you to:
Minimize the effect that running PPM Center services has on users
Better monitor the performance of the services
The more you monitor and understand how your services affect performance, the better you can tune them.
If a node that is running services fails, one of the other nodes enabled to run services assumes the role of primary. If the node that failed is restarted, services will not automatically “fallback” to that node. To return services ownership to the node that failed and is restarted, you must stop, and then restart the node that took over services execution from the original services node.
12 Chapter 2
Optimizing Services for Your Deployment
PPM Center services are shipped with default settings that may not be ideal for your particular implementation. HP recommends that you test various combinations of settings, as needed, to determine what is best for your implementation.
The number and type of PPM Center services running may be more than you need. The need to run a given service is based on how well the functionality of that service meets business needs. Among required services, some might be running more often than is necessary, while other services might not be running as frequently as the business requires.
Determine the number and frequency of individual services that you select for execution based on your organization’s needs. The goal is to run services at an appropriate frequency to provide timely delivery of the underlying application that the service provides. To reduce load on the system, avoid scheduling services to run more frequently than necessary.
Background Service Scheduling
PPM Center background services are classified as belonging to either the heavy or light workload category. For a PPM Center node running background services, a preconfigured level of concurrency is maintained for heavy and light services. This approach to workload distribution reduces the impact of concurrently running services that demand significant system resources.
After you deploy PPM Center, you can reconfigure the level of concurrency for heavy and light services. HP recommends that, after you first deploy PPM Center, you use the default services concurrency configuration, and adjust up or down thereafter to better address the business needs and performance objectives for your environment.
Before you increase service concurrency or allocate additional nodes to handle background processing, verify that PPM Center services are successfully processing data. Exceptions in processing the data backlog can result in unexpected performance issues.
Deployment Recommendations 13
Schedule Services Page
The Schedule Services page, which you access from the PPM Center standard interface, lists all of the available services, whether the service is enabled, the type of expression used to schedule the service, and the current run schedule. From the Schedule Services page, you can enable, disable, and schedule the execution of PPM Center background services without having to restart your PPM Server node processing services.
For recommendations for running PPM Center background services and instructions on how to open and use the Schedule Services page, see the Installation and Administration Guide.
Running Heavy Services
The server.conf file is configured so that only one heavy PPM Center service can be run at any given time. This is enforced by having the values for the HEAVY_QUEUE_MAX_CONCURRENT_CONSUMERS and HEAVY_QUEUE_CONCURRENT_CONSUMERS parameters set to 1 by default.
Although restricting heavy services to run one at a time is recommended, these low settings can be too restrictive. If listeners are unavailable and heavy services are scheduled in a certain way, some services may never run.
To run heavy services, HP recommends the following:
Set a higher value, such as 6, for the HEAVY_QUEUE_MAX_CONCURRENT_CONSUMERS and HEAVY_QUEUE_CONCURRENT_CONSUMERS parameters.
Do not schedule a time-consuming heavy service to run at more frequent intervals than its expected run time.
Schedule no more frequent runs of heavy services than there are heavy consumers available.
14 Chapter 2
Load Balancing
If more than one node supports user traffic within a PPM Center instance, the incoming PPM Center requests must be load-balanced across the nodes using one of the following methods:
Software Load Balancing using the Tomcat connector running with a PPM Center compatible external Web server
Hardware Load Balancing using a physical hardware load balancer
You can configure load balancing and server failover features to realize performance gains and improve application availability.
Configuring PPM Center with a Load Balancer
If you have a load balancer that receives https requests and connects to nodes through http requests, then, to enable the nodes to correctly perform redirects, you must edit the server.xsl file.
To edit the server.xsl file:
1. Open the server.xsl file, which is located in the <PPM_Home>/conf/jboss directory.
2. Edit the file content as follows:<Connector ...><!--- assuming users connect to the proxy via https --><xsl:attribute name="scheme">https</xsl:attribute><xsl:attribute name="proxyName">proxyname.domain.com
</xsl:attribute><!-- assuming users connect to the proxy over port 443 --><xsl:attribute name="proxyPort">443</xsl:attribute></Connector>
Keep in mind that this scenario assumes that PPM Server nodes receive no direct requests. All requests must come through the load balancer.
One of the attributes is named “scheme,” and not “proxyScheme.” The JBoss Connector listens for https or http based on the secure attribute. If you leave the secure attribute untouched, this configuration works well.
Deployment Recommendations 15
Application Server
HP recommends the following for PPM Servers:
Processors equivalent to current generation 2.66-3.00 GHz Intel® Xeon® multi-core processors (dual-core or quad-core).
Minimum of 2 CPU cores per host to best support multi-threaded nature of PPM Center
JVM heap size of 1280 MB. (This is the default.) Under heavy load, a JVM running with a 1280-MB heap consumes upward of 1500 MB, including native area code.
Provision hardware to support 1.5 GB of RAM for each PPM Center node in a server cluster.
If clients access PPM Center over a wide area network (WAN), enable both dynamic asset compression and keepalive on the external Web server.
16 Chapter 2

PPM Server in a Virtualized Environment
When deploying PPM Server in a certified virtual server environment, the following performance best practices apply:
Set the memory (RAM) and CPU entitlement for the virtual machine as recommended in the production sizing guidelines. Provide the same memory (RAM) and CPU entitlement that you would if you were to deploy PPM Center on a physical host.
Ideally, provide enough CPU and memory at the physical host layer to meet the full entitlement as exposed to the consolidated virtual machines.
PPM Center is an enterprise application that runs inside Java Virtual Machines (JVMs). JVM memory management performance is optimized when the Java heap setting is maintained at a constant value (-Xms = -Xmx). This prevents unnecessary full garbage collection cycles, which require that you resize the overall heap and associated memory subregions.
JVM object management ergonomics assume that all heap memory is loaded in physical memory, although this is mapped as virtual memory at the operating system level, actively utilizing the entire heap address space. Performance is optimized when the entire heap can remain in physical memory. For virtualized environments, this requires that enough physical memory is available to prevent excessive paging on the supported virtual machines.
Deployment Recommendations 17
Web Tier
If you use the internal Web server provided with PPM Center, there is no need to configure it. However, if you must use an external Web server because of firewall requirements, single sign-on (SSO), or Web tier clustering, then follow the configuration recommendations described in External Web Server Configuration on page 18.
If redundancy is required at the Web tier, then you must use a hardware or software load balancer to distribute incoming traffic. You can use a hardware load balancer in the absence of a separate PPM Center Web tier if SSO or other requirements do necessitate the Web server.
External Web Server Configuration
If your PPM Center deployment includes an external Web server, then you must use the following optimizations:
Enable dynamic content compression on the Web server
For example, on Apache, enable the mod_deflate module. On Microsoft Internet Information Services (IIS), enable native compression. For detailed information, see the Installation and Administration Guide.
Enable keepalive
Some Web servers disable keepalive. For example, Apache mod_ssl (HTTPS) disables keepalive for Microsoft Internet Explorer by default. If you are running Apache and mod_ssl to provide HTTPS support, you must make sure that keepalive is enabled.
Disable cache-control header interference
For example, on Apache, enable mod_expires.
18 Chapter 2
PPM Server Memory Management
A node in a PPM Center server cluster runs in the context of a single Java Virtual Machine (JVM). HP recommends that you use a server cluster configuration, with multiple nodes, to improve reliability and performance.
Using multiple nodes in your configuration enables you to do the following:
Support increased user load
Improve capacity
Maintain and provide acceptable performance
You can increase the capacity of a PPM Center instance by adding more PPM Center nodes. To meet the availability needs of the organization, you can distribute these nodes in the PPM Center cluster across one or more physical hosts.
Watchdog Tool
PPM Center provides a stand-alone tool named Watchdog, which monitors the memory space through the GC log that the PPM Server generates. If the memory used after garbage collection is greater than a set threshold value, the Watchdog issues a command to generate a thread dump, and the thread dump is captured in the server log. You can configure the Watchdog tool to send out email notifications about this event.
HP recommends that you enable Watchdog as a diagnostic tool only if memory issues are surfacing in your PPM Center instance. For detailed information about the Watchdog, including instructions on how to use it, see the Installa-tion and Administration Guide.
Watchdog is not supported on AIX operating systems.
Deployment Recommendations 19
Heap Sizing
Heap sizing is another factor that, together with garbage collection and memory usage, influences PPM Center performance. You can tune heap usage to reduce the number of full garbage collection events that occur during any given time period. In most cases, however, the gains realized are not sufficient to justify the effort required to do this.
Full garbage collections are a normal, regularly-occurring JVM event and are not in and of themselves indicative of a performance problem. If you suspect that full garbage collection events are taking too much time, then investigate the issue and resolve it, if necessary.
To control how frequently full garbage collection occurs, maintain a static amount of memory capacity on the heap for a given workload. Make sure that the amount of memory you allocate to the heap is sufficient to avoid a series of closely-spaced full garbage collections. (This requires regular monitoring of memory usage on the JVM.) Distribute users across additional PPM Servers or increase the amount allocated to heap, as necessary.
The amount of memory allocated to the heap by default for a PPM Server is defined in application configuration files.
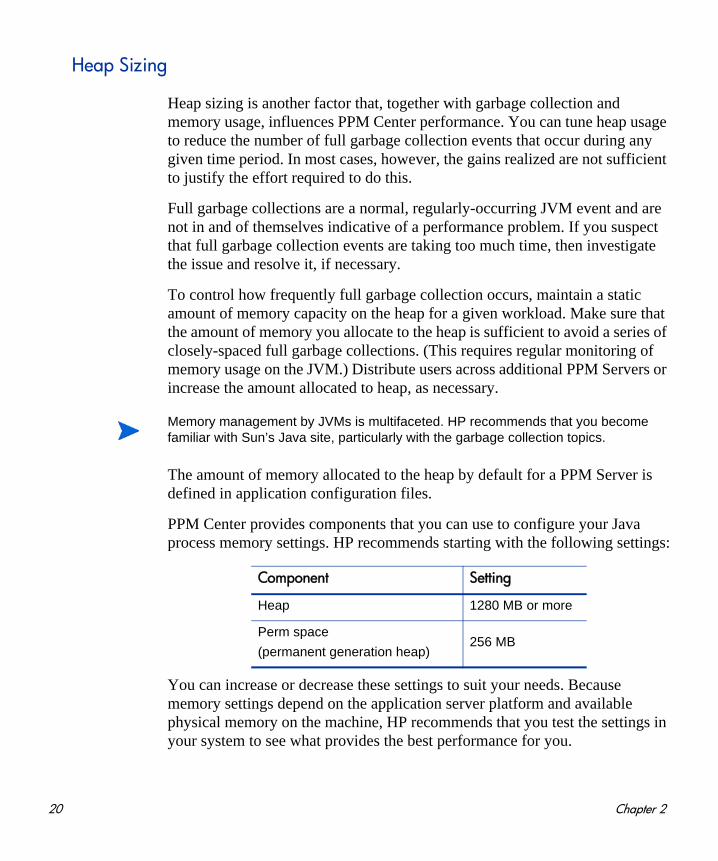
PPM Center provides components that you can use to configure your Java process memory settings. HP recommends starting with the following settings:
You can increase or decrease these settings to suit your needs. Because memory settings depend on the application server platform and available physical memory on the machine, HP recommends that you test the settings in your system to see what provides the best performance for you.
Memory management by JVMs is multifaceted. HP recommends that you become familiar with Sun’s Java site, particularly with the garbage collection topics.
Component Setting
Heap 1280 MB or more
Perm space
(permanent generation heap)256 MB
20 Chapter 2
For example, if you have a single PPM Center application on a Windows server that has at least 2 GB of free RAM available for PPM Center, then use the following settings:
com.kintana.core.server.SERVER_MAX_HEAP_SIZE=1280mcom.kintana.core.server.SERVER_INIT_HEAP_SIZE=1280mcom.kintana.core.server.SERVER_MAX_PERM_SIZE=256m
To scale PPM Center as you add users and load to your system, configure server clusters and introduce additional PPM Center nodes (instead of simply increasing the heap size).
Portlet Performance
The load time for portlets on PPM Dashboard pages can affect the system performance for other users logged on to PPM Center. To significantly improve PPM Center performance, do the following:
To avoid queries that degrade performance, add mandatory portlet filters.
Multiple portlets are loaded concurrently on PPM Dashboard pages, with multiple threads within a PPM Center node asynchronously fetching portlet data. PPM Dashboard that consist of many portlets, or portlets that take a long time to run, can place heavy demands on the application-managed database connection pool. This can result from the database-heavy nature of many portlets.
You can use the Portlet-Thread-Batch-Size server configuration parameter to restrict the demand that any single user session can place on a connection pool. This setting limits the number of portlets that can be loaded concurrently on any single PPM Dashboard page. The default setting is 4. HP recommends that, for most deployments, you retain the default setting and adjust it up or down only if performance indicates that
For detailed information about heap sizing and adding nodes to a server cluster, see the Installation and Administration Guide.
For instructions on how to set portlet filters, see the Getting Started document.
Deployment Recommendations 21
the adjustment would benefit PPM Center users and at the same time prevent excessive connection pool demand (saturation).
Make sure that any custom portlets you develop can return information in eight seconds or less (with the use of portlet filters) and that the result set consists of fewer than 100 rows.
Set the PPM Dashboard auto-refresh frequency to 60 minutes (30 minutes minimum).
Test the SQL and response time with large data sets.
Test the performance of all of your important and complex portlets. Include testing the execution plans for any custom portlets with different filter field combinations.
Avoid custom portlets that use several sequential SQL calls.
Every SQL call requires a new database connection. Consider combining calls into a database function or procedure to limit the number of connections required. Connections that PPM Center establishes and stores in the connection pool are not used.
If users report unacceptable PPM Dashboard loading times, HP recommends that you investigate the performance of the associated portlets before you modify the Portlet-Thread-Batch-Size parameter. Often, you can improve portlet performance by applying appropriate filters to portlets.
For instructions on how to apply filters to portlets, see the document Getting Started. For instructions on how to set the Portlet-Thread-Batch-Size parameter, see the Installation and Administration Guide.
For information on how to monitor and track portlet performance, see Portlet Monitor on page 33 and the Installation and Administration Guide.
22 Chapter 2
Leverage materialized views for custom portlets with complex SQL queries.
Materialized views can cause overhead on the database if used improperly. Pay special attention to the following:
o Time required to refresh the portlet
o Refresh interval
o Whether the requirement really calls for a materialized view
To determine the trade-offs and requirements of materialized views, consult your DBA.
If you must increase the maximum number of rows displayed in PPM Center portlets, make sure that you understand the performance impact of doing so. The server configuration parameter PORTLET_MAX_ROWS_RETURNED, which determines the default maximum number of rows, is a system-wide parameter. The default value is 200. HP recommends that you increase its value incrementally, 50 rows at a time.
If your portlet does not meet the suggested recommendations, develop a custom report.
For information about how to modify PPM Center server configuration parameters, see the Installation and Administration Guide.
Deployment Recommendations 23
Workflow Configuration and Performance
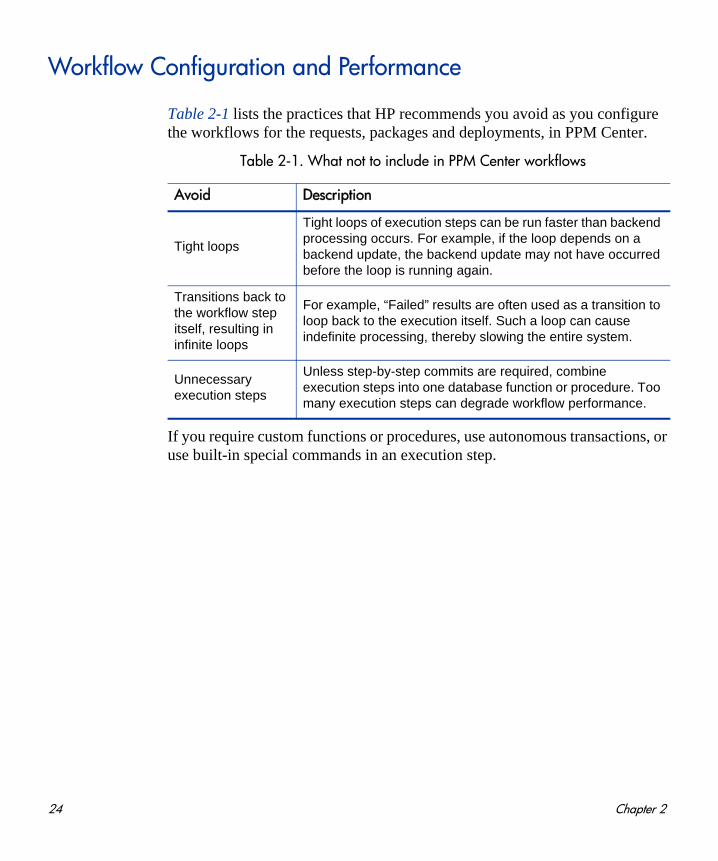
Table 2-1 lists the practices that HP recommends you avoid as you configure the workflows for the requests, packages and deployments, in PPM Center.
If you require custom functions or procedures, use autonomous transactions, or use built-in special commands in an execution step.
Table 2-1. What not to include in PPM Center workflows
Avoid Description
Tight loops
Tight loops of execution steps can be run faster than backend processing occurs. For example, if the loop depends on a backend update, the backend update may not have occurred before the loop is running again.
Transitions back to the workflow step itself, resulting in infinite loops
For example, “Failed” results are often used as a transition to loop back to the execution itself. Such a loop can cause indefinite processing, thereby slowing the entire system.
Unnecessary execution steps
Unless step-by-step commits are required, combine execution steps into one database function or procedure. Too many execution steps can degrade workflow performance.
24 Chapter 2
Preproduction Performance Testing
Make sure that you thoroughly test your PPM Center system before you make it available it to users. Design your tests to exercise the most frequently performed tasks and the most frequently used portlets and filters.
Load testing is the most important preproduction testing to perform, and the best way to predict the PPM Center system performance.
Make sure that your load testing simulates all of the following conditions:
Multiple users accessing the PPM Center user nodes concurrently
Simultaneous processing of large volumes of user input, such as might occur with time-sheet entry on the last day of a pay period
Running multiple application functions based on the functional areas you plan to implement
Retrieving large data sets
Because data sets vary (in terms of both entity volumes and characteristics) across most production deployments, you cannot always predict performance.
Hardware and configuration you plan to use for production
Testing under low-user, and even single-user, load can also be a good way to predict application performance for key operations. Single-user preproduction performance testing can have minimal effect on time lines and can be incorporated into the user acceptance test cycle or other preproduction tasks.
Deployment Recommendations 25
Critical use cases are also an important part of preproduction testing. HP recommends that you test actions that users perform frequently and that must perform acceptably for users to successfully complete their work. For example, if you implement HP Time Management, users must be able to log their time sheets efficiently with acceptable response times.
During functional or user-acceptance testing, make sure that all poor performance areas, no matter how trivial they seem, are investigated to avoid performance issues at production launch. It is always worthwhile to investigate performance concerns. Depending on the concern, you may choose to test the issue again in a staged version of your production environment or in a separate single-user load system.
26 Chapter 2

3 Monitoring PPM Center Performance
This chapter addresses areas that to routinely monitor for optimal performance of PPM Center. The chapter also provides some guidance on tools that can help you monitor and analyze for PPM Center system on an ongoing basis.
27
Post-Deployment Performance Monitoring
It is important to monitor the following for PPM Center:
CPU usage
Memory usage, especially on PPM Servers
Input/output (network and disk)
Monitoring physical system resource metrics over time can provide you with a view of available system capacity.
To accurately estimate the capacity of the PPM Server node to support the necessary workload, monitor metrics for memory usage. As PPM Center workload characteristics change over time, it is important to monitor memory usage on the PPM Servers to determine when basic memory demand increases. As a full garbage collection activity approaches a threshold that might compromise application performance, modify the PPM Server configuration s to support the new demands.
Because every system is unique, it is important that you monitor and trend memory usage for your system. HP recommends that you evaluate memory usage data collected over seven or more consecutive days. Periods of peak workload tend to have the highest memory demands on the heap.
28 Chapter 3
PPM Center Factors to Monitor and Track
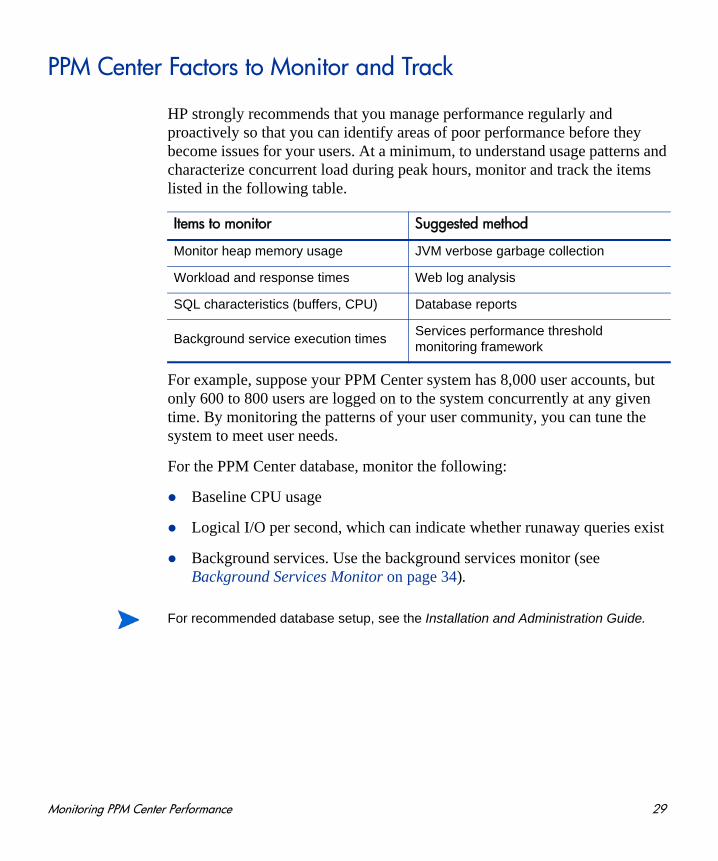
HP strongly recommends that you manage performance regularly and proactively so that you can identify areas of poor performance before they become issues for your users. At a minimum, to understand usage patterns and characterize concurrent load during peak hours, monitor and track the items listed in the following table.
For example, suppose your PPM Center system has 8,000 user accounts, but only 600 to 800 users are logged on to the system concurrently at any given time. By monitoring the patterns of your user community, you can tune the system to meet user needs.
For the PPM Center database, monitor the following:
Baseline CPU usage
Logical I/O per second, which can indicate whether runaway queries exist
Background services. Use the background services monitor (see Background Services Monitor on page 34).
Items to monitor Suggested method
Monitor heap memory usage JVM verbose garbage collection
Workload and response times Web log analysis
SQL characteristics (buffers, CPU) Database reports
Background service execution timesServices performance threshold monitoring framework
For recommended database setup, see the Installation and Administration Guide.
Monitoring PPM Center Performance 29
For the PPM Center application tier, monitor the following:
System metrics, including:
CPU
System memory demand (for example, paging or swapping rates)
Disk I/O rate
Heap size
Thread pool
Connection pools. Each PPM Server has a distinct set of connection pools. The overall connection demand against the database is the sum of active connections across all nodes in the server cluster. If HP document management is enabled on your system, you can create additional database connections outside of a node’s connection pools.
30 Chapter 3
Workload Considerations and Capacity Planning
To determine your present and future workload and system capacity needs, consider the following:
Existing and forecasted workload characteristics for at least a three-year time span
Distribution of transactions by type and over time
Different workload classes affect sizing
Session duration and characteristics differ significantly among classes
Make sure that you allow enough room in all areas of your PPM Center configuration for future growth. If possible, create a system that can meet the needs of your organization three years from now.
The memory capacity made available on the heap for a set of PPM Center application users can be controlled by increasing the:
Amount of memory allocated to the heap
Number of nodes in the server cluster that support user workload
Because of per-process memory allocation limits on most operating systems, there is a limit to which you can increase the size of the heap. The preferred way to grow PPM Center capacity on the application tier is to add nodes to a server cluster.
Monitoring PPM Center Performance 31
Monitoring and Analysis Tools
Many tools and methods are available for monitoring PPM Center performance. The following tools for monitoring and analyzing the behavior of your systems are available from HP:
HP Diagnostics Probe
Ships with PPM Center and helps monitor transient data.
HP Sitescope
Provides system resource profiling and enables you to configure alerts.
HP Business Availability Center (BAC)
Provides remote performance monitoring capability and enables end-to-end transaction monitoring.
Many tools are available for monitoring database performance. HP recommends that you analyze and fully understand your organization’s specific needs in selecting a database performance monitoring tool.
32 Chapter 3
PPM Center Monitors
PPM Center provides configurable monitors that you can use to capture information about UI activities (mainly URL requests), background service runs, and portlet activity on the PPM Server.
Action Monitor
The action monitor tracks activity in the PPM Center standard interface. You control the action monitor using two server configuration parameters: the ENABLE_UI_MONITOR parameter turns the monitor on (the default), and the UI_MONITOR_THRESHOLD parameter controls the threshold value of the action monitor.
For details on how to set the action monitor parameters, view monitor information in real time, access the log file that the monitor generates, and create a report on action monitor activity, see the Installation and Administration Guide.
Portlet Monitor
You can use the portlet monitor to track the load time of PPM Center portlets and help determine the impact of portlet activity on system performance. You control the portlet monitor using two server configuration parameters: the ENABLE_PORTLET_MONITOR parameter turns the monitor on (the default), and the PORTLET_MONITOR_THRESHOLD parameter controls the monitor threshold value (set in milliseconds).
For details on how to set the portlet monitor parameters, view monitor information in real time, access the log file that the monitor generates, and create a report on portlet monitor activity, see the Installation and Administration Guide.
Monitoring PPM Center Performance 33
Server Performance Reports
You can create server performance reports that are based on action monitoring and portlet monitoring results. To do this, you first create a report type, and then create reports of that type from the PPM Center standard interface. For instructions on how to perform these tasks, see the Installation and Administration Guide.
Background Services Monitor
You can use the PPM Center background services monitor to isolate performance issues related to background services execution. You control this monitor using two server configuration parameters: the ENABLE_BACKGROUND_SERVICE_MONITOR turns the monitor on (the default), and the BACKGROUND_SERVICE_MONITOR_THRESHOLD parameter controls its threshold value (in milliseconds). If the runtime of a background service exceeds the threshold value, this is recorded in the thresholdLog.txt file.
For details on how to set the background services monitor parameters, view monitor information in real time, and access the log file that the monitor generates, see the Installation and Administration Guide.
Services Audit Results Page
The Services Audit Results page in the PPM Center standard interface enables you to get a quick overview of background Services activity on your PPM Servers. This page shows you which background services are enabled or disabled, which are running, and the scheduling details for each service. For instructions on how to access the Services Audit Results page, see the Installation and Administration Guide.
34 Chapter 3
4 Solution Configurations and Customer Examples
Solution Configurations
The solution configurations described in this chapter progressively build on each other in size and complexity. This trend reflects the approach that PPM Center customers have adopted. The idea is to start small, and then grow as project goals are achieved. With each milestone passed, the project is expanded and deployed to larger and more diverse groups of users throughout the enterprise.
35
Solution Configuration 1
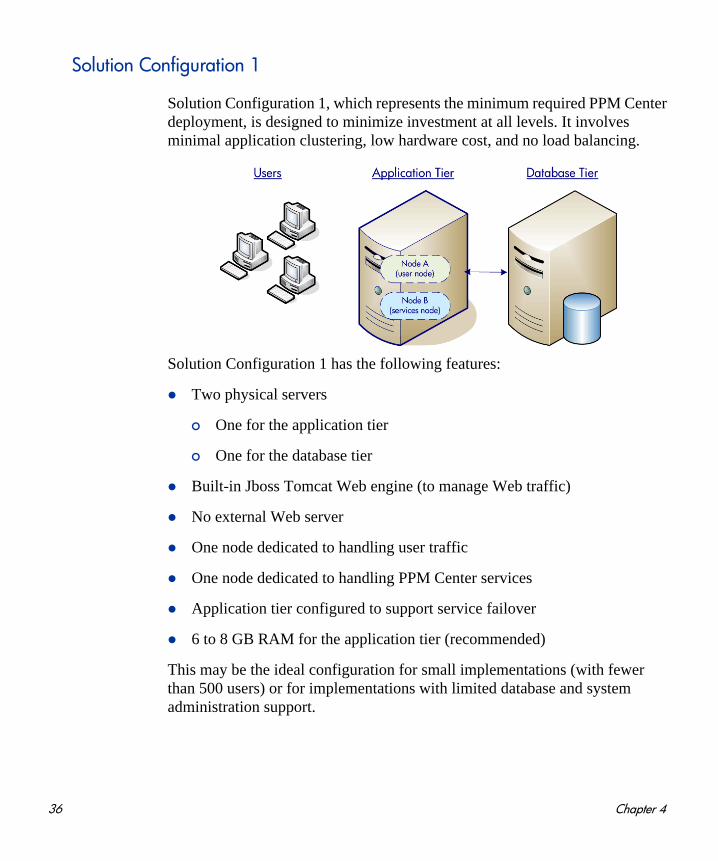
Solution Configuration 1, which represents the minimum required PPM Center deployment, is designed to minimize investment at all levels. It involves minimal application clustering, low hardware cost, and no load balancing.
Solution Configuration 1 has the following features:
Two physical servers
o One for the application tier
o One for the database tier
Built-in Jboss Tomcat Web engine (to manage Web traffic)
No external Web server
One node dedicated to handling user traffic
One node dedicated to handling PPM Center services
Application tier configured to support service failover
6 to 8 GB RAM for the application tier (recommended)
This may be the ideal configuration for small implementations (with fewer than 500 users) or for implementations with limited database and system administration support.
36 Chapter 4
Solution Configuration 1 is ideal if your project must meet the following criteria:
Minimum hardware cost
Minimum configuration and administration
User traffic is separated from services run by PPM Center
Failover capability for user traffic is not a primary concern at the server level
Single sign-on (SSO) support is not required
Solution Configurations and Customer Examples 37
Solution Configuration 2
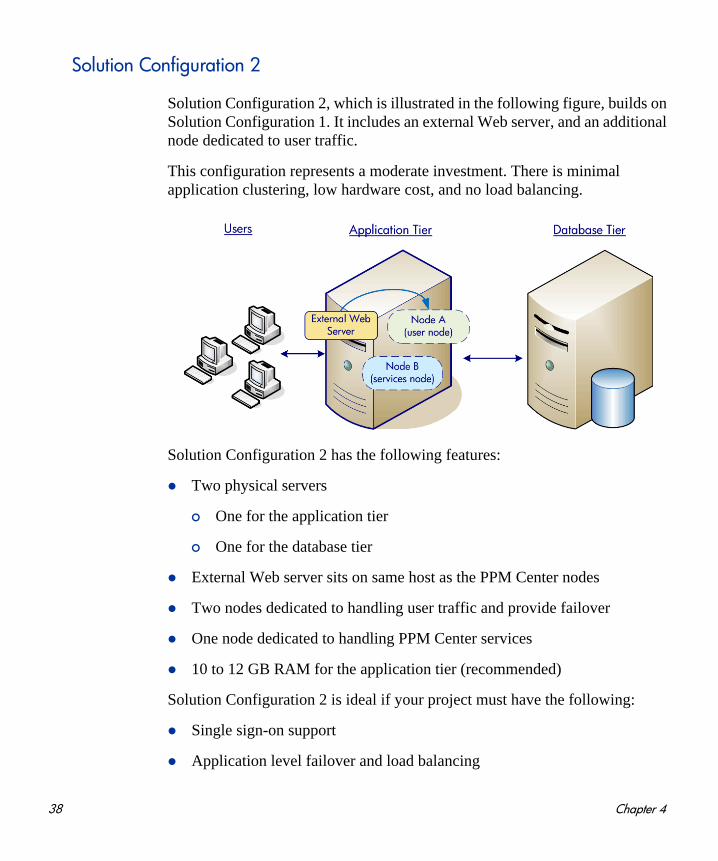
Solution Configuration 2, which is illustrated in the following figure, builds on Solution Configuration 1. It includes an external Web server, and an additional node dedicated to user traffic.
This configuration represents a moderate investment. There is minimal application clustering, low hardware cost, and no load balancing.
Solution Configuration 2 has the following features:
Two physical servers
o One for the application tier
o One for the database tier
External Web server sits on same host as the PPM Center nodes
Two nodes dedicated to handling user traffic and provide failover
One node dedicated to handling PPM Center services
10 to 12 GB RAM for the application tier (recommended)
Solution Configuration 2 is ideal if your project must have the following:
Single sign-on support
Application level failover and load balancing
38 Chapter 4
Solution Configuration 3
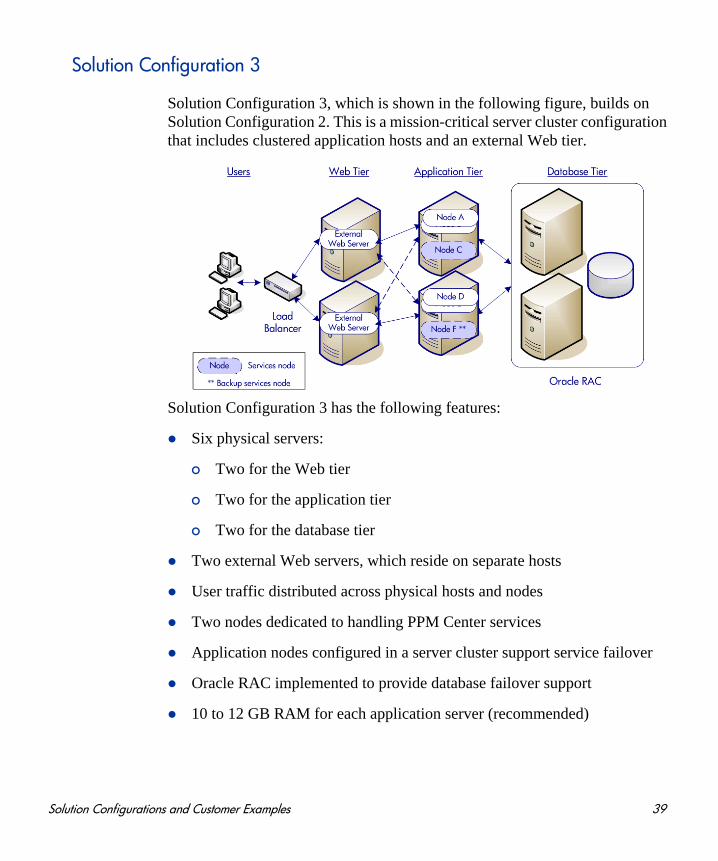
Solution Configuration 3, which is shown in the following figure, builds on Solution Configuration 2. This is a mission-critical server cluster configuration that includes clustered application hosts and an external Web tier.
Solution Configuration 3 has the following features:
Six physical servers:
o Two for the Web tier
o Two for the application tier
o Two for the database tier
Two external Web servers, which reside on separate hosts
User traffic distributed across physical hosts and nodes
Two nodes dedicated to handling PPM Center services
Application nodes configured in a server cluster support service failover
Oracle RAC implemented to provide database failover support
10 to 12 GB RAM for each application server (recommended)
Solution Configurations and Customer Examples 39

Solution Configuration 3 is ideal if your project must have the following:
Continuous application availability with minimized system outages
Single sign-on support
Need for future growth
40 Chapter 4
Examples from the Field
This section includes examples that illustrate what has worked well for three separate PPM Center customers. If your implementation matches one of the examples, you may be able to make adjustments to your project to match. Or, you can use the examples to gain a broader understanding of the variety of issues that can potentially affect your project.
Customer 1 Example
Customer 1 expects to have PPM Center 16,000 users, with the potential for over 9,200 concurrent users across the system. Customer 1 predicts the highest concurrent usage to be 7,000 users attempting to log time sheets within a four-hour period.
Customer 1 plans to implement the following PPM Center modules:
HP Demand Management
HP Portfolio Management
HP Program Management
HP Project Management
HP Time Management
HP Deployment Management
All hardware in the configuration uses Intel Xeon processors running Linux 2.1. The database server has four CPUs. A hardware load balancer manages Web traffic. The application server tier consists of two machines, each of which has the following:
Four CPUs
Apache Web Server or PPM Server
Solution Configurations and Customer Examples 41
Customer 2 Example
Customer 2 expects to have 500 PPM Center users, and estimates peak usage at 80,000 requests logged per month.
Customer 2 plans to implement the following PPM Center modules:
HP Demand Management
HP Program Management
HP Project Management
HP Time Management
All hardware in the configuration uses HP with DL380 and DL580 processors running Windows 2003 Server.
The application server tier consists of two machines, each with 2 CPUs.
The database layer is consists of three machines, each with the following:
4 CPUs
8 GB
The Web tier makes use of a IIS Web Server.
42 Chapter 4
Customer 3 Example
Customer expects 15,000 users with the highest concurrent user load at 500 users. The customer also expects that the system will need to be able to accommodate:
Over 15,000 time sheet entries per week
2,000 active projects
3,000 inactive projects
Plans are to implement the following modules:
Project Management
Time Management
The PPM Center application tier uses two HP 4640 machines with four CPUs running on 32 GB of RAM each.
The configuration includes two Integrity 8640 Itanium 2 database servers, each with sixteen 32-GB CPUs running Oracle 10g with RAC to provide full failover capability.
A hardware load balancer manages Web traffic and the Web tier uses four IIS VmWareESX images.
Solution Configurations and Customer Examples 43

44 Chapter 4
Index
AAction Monitor
monitoring PPM Center UI activity, 33application server
hardware recommendations, 16
Bbackground services
isolating, 12scheduling, 13viewing Services Audit Results, 34
best practicesdeployment in a virtual server environment,
17
Cconfiguration
examples, 35external Web servers, 18
configuringload balancing, 15workflows, 24
Ddisabling
services, 14dynamic content compression
on external Web servers, 18
Eenabling
services, 14example configurations, 35external Web servers
configuration, 18
Ggarbage collection
impact on performance, 20
Hhardware
recommendations for PPM Servers, 16heap sizing, 20heavy services, 14
Iinternal Web server, 18isolating services, 12
JJ2EE application server, 8
Kkeepalive
enabling on external Web servers, 18
45
Lload balancing, 15
configuring in PPM Center, 15
Mmanaging memory on servers, 19memory management
on servers, 19monitoring
performance after deployment, 28PPM Center UI activity, 33tools for, 32what to monitor, 29
OOracle
database tier, 8
Ppage performance reports, 34performance
monitoring after deployment, 28portlets, 21testing preproduction, 25
planningfor workload and capacity, 31
portletsperformance of, 21performance reports, 34
PPM Servershardware recommendations, 16memory management on, 19
Rreports
server performance reports, 34
SSchedule Services page, 14
schedulingservices execution, 13
server.xsl fileediting for load balancing, 15
serversmemory management on, 19
servicesenabling and disabling, 14isolating, 12scheduling, 13viewing Services Audit Results, 34
Services Audit Resultsviewing, 34
solution configurationsexamples, 35
Ttesting
performance before deploying on a production instance, 25
toolsmonitoring and analysis, 32
Vviewing
Services Audit Results, 34virtual server environment
best practices for deploying PPM Center, 17
WWatchdog tool, 19Web server
internal Web server, 18workflows
practices to avoid in configuring, 24workload and capacity
planning, 31
46