Embed Size (px)
Citation preview
© Copyright 2011 Hewlett-Packard Development Company, L.P. The information
contained herein is subject to change without notice. Confidentiality label goes here
Transform your classroom
©2012 HP Calculators
Version 1.1
HP 39gll Graphing Calculator
© Copyright 2011 Hewlett-Packard Development Company, L.P. The information
contained herein is subject to change without notice. Confidentiality label goes here
Agenda
2
Intuitive UI: Apps
Advanced Features: Programming
Performance: Adaptive Graphing
Intelligent Design: Systems Architecture
Assurance: HP Support & Durability
© Copyright 2011 Hewlett-Packard Development Company, L.P. The information
contained herein is subject to change without notice. Confidentiality label goes here
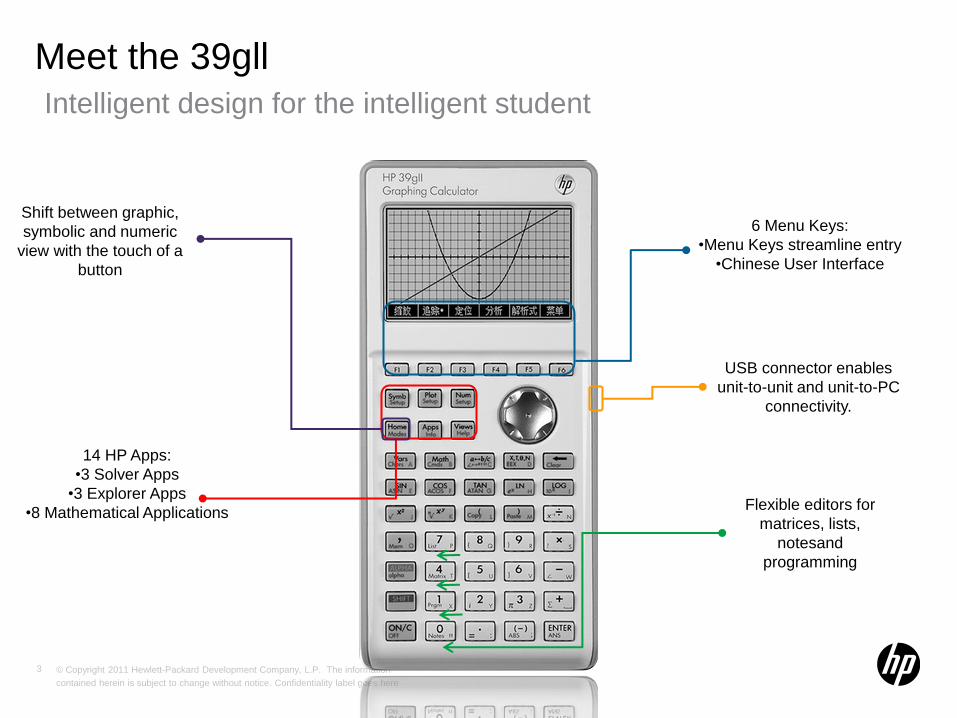
Intelligent design for the intelligent student
Meet the 39gll
3
14 HP Apps:
•3 Solver Apps
•3 Explorer Apps
•8 Mathematical Applications
6 Menu Keys:
•Menu Keys streamline entry
•Chinese User Interface
Flexible editors for
matrices, lists,
notesand
programming
USB connector enables
unit-to-unit and unit-to-PC
connectivity.
Shift between graphic,
symbolic and numeric
view with the touch of a
button
© Copyright 2011 Hewlett-Packard Development Company, L.P. The information
contained herein is subject to change without notice. Confidentiality label goes here
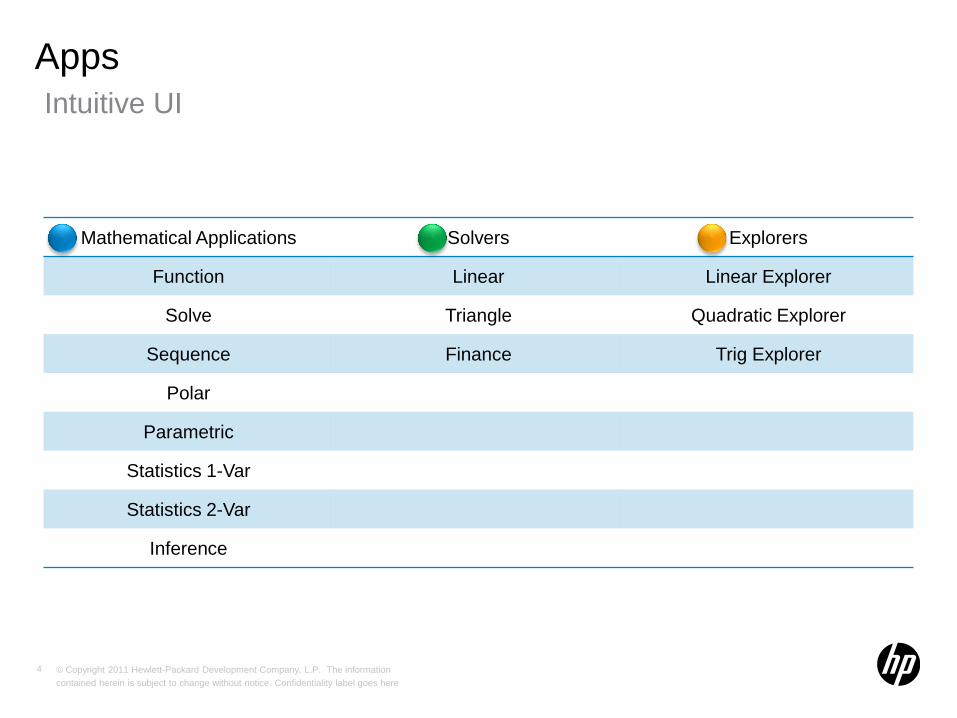
Intuitive UI
Apps
4
Mathematical Applications Solvers Explorers
Function Linear Linear Explorer
Solve Triangle Quadratic Explorer
Sequence Finance Trig Explorer
Polar
Parametric
Statistics 1-Var
Statistics 2-Var
Inference
© Copyright 2011 Hewlett-Packard Development Company, L.P. The information
contained herein is subject to change without notice. Confidentiality label goes here
Intuitive UI
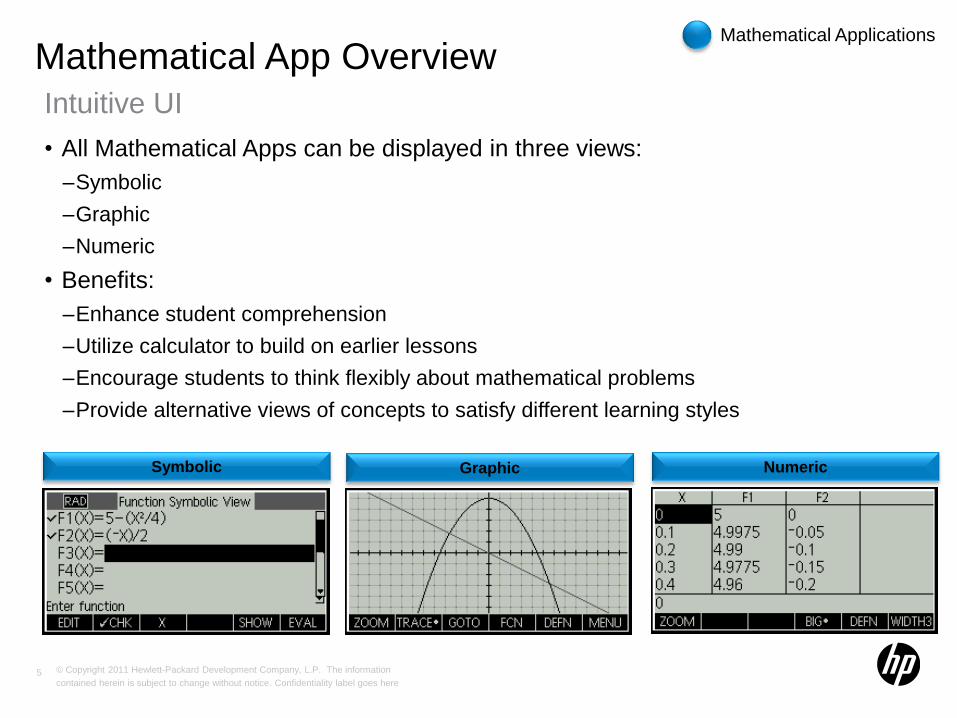
Mathematical App Overview
• All Mathematical Apps can be displayed in three views:
–Symbolic
–Graphic
–Numeric
• Benefits:
–Enhance student comprehension
–Utilize calculator to build on earlier lessons
–Encourage students to think flexibly about mathematical problems
–Provide alternative views of concepts to satisfy different learning styles
5
Graphic Numeric Symbolic
Mathematical Applications
© Copyright 2011 Hewlett-Packard Development Company, L.P. The information
contained herein is subject to change without notice. Confidentiality label goes here
Intuitive UI
Mathematical App Overview
• Apps and Functionality:
–Function: Define functions and explore graphs and table of values
–Solve: Enter equations and solve for unknown variables
–Sequence: Define sequences and explore graphs and tables of values
–Polar: Define polar equations and explore their graphs and tables of values
–Parametric: Define parametric equations and explore their graphs and tables of values
–Statistics 1-Var: Define 1-variable analyses, compute summary statistics and explore
statistical plots
–Statistics 2-Var: Define 2-variable analyses, compute summary statistics and explore
statistical plots
–Inference: Compute and explore hypothesis tests and confidence intervals
6
Mathematical Applications
© Copyright 2011 Hewlett-Packard Development Company, L.P. The information
contained herein is subject to change without notice. Confidentiality label goes here
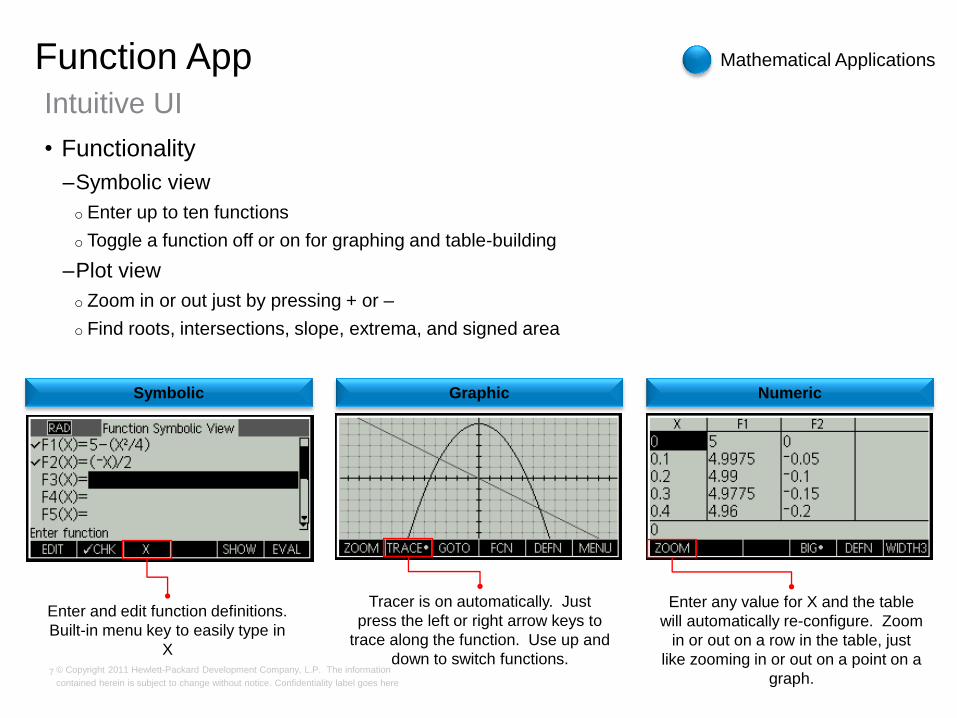
Enter any value for X and the table
will automatically re-configure. Zoom
in or out on a row in the table, just
like zooming in or out on a point on a
graph.
Intuitive UI
Function App
• Functionality
–Symbolic view
o Enter up to ten functions
o Toggle a function off or on for graphing and table-building
–Plot view
o Zoom in or out just by pressing + or –
o Find roots, intersections, slope, extrema, and signed area
7
Enter and edit function definitions.
Built-in menu key to easily type in
X
Symbolic Graphic
Tracer is on automatically. Just
press the left or right arrow keys to
trace along the function. Use up and
down to switch functions.
Numeric
Mathematical Applications
© Copyright 2011 Hewlett-Packard Development Company, L.P. The information
contained herein is subject to change without notice. Confidentiality label goes here
Intuitive UI
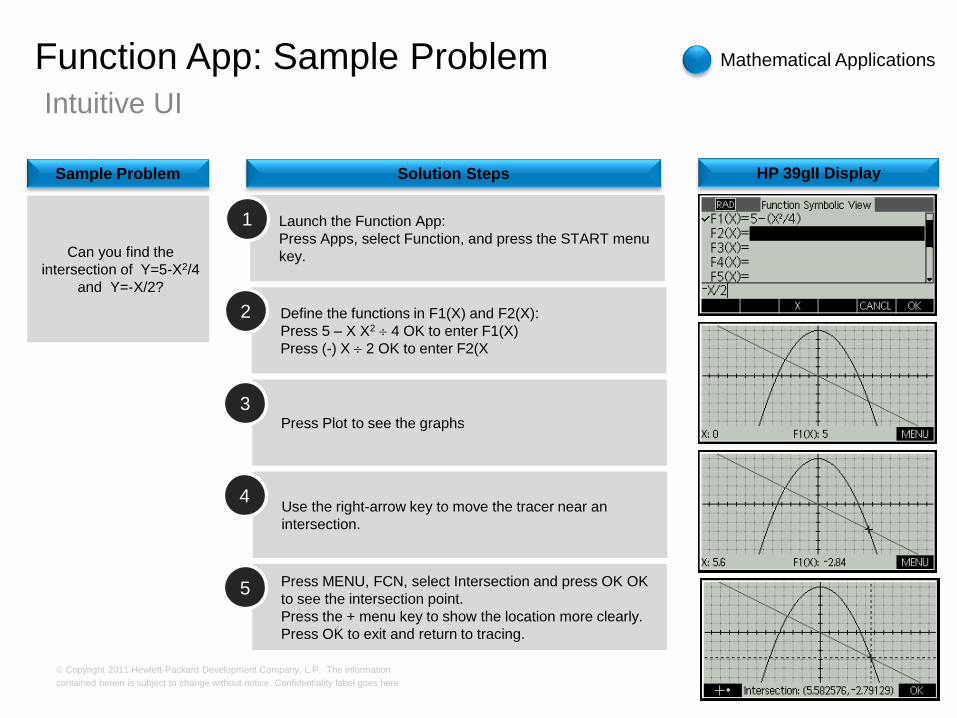
Function App: Sample Problem
HP 39gII Display
Can you find the
intersection of Y=5-X2/4
and Y=-X/2?
Sample Problem Solution Steps
Launch the Function App:
Press Apps, select Function, and press the START menu
key.
1
Define the functions in F1(X) and F2(X):
Press 5 – X X2 4 OK to enter F1(X)
Press (-) X 2 OK to enter F2(X
2
Press Plot to see the graphs
3
Use the right-arrow key to move the tracer near an
intersection.
4
Press MENU, FCN, select Intersection and press OK OK
to see the intersection point.
Press the + menu key to show the location more clearly.
Press OK to exit and return to tracing.
5
Mathematical Applications
© Copyright 2011 Hewlett-Packard Development Company, L.P. The information
contained herein is subject to change without notice. Confidentiality label goes here
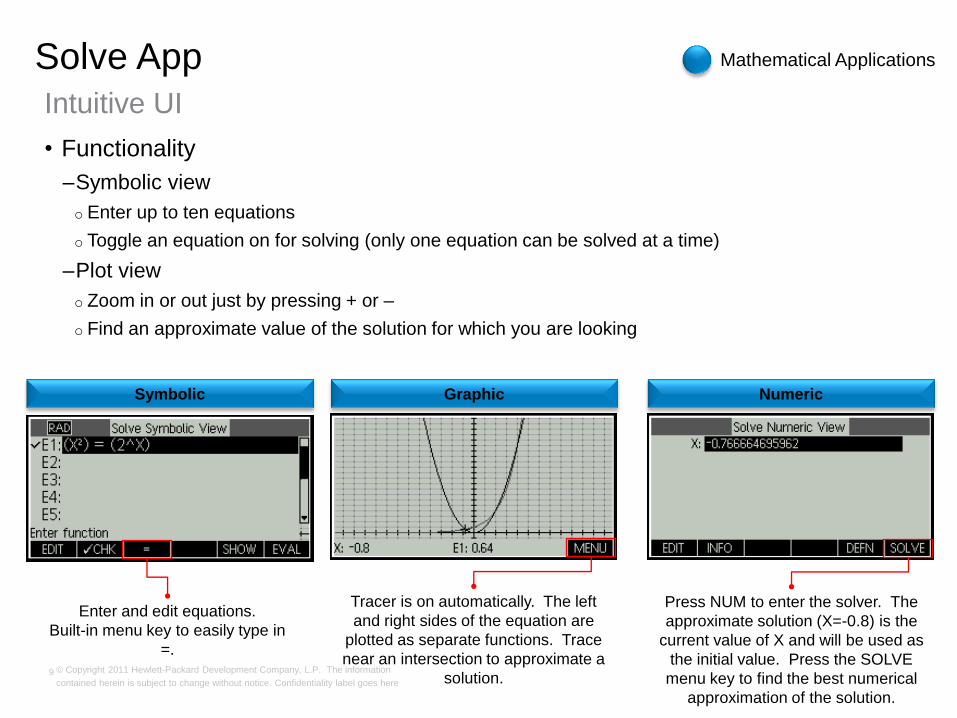
Press NUM to enter the solver. The
approximate solution (X=-0.8) is the
current value of X and will be used as
the initial value. Press the SOLVE
menu key to find the best numerical
approximation of the solution.
Intuitive UI
Solve App
• Functionality
–Symbolic view
o Enter up to ten equations
o Toggle an equation on for solving (only one equation can be solved at a time)
–Plot view
o Zoom in or out just by pressing + or –
o Find an approximate value of the solution for which you are looking
9
Enter and edit equations.
Built-in menu key to easily type in
=.
Symbolic Graphic
Tracer is on automatically. The left
and right sides of the equation are
plotted as separate functions. Trace
near an intersection to approximate a
solution.
Numeric
Mathematical Applications
© Copyright 2011 Hewlett-Packard Development Company, L.P. The information
contained herein is subject to change without notice. Confidentiality label goes here
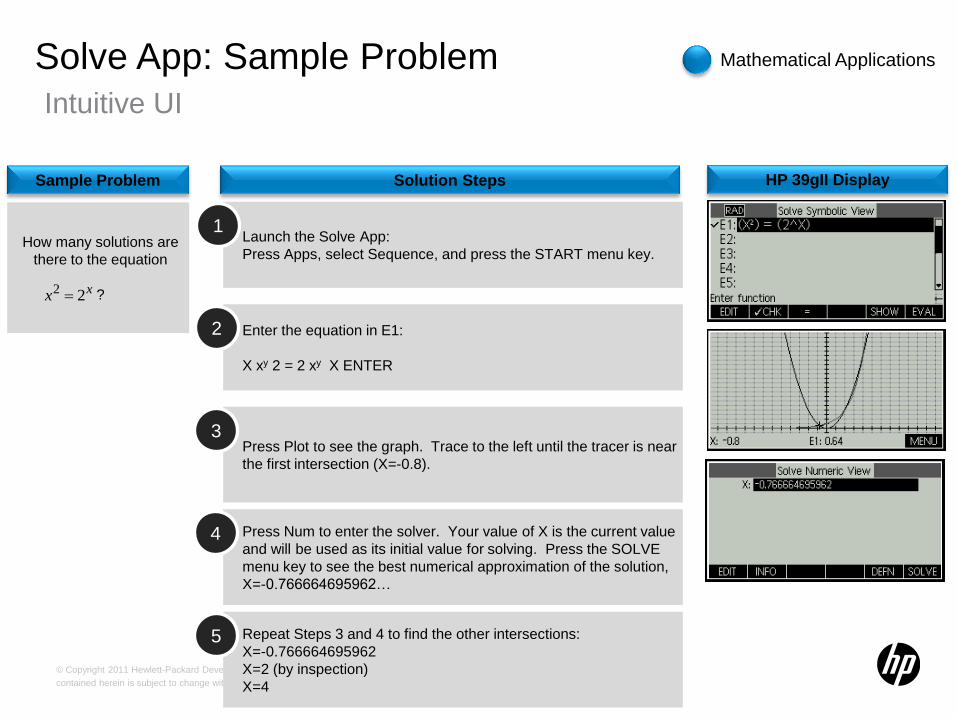
Intuitive UI
Solve App: Sample Problem
HP 39gII Display
How many solutions are
there to the equation
?
Sample Problem Solution Steps
Launch the Solve App:
Press Apps, select Sequence, and press the START menu key.
1
Enter the equation in E1:
X xy 2 = 2 xy X ENTER
2
Press Plot to see the graph. Trace to the left until the tracer is near
the first intersection (X=-0.8).
3
Press Num to enter the solver. Your value of X is the current value
and will be used as its initial value for solving. Press the SOLVE
menu key to see the best numerical approximation of the solution,
X=-0.766664695962…
4
Repeat Steps 3 and 4 to find the other intersections:
X=-0.766664695962
X=2 (by inspection)
X=4
5
Mathematical Applications
xx 22
© Copyright 2011 Hewlett-Packard Development Company, L.P. The information
contained herein is subject to change without notice. Confidentiality label goes here
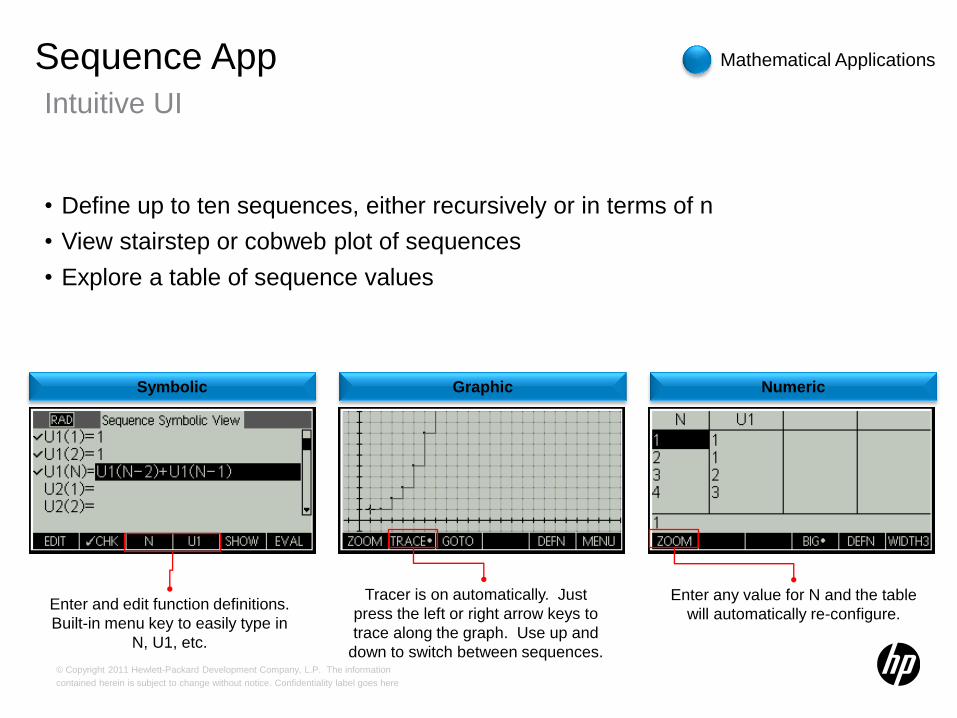
Enter any value for N and the table
will automatically re-configure.
Intuitive UI
Sequence App
• Define up to ten sequences, either recursively or in terms of n
• View stairstep or cobweb plot of sequences
• Explore a table of sequence values
11
Enter and edit function definitions.
Built-in menu key to easily type in
N, U1, etc.
Symbolic Graphic
Tracer is on automatically. Just
press the left or right arrow keys to
trace along the graph. Use up and
down to switch between sequences.
Numeric
Mathematical Applications
© Copyright 2011 Hewlett-Packard Development Company, L.P. The information
contained herein is subject to change without notice. Confidentiality label goes here
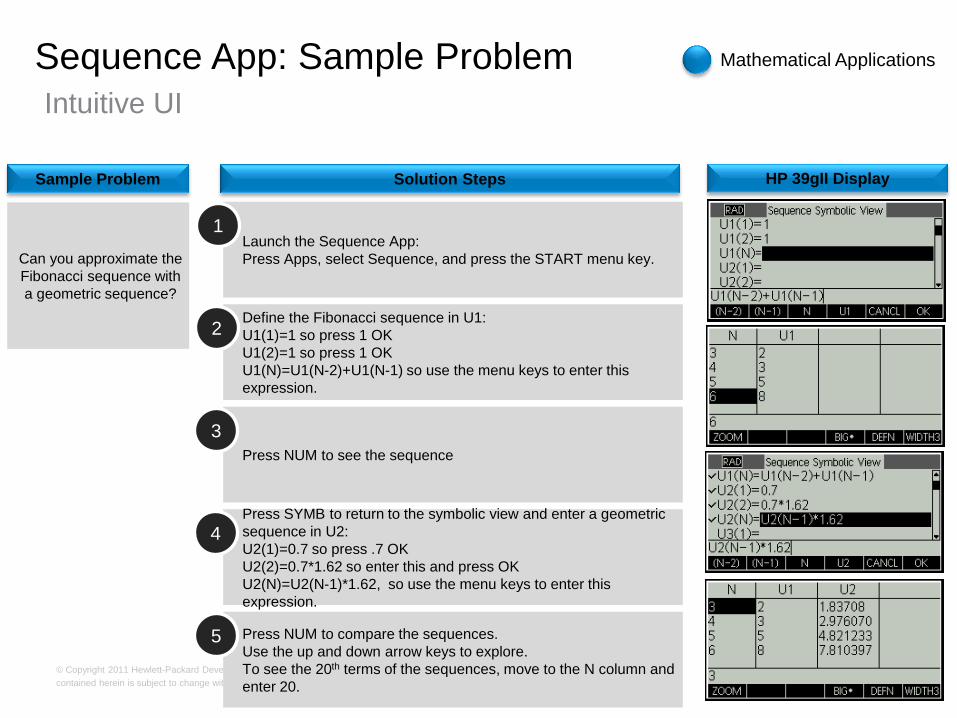
Intuitive UI
Sequence App: Sample Problem
HP 39gII Display
Can you approximate the
Fibonacci sequence with
a geometric sequence?
Sample Problem Solution Steps
Launch the Sequence App:
Press Apps, select Sequence, and press the START menu key.
1
Define the Fibonacci sequence in U1:
U1(1)=1 so press 1 OK
U1(2)=1 so press 1 OK
U1(N)=U1(N-2)+U1(N-1) so use the menu keys to enter this
expression.
2
Press NUM to see the sequence
3
Press SYMB to return to the symbolic view and enter a geometric
sequence in U2:
U2(1)=0.7 so press .7 OK
U2(2)=0.7*1.62 so enter this and press OK
U2(N)=U2(N-1)*1.62, so use the menu keys to enter this
expression.
4
Press NUM to compare the sequences.
Use the up and down arrow keys to explore.
To see the 20th terms of the sequences, move to the N column and
enter 20.
5
Mathematical Applications
© Copyright 2011 Hewlett-Packard Development Company, L.P. The information
contained herein is subject to change without notice. Confidentiality label goes here
Graphic View Symbolic View
Intuitive UI
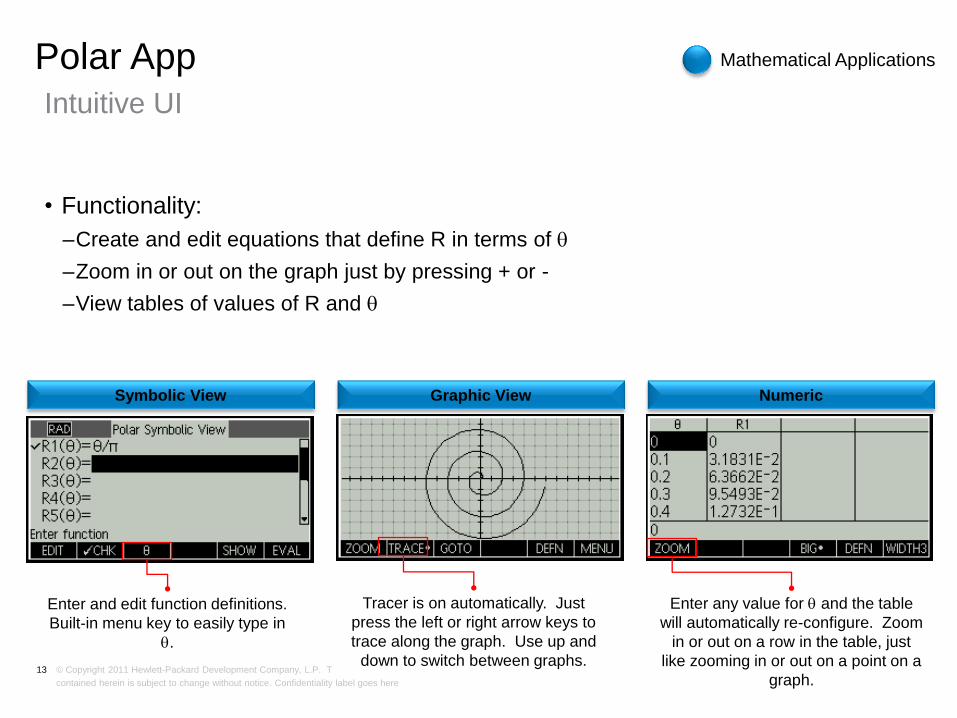
Polar App
• Functionality:
–Create and edit equations that define R in terms of
–Zoom in or out on the graph just by pressing + or -
–View tables of values of R and
13
Enter and edit function definitions.
Built-in menu key to easily type in
.
Tracer is on automatically. Just
press the left or right arrow keys to
trace along the graph. Use up and
down to switch between graphs.
Numeric
Enter any value for and the table
will automatically re-configure. Zoom
in or out on a row in the table, just
like zooming in or out on a point on a
graph.
Mathematical Applications
© Copyright 2011 Hewlett-Packard Development Company, L.P. The information
contained herein is subject to change without notice. Confidentiality label goes here
Intuitive UI
Polar App: Sample Problem
HP 39gII Display
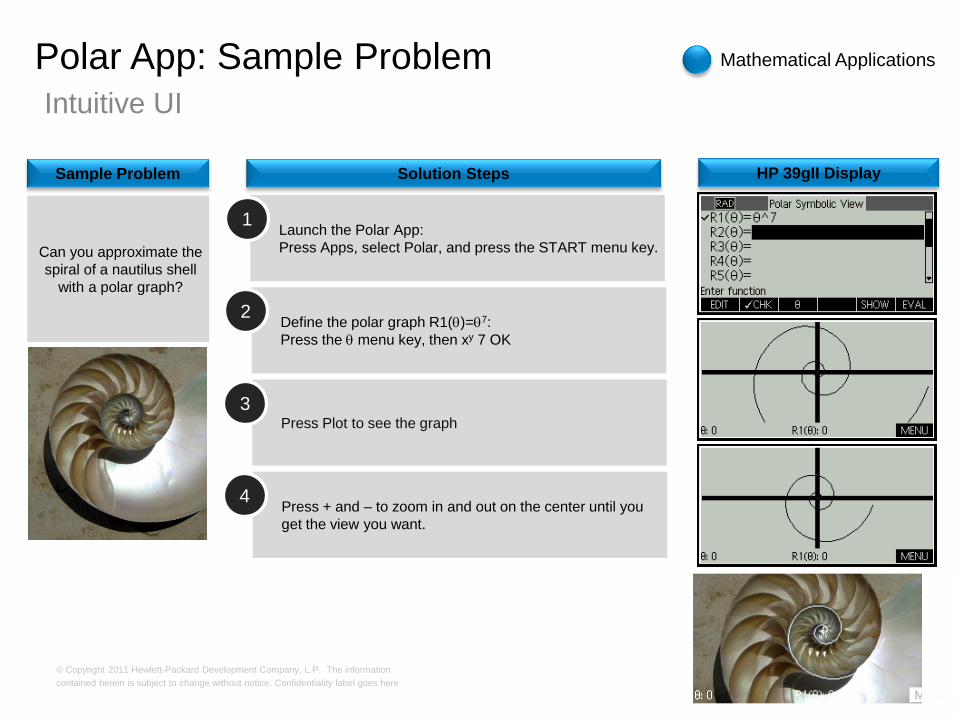
Can you approximate the
spiral of a nautilus shell
with a polar graph?
Sample Problem Solution Steps
Launch the Polar App:
Press Apps, select Polar, and press the START menu key.
1
Define the polar graph R1()=7:
Press the menu key, then xy 7 OK
2
Press Plot to see the graph
3
Press + and – to zoom in and out on the center until you
get the view you want.
4
Mathematical Applications
© Copyright 2011 Hewlett-Packard Development Company, L.P. The information
contained herein is subject to change without notice. Confidentiality label goes here
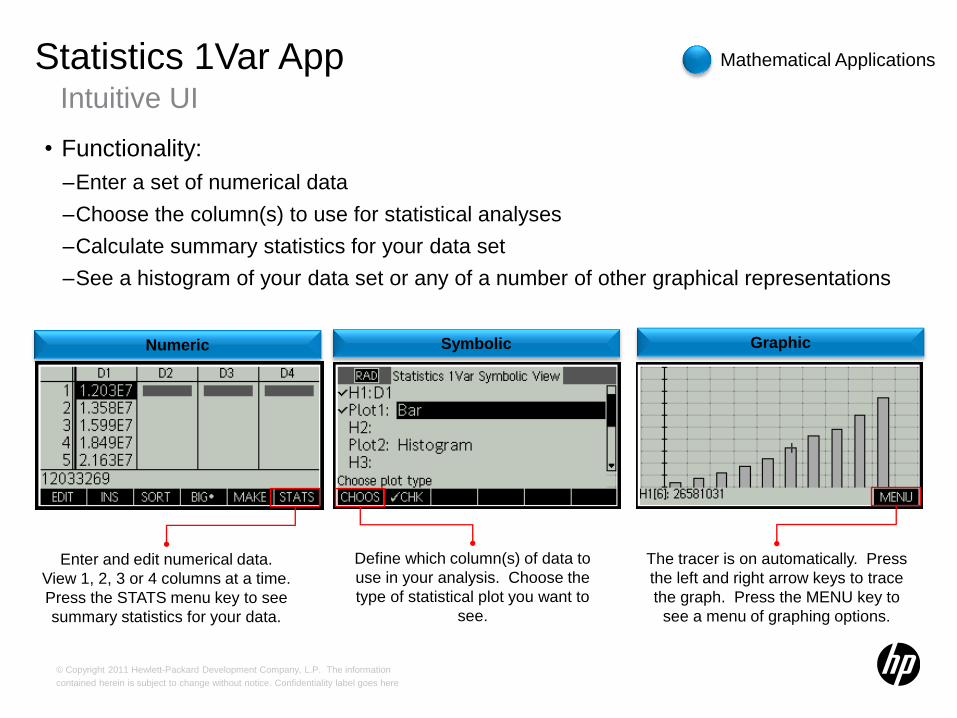
Statistics 1Var App
• Functionality:
–Enter a set of numerical data
–Choose the column(s) to use for statistical analyses
–Calculate summary statistics for your data set
–See a histogram of your data set or any of a number of other graphical representations
15
Enter and edit numerical data.
View 1, 2, 3 or 4 columns at a time.
Press the STATS menu key to see
summary statistics for your data.
Symbolic Graphic
Define which column(s) of data to
use in your analysis. Choose the
type of statistical plot you want to
see.
Numeric
The tracer is on automatically. Press
the left and right arrow keys to trace
the graph. Press the MENU key to
see a menu of graphing options.
Mathematical Applications
Intuitive UI
© Copyright 2011 Hewlett-Packard Development Company, L.P. The information
contained herein is subject to change without notice. Confidentiality label goes here
Intuitive UI
Statistics 1Var App: Sample Problem
HP 39gII Display
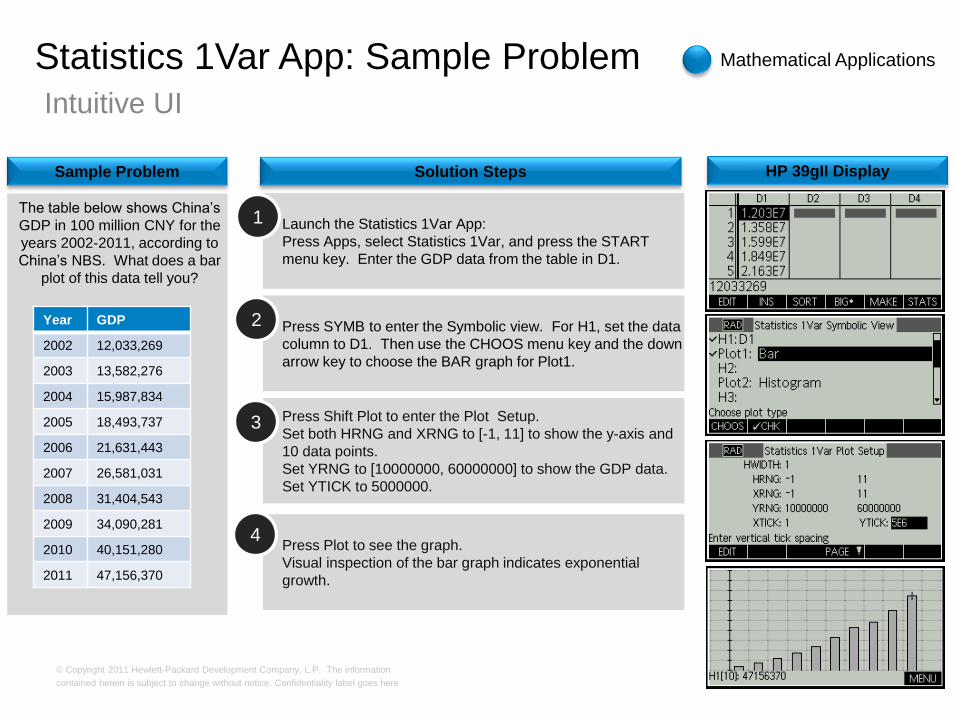
The table below shows China’s
GDP in 100 million CNY for the
years 2002-2011, according to
China’s NBS. What does a bar
plot of this data tell you?
Sample Problem Solution Steps
Launch the Statistics 1Var App:
Press Apps, select Statistics 1Var, and press the START
menu key. Enter the GDP data from the table in D1.
1
Press SYMB to enter the Symbolic view. For H1, set the data
column to D1. Then use the CHOOS menu key and the down
arrow key to choose the BAR graph for Plot1.
2
Press Shift Plot to enter the Plot Setup.
Set both HRNG and XRNG to [-1, 11] to show the y-axis and
10 data points.
Set YRNG to [10000000, 60000000] to show the GDP data.
Set YTICK to 5000000.
3
Press Plot to see the graph.
Visual inspection of the bar graph indicates exponential
growth.
4
Mathematical Applications
Year GDP
2002 12,033,269
2003 13,582,276
2004 15,987,834
2005 18,493,737
2006 21,631,443
2007 26,581,031
2008 31,404,543
2009 34,090,281
2010 40,151,280
2011 47,156,370
© Copyright 2011 Hewlett-Packard Development Company, L.P. The information
contained herein is subject to change without notice. Confidentiality label goes here
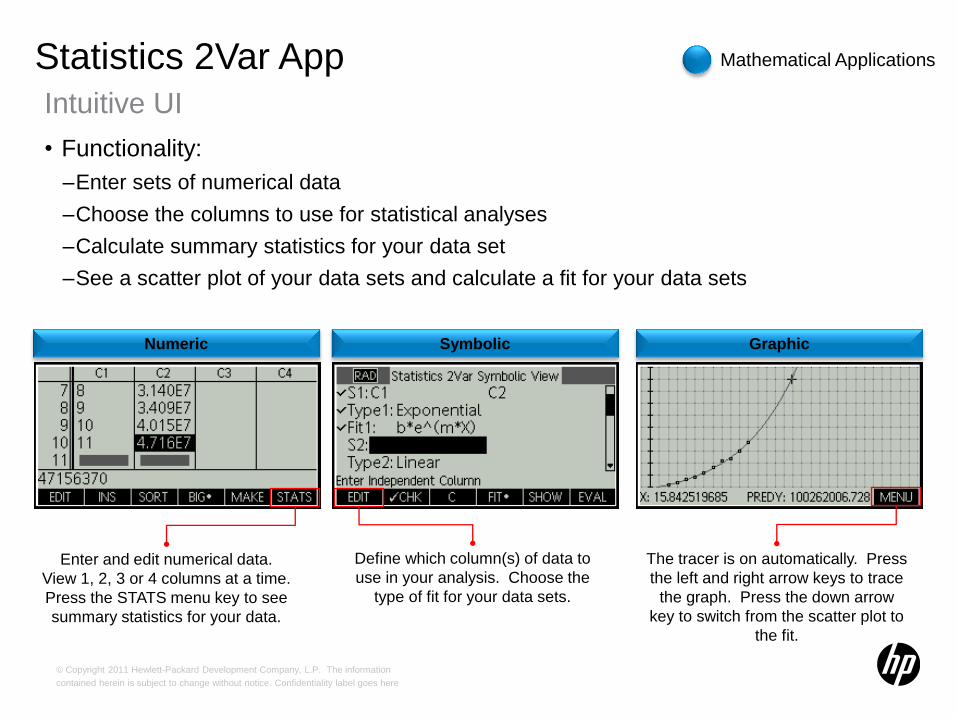
Statistics 2Var App
• Functionality:
–Enter sets of numerical data
–Choose the columns to use for statistical analyses
–Calculate summary statistics for your data set
–See a scatter plot of your data sets and calculate a fit for your data sets
17
Enter and edit numerical data.
View 1, 2, 3 or 4 columns at a time.
Press the STATS menu key to see
summary statistics for your data.
Symbolic Graphic
Define which column(s) of data to
use in your analysis. Choose the
type of fit for your data sets.
Numeric
The tracer is on automatically. Press
the left and right arrow keys to trace
the graph. Press the down arrow
key to switch from the scatter plot to
the fit.
Mathematical Applications
Intuitive UI
© Copyright 2011 Hewlett-Packard Development Company, L.P. The information
contained herein is subject to change without notice. Confidentiality label goes here
Intuitive UI
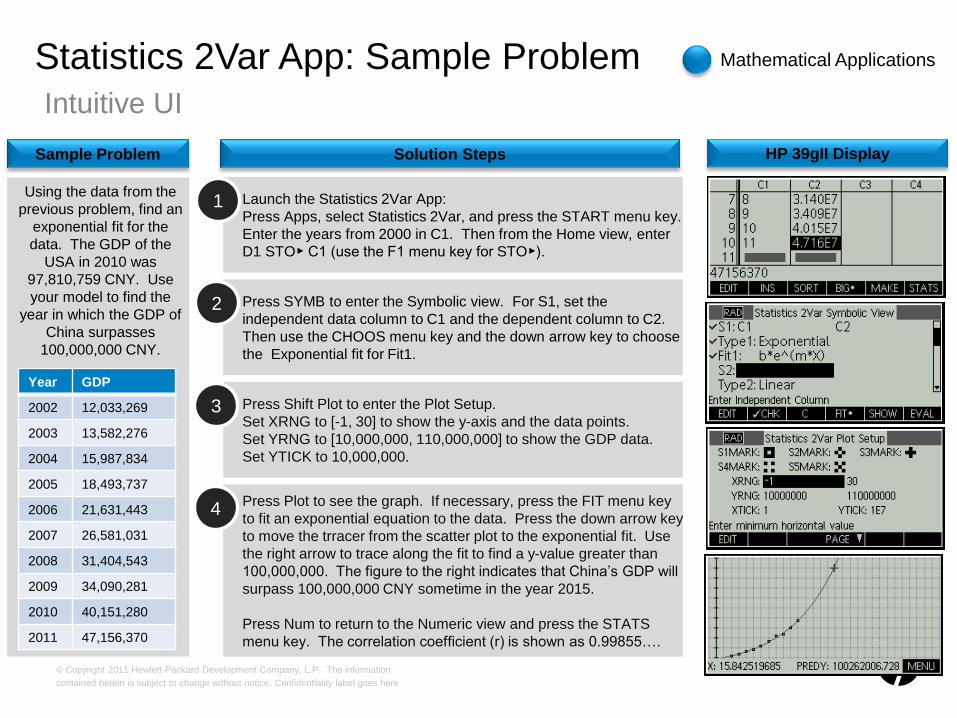
Statistics 2Var App: Sample Problem
HP 39gII Display
Using the data from the
previous problem, find an
exponential fit for the
data. The GDP of the
USA in 2010 was
97,810,759 CNY. Use
your model to find the
year in which the GDP of
China surpasses
100,000,000 CNY.
Sample Problem Solution Steps
Launch the Statistics 2Var App:
Press Apps, select Statistics 2Var, and press the START menu key.
Enter the years from 2000 in C1. Then from the Home view, enter
D1 STO▶ C1 (use the F1 menu key for STO▶).
1
Press SYMB to enter the Symbolic view. For S1, set the
independent data column to C1 and the dependent column to C2.
Then use the CHOOS menu key and the down arrow key to choose
the Exponential fit for Fit1.
2
Press Shift Plot to enter the Plot Setup.
Set XRNG to [-1, 30] to show the y-axis and the data points.
Set YRNG to [10,000,000, 110,000,000] to show the GDP data.
Set YTICK to 10,000,000.
3
Press Plot to see the graph. If necessary, press the FIT menu key
to fit an exponential equation to the data. Press the down arrow key
to move the trracer from the scatter plot to the exponential fit. Use
the right arrow to trace along the fit to find a y-value greater than
100,000,000. The figure to the right indicates that China’s GDP will
surpass 100,000,000 CNY sometime in the year 2015.
Press Num to return to the Numeric view and press the STATS
menu key. The correlation coefficient (r) is shown as 0.99855….
4
Mathematical Applications
Year GDP
2002 12,033,269
2003 13,582,276
2004 15,987,834
2005 18,493,737
2006 21,631,443
2007 26,581,031
2008 31,404,543
2009 34,090,281
2010 40,151,280
2011 47,156,370
© Copyright 2011 Hewlett-Packard Development Company, L.P. The information
contained herein is subject to change without notice. Confidentiality label goes here
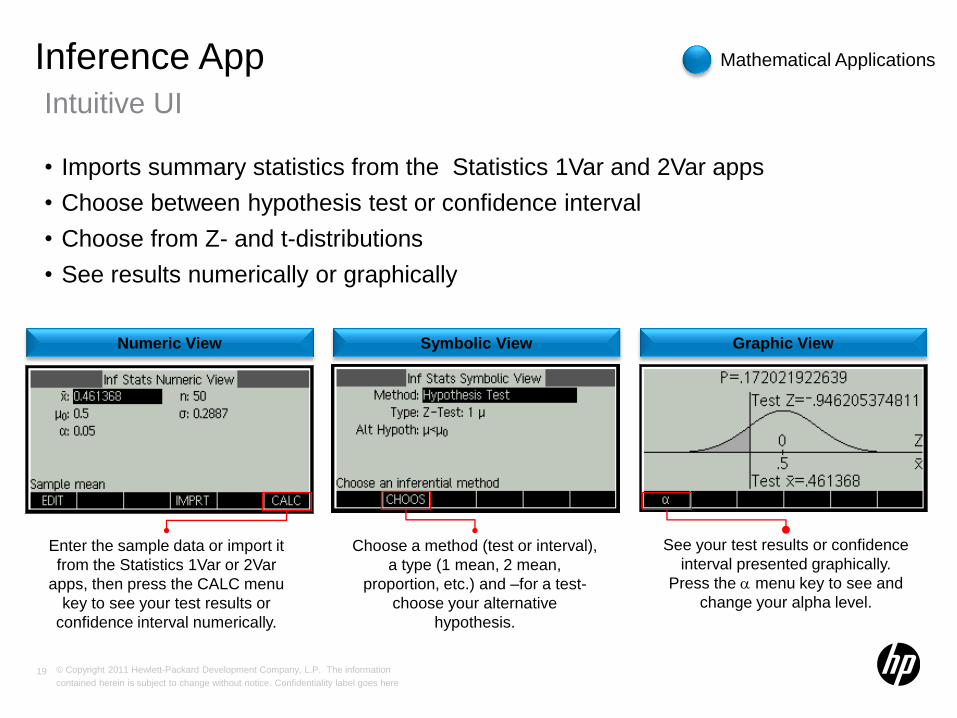
Intuitive UI
Inference App
• Imports summary statistics from the Statistics 1Var and 2Var apps
• Choose between hypothesis test or confidence interval
• Choose from Z- and t-distributions
• See results numerically or graphically
19
Numeric View Symbolic View Graphic View
Mathematical Applications
Enter the sample data or import it
from the Statistics 1Var or 2Var
apps, then press the CALC menu
key to see your test results or
confidence interval numerically.
Choose a method (test or interval),
a type (1 mean, 2 mean,
proportion, etc.) and –for a test-
choose your alternative
hypothesis.
See your test results or confidence
interval presented graphically.
Press the menu key to see and
change your alpha level.
© Copyright 2011 Hewlett-Packard Development Company, L.P. The information
contained herein is subject to change without notice. Confidentiality label goes here
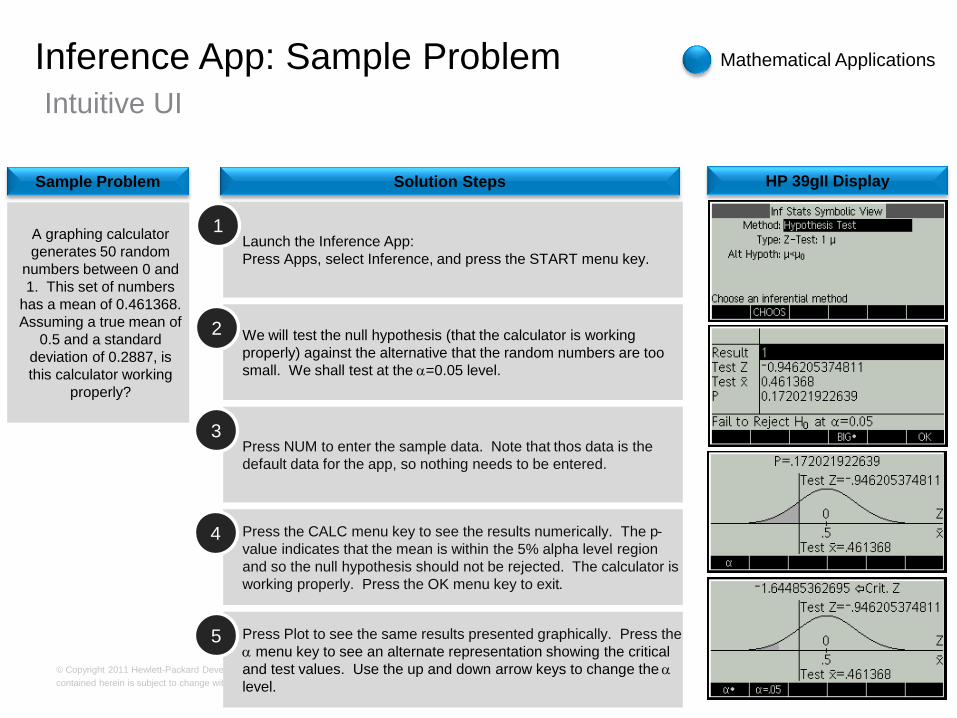
Intuitive UI
Inference App: Sample Problem
HP 39gII Display
A graphing calculator
generates 50 random
numbers between 0 and
1. This set of numbers
has a mean of 0.461368.
Assuming a true mean of
0.5 and a standard
deviation of 0.2887, is
this calculator working
properly?
Sample Problem Solution Steps
Launch the Inference App:
Press Apps, select Inference, and press the START menu key.
1
We will test the null hypothesis (that the calculator is working
properly) against the alternative that the random numbers are too
small. We shall test at the =0.05 level.
2
Press NUM to enter the sample data. Note that thos data is the
default data for the app, so nothing needs to be entered.
3
Press the CALC menu key to see the results numerically. The p-
value indicates that the mean is within the 5% alpha level region
and so the null hypothesis should not be rejected. The calculator is
working properly. Press the OK menu key to exit.
4
Press Plot to see the same results presented graphically. Press the
menu key to see an alternate representation showing the critical
and test values. Use the up and down arrow keys to change the
level.
5
Mathematical Applications
© Copyright 2011 Hewlett-Packard Development Company, L.P. The information
contained herein is subject to change without notice. Confidentiality label goes here
Intuitive UI
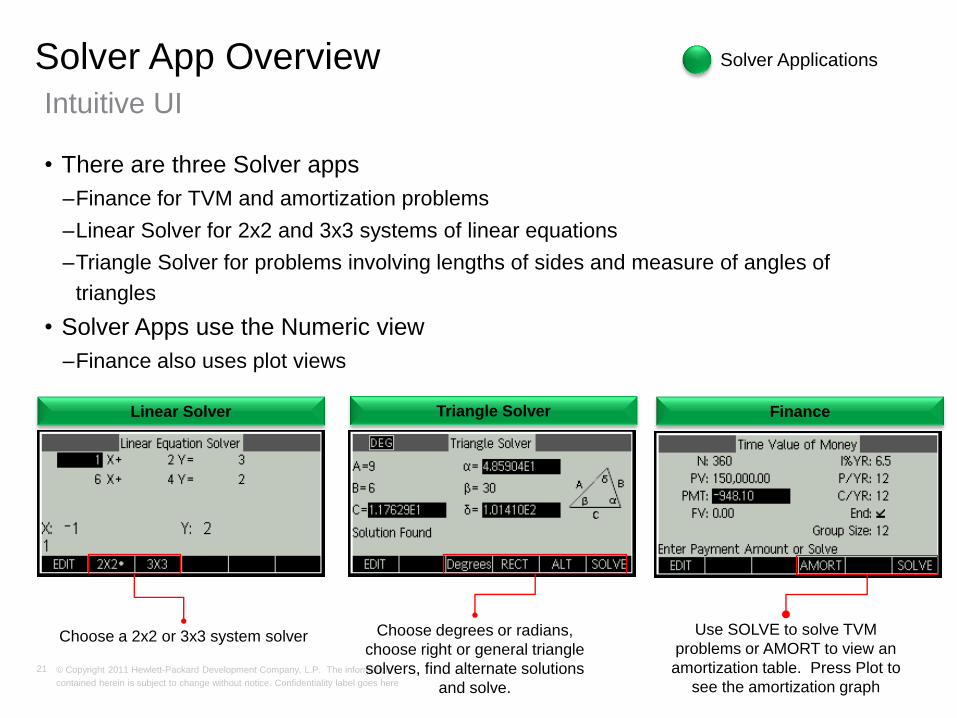
Solver App Overview
• There are three Solver apps
–Finance for TVM and amortization problems
–Linear Solver for 2x2 and 3x3 systems of linear equations
–Triangle Solver for problems involving lengths of sides and measure of angles of
triangles
• Solver Apps use the Numeric view
–Finance also uses plot views
21
Solver Applications
Triangle Solver Finance Linear Solver
Choose degrees or radians,
choose right or general triangle
solvers, find alternate solutions
and solve.
Use SOLVE to solve TVM
problems or AMORT to view an
amortization table. Press Plot to
see the amortization graph
Choose a 2x2 or 3x3 system solver
© Copyright 2011 Hewlett-Packard Development Company, L.P. The information
contained herein is subject to change without notice. Confidentiality label goes here
Intuitive UI
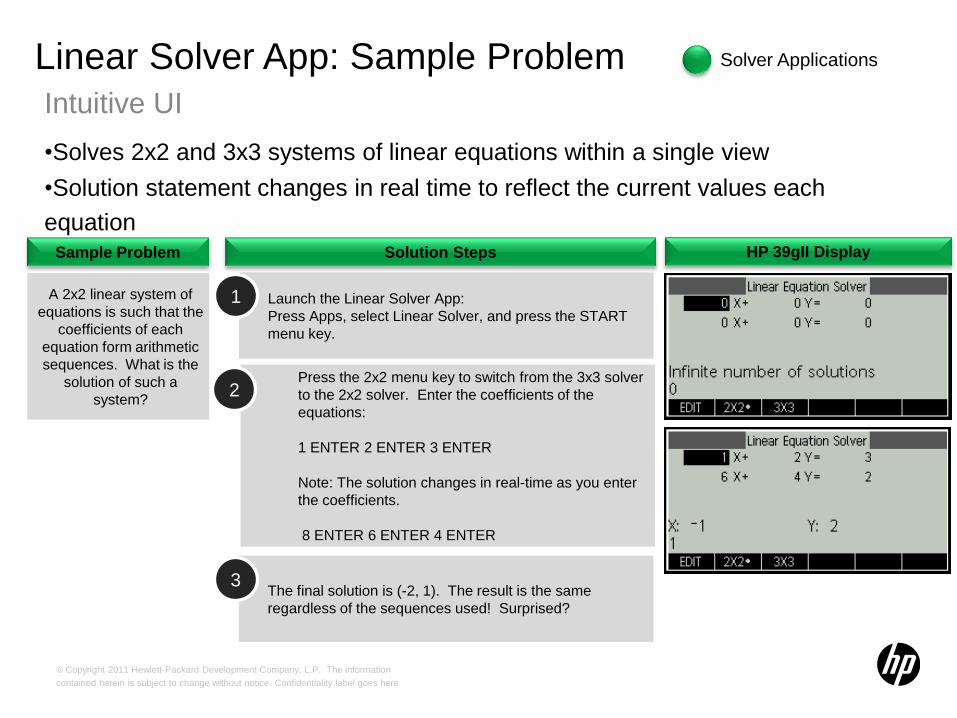
Linear Solver App: Sample Problem
•Solves 2x2 and 3x3 systems of linear equations within a single view
•Solution statement changes in real time to reflect the current values each
equation HP 39gII Display
A 2x2 linear system of
equations is such that the
coefficients of each
equation form arithmetic
sequences. What is the
solution of such a
system?
Sample Problem Solution Steps
Launch the Linear Solver App:
Press Apps, select Linear Solver, and press the START
menu key.
1
Press the 2x2 menu key to switch from the 3x3 solver
to the 2x2 solver. Enter the coefficients of the
equations:
1 ENTER 2 ENTER 3 ENTER
Note: The solution changes in real-time as you enter
the coefficients.
8 ENTER 6 ENTER 4 ENTER
2
Solver Applications
The final solution is (-2, 1). The result is the same
regardless of the sequences used! Surprised?
3
© Copyright 2011 Hewlett-Packard Development Company, L.P. The information
contained herein is subject to change without notice. Confidentiality label goes here
Intuitive UI
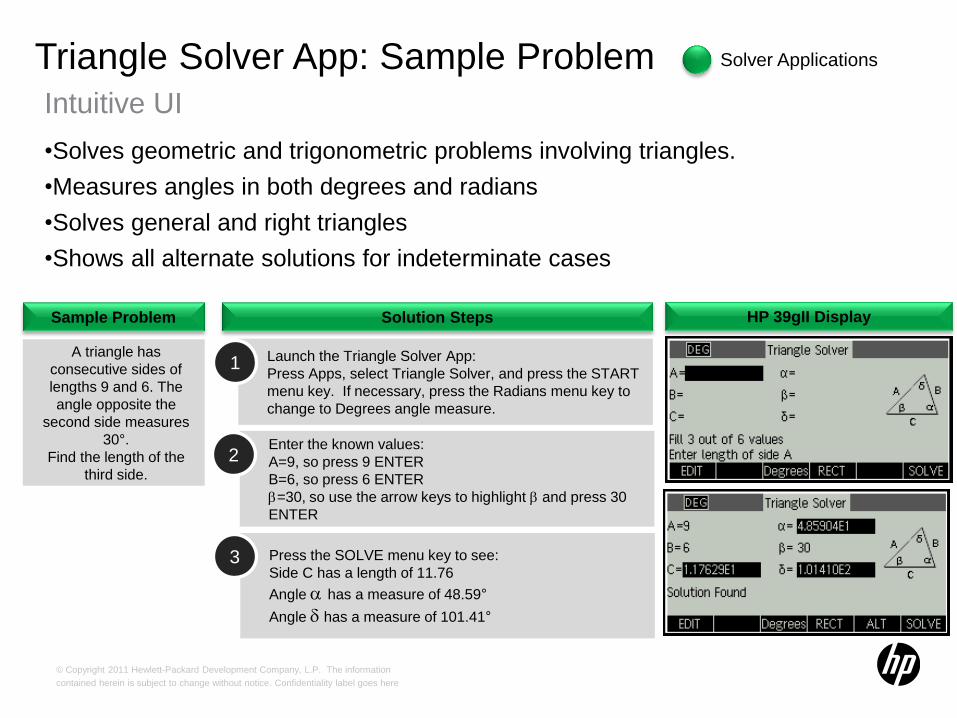
Triangle Solver App: Sample Problem
•Solves geometric and trigonometric problems involving triangles.
•Measures angles in both degrees and radians
•Solves general and right triangles
•Shows all alternate solutions for indeterminate cases
HP 39gII Display
A triangle has
consecutive sides of
lengths 9 and 6. The
angle opposite the
second side measures
30°.
Find the length of the
third side.
Sample Problem Solution Steps
Launch the Triangle Solver App:
Press Apps, select Triangle Solver, and press the START
menu key. If necessary, press the Radians menu key to
change to Degrees angle measure.
1
Enter the known values:
A=9, so press 9 ENTER
B=6, so press 6 ENTER
=30, so use the arrow keys to highlight and press 30
ENTER
2
Press the SOLVE menu key to see:
Side C has a length of 11.76
Angle has a measure of 48.59°
Angle has a measure of 101.41°
Solver Applications
3
© Copyright 2011 Hewlett-Packard Development Company, L.P. The information
contained herein is subject to change without notice. Confidentiality label goes here
Intuitive UI
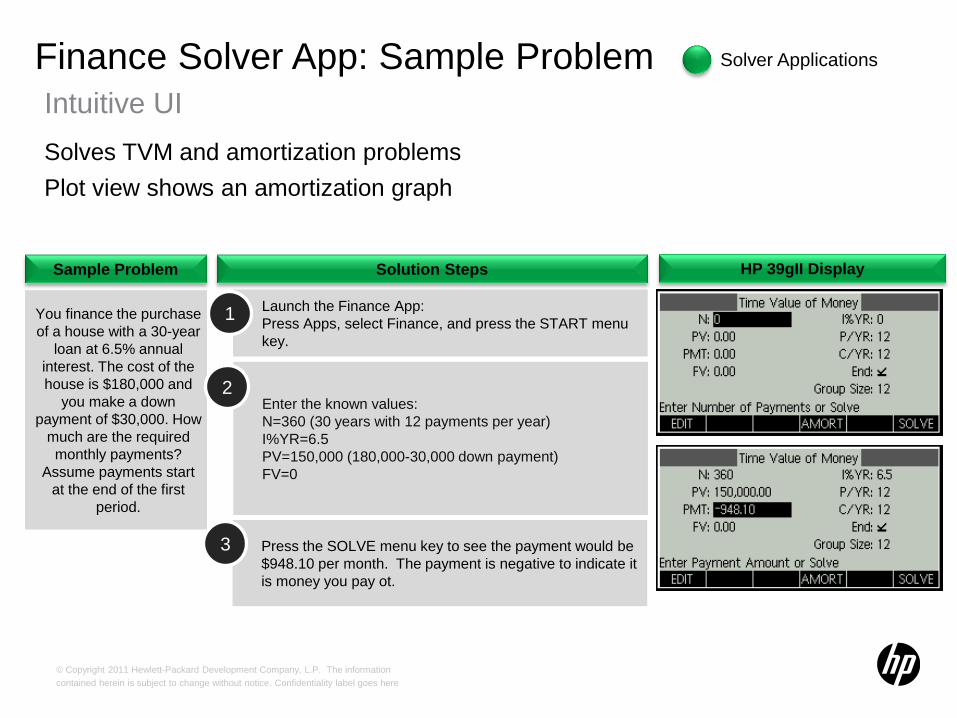
Finance Solver App: Sample Problem
HP 39gII Display
You finance the purchase
of a house with a 30-year
loan at 6.5% annual
interest. The cost of the
house is $180,000 and
you make a down
payment of $30,000. How
much are the required
monthly payments?
Assume payments start
at the end of the first
period.
Sample Problem Solution Steps
Launch the Finance App:
Press Apps, select Finance, and press the START menu
key.
1
Enter the known values:
N=360 (30 years with 12 payments per year)
I%YR=6.5
PV=150,000 (180,000-30,000 down payment)
FV=0
2
Press the SOLVE menu key to see the payment would be
$948.10 per month. The payment is negative to indicate it
is money you pay ot.
3
Solver Applications
Solves TVM and amortization problems
Plot view shows an amortization graph
© Copyright 2011 Hewlett-Packard Development Company, L.P. The information
contained herein is subject to change without notice. Confidentiality label goes here
Intuitive UI
Explorer Apps Overview
• Overview:
–Students manipulate a graph and observe the change in the equation parameters
–Students can also change each parameter ad observe the effect on the graph
–Designed to facilitate explorations of function families
–Test your skill functionality
• Views:
–Plot View
–EQ View
–Test Mode
• Apps and Functionality:
–Linear Explorer: explore linear functions of the form y=ax and y=ax+b
–Quadratic Explorer: explore quadratic functions of the form y=ax2, y=x2+c, and y=a(x-
h)2+v
–Trig Explorer: explore sine and cosine equations
25
Explorer Applications
© Copyright 2011 Hewlett-Packard Development Company, L.P. The information
contained herein is subject to change without notice. Confidentiality label goes here
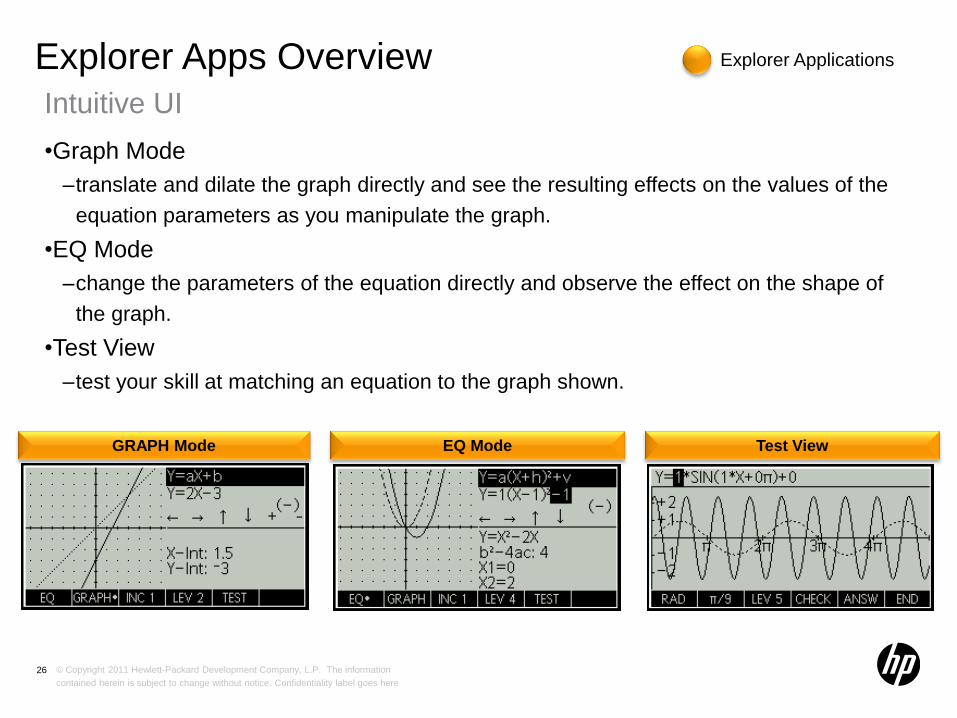
Intuitive UI
Explorer Apps Overview
•Graph Mode
–translate and dilate the graph directly and see the resulting effects on the values of the
equation parameters as you manipulate the graph.
•EQ Mode
–change the parameters of the equation directly and observe the effect on the shape of
the graph.
•Test View
–test your skill at matching an equation to the graph shown.
26
GRAPH Mode EQ Mode Test View
Explorer Applications
© Copyright 2011 Hewlett-Packard Development Company, L.P. The information
contained herein is subject to change without notice. Confidentiality label goes here
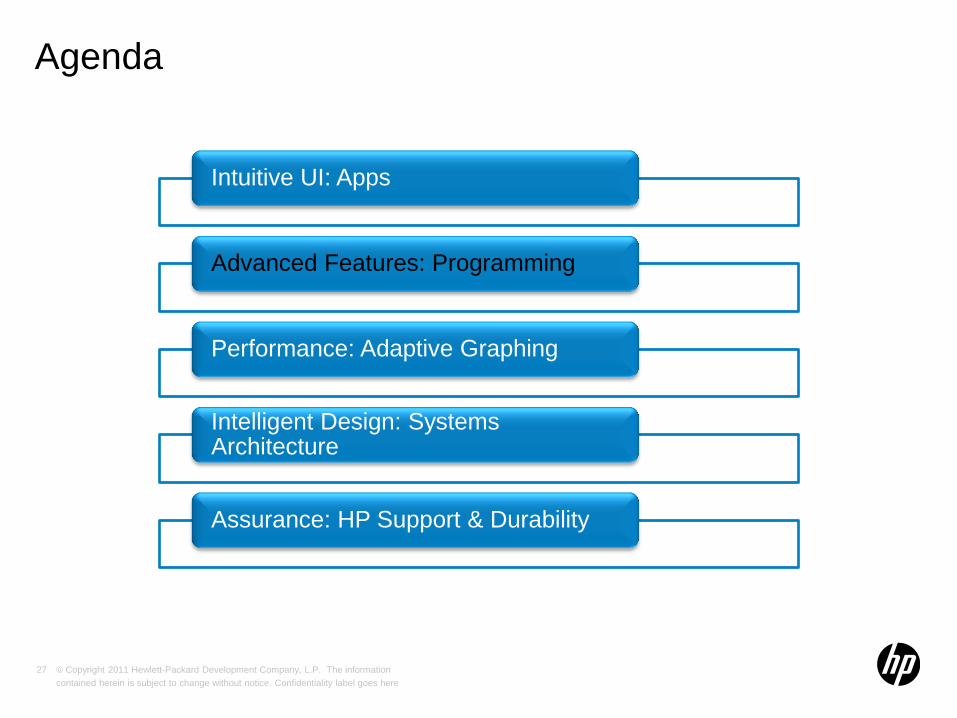
Agenda
27
Intuitive UI: Apps
Advanced Features: Programming
Performance: Adaptive Graphing
Intelligent Design: Systems Architecture
Assurance: HP Support & Durability
© Copyright 2011 Hewlett-Packard Development Company, L.P. The information
contained herein is subject to change without notice. Confidentiality label goes here
Overview
Programming
• The HP 39gII is fully programmable and has its own program catalog and editor
• User-defined functions
–Define and export new functions & functions will appear in the Math menu
• Each HP app has its own program of the same name that can be used to
customize the app
• The views of each HP app can be customized in a similar way
• App Functions
–Certain apps have functions that expose their functionality
28
© Copyright 2011 Hewlett-Packard Development Company, L.P. The information
contained herein is subject to change without notice. Confidentiality label goes here
Advanced Features
Program Catalog & Program Editor
29
Steps
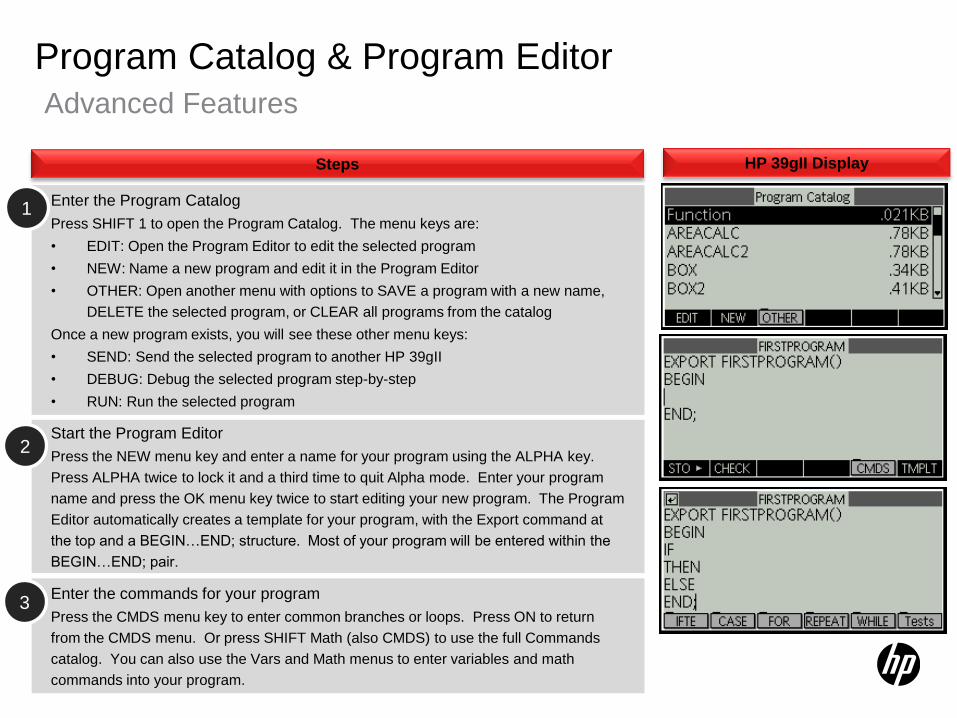
Enter the Program Catalog
Press SHIFT 1 to open the Program Catalog. The menu keys are:
• EDIT: Open the Program Editor to edit the selected program
• NEW: Name a new program and edit it in the Program Editor
• OTHER: Open another menu with options to SAVE a program with a new name,
DELETE the selected program, or CLEAR all programs from the catalog
Once a new program exists, you will see these other menu keys:
• SEND: Send the selected program to another HP 39gII
• DEBUG: Debug the selected program step-by-step
• RUN: Run the selected program
1
Start the Program Editor
Press the NEW menu key and enter a name for your program using the ALPHA key.
Press ALPHA twice to lock it and a third time to quit Alpha mode. Enter your program
name and press the OK menu key twice to start editing your new program. The Program
Editor automatically creates a template for your program, with the Export command at
the top and a BEGIN…END; structure. Most of your program will be entered within the
BEGIN…END; pair.
2
Enter the commands for your program
Press the CMDS menu key to enter common branches or loops. Press ON to return
from the CMDS menu. Or press SHIFT Math (also CMDS) to use the full Commands
catalog. You can also use the Vars and Math menus to enter variables and math
commands into your program.
3
HP 39gII Display
© Copyright 2011 Hewlett-Packard Development Company, L.P. The information
contained herein is subject to change without notice. Confidentiality label goes here
Advanced Features
User-defined Functions: Example
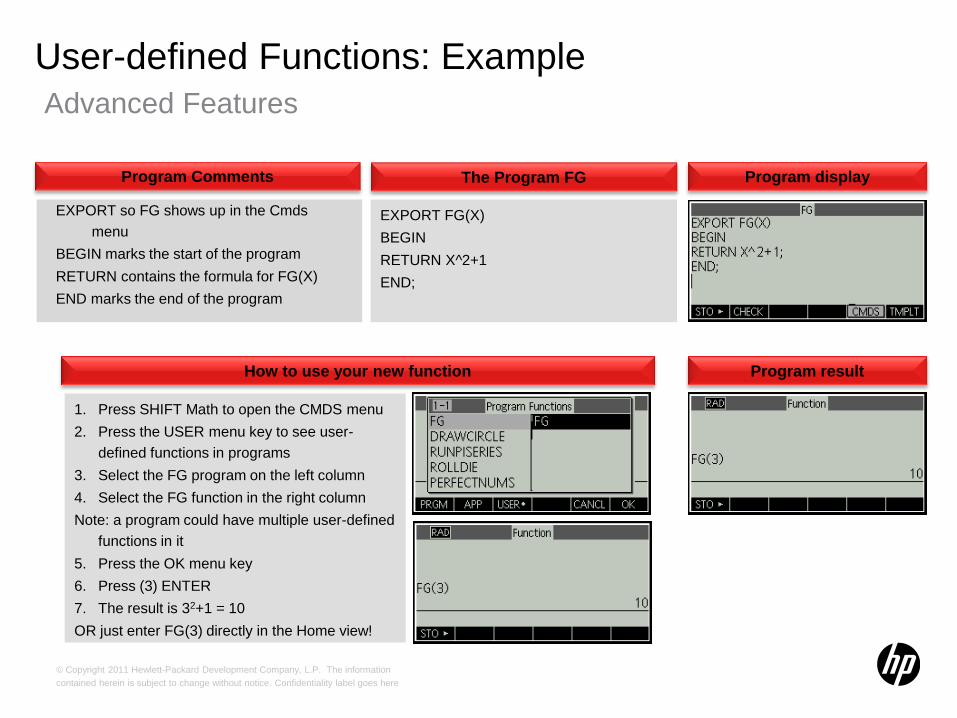
The Program FG
EXPORT FG(X)
BEGIN
RETURN X^2+1
END;
Program display
Program result
Program Comments
EXPORT so FG shows up in the Cmds
menu
BEGIN marks the start of the program
RETURN contains the formula for FG(X)
END marks the end of the program
1. Press SHIFT Math to open the CMDS menu
2. Press the USER menu key to see user-
defined functions in programs
3. Select the FG program on the left column
4. Select the FG function in the right column
Note: a program could have multiple user-defined
functions in it
5. Press the OK menu key
6. Press (3) ENTER
7. The result is 32+1 = 10
OR just enter FG(3) directly in the Home view!
How to use your new function
© Copyright 2011 Hewlett-Packard Development Company, L.P. The information
contained herein is subject to change without notice. Confidentiality label goes here
Advanced Features
Utilizing Graphics Commands
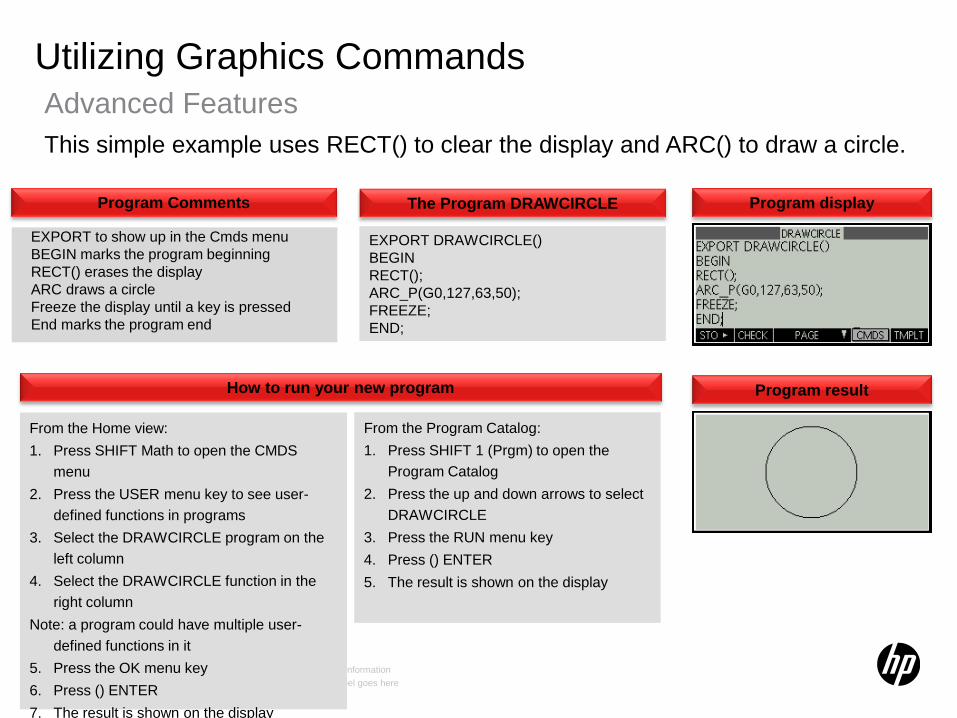
The Program DRAWCIRCLE
EXPORT DRAWCIRCLE()
BEGIN
RECT();
ARC_P(G0,127,63,50);
FREEZE;
END;
Program display
Program result
Program Comments
EXPORT to show up in the Cmds menu
BEGIN marks the program beginning
RECT() erases the display
ARC draws a circle
Freeze the display until a key is pressed
End marks the program end
This simple example uses RECT() to clear the display and ARC() to draw a circle.
From the Home view:
1. Press SHIFT Math to open the CMDS
menu
2. Press the USER menu key to see user-
defined functions in programs
3. Select the DRAWCIRCLE program on the
left column
4. Select the DRAWCIRCLE function in the
right column
Note: a program could have multiple user-
defined functions in it
5. Press the OK menu key
6. Press () ENTER
7. The result is shown on the display
From the Program Catalog:
1. Press SHIFT 1 (Prgm) to open the
Program Catalog
2. Press the up and down arrows to select
DRAWCIRCLE
3. Press the RUN menu key
4. Press () ENTER
5. The result is shown on the display
How to run your new program
© Copyright 2011 Hewlett-Packard Development Company, L.P. The information
contained herein is subject to change without notice. Confidentiality label goes here
Advanced Features
Utilizing Loops
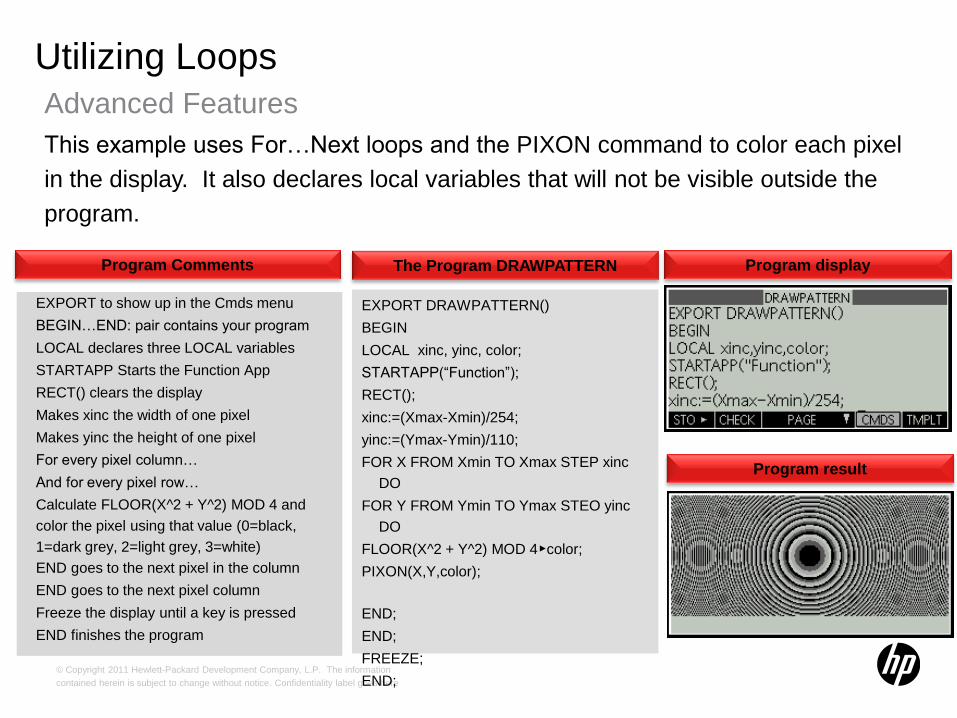
The Program DRAWPATTERN
EXPORT DRAWPATTERN()
BEGIN
LOCAL xinc, yinc, color;
STARTAPP(“Function”);
RECT();
xinc:=(Xmax-Xmin)/254;
yinc:=(Ymax-Ymin)/110;
FOR X FROM Xmin TO Xmax STEP xinc
DO
FOR Y FROM Ymin TO Ymax STEO yinc
DO
FLOOR(X^2 + Y^2) MOD 4▶color;
PIXON(X,Y,color);
END;
END;
FREEZE;
END;
Program display
Program result
Program Comments
EXPORT to show up in the Cmds menu
BEGIN…END: pair contains your program
LOCAL declares three LOCAL variables
STARTAPP Starts the Function App
RECT() clears the display
Makes xinc the width of one pixel
Makes yinc the height of one pixel
For every pixel column…
And for every pixel row…
Calculate FLOOR(X^2 + Y^2) MOD 4 and
color the pixel using that value (0=black,
1=dark grey, 2=light grey, 3=white)
END goes to the next pixel in the column
END goes to the next pixel column
Freeze the display until a key is pressed
END finishes the program
This example uses For…Next loops and the PIXON command to color each pixel
in the display. It also declares local variables that will not be visible outside the
program.
© Copyright 2011 Hewlett-Packard Development Company, L.P. The information
contained herein is subject to change without notice. Confidentiality label goes here
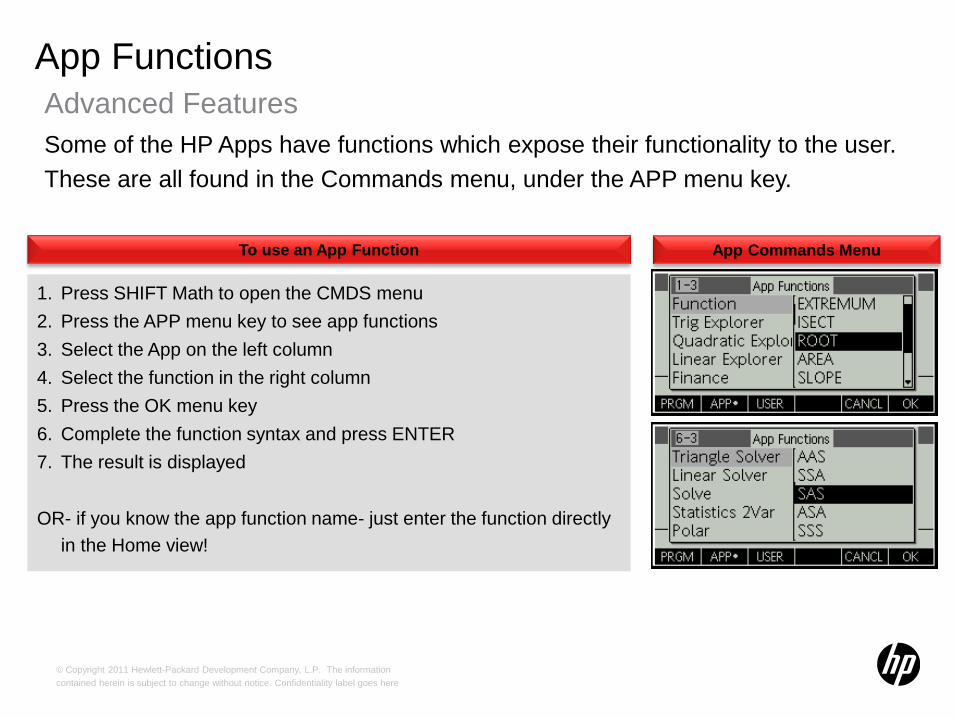
Advanced Features
App Functions
App Commands Menu To use an App Function
1. Press SHIFT Math to open the CMDS menu
2. Press the APP menu key to see app functions
3. Select the App on the left column
4. Select the function in the right column
5. Press the OK menu key
6. Complete the function syntax and press ENTER
7. The result is displayed
OR- if you know the app function name- just enter the function directly
in the Home view!
Some of the HP Apps have functions which expose their functionality to the user.
These are all found in the Commands menu, under the APP menu key.
© Copyright 2011 Hewlett-Packard Development Company, L.P. The information
contained herein is subject to change without notice. Confidentiality label goes here
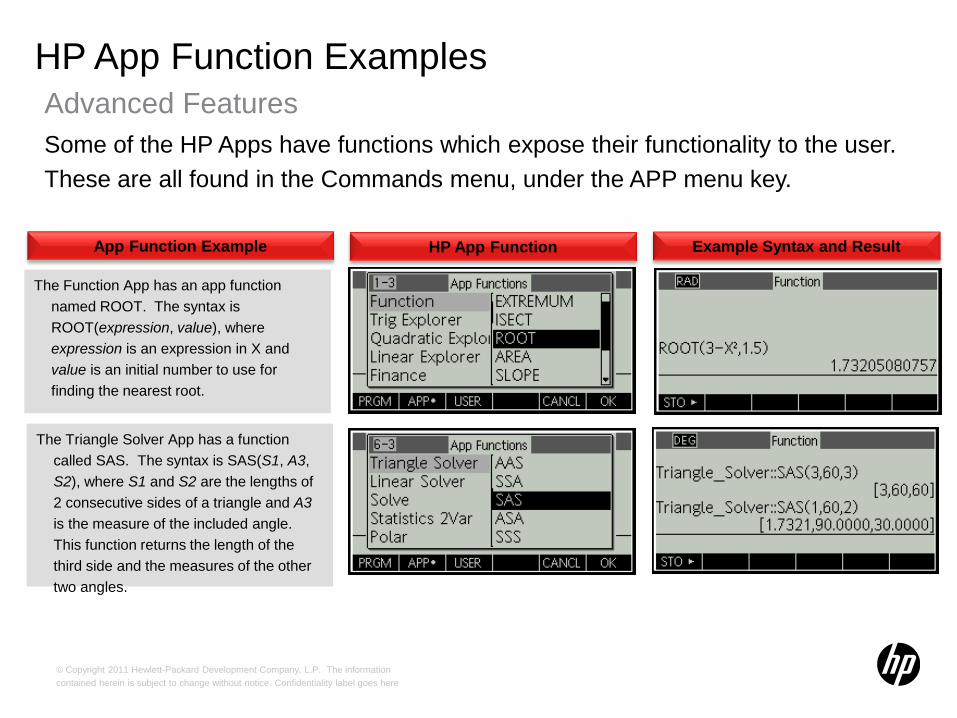
Advanced Features
HP App Function Examples
HP App Function
The Function App has an app function
named ROOT. The syntax is
ROOT(expression, value), where
expression is an expression in X and
value is an initial number to use for
finding the nearest root.
Example Syntax and Result App Function Example
Some of the HP Apps have functions which expose their functionality to the user.
These are all found in the Commands menu, under the APP menu key.
The Triangle Solver App has a function
called SAS. The syntax is SAS(S1, A3,
S2), where S1 and S2 are the lengths of
2 consecutive sides of a triangle and A3
is the measure of the included angle.
This function returns the length of the
third side and the measures of the other
two angles.
© Copyright 2011 Hewlett-Packard Development Company, L.P. The information
contained herein is subject to change without notice. Confidentiality label goes here
Agenda
35
Intuitive UI: Apps
Advanced Features: Programming
Performance: Adaptive Graphing
Intelligent Design: Systems Architecture
Assurance: HP Support & Durability
© Copyright 2011 Hewlett-Packard Development Company, L.P. The information
contained herein is subject to change without notice. Confidentiality label goes here
Performance
Graphing Technologies
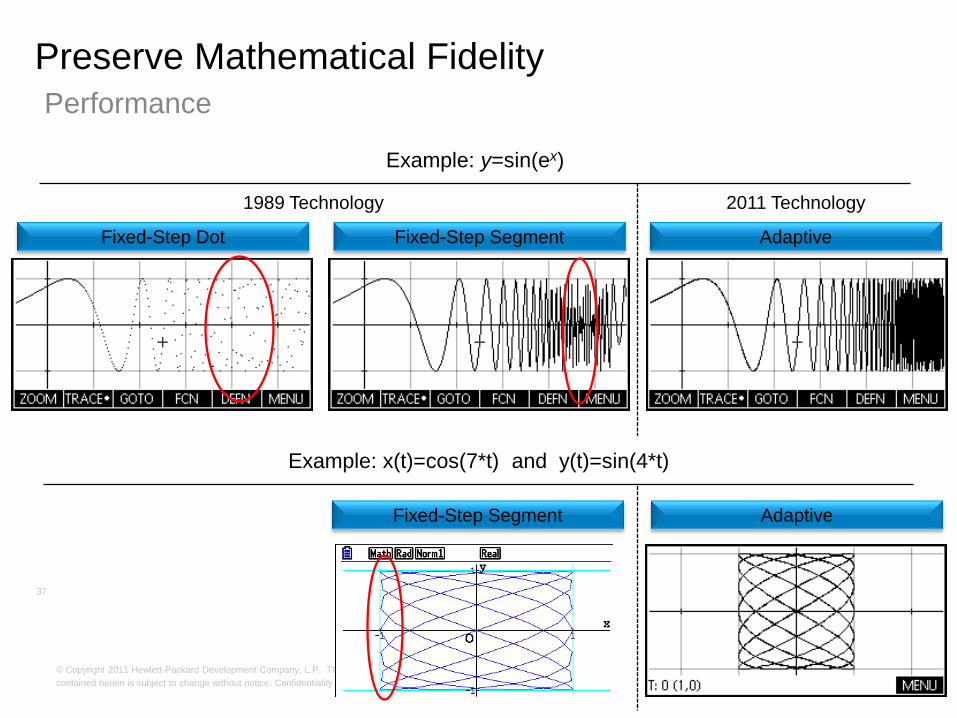
• Adaptive –Samples along the entire length of the graph and adjusts as
necessary to produce a very accurate graph.
• Fixed-step segment – Moves from left to right and connects points with line
segments. This is the “classic” way of plotting a graph.
• Fixed-step dot – Similar to the fixed-step segment, except is does not connect
the points with segments
36
© Copyright 2011 Hewlett-Packard Development Company, L.P. The information
contained herein is subject to change without notice. Confidentiality label goes here
Performance
Preserve Mathematical Fidelity
37
2011 Technology 1989 Technology
Fixed-Step Dot Fixed-Step Segment Adaptive
Example: y=sin(ex)
Example: x(t)=cos(7*t) and y(t)=sin(4*t)
Fixed-Step Segment Adaptive
© Copyright 2011 Hewlett-Packard Development Company, L.P. The information
contained herein is subject to change without notice. Confidentiality label goes here
Agenda
38
Intuitive UI: Apps
Advanced Features: Programming
Performance: Adaptive Graphing
Intelligent Design: Systems Architecture
Assurance: HP Support & Durability
© Copyright 2011 Hewlett-Packard Development Company, L.P. The information
contained herein is subject to change without notice. Confidentiality label goes here
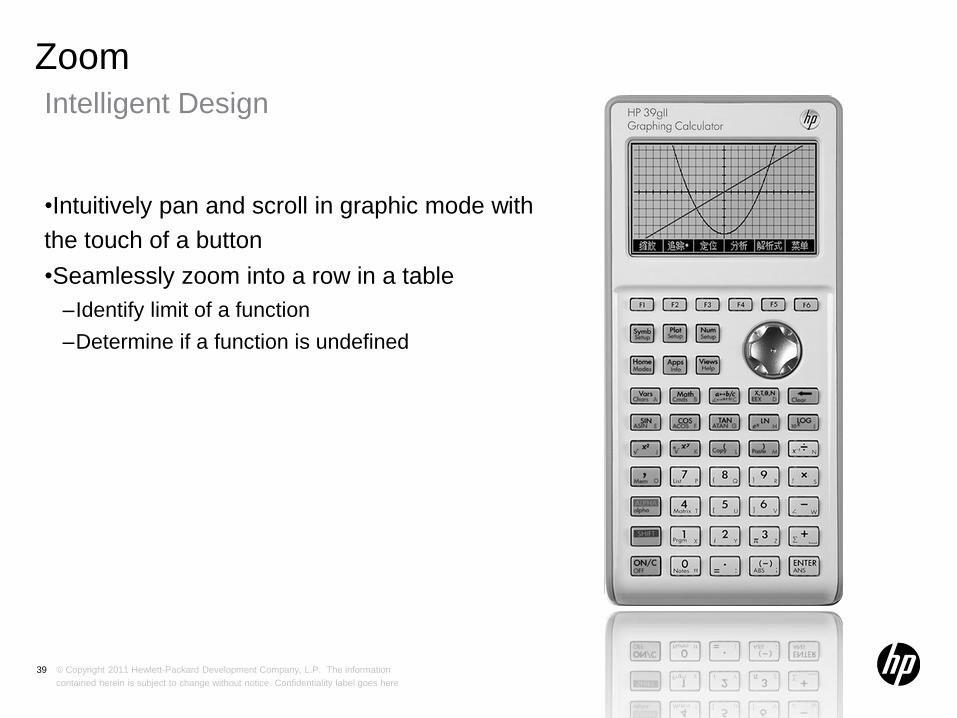
Intelligent Design
Zoom
•Intuitively pan and scroll in graphic mode with
the touch of a button
•Seamlessly zoom into a row in a table
–Identify limit of a function
–Determine if a function is undefined
39
© Copyright 2011 Hewlett-Packard Development Company, L.P. The information
contained herein is subject to change without notice. Confidentiality label goes here
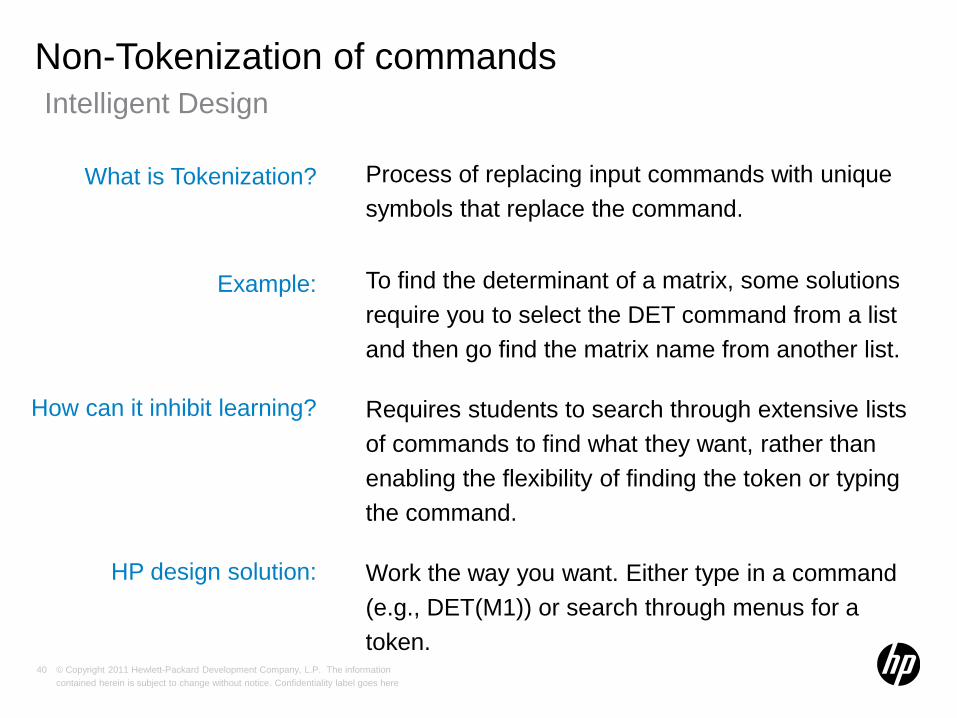
Intelligent Design
Non-Tokenization of commands
Process of replacing input commands with unique
symbols that replace the command.
To find the determinant of a matrix, some solutions
require you to select the DET command from a list
and then go find the matrix name from another list.
Requires students to search through extensive lists
of commands to find what they want, rather than
enabling the flexibility of finding the token or typing
the command.
Work the way you want. Either type in a command
(e.g., DET(M1)) or search through menus for a
token.
What is Tokenization?
Example:
How can it inhibit learning?
HP design solution:
40
© Copyright 2011 Hewlett-Packard Development Company, L.P. The information
contained herein is subject to change without notice. Confidentiality label goes here
Agenda
41
Intuitive UI: Apps
Advanced Features: Programming
Performance: Adaptive Graphing
Intelligent Design: Systems Architecture
Assurance: HP Support & Durability
© Copyright 2011 Hewlett-Packard Development Company, L.P. The information
contained herein is subject to change without notice. Confidentiality label goes here
Assurance
Support Materials
• User Guide
–Web-based
–Based on HP39gs User Guide
• Quick Start Guide
–Comprehensive getting started guide
–Includes complete App summary with all apps and respective views
• Online Help
–Full Translation
–Fully contextual and provides help each app, view and menu

© Copyright 2011 Hewlett-Packard Development Company, L.P. The information
contained herein is subject to change without notice. Confidentiality label goes here
Assurance
Famous HP Durability
“I had a Truck run over my HP-11C and it worked fine for several years…”
-Souza, Tim. 7 JUL 01. hpmuseum.org
“I would routinely toss my HP 6 feet away to the hard brick of "red square" to demonstrate its durability”
-Brogger, Paul. 2 APR 00. hpmusuem.org.
“I bought my HP-15C when I was a sophomore EE in 1984. Its built-in imaginary number capability was a
real time-saver in linear circuits. I used it heavily through my undergraduate years and often since then.
The amazing thing is that it is still running on the batteries that were in it when I bought it. Previously, I
had used cheap calculators that I had to throw away after a year or two, but this is the last calculator I
ever had to buy.”
-Yount, Chuck. 1 SEP 00. hpmuseum.org.
43

© Copyright 2011 Hewlett-Packard Development Company, L.P. The information
contained herein is subject to change without notice. Confidentiality label goes here
Questions?
44
?
© Copyright 2011 Hewlett-Packard Development Company, L.P. The information
contained herein is subject to change without notice. Confidentiality label goes here
Thank You