Embed Size (px)
Citation preview
?
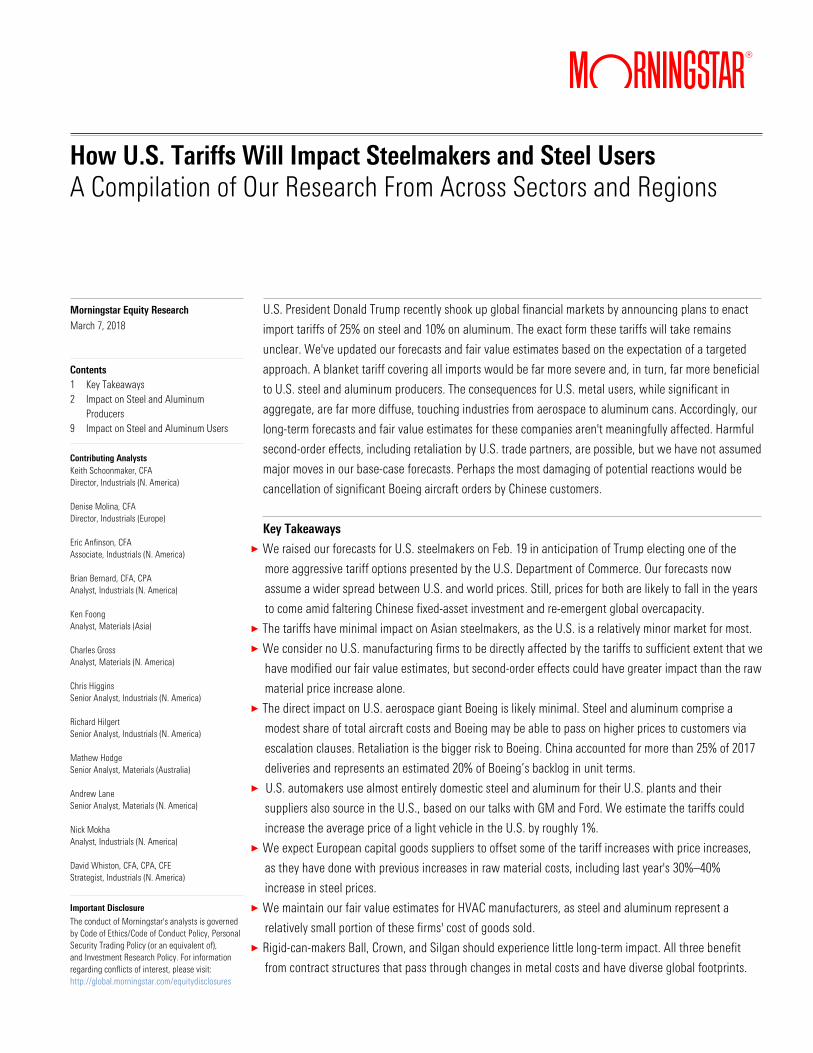
How U.S. Tariffs Will Impact Steelmakers and Steel Users A Compilation of Our Research From Across Sectors and Regions
U.S. President Donald Trump recently shook up global financial markets by announcing plans to enact
import tariffs of 25% on steel and 10% on aluminum. The exact form these tariffs will take remains
unclear. We've updated our forecasts and fair value estimates based on the expectation of a targeted
approach. A blanket tariff covering all imports would be far more severe and, in turn, far more beneficial
to U.S. steel and aluminum producers. The consequences for U.S. metal users, while significant in
aggregate, are far more diffuse, touching industries from aerospace to aluminum cans. Accordingly, our
long-term forecasts and fair value estimates for these companies aren't meaningfully affected. Harmful
second-order effects, including retaliation by U.S. trade partners, are possible, but we have not assumed
major moves in our base-case forecasts. Perhaps the most damaging of potential reactions would be
cancellation of significant Boeing aircraft orders by Chinese customers.
Key Takeaways
× We raised our forecasts for U.S. steelmakers on Feb. 19 in anticipation of Trump electing one of the
more aggressive tariff options presented by the U.S. Department of Commerce. Our forecasts now
assume a wider spread between U.S. and world prices. Still, prices for both are likely to fall in the years
to come amid faltering Chinese fixed-asset investment and re-emergent global overcapacity.
× The tariffs have minimal impact on Asian steelmakers, as the U.S. is a relatively minor market for most.
× We consider no U.S. manufacturing firms to be directly affected by the tariffs to sufficient extent that we
have modified our fair value estimates, but second-order effects could have greater impact than the raw
material price increase alone.
× The direct impact on U.S. aerospace giant Boeing is likely minimal. Steel and aluminum comprise a
modest share of total aircraft costs and Boeing may be able to pass on higher prices to customers via
escalation clauses. Retaliation is the bigger risk to Boeing. China accounted for more than 25% of 2017
deliveries and represents an estimated 20% of Boeing’s backlog in unit terms.
× U.S. automakers use almost entirely domestic steel and aluminum for their U.S. plants and their
suppliers also source in the U.S., based on our talks with GM and Ford. We estimate the tariffs could
increase the average price of a light vehicle in the U.S. by roughly 1%.
× We expect European capital goods suppliers to offset some of the tariff increases with price increases,
as they have done with previous increases in raw material costs, including last year's 30%–40%
increase in steel prices.
× We maintain our fair value estimates for HVAC manufacturers, as steel and aluminum represent a
relatively small portion of these firms' cost of goods sold.
× Rigid-can-makers Ball, Crown, and Silgan should experience little long-term impact. All three benefit
from contract structures that pass through changes in metal costs and have diverse global footprints.
Morningstar Equity Research March 7, 2018 Contents 1 Key Takeaways 2 Impact on Steel and Aluminum Producers 9 Impact on Steel and Aluminum Users Contributing Analysts Keith Schoonmaker, CFA Director, Industrials (N. America) Denise Molina, CFA Director, Industrials (Europe) Eric Anfinson, CFA Associate, Industrials (N. America) Brian Bernard, CFA, CPA Analyst, Industrials (N. America) Ken Foong Analyst, Materials (Asia) Charles Gross Analyst, Materials (N. America) Chris Higgins Senior Analyst, Industrials (N. America) Richard Hilgert Senior Analyst, Industrials (N. America) Mathew Hodge Senior Analyst, Materials (Australia) Andrew Lane Senior Analyst, Materials (N. America) Nick Mokha Analyst, Industrials (N. America) David Whiston, CFA, CPA, CFE Strategist, Industrials (N. America)
Important Disclosure
The conduct of Morningstar's analysts is governed by Code of Ethics/Code of Conduct Policy, Personal Security Trading Policy (or an equivalent of), and Investment Research Policy. For information regarding conflicts of interest, please visit: http://global.morningstar.com/equitydisclosures
How U.S. Tariffs Will Impact Steelmakers and Steel Users | 7 March 2018 | See Important Disclosures at the end of this report.
Page 2 of 23
Impact on Steel and Aluminum Producers
Trump to Impose Steel and Aluminum Import Tariffs | March 1, 2018
Andrew Lane
After meeting with steel and aluminum executives at the White House on March 1, President Donald
Trump announced that he'll be enacting a 25% steel tariff and a 10% aluminum tariff next week. It is
unclear, however, if this approach will be applied in a blanket fashion to all countries or only to a
targeted list of countries. This is a critical distinction, because we'd view a blanket approach as far more
severe and, in turn, far more beneficial for the prospects of U.S. steel and aluminum producers. Our
base-case expectations for U.S. steel prices, margins, and shipment volumes continue to assume that
final sanctions will be targeted. If Trump instead pursues a more widespread approach, we'd probably
increase the fair value estimates for the U.S. steel and aluminum producers we cover.
In its Feb. 16 Section 232 report the blanket tariffs proposed by the U.S. Department of Commerce were
24% for all steel imports and 7.7% for all aluminum imports, both less severe than the figures indicated
by Trump on March 1. (See below for related analyst notes from Feb. 19 and Feb. 18.) However, the
agency had also recommended 53% targeted tariffs for steel and 23.6% targeted tariffs for aluminum.
Therefore, the actions proposed by Trump could be viewed as more punitive or significantly less punitive
than the recommended sanctions depending on their scope.
There has reportedly been significant disagreement among Trump's advisors as to how severe the
resulting tariffs should be. On one hand, trade hawks, including Commerce Secretary Wilbur Ross, U.S.
Trade Representative Robert Lighthizer, and trade advisor Peter Navarro, have pushed for steep tariffs
and quotas, while others, including Chief Economic Advisor Gary Cohn have supported a less heavy-
handed approach. (Cohn resigned over this issue March 6.) Steeper tariffs increase the risk of retaliation
from trading partners as well as unintended negative effects on the profits of U.S. industries that are
heavy steel consumers.
How U.S. Tariffs Will Impact Steelmakers and Steel Users | 7 March 2018 | See Important Disclosures at the end of this report.
Page 3 of 23
Raising U.S. Steelmaker FVEs With Import Protection on the Horizon | Feb. 19, 2018
Andrew Lane
We've updated our fair value estimates for all U.S. steel producers under our coverage to reflect the
implications of the Department of Commerce's Section 232 recommendations. As discussed in our Feb.
18 note "Department of Commerce Recommends Highly Punitive Countermeasures for Steel and
Aluminum Imports," we expect President Trump to enact targeted tariffs rather than a blanket tariff or
quota. Trump now has 90 days from Feb. 16 to review the proposals and determine the appropriate
course of action. Given Trump's repeated promises that he would protect the U.S. steel industry, we fully
expect him to follow through on one of the aggressive recommendations provided.
The magnitude of our fair value estimate adjustments are largely a function of the varying degrees of
operating leverage, financial leverage, and raw material self-sufficiency. Our fair value estimates for U.S.
Steel (now $20 per share), ArcelorMittal ($17), and AK Steel ($4.50) increase the most. To a lesser
degree, we also raised our fair value estimates for Schnitzer Steel Industries (now $20 per share),
Commercial Metals ($18), Steel Dynamics ($28), Nucor ($48), and Reliance Steel & Aluminum ($70). Our
no-moat ratings for each of these companies are unchanged.
Assuming the targeted tariff program is enacted, we now expect U.S. steel prices to sustain a wider
spread above world export prices. Our midcycle U.S. hot-rolled coil price forecast rises to $460 per short
ton from $420, while our midcycle U.S. rebar price forecast rises to $500 per short ton from $430 (both
above marginal cost).
Additionally, we've increased our shipment volume forecasts (to varying degrees) for each of these
companies, as they will be able to capture market share forgone by targeted countries. This combination
of factors, along with the benefits of operating leverage as capacity utilization rises, would boost
industry margins above our prior forecasts.
Although the Section 232 investigation has long been discussed, we did not anticipate that the resulting
recommendations would be as punitive as those announced by the Department of Commerce. First, even
though steel import volumes remain well above historical levels, accounting for roughly 30% of U.S. steel
consumption in 2017, U.S. steelmakers have for the most part delivered impressive profits over the past
couple of years. Indeed, thanks to healthy demand and elevated prices, lower-cost U.S. steelmakers are
now profiting at near-record levels.
Second, we expected that significant opposition to the Section 232 investigation from major steel-
consuming industries would short-circuit the Trump administration's desire for heavy sanctions. The
recommended tariffs or import quotas will likely drive steel prices still higher, weighing on the
profitability of downstream buyers (who represent a much larger portion of the U.S. economy than the
steelmakers themselves).
Finally, we viewed the potential risk of igniting an all-out trade war as another factor that might throw a
wet blanket over the potential for highly punitive sanctions.
How U.S. Tariffs Will Impact Steelmakers and Steel Users | 7 March 2018 | See Important Disclosures at the end of this report.
Page 4 of 23
Regardless, the Department of Commerce willingly dismissed these considerations and laid out an
aggressive menu of options from which Trump will choose. Trump's track record with executive orders
indicates that he won't shy away from pursuing one of the suggested courses of action. If so, the
potential implications of a disruption to U.S. economic growth and retaliation from U.S. trade partners
are unclear.
What is crystal clear, however, is that this development is a major boon for U.S. steelmakers. We
maintain a bearish outlook for global steel prices due to our below-consensus outlook for Chinese fixed-
asset investment and our expectation that structural overcapacity will persist on a global scale.
However, the proposed protection for the U.S. steel industry will help insulate it from a global downdraft
over the medium term and likely drive heady profits even higher in the near term.
Department of Commerce Recommends Highly Punitive Countermeasures for Steel and Aluminum
Imports | February 18, 2018
Andrew Lane
We're likely to raise our price decks, volume forecasts, margin expectations, and fair value estimates for
U.S. steel and aluminum stocks under our coverage. On Feb. 16, the Department of Commerce released
lengthy reports providing recommendations in response to its Section 232 investigations suggesting
heavy tariffs or quotas on steel and aluminum imports to the U.S. The recommended remedies were
calculated to achieve an 80% capacity utilization rate for each industry. President Trump now has 90
days to review the proposals and determine the appropriate course of action. Effectively, Trump has
been provided a menu of options to address each industry that includes a global quota, a global tariff, or
individual tariffs on a subset of countries. All potential tariffs and quotas would be in addition to the
plethora of antidumping and countervailing duties that are already in place.
If the Department of Commerce's recommendations are enacted, the actions will be met with significant
opposition. Within the U.S., companies that consume high volumes of steel and aluminum will continue
to object, as their steel and aluminum input costs are likely to rise. Outside the U.S., countries that
export large volumes of steel and aluminum to the U.S. will object that this unilateral action breaches
international trade obligations, as established under the World Trade Organization. A series of appeals
to the WTO would likely follow. Many argue that this aggressive action might spur an all-out trade war,
as targeted countries might retaliate with trade sanctions of their own on U.S. export products. Given
that the recommendations have been made under the guise of protecting the country's national security
(the nature of a Section 232 investigation), widely believed to be a "loophole" that facilitates
protectionism, U.S. trade partners are likely to cry foul. Regardless, we think it's highly likely that Trump
follows through on some form of these recommendations.
For steel imports, the Department of Commerce suggests a global quota of 63% of 2017 import volumes
on a go-forward basis, limiting imports to 22.7 million metric tons. Alternatively, it recommends a 24%
import tariff on all steel imports. The third option includes targeted, country-specific tariffs of 53% for

How U.S. Tariffs Will Impact Steelmakers and Steel Users | 7 March 2018 | See Important Disclosures at the end of this report.
Page 5 of 23
Brazil, South Korea, Russia, Turkey, India, Vietnam, China, Thailand, South Africa, Egypt, Malaysia, and
Costa Rica.
For aluminum imports, the Department of Commerce suggests a global quota of 86.7% of 2017 import
volumes on a go-forward basis, limiting imports to 4.4 million metric tons. Alternatively, it recommends a
7.7% import tariff on aluminum imports. The third option includes targeted, country-specific tariffs of
23.6% for China, Hong Kong, Russia, Venezuela, and Vietnam.
The targeted solutions for either industry would still limit imports from all other countries to only 100% of
their 2017 import levels going forward, that is, no incremental volumes. Both reports leave room for
exemptions for certain countries and exclusions for certain product types. Ultimately, any final version
could include a combination of the various recommended measures.
Although difficult to handicap the most likely outcome, we'd expect the Trump administration to enact
tariffs targeting specific countries for both steel and aluminum imports. The potential target countries
listed above are, for the most part, countries with which the U.S. already has icy trade relationships. This
approach would rankle fewer trade partners and reduce the risk of widespread retaliation on the trade
front versus the potential fallout from blanket tariffs or quotas.
Regarding the steel and aluminum companies we cover, the impact of increased protectionism in the
form of tariffs would expand the spread between U.S. metals prices and world export prices.
Additionally, foregone import volumes would be replaced by higher volumes from U.S. producers.
Accordingly, margin expansion would be supported by two main factors. First, metals margins would
likely expand, with average selling prices rising more than raw material prices. Second, given the high
capital-intensity and fixed costs inherent to the steel and aluminum industries, higher capacity utilization
would drive the benefits of operating leverage as production volumes rise.
The magnitude of our fair value adjustments will be largely a function of the varying degrees of
operating leverage, financial leverage, and raw material self-sufficiency associated with each steel and
aluminum producer under our coverage. This is consistent with the share price movements witnessed
after the Department of Commerce's steel and aluminum reports were published, as U.S. Steel and AK
Steel share prices increased more substantially (15% and 14%, respectively) than the other affected
names we cover (3% to 6% each, with Alcoa down slightly due to less punitive recommendations for
aluminum).
How U.S. Tariffs Will Impact Steelmakers and Steel Users | 7 March 2018 | See Important Disclosures at the end of this report.
Page 6 of 23
Minimal Impact on Our Asian Steel Coverage Following U.S. Steel Import Tariffs; Fair Value
Estimates Unchanged | March 1, 2018
Ken Foong
After meeting with steel and aluminum executives at the White House on March 1, President Donald
Trump announced that he'll be enacting a 25% steel tariff next week. It is unclear, however, if this
approach will be applied in a blanket fashion to all countries or only to a targeted list of countries. In its
Feb. 16 Section 232 report, the blanket tariffs proposed by the U.S. Department of Commerce were 24%
for all steel imports, which is less severe than the figures indicated by Trump on March 1. However, the
agency also recommended 53% targeted tariffs for steel. Therefore, the actions proposed by Trump
could be viewed as more punitive or significantly less punitive than the recommended sanctions,
depending on their scope. We have yet to see how other countries will react to this steel tariff and if
they will announce any countermeasures.
We expect minimal impact on our Asian steel coverage (which includes Baosteel, Angang Steel, Posco,
Nippon Steel & Sumitomo Metal, and China Steel), as the percentage of sales of these companies going
into the United States is less than 10% of their total sales and steel prices in Asia currently remain high
as China continues to rationalize its steel capacity. Although there could be an increase in competition in
the Asian steel market due to a reduction of steel being exported to the U.S. as a result of this steel
tariff, we think this only affects around 10 million tons of steel production, based on the amount of steel
that is being exported into the U.S. from Asia. This could easily be soaked up by demand for steel in
Asia, which amounts to around 1 billion tons a year. We retain our fair value estimates and moat ratings
for our Asian steel coverage.
For more information on the steel tariff, please see our March 1 report “Trump to Impose Steel and
Aluminium Import Tariffs Next Week,” our Feb. 19 report “Raising U.S. Steelmaker Fair Value Estimates
With Import Protection on the Horizon, but Group Remains Overvalued,” and our Feb. 18 report
“Department of Commerce Recommends Highly Punitive Countermeasures For Steel and Aluminium
Imports.”
Our long-term bearish view for the steel sector is intact. Given the increase in availability of steel scrap
in China, we still believe that new electric arc furnaces could be built in the future to replace some of
the lost capacity that was shut down in the past two years, resulting in ongoing overcapacity issues in
China.

How U.S. Tariffs Will Impact Steelmakers and Steel Users | 7 March 2018 | See Important Disclosures at the end of this report.
Page 7 of 23
Raising our BlueScope Fair Value Estimate to AUD 7.70 with U.S. Tariffs, but Shares Remain
Overvalued | March 5, 2018
Mathew Hodge, CFA
We raise our fair value estimate for no-moat BlueScope Steel by 17% to AUD 7.70 per share, from AUD
6.60 previously. Approximately 60% of the uplift reflects the benefit of likely U.S. steel tariffs on the
company’s North Star steel mill. The remainder is due to the stronger near-term outlook for profitability
and a slower forecast decline in group EBIT margins from an expected peak of 10.3% in fiscal 2017 to
our midcycle forecast of 5.7% by fiscal 2022. Global steel prices and margins are benefiting from
capacity closures in China, which help to offset the impact of expected weaker Chinese demand.
BlueScope’s second-half fiscal 2018 guidance is for adjusted EBIT to rise by 25% from first-half levels.
Despite the uplift, we maintain the current level of earnings is unsustainable, and BlueScope is
overvalued. Current margins are elevated and near a peak. Domestic margins are benefiting from
cyclically high demand in Australia, both residential and non-residential construction. Global margins
benefit from robust demand and steel supply disruption. Historical EBIT margins for the five and 10 years
ended fiscal 2017 averaged 3.7% and 2.8%, respectively. By comparison, our five-year forecast average
EBIT margin is 7.7%, with a 5.7% midcycle forecast by 2022.
Forecast margin compression is the key reason for our overvalued call. The market is pricing BlueScope
as if it has a strong moat, aggressive given we expect steel making and processing to remain
competitive and cyclical. To arrive at the market price, we need to assume high steel prices are
sustained and EBIT margins remain at elevated fiscal 2017 levels of 10.3%. Returns on invested capital
would average 15.5% for our five-year forecast period. We would also need to assume the capital
allocation mistakes of the past never repeat. In the last decade, aggregate write-offs and impairments
have totaled AUD 3 billion, equivalent to about AUD 5.50 per share, or half of the current invested
capital base.
We note President Trump's intention to enact a 25% steel tariff in the U.S., but it is unclear if it will be
applied in a blanket fashion to all countries or only to a targeted list of countries. The distinction matters
as we'd view a blanket approach as far more severe and, in turn, far more beneficial to BlueScope’s U.S.
steel business. Our base-case expectations for U.S. steel prices and margins continue to assume final
sanctions will be targeted. If Trump instead pursues a more widespread approach, we'd probably
increase our price assumptions and fair value estimate.
There is still significant uncertainty as to what will be enacted with reported disagreement among
Trump's advisors as to how severe the tariffs should be. Trade hawks, including Commerce Secretary
Wilbur Ross, U.S. Trade Representative Robert Lighthizer, and trade advisor Peter Navarro, have pushed
for steep tariffs and quotas, while others, including Chief Economic Advisor Gary Cohn support a less
heavy-handed approach. (Gary Cohn resigned over this issue on March 6.) Steeper tariffs increase the
risk of retaliation from trading partners as well as unintended negative effects on the profits of U.S.
industries that are heavy steel consumers.
How U.S. Tariffs Will Impact Steelmakers and Steel Users | 7 March 2018 | See Important Disclosures at the end of this report.
Page 8 of 23
Our updated fair value estimate reflects our expectation for targeted tariffs rather than a blanket tariff or
quota. Given Trump's repeated promises that he would protect the U.S. steel industry, we fully expect
him to follow through on one of the aggressive recommendations provided. Assuming the targeted tariff
program is enacted, we now expect U.S. steel prices to sustain a wider spread above world export
prices. Our midcycle U.S. hot-rolled coil price forecast rises to $460 per short ton from $420, while our
midcycle U.S. rebar price forecast rises to $500 per short ton from $430. Both forecasts are above the
marginal cost of production.
We maintain a bearish outlook for global steel prices due to our below-consensus outlook for Chinese
fixed-asset investment and our expectation that structural overcapacity will persist on a global scale.
However, the proposed protection for the U.S. steel industry will help insulate it from a global downdraft
over the medium term and likely drive heady profits even higher in the near term.
BlueScope’s underlying first-half fiscal net profit of AUD 321 million was 7% below the prior half but in
line with upwardly revised guidance and our expectations. The key takeaway is the strong guidance for
the second half with global steel prices benefiting from strong demand and supply constrained by
capacity closures in China. BlueScope expects underlying net profit to rise by 25% versus the first half
and we raise our fiscal 2018 earnings forecast to AUD 1.19 per share from AUD 1.06 previously.
The balance sheet is very strong with net debt halving to just AUD 260 million in the past 12 months.
With the cycle positive, BlueScope is well placed to increase returns to shareholders. The AUD 0.06 per
share interim dividend was up 50% on a year ago but the payout was a modest 8% of unadjusted
earnings, reflecting the low franking balance. BlueScope prefers share buy backs to dividends while the
franking balance is low and as tax losses deplete. We understand buybacks are more tax effective but
there is a risk of value destruction given the shares are being bought back at high prices and while
global steel maker margins are cyclically elevated. We have factored in a relatively modest forecast
dividend payout ratio of about 20% of free cash flow for our five-year forecast period and assume a
further 30% of free cash flow is directed to buybacks.
How U.S. Tariffs Will Impact Steelmakers and Steel Users | 7 March 2018 | See Important Disclosures at the end of this report.
Page 9 of 23
Impact on Steel and Aluminum Users
Possible Trade War Could Put 20%–25% of Boeing Deliveries at Risk | March 2, 2018
Chris Higgins
Despite the buzz around the aluminum and steel tariffs promised by U.S. President Donald Trump this
week, aerospace investors shouldn’t panic over cost increases. Aluminum, which would garner a 10%
tariff under Trump's plan, represents only 15%–20% of an aircraft's cost on older planes and less than
10% on newer aircraft. Also, average aluminum prices rose 23% last year, and the aerospace industry
managed to absorb the increase. Investors should be concerned about a trade war, though, because
Boeing delivers around 70% of its aircraft to non-U.S. customers. Retaliation from China, which
accounted for more than 25% of 2017 total deliveries and represents an estimated 20% of Boeing's
backlog in unit terms, remains the most significant threat.
We expect no material impact on Boeing's costs from tariffs. First, steel exposure is minimal: steel (25%
tariff under Trump's plan) accounts for about 15% of weight on older aircraft and around 10% on newer
models. According to Alix Partners, a consulting firm, aluminum accounts for 79% of the weight of the
737. However, aerostructures represent roughly 30% of aircraft costs, meaning that if 100% of the 10%
tariff hits Boeing, we estimate the airframer will experience only a 2.5% cost increase. We’d note that
customer contracts contain escalation clauses, which means Boeing might be able to pass through the
increase. Newer aircraft, the 787 for example, use about 20% aluminum as a percentage of weight,
making the impact more negligible.
We’re more concerned about Spirit Aerosystems because, as the largest independent aerostructures
manufacturer, aluminum is a significant production input. But we’re not planning to change our fair
value because we believe the tariff can be absorbed and that Spirit is contractually protected. Spirit
procures nearly all its raw materials from Boeing and Airbus, leveraging their scale to secure better
pricing. We understand that these contracts include abnormal-price-increase clauses.
The potential for a broader trade war with China remains the greatest concern for us. Although Boeing’s
official backlog figures peg Chinese orders at 304 aircraft, we think over 70% of the 1,090 of unidentified
orders on Boeing’s books will be delivered to Chinese customers (airlines and lessors). Taking the
unidentified backlog that we attribute to China and adding the 304 disclosed orders leads us to conclude
that about 20% of Boeing’s backlog sits with the Middle Kingdom.
How U.S. Tariffs Will Impact Steelmakers and Steel Users | 7 March 2018 | See Important Disclosures at the end of this report.
Page 10 of 23
China could potentially shift aircraft purchases from the U.S. manufacturer toward Airbus. While the
existing backlog most likely isn’t at risk, new orders most certainly would be. Chinese airlines took 202
Boeing aircraft last year (26% of total deliveries) and we forecast China to remain between 18% and 22%
of total aircraft deliveries for Boeing and Airbus over the next decade. If we assume deliveries to China
are 20% of total deliveries in 2018 and make the simplifying assumption that the aircraft model mix for
Chinese customers is similar to the overall commercial aircraft unit, we conclude that the Chinese
market alone will drive about $1.3 billion of operating profits for Boeing in 2018 (11% of our consolidated
operating profit forecast). And we'd note that this figure might be higher because the Chinese backlog is
likely tilted toward more-profitable 737 aircraft.
Worst-Case Scenario, Steel and Aluminum Tariffs Have Limited Impact on Light Vehicle Demand |
March 5, 2018
Richard Hilgert, David Whiston, CPA, CFA, CFE
We are not changing our auto fair value estimates after President Trump announced his intent to levy
25% and 10% tariffs on steel and aluminum imports, respectively, into the U.S. Automakers use almost
entirely U.S. steel and aluminum for their U.S. plants and their suppliers also source in the U.S., based
on our talks with GM and Ford; so if the tariffs last a long time, we’d be more concerned about possible
negative second order impacts of the tariff. Ford said on March 1 it sources 95% of its steel and 98% of
its aluminum from the U.S., while GM said about 90% of steel and the majority of its aluminum is from
the U.S. GM’s product head Mark Reuss said on March 1 that GM would not necessarily pass higher
costs through to the consumer and would instead focus on trying to offset higher input costs.
Still, we think the tariffs give U.S. steel and aluminum producers leeway to raise prices, which, if the
tariffs last a long time, eventually flow to the automakers. Bloomberg quoted Toyota saying it uses over
90% of its U.S. steel needs from the U.S. but also that the tariff will adversely impact auto companies via
higher costs and ultimately higher prices to consumers. We think that is likely, and we had already been
modeling 2018 U.S. industry light vehicle sales to decline over 3% year over year, which is worse than
the 0.7% decline the industry has seen through February.
An increase in input costs might have a temporary impact on margin but, if the impact were large
enough to cause a downturn in auto demand, given the industry’s capital intensity, the impact could be
much more devastating. We estimate that, in a worst-case scenario, the proposed steel and aluminum
tariffs would result in approximately a 1% increase in the average price of a light vehicle in the U.S. In
contrast, the average transaction price of a U.S. light vehicle has grown at roughly an annualized rate of
2%. In our opinion, the impact of tariffs on U.S. light vehicle demand will be minimal.
Other second order effects are negative in our view such as a possible trade war with the rest of the
world ultimately leading to U.S. GDP contraction, which in turn would lead to higher unemployment and
slowing auto sales. What were already contentious NAFTA renegotiations may have just become tenser
How U.S. Tariffs Will Impact Steelmakers and Steel Users | 7 March 2018 | See Important Disclosures at the end of this report.
Page 11 of 23
as well. Trump said in a March 5 tweet that the tariffs will only end if a new and fair NAFTA deal is
reached. We assume he means fair for the U.S.
Our ongoing discussion with GM and Ford indicate neither company hedges steel but they have long-
term contracts. There is no forward market for hedging steel per Ford. GM uses collars lasting up to
about three years while Ford uses multiple contracts in staggered term dates to try to provide some
smoothing. Ford does hedge metals other than steel up to about 30 months out, but at a January
conference, CFO Bob Shanks said Ford does not hedge as much as it used to because currency changes
can mitigate a metal price change, such as copper and the Australian dollar. Lately however, this natural
hedge has not worked out per Shanks. For autos we see the key risk as the duration of the tariffs,
assuming they are implemented. Trump’s March 2 tweet that “trade wars are good” for a country that
loses billions of dollars with nearly every country it does business with is an ominous sign.
On its face, a 25% price hike, or even a 10% price hike in the cost of raw materials for any no-moat
manufacturer (lacking pricing power) sounds profit-wrecking. For the automotive industry, our initial
concern after learning of the proposed 25% tariff on steel and 10% tariff on aluminum, wasn’t the
impact on margin so much as it was the impact on the consumer, the ultimate payer of the tariff. In the
auto sector, raw material cost changes can create short-term changes in profitability up and down the
supply chain but eventually, the cost is passed along to the consumer, partially offset by usage
efficiency gains (using less material but retaining structural and functional integrity).
We calculate our 1% estimated impact on the average price of a U.S. light vehicle by using the average
content per U.S. light vehicle of steel and aluminum in pounds, commodity contract pricing of steel and
aluminum in U.S. dollars per metric ton, and the average transaction price of a light vehicle. According
to Ward’s Automotive citing research from the American Chemistry Council, the average weight of
regular steel, high- and medium-strength steel, stainless steel, and other steel used to build a light
vehicle in North America totaled 2,138 pounds in 2015. Average aluminum content per light vehicle
amounted to 395 pounds.
Average content of a North American-built light vehicle includes several different grades and types of
steel. Ward’s segregated its information by what it called regular steel, high- and medium-strength
steel, stainless steel, and other steel. Regular steel used on average was 1,330 pounds, while high- and
medium-strength steel was 701 pounds, stainless was 75 pounds and the weight of other steels was 32
pounds. In total, steel accounts for approximately 54% of the weight of an average North American-built
light vehicle. The average weight of aluminum was 395 pounds per light vehicle. Total average weight of
a North American built vehicle in 2015 was 3,991 pounds. Keep in mind that in comparison to other
regions, the percentage of U.S. light vehicles contains a much higher mix of heavier vehicles including
pickup trucks, sport utility vehicles, and crossovers.
Assigning an average price of steel was more problematic because the auto industry uses a wide variety
of steel that can include galvanizing, customized alloy, as well as ultra-high-strength steel. According to
Steel Benchmarker, as of Feb. 26, the U.S. dollar price per metric ton of hot-rolled band steel was $838

How U.S. Tariffs Will Impact Steelmakers and Steel Users | 7 March 2018 | See Important Disclosures at the end of this report.
Page 12 of 23
and $966 for cold-rolled coil steel. We acquired price information on stainless steel from MEPS
International which pegged hot-rolled coil stainless steel at $3,248 per metric ton. Aluminum pricing was
less problematic. Index Mundi, which uses London Metal Exchange data, put the price of a metric ton of
unalloyed high-grade aluminum ingot at $2,210 per metric ton. In our calculations, we assumed $950 per
metric ton for steel, $3,248 per metric ton for stainless, and $2,210 for aluminum.
Having said this, we view these prices as high relative to the actual amount ultimately paid by
automakers and suppliers. We also assume in our calculations that the tariffs affect pricing from steel
producers equally, increasing the cost of all steel and aluminum consumed by the auto industry by 25%
and 10%, respectively. Automakers typically negotiate annual steel supply contracts in a competitive
environment. Short-term commodity contract prices are too volatile and steel supplier capacity might get
scarce in times of peak demand. By locking in contracts for large volumes of steel, manufacturers get
economies-of-scale and can more easily budget around a stable price, albeit for only one year. Steel
contracts also lock-in capacity availability, ensuring a steady supply of material that meets automobile
production needs.
Many auto parts suppliers take advantage of their customers’ economies-of-scale and participate in
automakers’ steel purchasing pools. Large, narrow-moat Tier I parts vendors will be able to work with
their supply chains and their customers on softening the blow of steel and aluminum tariffs. Contractual
supply agreements have clauses that include adjustments for pricing and delivery terms. Large Tier I
suppliers are also international and have substantial overseas operations, limiting exposure in the U.S.
The Tier I suppliers generally source more individual components rather than raw steel or aluminum,
further limiting exposure. Our concern for the supply chain lies with smaller, specialty part vendors with
high reliance on the domestic market for revenue, that may have gone to a foreign source for a unique
chemistry or alloy. These Tier II and III suppliers may need to rely on Force Majeure clauses and in some
rare instances hardship clauses, if included in their supply agreements.
Assuming the prices cited above and using the weight data from Ward’s, we calculated the cost in U.S.
dollars of the steel and aluminum used in the average light vehicle built in North America at $1,395.
Regular steel was $889, stainless at $111, and aluminum was $396 on average per light vehicle.
Applying a 25% price increase to the steel prices and a 10% price increase to the price of aluminum, we
arrived at $1,685—steel at $1,111, stainless at $138, and aluminum at $436. The difference between the
average cost using current price information versus and the tariff-adjusted pricing, averages
approximately $290 per light vehicle.
According to Kelley Blue Book, or KBB, the average transaction price, or ATP, of new light vehicles in
February was $35,444. Our estimated average tariff-related cost increase ($290 per light vehicle) relative
to the average transaction price represents only 0.8%. The earliest KBB data we could find was from the
month of April 2012 at an ATP of $31,280. From April 2012 to February, the average annual growth rate
in ATP was 2.1%, 130 basis points higher than a 0.8% increase from our estimated tariff-adjusted pricing
on steel and aluminum.
How U.S. Tariffs Will Impact Steelmakers and Steel Users | 7 March 2018 | See Important Disclosures at the end of this report.
Page 13 of 23
In our opinion, even though the auto sector may absorb some of the impact from steel and aluminum
tariffs, we think that consumers will be able handle a relatively minor price increase. Given the minimal
impact to the overall price of a new light vehicle, in conjunction with economic conditions and a labor
market that are both conducive to favorable demand, we expect limited impact from steel and aluminum
tariffs on 2018 U.S. unit sales. We think it is more likely than not that our assumptions in calculating a
0.8% price impact will be overly harsh. Manufacturing efficiencies up and down the supply chain can
partially offset some of the cost. Not all steel or aluminum producers will raise prices by the full 25% and
10%, respectively. Narrow-moat Tier I auto suppliers are in the best position for renegotiating contracts
while no-moat automakers can ill-afford to absorb 100% of the incremental cost, and will attempt to
pass along most of an increase to consumers. The main area of concern for us is smaller Tier II and Tier
III auto parts suppliers. If some falter on higher raw material cost, Tier I suppliers or even possibly
automakers, may have to financially support their suppliers' operations to maintain production
continuity.
U.S. Steel Tariff Increases Would Only Reduce Fair Value Estimates on European Capital Good
Suppliers by 5% | March 5, 2018
Denise Molina, CFA
We see less than a 5% potential impact to our fair value estimates for European industrial equipment
suppliers in our coverage from the steel tariffs proposed by the Trump administration. Of the companies
in our coverage, several manufacture components and equipment with a high metal content, including
Kone, Schindler, SKF, Atlas Copco, Assa Abloy, Alfa Laval, and GEA group. Their range of revenue
exposure to North America is 20%-40%, with most of that coming from the U.S. However, only 40%-70%
of the revenue is likely from equipment and the rest from service. While the details of the tariff increases
are unclear and the companies themselves are still doing their internal analysis, we have walked
through some of our own scenario analyses to determine the potential impact on our fair value
estimates. Using each company’s North America revenue exposure as a proxy for the COGS exposure,
we modeled a 25% tariff increase on 25% of the North America COGs exposure, which represents an
assumed portion of COGs from imported steel. We view this as an aggressive figure given that steel is
not the sole input to most of the equipment. Assuming the tariffs last for three years, one year longer
than the tariffs imposed by President Bush in 2002, we see a 5% or less negative impact to our fair value
estimates. However, given that the tariffs and details are not yet final, we are not making any changes
to our fair value estimates. We would also expect the companies to offset some of the tariff increases
with price increase, as they have done with previous increases in raw material costs.
Most of the European companies in our coverage have already faced increases of 30%–40% in steel
prices in the last year some without a full negative margin absorption. Using their size and brand
advantage with suppliers and customers they have been able to offset some, although not all, of the
higher costs. Equipment suppliers like Atlas Copco, and the elevator companies like Schindler and Kone,
buy components from multiple third parties, that are often willing to absorb some of the negative margin
impact from raw material increases before it reaches the likes of Atlas Copco. Put another way, we've

How U.S. Tariffs Will Impact Steelmakers and Steel Users | 7 March 2018 | See Important Disclosures at the end of this report.
Page 14 of 23
observed the further downstream the company is in the supply chain, the less direct exposure to the raw
material fluctuations and therefore the less impact on its margins. The other lever is price and most
companies in our coverage, except for China subsidiaries, have been successful at passing along price
increases in the last year. This has perhaps occurred more easily than three years ago given we are in
the middle of the cycle with a strong demand tailwind for most capital goods.
Tax Reform and a Solid Economy Support the Heavy Equipment Sector Despite U.S. Steel Tariffs |
March 5, 2018
Nick Mokha
It appears that heavy equipment investors are in for a first-quarter 2018 earnings season even more
stellar than we previously expected. In our view, first-quarter performance for companies within the
heavy-equipment industry was already likely to be strong, particularly given recent U.S. tax reform,
which we believe incentivized both customers and manufacturers to move orders from the fourth quarter
of 2017 to the first quarter of 2018 to take advantage of immediate depreciation allowance and lower
tax rates. But with the latest news on tariffs, we believe heavy-equipment companies will witness even
stronger demand in the first quarter as customers who were contemplating orders become even more
likely to pull the trigger.
While we are still assessing potential tariff-related effects, we note that both wide-moat Caterpillar and
Deere have adequate inventory on hand to last for a few months before tariffs have an impact.
Thereafter, we estimate that these companies will be exposed to rising steel prices, which account for
around 10% of their total operating expenses (raw materials account for 50%–75% of cost of goods
sold). We view it as unlikely that many companies will meaningfully pass along their increased raw
material costs to customers, as foreign competitors stand ready to take advantage. Moreover,
companies in our coverage list operate without hedges and are thus exposed to steel price fluctuations.
Steel tariffs enacted by the George W. Bush administration lasted for 18 months. If we assume 24
months of tariff-related impacts and an inability for manufacturers to pass the increased steel prices
along to customers, then we would expect to see operating margins decline over 200 basis points,
resulting in fair value estimates declining less than 5%. Thus, assuming no other retaliatory measures
taken by other countries in response to products manufactured by our coverage list, we currently don't
expect material impacts to our fair value estimates.
How U.S. Tariffs Will Impact Steelmakers and Steel Users | 7 March 2018 | See Important Disclosures at the end of this report.
Page 15 of 23
We're Maintaining Our Fair Value Estimates for HVAC Manufacturers After Announced Tariffs |
March 4, 2018
Brian Bernard, CFA, CPA
We're not changing our fair value estimates for Ingersoll Rand, Johnson Controls, or Lennox
International after the Trump Administration announced a 25% steel tariff and a 10% aluminum tariff.
While steel and aluminum, along with copper, are key raw materials used to manufacture heating,
ventilation, and air conditioning products, raw material costs are a relatively small portion of these firms'
cost of goods sold. Steel and aluminum represent less than 2% of Johnson Controls' cost of goods sold,
and we estimate these two metals account for about 10% of Lennox's cost of goods sold. We believe
steel and aluminum as a percentage of Ingersoll Rand's cost of goods sold likely fall somewhere in this
range.
We think all three firms can source steel and aluminum from producers based in the United States.
Ingersoll Rand and Johnson Controls already almost exclusively use domestic steel for products sold in
the U.S., and Lennox has commented that it enjoys flexible commodity sourcing and could optimize its
supplier base to defend margins.
Morningstar believes that these tariffs will result in a wider price spread between U.S. metals and world
export prices. However, Ingersoll Rand, Johnson Controls, and Lennox have a good track record of
offsetting commodity inflation with price increases. Since steel and aluminum account for a relatively
small portion of cost of goods sold for these firms, we calculate that relatively modest (that is, low-
single-digit) price increases are needed to offset a hypothetical 25% and 10% increase in steel and
aluminum prices, respectively.
However, even if these firms don't realize enough pricing to offset commodity inflation, Ingersoll Rand's
climate segment and Lennox should still post strong margins that are well above historical averages. We
expect Johnson Controls' building technologies and solutions segment to continue to expand margins as
merger-related synergies more than offset a potentially unfavorable price cost spread.
We continue to believe that the market is unduly skeptical of Johnson Controls' potential after its
merger with Tyco and spin-off of Adient in late 2016. In our view, Johnson Controls' current stock price
is certainly not pricing in the $1.2 billion synergy target management expects to achieve by 2020. While
we're maintaining our conservative assumption that Johnson Controls only achieves 70% of this synergy
target, we think our cost take-out target is more than enough to propel operating margins higher over
the next three years even if the company is faced with an unfavorable price-cost spread within its
building technologies and solutions segment. Assuming HVAC manufacturers do face margin pressure
because of these tariffs, we think it would be an opportunity for Johnson Controls to showcase its post-
Tyco merger operating efficiency gains as the firm's margins continue to expand while its peers struggle
to maintain peak or near-peak margins.

How U.S. Tariffs Will Impact Steelmakers and Steel Users | 7 March 2018 | See Important Disclosures at the end of this report.
Page 16 of 23
Rigid Can Manufacturers Will Feel Little Impact From Proposed Tariffs; Fair Value Estimates Intact
| March 6, 2018
Charles Gross
Ball, Crown, and Silgan are poised to experience little long-term impact should the Trump administration
go through with the imposition of tariffs on imported steel and aluminum. All three companies benefit
from favorable contract structures that pass through changes in metal costs. These limit the period
during which earnings can get squeezed because of cost increases. Ball and Crown also benefit from
diverse global footprints, reducing the potential impact of U.S. tariffs. We expect only one or two
quarters of earnings to be negatively impacted. Accordingly, our fair value estimates and narrow-moat
ratings for each company are unchanged.
In the past, metal price volatility could be a headwind or tailwind for metal can manufacturers. Contract
prices were fixed, so as metal prices rose, manufacturers such as Ball or Silgan would experience margin
compression. Today, contracts for Silgan, Ball, and Crown are structured to pass through costs--
generally within a quarter or two--to the purchaser of finished cans. As a result, near-term results can be
impacted by changing metals prices, but long-term profitability remains stable.
While Silgan derives practically all its business from North America, Ball and Crown have more
geographic diversity. Each of these companies derives around 50% of earnings from South America,
Europe, and Southeast Asia, which will reduce near-term effects of rapidly rising input costs in the
United States should tariffs be imposed. K
How U.S. Tariffs Will Impact Steelmakers and Steel Users | 7 March 2018 | See Important Disclosures at the end of this report.
Page 17 of 23
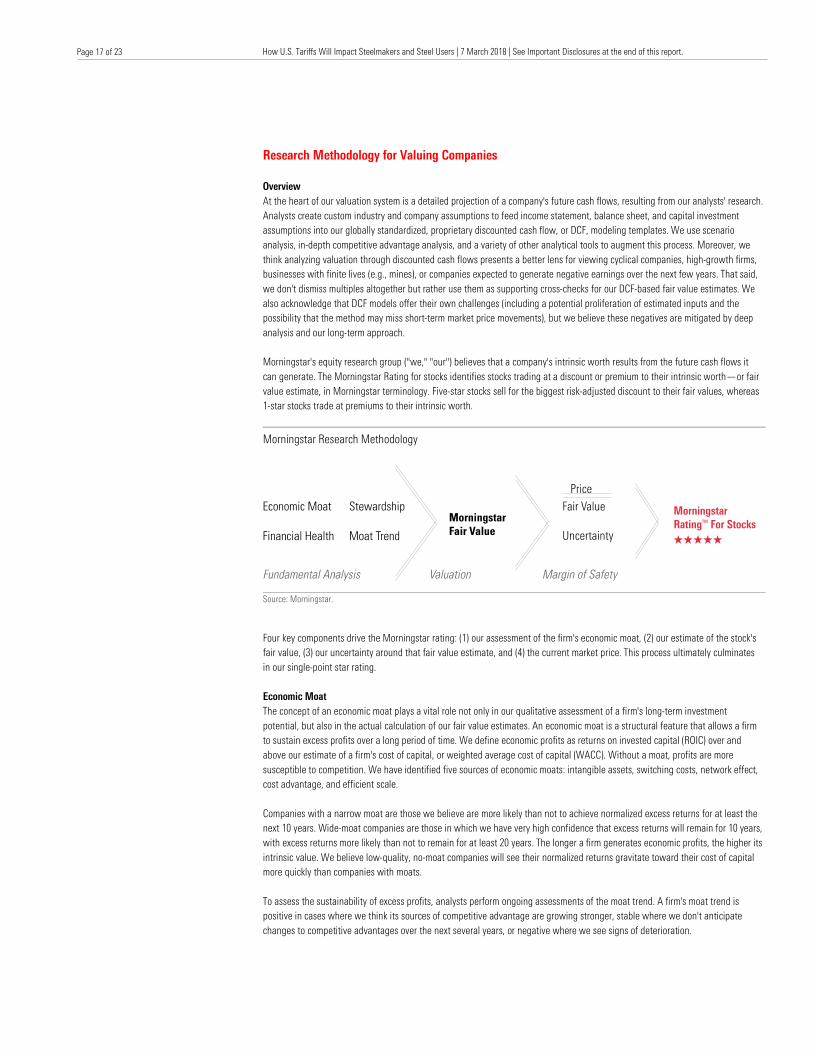
Research Methodology for Valuing Companies Overview At the heart of our valuation system is a detailed projection of a company's future cash flows, resulting from our analysts' research. Analysts create custom industry and company assumptions to feed income statement, balance sheet, and capital investment assumptions into our globally standardized, proprietary discounted cash flow, or DCF, modeling templates. We use scenario analysis, in-depth competitive advantage analysis, and a variety of other analytical tools to augment this process. Moreover, we think analyzing valuation through discounted cash flows presents a better lens for viewing cyclical companies, high-growth firms, businesses with finite lives (e.g., mines), or companies expected to generate negative earnings over the next few years. That said, we don't dismiss multiples altogether but rather use them as supporting cross-checks for our DCF-based fair value estimates. We also acknowledge that DCF models offer their own challenges (including a potential proliferation of estimated inputs and the possibility that the method may miss short-term market price movements), but we believe these negatives are mitigated by deep analysis and our long-term approach. Morningstar's equity research group ("we," "our") believes that a company's intrinsic worth results from the future cash flows it can generate. The Morningstar Rating for stocks identifies stocks trading at a discount or premium to their intrinsic worth—or fair value estimate, in Morningstar terminology. Five-star stocks sell for the biggest risk-adjusted discount to their fair values, whereas 1-star stocks trade at premiums to their intrinsic worth.
Morningstar Research Methodology
Source: Morningstar.
Four key components drive the Morningstar rating: (1) our assessment of the firm's economic moat, (2) our estimate of the stock's fair value, (3) our uncertainty around that fair value estimate, and (4) the current market price. This process ultimately culminates in our single-point star rating. Economic Moat The concept of an economic moat plays a vital role not only in our qualitative assessment of a firm's long-term investment potential, but also in the actual calculation of our fair value estimates. An economic moat is a structural feature that allows a firm to sustain excess profits over a long period of time. We define economic profits as returns on invested capital (ROIC) over and above our estimate of a firm's cost of capital, or weighted average cost of capital (WACC). Without a moat, profits are more susceptible to competition. We have identified five sources of economic moats: intangible assets, switching costs, network effect, cost advantage, and efficient scale. Companies with a narrow moat are those we believe are more likely than not to achieve normalized excess returns for at least the next 10 years. Wide-moat companies are those in which we have very high confidence that excess returns will remain for 10 years, with excess returns more likely than not to remain for at least 20 years. The longer a firm generates economic profits, the higher its intrinsic value. We believe low-quality, no-moat companies will see their normalized returns gravitate toward their cost of capital more quickly than companies with moats. To assess the sustainability of excess profits, analysts perform ongoing assessments of the moat trend. A firm's moat trend is positive in cases where we think its sources of competitive advantage are growing stronger, stable where we don't anticipate changes to competitive advantages over the next several years, or negative where we see signs of deterioration.

How U.S. Tariffs Will Impact Steelmakers and Steel Users | 7 March 2018 | See Important Disclosures at the end of this report.
Page 18 of 23
Estimated Fair Value Combining our analysts' financial forecasts with the firm's economic moat helps us assess how long returns on invested capital are likely to exceed the firm's cost of capital. Returns of firms with a wide economic moat rating are assumed to fade to the perpetuity period over a longer period of time than the returns of narrow-moat firms, and both will fade slower than no-moat firms, increasing our estimate of their intrinsic value. Our model is divided into three distinct stages: Stage I: Explicit Forecast In this stage, which can last 5 to 10 years, analysts make full financial statement forecasts, including items such as revenue, profit margins, tax rates, changes in working capital accounts, and capital spending. Based on these projections, we calculate earnings before interest, after taxes (EBI) and net new investment (NNI) to derive our annual free cash flow forecast. Stage II: Fade The second stage of our model is the period it will take the company's return on new invested capital—the return on capital of the next dollar invested (RONIC)—to decline (or rise) to its cost of capital. During the Stage II period, we use a formula to approximate cash flows in lieu of explicitly modeling the income statement, balance sheet, and cash flow statement as we do in Stage I. The length of the second stage depends on the strength of the company's economic moat. We forecast this period to last anywhere from one year (for companies with no economic moat) to 10–15 years or more (for wide-moat companies). During this period, cash flows are forecast using four assumptions: an average growth rate for EBI over the period, a normalized investment rate, average return on new invested capital (RONIC), and the number of years until perpetuity, when excess returns cease. The investment rate and return on new invested capital decline until a perpetuity value is calculated. In the case of firms that do not earn their cost of capital, we assume marginal ROICs rise to the firm's cost of capital (usually attributable to less reinvestment), and we may truncate the second stage. Stage III: Perpetuity Once a company's marginal ROIC hits its cost of capital, we calculate a continuing value, using a standard perpetuity formula. At perpetuity, we assume that any growth or decline or investment in the business neither creates nor destroys value and that any new investment provides a return in line with estimated WACC. Because a dollar earned today is worth more than a dollar earned tomorrow, we discount our projections of cash flows in stages I, II, and III to arrive at a total present value of expected future cash flows. Because we are modeling free cash flow to the firm—representing cash available to provide a return to all capital providers—we discount future cash flows using the WACC, which is a weighted average of the costs of equity, debt, and preferred stock (and any other funding sources), using expected future proportionate long-term, market value weights. Uncertainty Around That Fair Value Estimate Morningstar's uncertainty rating captures a range of likely potential intrinsic values for a company and uses it to assign the margin of safety required before investing, which in turn explicitly drives our stock star rating system. The uncertainty rating represents the analysts' ability to bound the estimated value of the shares in a company around the fair value estimate, based on the characteristics of the business underlying the stock, including operating and financial leverage, sales sensitivity to the overall economy, product concentration, pricing power, and other company-specific factors. Analysts consider at least two scenarios in addition to their base case: a bull case and a bear case. Assumptions are chosen such that the analyst believes there is a 25% probability that the company will perform better than the bull case and a 25% probability that the company will perform worse than the bear case. The distance between the bull and bear cases is an important indicator of the uncertainty underlying the fair value estimate. Our recommended margin of safety widens as our uncertainty regarding the estimated value of the equity increases. The more uncertain we are about the estimated value of the equity, the greater the discount we require relative to our estimate of the value of the firm before we would recommend the purchase of the shares. In addition, the uncertainty rating provides guidance in portfolio construction based on risk tolerance.

How U.S. Tariffs Will Impact Steelmakers and Steel Users | 7 March 2018 | See Important Disclosures at the end of this report.
Page 19 of 23
Our uncertainty ratings for our qualitative analysis are low, medium, high, very high, and extreme. × Low: Margin of safety for 5-star rating is a 20% discount and for 1-star rating is a 25% premium. × Medium: Margin of safety for 5-star rating is a 30% discount and for 1-star rating is a 35% premium. × High: Margin of safety for 5-star rating is a 40% discount and for 1-star rating is a 55% premium. × Very high: Margin of safety for 5-star rating is a 50% discount and for 1-star rating is a 75% premium. × Extreme: Margin of safety for 5-star rating is a 75% discount and for 1-star rating is a 300% premium.
Morningstar Equity Research Star Rating Methodology
Market Price The market prices used in this analysis and noted in the report come from the exchange on which the stock is listed, which we believe is a reliable source. For more details about our methodology, please go to http://global.morningstar.com/equitydisclosures. Morningstar Star Rating for Stocks Once we determine the fair value estimate of a stock, we compare it with the stock's current market price on a daily basis, and the star rating is automatically recalculated at the market close on every day the market on which the stock is listed is open. Our analysts keep close tabs on the companies they follow and, based on thorough and ongoing analysis, raise or lower their fair value estimates as warranted. Please note, there is no predefined distribution of stars. That is, the percentage of stocks that earn 5 stars can fluctuate daily, so the star ratings, in the aggregate, can serve as a gauge of the broader market's valuation. When there are many 5-star stocks, the stock market as a whole is more undervalued, in our opinion, than when very few companies garner our highest rating. We expect that if our base-case assumptions are true, the market price will converge on our fair value estimate over time, generally within three years (although it is impossible to predict the exact time frame in which market prices may adjust).
How U.S. Tariffs Will Impact Steelmakers and Steel Users | 7 March 2018 | See Important Disclosures at the end of this report.
Page 20 of 23
Our star ratings are guideposts to a broad audience, and individuals must consider their own specific investment goals, risk tolerance, tax situation, time horizon, income needs, and complete investment portfolio, among other factors. The Morningstar Star Ratings for stocks are defined below: QQQQQ We believe appreciation beyond a fair risk-adjusted return is highly likely over a multiyear time frame. Scenario analysis developed by our analysts indicates that the current market price represents an excessively pessimistic outlook, limiting downside risk and maximizing upside potential. QQQQ We believe appreciation beyond a fair risk-adjusted return is likely. QQQ Indicates our belief that investors are likely to receive a fair risk-adjusted return (approximately cost of equity). QQ We believe investors are likely to receive a less than fair risk-adjusted return. Q Indicates a high probability of undesirable risk-adjusted returns from the current market price over a multiyear time frame, based on our analysis. Scenario analysis by our analysts indicates that the market is pricing in an excessively optimistic outlook, limiting upside potential and leaving the investor exposed to capital loss.
Risk Warning Please note that investments in securities are subject to market and other risks, and there is no assurance or guarantee that the intended investment objectives will be achieved. Past performance of a security may or may not be sustained in the future and is no indication of future performance. A security investment return and an investor's principal value will fluctuate so that, when redeemed, an investor's shares may be worth more or less than their original cost. A security's current investment performance may be lower or higher than the investment performance noted within the report. Morningstar's uncertainty rating serves as a useful data point with respect to sensitivity analysis of the assumptions used in our determining a fair value price.
General Disclosure Unless otherwise provided in a separate agreement, recipients accessing this report may only use it in the country in which the Morningstar distributor is based. Unless stated otherwise, the original distributor of the report is Morningstar Research Services LLC, a U.S.-domiciled financial institution. This report is for informational purposes only and has no regard to the specific investment objectives, financial situation or particular needs of any specific recipient. This publication is intended to provide information to assist institutional investors in making their own investment decisions, not to provide investment advice to any specific investor. Therefore, investments discussed and recommendations made herein may not be suitable for all investors: Recipients must exercise their own independent judgment as to the suitability of such investments and recommendations in the light of their own investment objectives, experience, taxation status, and financial position. The information, data, analyses, and opinions presented herein are not warranted to be accurate, correct, complete, or timely. Unless otherwise provided in a separate agreement, neither Morningstar, Inc. nor the Equity Research Group represents that the report contents meet all of the presentation and/or disclosure standards applicable in the jurisdiction the recipient is located. Except as otherwise required by law or provided for in a separate agreement, the analyst, Morningstar, Inc., and the Equity Research Group and their officers, directors, and employees shall not be responsible or liable for any trading decisions, damages, or other losses resulting from, or related to, the information, data, analyses, or opinions within the report. The Equity Research Group encourages recipients of this report to read all relevant issue documents (e.g., prospectus) pertaining to the security concerned, including without limitation, information relevant to its investment objectives, risks, and costs before making an investment decision and, when deemed necessary, to seek the advice of a legal, tax, and/or accounting professional. The Report and its contents are not directed to, or intended for distribution to or use by, any person or entity who is a citizen or resident of or located in any locality, state, country, or other jurisdiction where such distribution, publication, availability, or use would be contrary to law or regulation or which would subject Morningstar, Inc. or its affiliates to any registration or licensing requirements in such jurisdiction.
How U.S. Tariffs Will Impact Steelmakers and Steel Users | 7 March 2018 | See Important Disclosures at the end of this report.
Page 21 of 23
Where this report is made available in a language other than English and in the case of inconsistencies between the English and translated versions of the report, the English version will control and supersede any ambiguities associated with any part or section of a report that has been issued in a foreign language. Neither the analyst, Morningstar, Inc., nor the Equity Research Group guarantees the accuracy of the translations. This report may be distributed in certain localities, countries and/or jurisdictions ("Territories") by independent third parties or independent intermediaries and/or distributors ("Distributors"). Such Distributors are not acting as agents or representatives of the analyst, Morningstar, Inc., or the Equity Research Group. In Territories where a Distributor distributes our report, the Distributor is solely responsible for complying with all applicable regulations, laws, rules, circulars, codes, and guidelines established by local and/or regional regulatory bodies, including laws in connection with the distribution third-party research reports.
Conflicts of Interest
× No interests are held by the analyst with respect to the security subject of this investment research report.
× Morningstar, Inc. may hold a long position in the security subject of this investment research report that exceeds 0.5% of the total issued share capital of the security. To determine if such is the case, please click http://msi.morningstar.com and http://mdi.morningstar.com.
× Analysts' compensation is derived from Morningstar, Inc.'s overall earnings and consists of salary, bonus, and in some cases
restricted stock.
× Neither Morningstar, Inc. nor the Equity Research Group receives commissions for providing research nor do they charge companies to be rated.
× Neither Morningstar, Inc. nor the Equity Research Group is a market maker or a liquidity provider of the security noted within this report.
× Neither Morningstar, Inc. nor the Equity Research Group has been a lead manager or co-lead manager over the previous 12 months of any publicly disclosed offer of financial instruments of the issuer.
× Morningstar, Inc.'s investment management group does have arrangements with financial institutions to provide portfolio management/investment advice, some of which an analyst may issue investment research reports on. However, analysts do not have authority over Morningstar's investment management group's business arrangements nor allow employees from the investment management group to participate or influence the analysis or opinion prepared by them.
× Morningstar, Inc. is a publicly traded company (ticker symbol: MORN) and thus a financial institution the security of which is the subject of this report may own more than 5% of Morningstar, Inc.'s total outstanding shares. Please access Morningstar, Inc.'s proxy statement, "Security Ownership of Certain Beneficial Owners and Management" section http://investorrelations.morningstar.com/sec.cfm?doctype=Proxy&year=&x=12
× Morningstar, Inc. may provide the product issuer or its related entities with services or products for a fee and on an arms' length basis including software products and licenses, research and consulting services, data services, licenses to republish our ratings and research in their promotional material, event sponsorship, and website advertising.
Further information on Morningstar, Inc.'s conflict of interest policies is available from http://global.morningstar.com/equitydisclosures. Also, please note analysts are subject to the CFA Institute's Code of Ethics and Standards of Professional Conduct. For a list of securities that the Equity Research Group currently covers and provides written analysis on, please contact your local Morningstar office. In addition, for historical analysis of securities covered, including their fair value estimate, please contact your local office. For Recipients in Australia: This Report has been issued and distributed in Australia by Morningstar Australasia Pty Ltd (ABN: 95 090 665 544; ASFL: 240892). Morningstar Australasia Pty Ltd is the provider of the general advice ('the Service') and takes responsibility for the production of this report. The Service is provided through the research of investment products. To the extent

How U.S. Tariffs Will Impact Steelmakers and Steel Users | 7 March 2018 | See Important Disclosures at the end of this report.
Page 22 of 23
the Report contains general advice, it has been prepared without reference to an investor's objectives, financial situation, or needs. Investors should consider the advice in light of these matters and, if applicable, the relevant Product Disclosure Statement before making any decision to invest. Refer to our Financial Services Guide (FSG) for more information at http://www.morningstar.com.au/fsg.pdf. For Recipients in Hong Kong: The Report is distributed by Morningstar Investment Management Asia Limited, which is regulated by the Hong Kong Securities and Futures Commission to provide services to professional investors only. Neither Morningstar Investment Management Asia Limited nor its representatives are acting or will be deemed to be acting as an investment advisor to any recipients of this information unless expressly agreed to by Morningstar Investment Management Asia Limited. For enquiries regarding this research, please contact a Morningstar Investment Management Asia Limited Licensed Representative at http://global.morningstar.com/equitydisclosures. For Recipients in India: This Investment Research is issued by Morningstar Investment Adviser India Private Limited. Morningstar Investment Adviser India Private Limited is registered with the Securities and Exchange Board of India (Registration number INA000001357) and provides investment advice and research. Morningstar Investment Adviser India Private Limited has not been the subject of any disciplinary action by SEBI or any other legal/regulatory body. Morningstar Investment Adviser India Private Limited is a wholly owned subsidiary of Morningstar Investment Management LLC. In India, Morningstar Investment Adviser India Private Limited has one associate, Morningstar India Private Limited, which provides data-related services, financial data analysis, and software development. The Research Analyst has not served as an officer, director, or employee of the fund company within the last 12 months, nor has it or its associates engaged in market-making activity for the fund company. * The Conflicts of Interest disclosure above also applies to relatives and associates of Manager Research Analysts in India * The Conflicts of Interest disclosure above also applies to associates of Manager Research Analysts in India. The terms and conditions on which Morningstar Investment Adviser India Private Limited offers Investment Research to clients varies from client to client and are detailed in the respective client agreement. For recipients in Japan: The Report is distributed by Ibbotson Associates Japan, Inc., which is regulated by Financial Services Agency. Neither Ibbotson Associates Japan, Inc. nor its representatives are acting or will be deemed to be acting as an investment advisor to any recipients of this information. For recipients in Singapore: For Institutional Investor audiences only. Recipients of this report should contact their financial adviser in Singapore in relation to this report. Morningstar, Inc. and its affiliates rely on certain exemptions (Financial Advisers Regulations, Section 32B and 32C) to provide its investment research to recipients in Singapore.

How U.S. Tariffs Will Impact Steelmakers and Steel Users | 7 March 2018 | See Important Disclosures at the end of this report.
Page 23 of 23
About Morningstar® Institutional Equity ResearchTM
Morningstar Institutional Equity Research provides independent, fundamental equity research
differentiated by a consistent focus on sustainable competitive advantages, or Economic Moats.
For More Information
+1 312 696-6869
?
22 West Washington Street
Chicago, IL 60602 USA
©2018 Morningstar. All Rights Reserved. Unless otherwise provided in a separate agreement, you may use this report only in the country in which its original distributor is based. The information, data, analyses, and opinions presented herein do not constitute investment advice; are provided solely for informational purposes and therefore are not an offer to buy or sell a security; and are not warranted to be correct, complete, or accurate. The opinions expressed are as of the date written and are subject to change without notice. Except as otherwise required by law, Morningstar shall not be responsible for any trading decisions, damages, or other losses resulting from, or related to, the information, data, analyses, or opinions or their use. References to "Morningstar Credit Ratings" refer to ratings issued by Morningstar Credit Ratings, LLC, a credit rating agency registered with the Securities and Exchange Commission as a nationally recognized statistical rating organization ("NRSRO"). Under its NRSRO registration, Morningstar Credit Ratings issues credit ratings on financial institutions (e.g., banks), corporate issuers, and asset-backed securities. While Morningstar Credit Ratings issues credit ratings on insurance companies, those ratings are not issued under its NRSRO registration. All Morningstar credit ratings and related analysis are solely statements of opinion and not statements of fact or recommendations to purchase, hold, or sell any securities or make any other investment decisions. Morningstar credit ratings and related analysis should not be considered without an understanding and review of our methodologies, disclaimers, disclosures, and other important information found at https://ratingagency.morningstar.com. Investment research is produced and issued by subsidiaries of Morningstar, Inc. including, but not limited to, Morningstar Research Services LLC, registered with and governed by the U.S. Securities and Exchange Commission. The information contained herein is the proprietary property of Morningstar and may not be reproduced, in whole or in part, or used in any manner, without the prior written consent of Morningstar. To license the research, call +1 312 696-6869.