Embed Size (px)
Citation preview

DB Climate Change Advisors Deutsche Bank
Mark Fulton
Global Head of Climate Change Investment Research
Deutsche Bank Climate Change Advisors
http://www.dbcca.com/research
May 14th, 2012
How Transparency, Longevity and Certainty
in Public Policy Can Drive Investment

DB Climate Change Advisors Deutsche Bank
How Transparency, Longevity and Certainty in Public Policy Can Drive Investment
Introduction to DBCCA

Mark Fulton
How TLC in Public Policy Can Drive Investment DB Climate Change Advisors Deutsche Bank
DBCCA was formed in 2008 as a global in-house climate change
research team
— An investment industry thought-leader on a broad range of climate
change dynamics, with representatives in the US, UK, and China
— International research group (NYC, London and Beijing) has
published more than 35 whitepapers and research notes since
October 2007
— DBCCA also supports multiple business channels and climate
change investment teams across the DB Group, and briefs the firm’s
clients on the topic of climate change investments
Deutsche Bank Climate Change Advisors: An overview
3

Mark Fulton
How TLC in Public Policy Can Drive Investment DB Climate Change Advisors Deutsche Bank
DBCCA research team has access to a wide range of expertise
Coverage Research Areas
• Clean energy
• Energy efficiency
• Climate policy
• Power markets
• Agriculture
• Water
• Sustainable investing
Coverage Asset Classes
• Asset allocation trends
• Public equities
• Private equity
• Infrastructure
• Bonds
• Commodities
• Real estate
Coverage Geographical
Regions
• US
• Europe
• China
• Developing countries
Expertise in multiple climate change-related sectors and industries
4
Note: “Coverage Asset Classes” refers to the types of asset classes or markets (e.g. private equity markets, public markets) that DBCCA research covers

Mark Fulton
How TLC in Public Policy Can Drive Investment DB Climate Change Advisors Deutsche Bank
DBCCA Published Research: 41 and counting… Investing in Climate
Change Series: 2008,
2009, 2010 and 2011
February 2011
January 2010
October 2008
October 2007
Paying for Renewable
Energy: TLC at the Right
Price - Achieving Scale
through Efficient Policy
Design
December 2009
Global Climate Change
Policy Tracker I, II, III & IV
April 2012
July 2011
March 2010
October 2009
Infrastructure
Investments in
Renewable Energy
September 2009
Investing in
Agriculture: Far-
Reaching Challenge,
Significant Opportunity
June 2009
Global Climate
Change Regulation
Policy Developments:
July 2008-February
2009
February 2009
GET FiT Plus
April 2011
GET FiT Program:
Global Energy Transfer
Feed-in Tariffs for
Developing Countries
April 2010
Climate Change:
Addressing the Major
Skeptic Arguments
September 2010
20 Research Notes
UK Offshore Wind
November 2011
UK Renewable Energy
Investment Opportunity
April 2010
Natural Gas and
Renewables in the US
October 2011
November 2010
5
http://www.dbcca.com/dbcca/EN/investment_research.jsp
United States Building
Energy Efficiency
Retrofits: Market Sizing
and Financial Models
March 2012

DB Climate Change Advisors Deutsche Bank
How Transparency, Longevity and Certainty in Public Policy Can Drive Investment
Role of Asset Managers

Mark Fulton
How TLC in Public Policy Can Drive Investment DB Climate Change Advisors Deutsche Bank
Illustrative risk adjusted portfolio allocation
5/15/2012 2010 DB Blue template
7
Bonds
Public equity
Infrastructure
PE / VC
Cleaner energy
Energy efficiency
Transport
Agriculture
Waste
Water
Asset
Allocation
Sector
Selection
Investment Process
Risk ExposureMarket Price, Policy, Climate, Economic, Technology
Asset Class SelectionRisk, Target return, Liquidity, Geography
Ris
k A
dju
ste
d P
ortfo
lio A
llocatio
n
Source: DBCCA Analysis 2011

Mark Fulton
How TLC in Public Policy Can Drive Investment DB Climate Change Advisors Deutsche Bank
Investment spectrum for the private market climate change universe
5/15/2012 2010 DB Blue template
8
Source: Hudson Clean Energy Partners
Mark Fulton
How TLC in Public Policy Can Drive Investment DB Climate Change Advisors Deutsche Bank
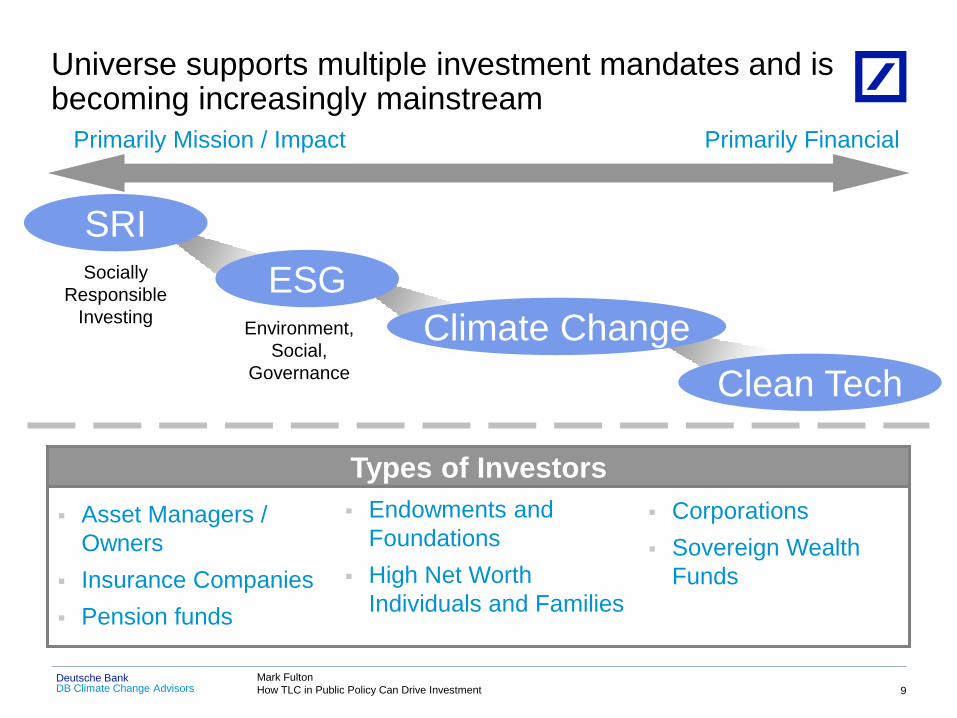
Universe supports multiple investment mandates and is becoming increasingly mainstream
5/15/2012 2010 DB Blue template
9
Primarily Mission / Impact Primarily Financial
SRI
ESG
Climate Change
Clean Tech
Types of Investors
Asset Managers /
Owners
Insurance Companies
Pension funds
Corporations
Sovereign Wealth
Funds
Endowments and
Foundations
High Net Worth
Individuals and Families
Socially
Responsible
Investing Environment,
Social,
Governance

DB Climate Change Advisors Deutsche Bank Mark Fulton
How TLC in Public Policy Can Drive Investment
Increasing commitment from investors
10
Note: As of July 2011. Source: UN PRI, 2011 Note: As of July 2011. Source: Ceres INCR, 2011
UN Principles for Responsible
Investment (UN PRI)
Investor Network on Climate
Risk (INCR)
Assets under management (AUM) and number of signatories growing substantially

DB Climate Change Advisors Deutsche Bank
How Transparency, Longevity and Certainty in Public Policy Can Drive Investment
Opportunity of Investing in Climate Change

Mark Fulton
How TLC in Public Policy Can Drive Investment DB Climate Change Advisors Deutsche Bank
Understanding technology trends, not just best available technology, is
potentially an important part of cost effective policy and regulation
Environmental regulations, markets and investors
5/15/2012 2010 DB Blue template
12
Pricing externalities
Eliciting technology responses
Investment in solutions
DB Climate Change Advisors Deutsche Bank Mark Fulton
How TLC in Public Policy Can Drive Investment
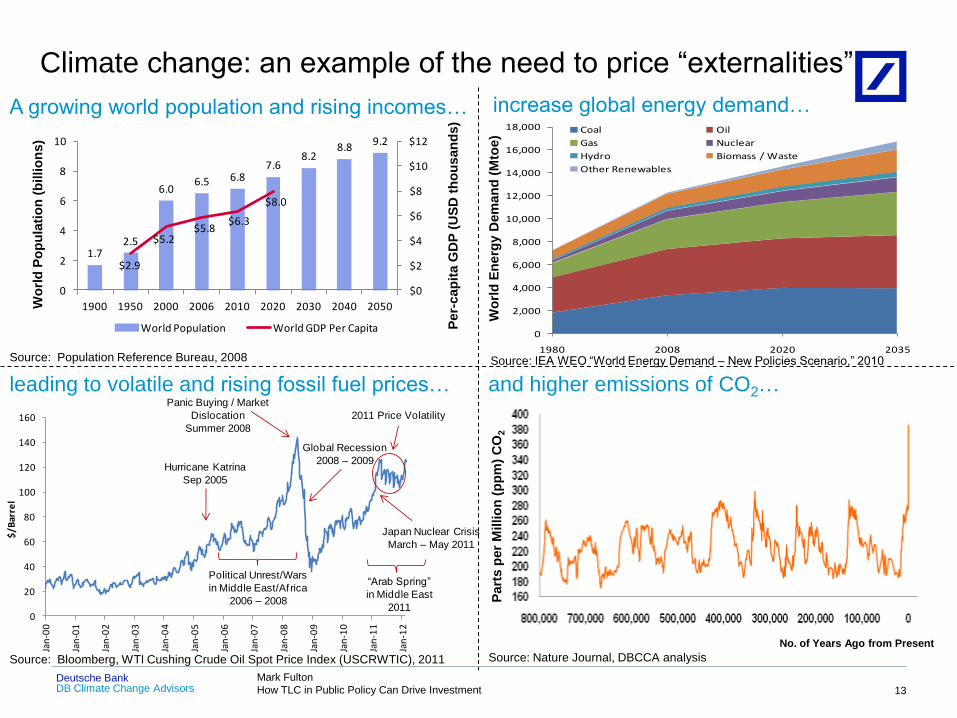
Climate change: an example of the need to price “externalities”
13
Wo
rld
Po
pu
lati
on
(b
illio
ns)
Source: Population Reference Bureau, 2008
A growing world population and rising incomes…
Source: IEA WEO “World Energy Demand – New Policies Scenario,” 2010
leading to volatile and rising fossil fuel prices… and higher emissions of CO2…
Wo
rld
En
erg
y D
em
an
d (
Mto
e)
Source: Bloomberg, WTI Cushing Crude Oil Spot Price Index (USCRWTIC), 2011 Source: Nature Journal, DBCCA analysis
No. of Years Ago from Present
Part
s p
er
Millio
n (
pp
m)
CO
2
increase global energy demand…
0
2,000
4,000
6,000
8,000
10,000
12,000
14,000
16,000
18,000
1980 2008 2020 2035
Coal Oil
Gas Nuclear
Hydro Biomass / Waste
Other Renewables
Per-
cap
ita G
DP
(U
SD
th
ou
san
ds)
1.72.5
6.06.5 6.8
7.68.2
8.89.2
$2.9
$5.2$5.8
$6.3
$8.0
$0
$2
$4
$6
$8
$10
$12
0
2
4
6
8
10
1900 1950 2000 2006 2010 2020 2030 2040 2050
World Population World GDP Per Capita
0
20
40
60
80
100
120
140
160
Jan
-00
Jan
-01
Jan
-02
Jan
-03
Jan
-04
Jan
-05
Jan
-06
Jan
-07
Jan
-08
Jan
-09
Jan
-10
Jan
-11
Jan
-12
$/B
arre
l
Hurricane Katrina
Sep 2005
Political Unrest/Wars
in Middle East/Africa
2006 – 2008
Global Recession
2008 – 2009
Panic Buying / Market
Dislocation
Summer 2008
“Arab Spring”
in Middle East
2011
Japan Nuclear Crisis
March – May 2011
2011 Price Volatility

Mark Fulton
How TLC in Public Policy Can Drive Investment DB Climate Change Advisors Deutsche Bank
Pricing “externalities” in energy markets: Health, safety, security and the environment
5/15/2012 2010 DB Blue template
14
Fuel Health Concerns Safety Concerns Energy Security
Concerns
Environmental
Concerns
Oil / Petroleum High High Very High Very High
Coal Very High High Low Very High
Nuclear Medium High Low Medium
Natural Gas Low High Medium /
Medium Low
Hydro Very Low Medium Very Low Low
Bioenergy Very Low Low Very Low Medium
Geothermal Very Low Low Very Low Low
Wind Low Very Low Very Low Very Low
Solar Very Low Very Low Very Low Low
Source: DBCCA Analysis 2011
A comparative analysis of different energy fuel sources, based on current technology

Mark Fulton
How TLC in Public Policy Can Drive Investment DB Climate Change Advisors Deutsche Bank
The climate change investment universe is broad and deep in terms of sectors and technologies
5/15/2012 2010 DB Blue template
15
Transport High efficiency / lower emissions vehicles
Sustainable biofuels
Flex fuel vehicles
Hybrids
Electric vehicles
Battery technology
Natural gas vehicles
Hydrogen fuel cells
Water Filtration & membrane technology
Purification & disinfection: pre-chlorination,
coagulation, sedimentation
Equipment: pipes, valves, etc.
Safe chemicals
Desalination
Distribution & management: monitoring &
metering
Energy recovery devices
Wastewater treatment
Agriculture (Climate) smart machinery
(Climate) smart irrigation
Seeds & breeding technologies: GMO’s &
hybrids
Clean/bio pesticides & fungicides
Smart fertilizers
GIS management systems
Waste Management Recycling & e-cycling
Advanced/sustainable materials
Anaerobic digestion
Mechanical heat and biologic treatment
Waste to energy
Land remediation
Material mgmt strategies
Advanced waste sorting
Building Efficiency Efficient & LED lighting
Advanced materials
Micro generation / CHP
Retrofits, ESCO & Energy Services
Advanced/efficient appliances & lighting
Heating & cooling systems
Building mgmt: home energy displays &
smart meters
District power/heat networks
Power Grid Efficiency Energy mgmt systems
Infrastructure: advanced metering, UHV
transmission, electric charging
Storage: compressed air, batteries, flywheels
Wide area monitoring
Smart grid
Distributed grid
Grid security
Power Generation Solar (PV, CSP, thermal)
Wind (onshore, offshore)
Other clean power (geothermal, hydro, landfill
gas, marine, tidal, etc.)
Fuel switch: coal to natural gas/ biomass;
biomass to biomethane
Clean coal and gas (CCS)
Nuclear fission
Increased efficiency
Combined heat and power
Mass energy storage
Fuel cells
Future breakthrough technologies (e.g.
nuclear fusion)
Industrial Efficiency Expanded, efficient technology products
Recycling of steel
Valve fitting and improvements
Speed controls
Waste heat recovery
Insulating distribution systems
Membrane use
Low carbon cement
Cleaner Energy Environmental Resources Energy & Material Efficiency
Source: DBCCA Analysis 2012

DB Climate Change Advisors Deutsche Bank Mark Fulton
How TLC in Public Policy Can Drive Investment
OECD+ = OECD plus other EU
OME = Other Major Economies OC = Other Countries
Investment in climate change sectors presents a rich and diversified investment universe
16
Significant amounts of capital are
entering clean energy globally
Opportunities abound in energy
efficiency
Source: OECD/IEA 450 Scenario, World Energy Outlook 2009 Sources: 2004 – 2011 data, Bloomberg New Energy Finance, 2012;
2015 – 2030 forecast, DBCCA Analysis 2012
Efficiency – 57%
Renewables &
Biofuels – 23%
Nuclear – 10%
CCS – 10%
Abatement by
Technology, 2030 Global Emissions in the IEA 2009 Reference
and 450 Scenarios by Region
$54
$75
$113
$153
$187 $189
$247$260
$343
$395
$533
$631
$0
$100
$200
$300
$400
$500
$600
$700
2004 2005 2006 2007 2008 2009 2010 2011 2015 2020 2025 2030
An
nu
al
Ne
w In
ve
stm
en
t ($
Billio
ns
)Th
ou
san
ds

DB Climate Change Advisors Deutsche Bank Mark Fulton
How TLC in Public Policy Can Drive Investment
Universe extends beyond low carbon energy
17
Agricultural production must double to
feed the global population in 2030
60%
20%
20%
billi
on
s o
f to
ns
Demand with no
productivity
improvements
Historical
improvements in
water productivity
Remaining gap
Increase in
supply under
business-as-usual
Existing
Accessible
reliable supply
Source: 2030 Water Resources Group – Global Water Supply and Demand
model, Charting Our Water Future, Exhibit II 2009; DBCCA Analysis, 2010 Source: McKinsey. 2009.
Business as usual approaches will not
satisfy growing demand for water…
Demand Scenario Assumptions
2030 low case: Only population growth drives increase in
total demand
2030 high case: Per capita food consumption and caloric
intake aligned to European level; high biofuel expansion

Mark Fulton
How TLC in Public Policy Can Drive Investment DB Climate Change Advisors Deutsche Bank
5/15/2012 2010 DB Blue template
18
While fossil fuels are in finite supply, renewable sources are technically sufficient to meet world energy needs
812
1,600
600 500
250
50 1
0
200
400
600
800
1000
1200
1400
1600
1800
Projected World
Energy Use in 2035
Solar Wind Geothermal Biomass Hydropower Ocean Energy
En
erg
y F
low
(E
J p
er
ye
ar)
Note: One exejoule equals 1018 joules. For reference, there are 3.6 * 106 joules in one kilowatt-hour (kWh).
Sources: IEA, International Energy Outlook 2011, 2011; Worldwatch Institute. State of the World 2009, 2009; UNDP; Johansson et al., 2005.
Renewable Energy Potential with Current Technology vs. Future World Energy Demand

DB Climate Change Advisors Deutsche Bank
How Transparency, Longevity and Certainty in Public Policy Can Drive Investment
Role of Public Policy

Mark Fulton
How TLC in Public Policy Can Drive Investment DB Climate Change Advisors Deutsche Bank
Investors essentially look for 3 key drivers in policy:
What do investors want from policy?
5/15/2012 2010 DB Blue template
20
In assessing the potential success of policies, these factors should be
taken into account

Mark Fulton
How TLC in Public Policy Can Drive Investment DB Climate Change Advisors Deutsche Bank
Government policy frameworks extend beyond emissions targets and carbon pricing, and require expertise
5/15/2012 2010 DB Blue template
21
Note: RPS refers to Renewable Portfolio Standard; RFS refers to Renewable Fuel Standard; RES refers to Renewable Energy Standard
Source: DBCCA Analysis 2011
Mark Fulton
How TLC in Public Policy Can Drive Investment DB Climate Change Advisors Deutsche Bank
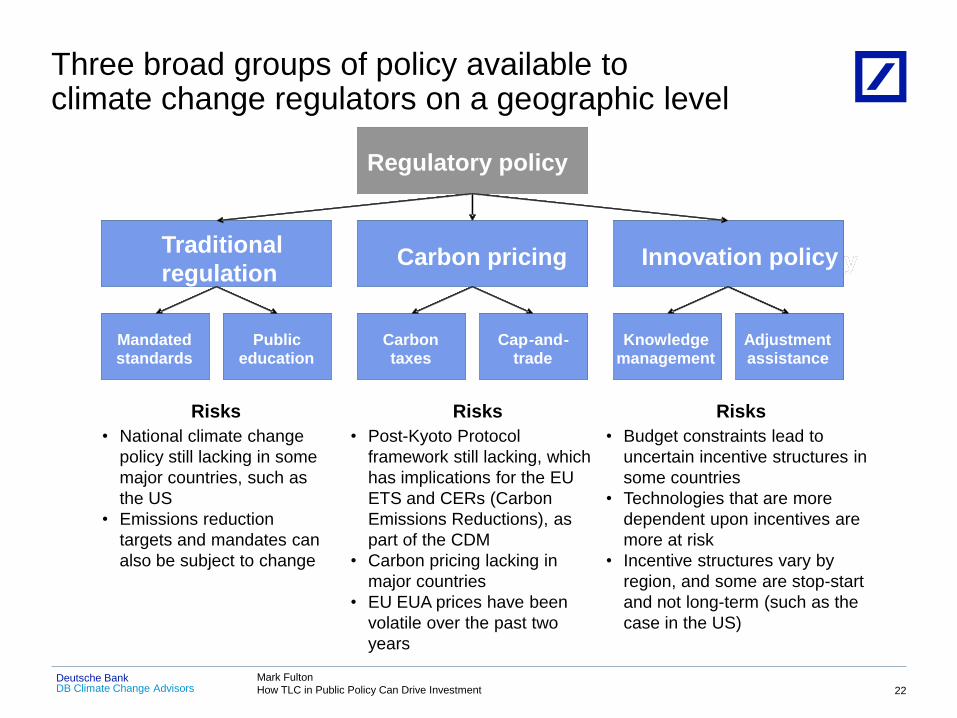
Three broad groups of policy available to climate change regulators on a geographic level
5/15/2012 2010 DB Blue template
22
Carbon pricing Innovation policy
Mandated standards
Public education
Carbon taxes
Knowledge management
Adjustment assistance
Cap - and - trade
Carbon pricing Carbon pricing Innovation policy Innovation policy
Mandated standards Mandated standards
Public education
Public education
Carbon taxes
Carbon taxes
Knowledge management Knowledge
management Adjustment assistance Adjustment assistance
Cap - and - trade
Cap - and - trade
Carbon pricing Carbon pricing
Mandated standards Mandated standards
Public education
Public education
Carbon taxes
Carbon taxes
Knowledge management Knowledge
management Adjustment assistance Adjustment assistance
Cap - and - trade
Cap - and - trade
Traditional
regulation Carbon pricing Carbon pricing Innovation policy
Regulatory policy
Mandated standards Mandated standards
Public education
Public education
Carbon taxes
Carbon taxes
Knowledge management Knowledge
management Adjustment assistance Adjustment assistance
Cap - and - trade
Cap - and - trade
Risks
• Budget constraints lead to
uncertain incentive structures in
some countries
• Technologies that are more
dependent upon incentives are
more at risk
• Incentive structures vary by
region, and some are stop-start
and not long-term (such as the
case in the US)
Risks
• National climate change
policy still lacking in some
major countries, such as
the US
• Emissions reduction
targets and mandates can
also be subject to change
Risks
• Post-Kyoto Protocol
framework still lacking, which
has implications for the EU
ETS and CERs (Carbon
Emissions Reductions), as
part of the CDM
• Carbon pricing lacking in
major countries
• EU EUA prices have been
volatile over the past two
years

Mark Fulton
How TLC in Public Policy Can Drive Investment DB Climate Change Advisors Deutsche Bank
Best-in Class Energy Policies: Driving Transparency, Longevity and Certainty (TLC)
5/15/2012 2010 DB Blue template
23
Country
Emissions Control Financial Support
Long-term
Grid
Improvem
ent Plan
Risks Deployment
Likelihood of
meeting
mandates
Binding/
Account-able
Emission
Target
Renew-able
Electricity
Standard
Long-term
Energy
Efficiency
Plan
Feed-in
Tariff
Long-term
Govt-based
‘Green
Bank’
Tax
Benefits
Long-term
funding
programs
Budget
strength
(deficit as
% of GDP
in 2011)
Capital
Investment
($mn) 2009-
2011
GDP
2011
(Official
Exchange
Rate $tn)
Germany ✔c ✔ ✔ ✔ ✔ ✔ ✔ ✔ -1.7% 52,687 $3.63
Strong
China ✔ c
regional ✔ ✔ ✔ ✔ ✔ ✔ ✔ -1.2% 191,222 $6.99
Strong
United
Kingdom ✔c ✔ ✔ ✔ ✔ ✔ ✔ ✔ -8.8% 46,904 $2.48
Strong to
Moderate
Australia ✔c ✔ ✔ State-level ✔ ✔ ✔ State-level -2.5% 10,977 $1.51 Strong to
Moderate
Japan ✔ ✔ ✔ ✔ X ✔ ✔ ✔ -8.5% 15,770 $5.86 Moderate
Brazil ✔ ✔ ✔ X ✔ ✔ ✔ ✔ -3.1% 51,714 $2.52 Strong
Canada ✔ State-level ✔ State-level X ✔ ✔ State-level -3.8% 25,363 $1.76 Moderate
India 6COP Acc ✔ ✔ State-level X ✔ ✔ ✔ -5.0% 41,229 $1.84 Moderate to
Low
Mexico 6COP Acc ✔ ✔ X X ✔ ✔ State-level -2.4% 5,207 $1.19 Low
United
States 6COP Acc State-level State-level State-level 6 ✔ State-level State-level -8.9% 219,498 $15.06
Moderate to
Low
South Africa 6COP Acc ✔ ✔ ✔ X X ✔ 6 -5.2% 374 $0.42 Moderate to
Low
Notes: 6COP Acc = policy is a submission to the Copenhagen Accord and is not legally binding ; 6 = tentative / unconfirmed policy dependent on certain provisions (e.g. funding)
Source: DBCCA Analysis 2011; GDP and Budget Strength data: CIA World Factbook; Capital Investment by country: Bloomberg NEF 2012

DB Climate Change Advisors Deutsche Bank Mark Fulton
How TLC in Public Policy Can Drive Investment
R&D on high-risk, high-impact technologies
Expectations about future demand for renewable energy
Incentives to invest in scaling production capacity and other cost-
reducing activities
Levelized Cost Of Energy (LCOE) cost trends and competitiveness
of renewable technologies
24
Sources: DBCCA analysis 2012
Supportive public policy is helping to scale production volumes and accelerate technical progress…
Government support
of public and private
R&D can accelerate
technological
breakthroughs
By stabilizing market
expectations (and
perceptions of risk),
policy incentives can
increase the scale of
renewable energy
manufacturing – and
hence reduce the cost
of renewable energy
Externalities
need pricing

DB Climate Change Advisors Deutsche Bank Mark Fulton
How TLC in Public Policy Can Drive Investment
… and reduce costs so that renewables can compete with conventional energy sources (without subsidies)
25
0.0
0.2
0.4
0.6
0.8
1.0
1.2
1.4
0
200
400
600
800
1,000
1,200
1,400
1,600
1,800
2,000
2,200
1930 1935 1940 1945 1950 1955 1960 1965 1970 1975 1980 1985 1990 1995 2000 2005 2010
Re
tail
Co
st (
$/k
Wh
)
Ge
ne
rati
on
(TW
h)
Coal Generation Gas Generation Nuclear Generation Solar Generation Wind Generation
Coal Cost Trend Gas Cost Trend Nuclear Cost Trend Solar Cost Trend Wind Cost Trend
Coal, Natural Gas, and
Nuclear required massive achievements in improving
scale to achieve current
favorable cost structures
Solar and Wind are
experiencing significant
improvements in their
cost structure with small
increases in scale
0
200
400
600
800
1000
1200
1400
1600
1800
2000
2200
Genera
tion (T
Wh)
0.0
0.2
0.4
0.6
0.8
1.0
1.2
1.4
Reta
il C
ost
$/ kW
h
1935 1940 1945 1950 1955 1960 19651930 1970 1975 1980 1985 1990 1995 20001965 2005 2010
Coal Generation
Coal Cost-trend
Gas Generation
Gas Cost-trend
Nuclear Generation
Nuclear Cost-trend
Solar Generation
Solar Cost-trend
Wind Generation
Wind Cost-trend
U.S. Electricity Generation and Retail Cost by Energy Source 1930 – 2010
Source: Hudson Clean Energy Partners Analysis, 2011

DB Climate Change Advisors Deutsche Bank
How Transparency, Longevity and Certainty in Public Policy Can Drive Investment
The US Experience

DB Climate Change Advisors Deutsche Bank Mark Fulton
How TLC in Public Policy Can Drive Investment
Asset Finance,
65% Public
Markets, 4%
Corporate R&D, 7%
Gov’t R&D, 7%
SDC, 7%
VC/PE, 11%
The US invests strongly in early-stage cleantech
$13,562 $16,470
$33,756
$40,315
$46,288
$37,416
$42,128
$56,529
$0
$10,000
$20,000
$30,000
$40,000
$50,000
$60,000
2004 2005 2006 2007 2008 2009 2010 2011
Asset Finance Public Markets Corporate R&D
Gov't R&D SDC VC/PE
5/15/2012 2010 DB Blue template
27
Notes: SDC is Small Distributed Capacity.
Source: Bloomberg New Energy Finance
New Investment in US Clean Energy by Asset Class,
2011 (%)
In 2011 the share of VC/PE activity in total US clean energy investment was 11%
US Clean Energy Investment by Asset Class,
2004-2011 ($ Millions)

Mark Fulton
How TLC in Public Policy Can Drive Investment DB Climate Change Advisors Deutsche Bank
In 2011, $6.0 billion of US transactions accounted for 68% of new global VC/PE investing
in clean energy
This is the highest figure globally, and far outstrips China’s private investment in this
space, which in recent years has declined on both a relative and absolute basis
… and the US leads the world in investing to commercialize clean energy technologies
5/15/2012 2010 DB Blue template
28
Source: Bloomberg New Energy Finance
$0.6
$1.4
$2.6
$3.9
$7.1
$3.9
$5.7$6.0
$0.0 $0.1
$0.7$0.5
$0.7
$0.2 $0.3 $0.5
0%
10%
20%
30%
40%
50%
60%
70%
80%
90%
100%
$0
$1
$2
$3
$4
$5
$6
$7
$8
2004 2005 2006 2007 2008 2009 2010 2011
% o
f To
tal A
nn
ual
Ne
w V
C/P
E In
vest
me
nt
An
nu
al N
ew
VC
/PE
Inve
stm
en
t ($
Bil
lio
ns)
US Investment China Investment US % of Total China % of Total

DB Climate Change Advisors Deutsche Bank Mark Fulton
How TLC in Public Policy Can Drive Investment
… and aggressively promotes clean energy innovation
•battery technologies
•building cooling
•carbon capture
•electro-fuels (i.e. non-photosynthetic biofuels)
•green electricity network integration
•grid energy storage
•high energy thermal storage
•plants engineered to replace oil
•power electronics for electric grid applications
•power electronics for solar applications
•rare earth alternatives for critical technologies
University, 40%
Small Business,
31%
Large Business,
22%
National Lab, 5%
Non-Profit, 2%
5/15/2012 2010 DB Blue template
29
The US Department of Energy’s Advanced Research Projects Agency – Energy (ARPA-E)
funds high-risk technologies to reduce CO2 emissions and improve energy efficiency
In 2009-10, ARPA-E awards of $400K-$9M to 121 projects (average award size $3M)
ARPA-E Projects by Lead Organization Type ARPA-E Program Areas
Source: ARPA-E, FY2010 Annual Report

Mark Fulton
How TLC in Public Policy Can Drive Investment DB Climate Change Advisors Deutsche Bank
0
2,000
4,000
6,000
8,000
10,000
12,000
1999 2000 2001 2002 2003 2004 2005 2006 2007 2008 2009 2010 2011 2012 2013
An
nu
al
Win
d C
ap
ac
ity A
dd
itio
ns
(M
W)
A history of inconsistent US federal support for renewables
5/15/2012 2010 DB Blue template
30
92%
Drop
76%
Drop
76%
Drop
Production Tax Credit Expiration Years
• Production Tax Credit
(PTC) – Expiring end-
2012
• Section 1603 Treasury
Cash Grant – Expired
end-2011
• Sections 1703 & 1705
Loan Guarantees –
Expired in 2011
Wind market likely
to drop off in 2013
Sources: AWEA, 2012; Bloomberg New Energy Finance, 2012
Forecast / Estimate (with PTC extension)
Forecast / Estimate (no PTC extension)

Mark Fulton
How TLC in Public Policy Can Drive Investment DB Climate Change Advisors Deutsche Bank
Key federal policy drivers of US renewables deployment
5/15/2012 2010 DB Blue template
31
• 30% for solar, fuel cells, and small wind (<100 kW); 10% for geothermal, micro-turbines, and CHP (< 50 MW)
• Scheduled to expire on Dec 31, 2016
• Tax-equity market constrained
Business Energy Investment Tax Credit (ITC)
• 2.2 ₵/kWh for wind, geothermal, and closed-loop biomass; 1.1 ₵/kWh for other eligible technologies
• Scheduled to expire on Dec 31, 2012 – extension possible?
• Tax-equity market constrained
Renewable Electricity Production Tax Credit (PTC)
• Expired Dec 31, 2011
• Provided 30% ITC in the form of a cash grant from the US Treasury 1603 Program
Sources: US Database of State Incentives for Renewables and Efficiency (DSIRE)
Additionally, 29 states (plus DC and PR) have Renewable Portfolio Standards (RPS)
RPS mandates that utilities must procure a minimum % of generation from renewable sources
Federal Policies

Mark Fulton
How TLC in Public Policy Can Drive Investment DB Climate Change Advisors Deutsche Bank
State policies helping to lead America in renewables
5/15/2012 2010 DB Blue template
32
State renewable portfolio standard
State renewable portfolio goal
Solar water heating eligible * †
Extra credit for solar or customer - sited renewables
Includes separate tier of non - renewable alternative resources
Minimum solar or customer - sited requirement State renewable portfolio standard
State renewable portfolio goal
Solar water heating eligible * †
Extra credit for solar or customer - sited renewables
Includes separate tier of non - renewable alternative resources
Minimum solar or customer - sited requirement
WA: 15% by 2020*
CA: 33% by 2020
NV: 25% by 2025*
AZ: 15% by 2025
NM: 20% by 2020 (IOUs)
10% by 2020 (co-ops)
HI: 40% by 2030
TX: 5,880 MW by 2015
UT: 20% by 2025*
CO: 20% by 2020 (IOUs) 10% by 2020 (co-ops & large munis)*
MT: 15% by 2015
ND: 10% by 2015
SD: 10% by 2015
IA: 105 MW
MN: 25% by 2025 (Xcel: 30% by 2020)
MO: 15% by 2021
WI: Varies by utility;
10% by 2015 goal
MI: 10% + 1,100 MW by
2015*
OH: 25% by 2025†
ME: 30% by 2000 New RE: 10% by 2017
NH: 23.8% by 2025
MA: 15% by 2020
+ 1% annual increase
(Class I Renewables)
RI: 16% by 2020
CT: 23% by 2020
NY: 29% by 2015
NJ: 22.5% by 2021
PA: 18% by 2020†
MD: 20% by 2022
DE: 20% by 2019*
DC: 20% by 2020
VA: 15% by 2025*
NC: 12.5% by 2021 (IOUs)
10% by 2018 (co-ops & munis)
VT: (1) RE meets any increase in retail sales by 2012;
(2) 20% RE & CHP by 2017
29 states & DC
& PR have an RPS
7 states have goals
KS: 20% by 2020
OR: 25% by 2025 (large utilities)*
5% - 10% by 2025 (smaller utilities)
IL: 25% by 2025
Sources: US Database of State Incentives for Renewables and Efficiency (DSIRE); Goldman Sachs, “US State Policies Call for a Decade-Long Investment Cycle”, Dec 6 2011
OK: 15% by 2015
WV: 25% by 2025*
PR: 20% by 2035
☼

Mark Fulton
How TLC in Public Policy Can Drive Investment DB Climate Change Advisors Deutsche Bank
EPA standards drive closure of old, inefficient coal plants
5/15/2012 2010 DB Blue template
33
• Targets emissions of heavy metals and acid gases from power plants
• Affects 40% of existing coal-fired units (1,100 units) – many 30-50 years old
• Requires $10 bn/yr of capex on scrubbers, sorbent injection, fabric filters
• In effect: EPA issued rule in Dec 2011; plants have 3-4 years to comply1
Utility Hazardous Air Pollution Standards
(HAPS MACT)
• Requires 1000+ plants in 28 states to reduce emissions of SO2 and NOX
• Adds $2.4bn/yr of capex on selective catalytic reduction and scrubbers
• Being litigated: DC Court of Appeals recently stayed execution; April 2012 hearing had a mixed outcome
Cross-State Air Pollution Rule
(CSAPR)
• Clean Air Act compels EPA to develop regulations for GHG emissions
• Proposed new source performance standards (NSPS) for GHGs issued in March 2012
• Despite implementation uncertainty, GHG regulatory risk can deter investment in new coal-fired generation
Greenhouse Gas Emissions
Sources: “Fact Sheet: Mercury and Air Toxics Standards for Power Plants”, Environmental Protection Agency (EPA), 2011; : “Fact Sheet: The Cross-State Air Pollution Rule:
Reducing the Interstate Transport of Fine Particulate Matter and Ozone”, EPA, 2011; Congressional Research Service, 2011; Washington Analysis, 2011.
Key Regulations
1 For reliability critical (i.e. Reliability Must Run, or RMR) units, EPA is providing up to an additional year to comply with HAPS MACT standards.
$2bn/yr+ of additional retrofit capex from other forthcoming EPA rules:
National Ambient Air Quality Standards (NAAQS) for particulate matter
Cooling Water Intake Structure Rule (expected July 2012)
Coal Combustion Waste Rule (expected 2012 or later)
Cumulative impact of EPA actions: shifts investment coal to gas

Mark Fulton
How TLC in Public Policy Can Drive Investment DB Climate Change Advisors Deutsche Bank
Coal-to-gas fuel and asset switch decision tree matrix and commodity price sensitivity
5/15/2012 2010 DB Blue template
34
Coal / Gas
Scenarios 1 2 3
DBCCA Comment Power Generation
Type ($/mmBtu
Fuel)
Existing Coal/Gas
Plant LCOE
Depreciated Coal
Plant EPA Retrofit
Fully Loaded Cash
Cost
New Build Coal/Gas
Scrubbed EPA
Compliant Plant Fully
Loaded Cash Cost
Coal @ $3.00 0.04-0.06
0.06-0.09 0.10-0.14
Coal fully loaded cash costs rise with
greater EPA compliance
Gas @ $4.00
0.03-0.05
N/A 0.05-0.07
At $4/mmBtu, gas displaces coal across all
scenarios
Fuel switch Yes Yes Yes Hedge a carbon price
Asset switch Yes Yes Yes Hedge a carbon price; build new gas assets
to replace inefficient coal
Gas @ $6.00 0.05-0.07 N/A 0.06-0.10
At $6/mmBtu, only old unscrubbed coal
beats gas on LCOE but not based on fully
loaded cash cost
Fuel switch No Yes Yes
Asset switch No Yes Yes Hedge a carbon price; build new gas assets
to replace inefficient coal
Gas @ $8.00 0.06-0.08 N/A 0.07-0.09
At $8/mmBtu, old coal beats gas on LCOE
and new EPA compliant builds are
breakeven with gas
Fuel switch No Yes Selectively Hedge a carbon price; dispatch efficient gas
assets
Asset switch No Yes Selectively Hedge a carbon price; build new gas assets
to replace inefficient coal
Current US spot price of natural gas: $2.03/MMBtu1
1 Price is the average Henry Hub spot price for month of April
Sources: DBCCA analysis 2011; Oilnergy 2012

Mark Fulton
How TLC in Public Policy Can Drive Investment DB Climate Change Advisors Deutsche Bank
By imposing regulations and performance standards, EPA looks for best
available current technologies to meet these requirements
Either this prices the regulated entity out of the market (e.g. coal to gas),
or it produces a technological response that is cost effective
For example – in terms of GHGs, a critical technology would be CCS,
but CCS is not yet commercially available
Performance standards, best available technology, and innovation
5/15/2012 2010 DB Blue template
35
Should EPA focus both on best current technologies and best future
technologies? Role of National Advisory Council for Environmental
Policy and Technology (NACEPT)?
When developing regulations, EPA can work with other agencies – such
as DOE’s ARPA-E – to understand what is achievable and acceptable in
current economy
Mark Fulton
How TLC in Public Policy Can Drive Investment DB Climate Change Advisors Deutsche Bank
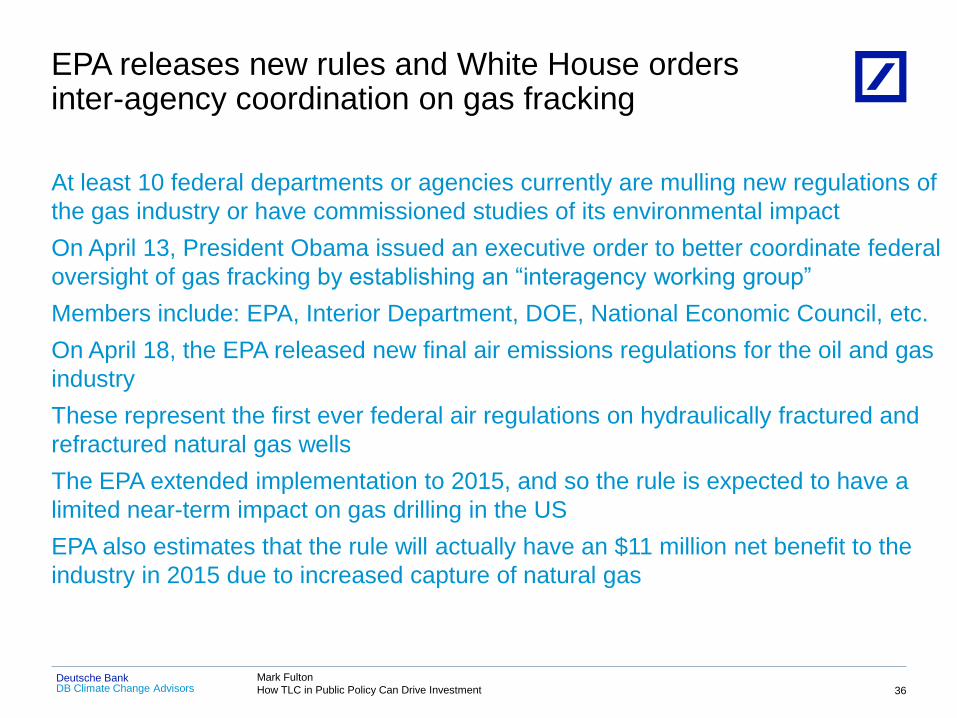
At least 10 federal departments or agencies currently are mulling new regulations of
the gas industry or have commissioned studies of its environmental impact
On April 13, President Obama issued an executive order to better coordinate federal
oversight of gas fracking by establishing an “interagency working group”
Members include: EPA, Interior Department, DOE, National Economic Council, etc.
On April 18, the EPA released new final air emissions regulations for the oil and gas
industry
These represent the first ever federal air regulations on hydraulically fractured and
refractured natural gas wells
The EPA extended implementation to 2015, and so the rule is expected to have a
limited near-term impact on gas drilling in the US
EPA also estimates that the rule will actually have an $11 million net benefit to the
industry in 2015 due to increased capture of natural gas
EPA releases new rules and White House orders inter-agency coordination on gas fracking
5/15/2012 2010 DB Blue template
36

DB Climate Change Advisors Deutsche Bank Mark Fulton
How TLC in Public Policy Can Drive Investment
2010-2030: US electricity supply mix becomes greener and more gas-intensive
5/15/2012 2010 DB Blue template
37
Sources: EIA; DBCCA analysis 2011
US Electricity Supply Mix
2010A (% Total TWh)
US Electricity Supply Mix
2030E (% total TWh)
11% RE
24% Nat Gas
24% RE
38% Nat Gas
Assumes from 2010-2030 energy efficiency measures limit growth in electricity
demand to a 0.7% compound annual growth rate (CAGR)
Coal, 45%
Natural Gas, 24%
Nuclear, 19%
Baseload Renewables,
8%Wind & Solar,
3%
Petroleum, 1%
Coal, 45%
Coal CCS,1%
Natural Gas, 38%
Nuclear, 19%
Baseload Renewables,
8%
Wind & Solar, 17%

Mark Fulton
How TLC in Public Policy Can Drive Investment DB Climate Change Advisors Deutsche Bank
Repowering America: Key phases
5/15/2012 2010 DB Blue template
38
Wind dominates:
lowest cost, RPS
driven
Gas utilization
increases
Coal retirement phase
starts
Nuclear retirement
phase starts
Gas build starts
Solar buildup as costs fall
Energy
efficiency
improvements
throughout
Annual Generation Capacity Additions/Removals by Technology, 2010-2030 (MW)
Sources: WPK Model, DBCCA analysis 2011.

Mark Fulton
How TLC in Public Policy Can Drive Investment DB Climate Change Advisors Deutsche Bank
~500,000 net new jobs in 2030 as compared with 2010
5/15/2012 2010 DB Blue template
39
Sources: WPK Model, DBCCA analysis 2011
Annual Net New Job Additions by Sector and Type, 2010-2030

Mark Fulton
How TLC in Public Policy Can Drive Investment DB Climate Change Advisors Deutsche Bank
Investors essentially look for 3 key drivers in policy:
And again… What investors want from policy
5/15/2012 2010 DB Blue template
40
In assessing the potential success of policies, these factors should be
taken into account

DB Climate Change Advisors Deutsche Bank Mark Fulton
How TLC in Public Policy Can Drive Investment
Disclaimer
41
DB Climate Change Advisors is the brand name for the institutional climate change investment division of Deutsche Asset Management, the asset management arm of Deutsche Bank AG. In the US, Deutsche
Asset Management relates to the asset management activities of Deutsche Bank Trust Company Americas, Deutsche Investment Management Americas Inc. and DWS Trust Company; in Canada, Deutsche
Asset Management Canada Limited (Deutsche Asset Management Canada Limited is a wholly owned subsidiary of Deutsche Investment Management Americas Inc); in Germany and Luxembourg: DWS
Investment GmbH, DWS Investment S.A., DWS Finanz-Service GmbH, Deutsche Asset Management Investmentgesellschaft mbH, and Deutsche Asset Management International GmbH; in Denmark, Finland,
Iceland, Norway and Sweden, Deutsche Asset Management International GmbH ; in Australia, Deutsche Asset Management (Australia) Limited (ABN 63 116 232 154); in Hong Kong, Deutsche Asset Management
(Hong Kong) Limited; in Japan, Deutsche Asset Management Limited (Japan); in Singapore, Deutsche Asset Management (Asia) Limited (Company Reg. No. 198701485N) and in the United Kingdom, Deutsche
Alternative Asset Management (UK) Limited (formerly known as RREEF Limited), Deutsche Alternative Asset Management (Global) Limited (formerly known as RREEF Global Advisers Limited), and Deutsche
Asset Management (UK) Limited; in addition to other regional entities in the Deutsche Bank Group.
This material is intended for informational purposes only and it is not intended that it be relied on to make any investment decision. It does not constitute investment advice or a recommendation or an offer or
solicitation and is not the basis for any contract to purchase or sell any security or other instrument, or for Deutsche Bank AG and its affiliates to enter into or arrange any type of transaction as a consequence of
any information contained herein. Neither Deutsche Bank AG nor any of its affiliates, gives any warranty as to the accuracy, reliability or completeness of information which is contained in this document. Except
insofar as liability under any statute cannot be excluded, no member of the Deutsche Bank Group, the Issuer or any officer, employee or associate of them accepts any liability (whether arising in contract, in tort or
negligence or otherwise) for any error or omission in this document or for any resulting loss or damage whether direct, indirect, consequential or otherwise suffered by the recipient of this document or any other
person.
The views expressed in this document constitute Deutsche Bank AG or its affiliates’ judgment at the time of issue and are subject to change. This document is only for professional investors. This document was
prepared without regard to the specific objectives, financial situation or needs of any particular person who may receive it. The value of shares/units and their derived income may fall as well as rise. Past
performance or any prediction or forecast is not indicative of future results. No further distribution is allowed without prior written consent of the Issuer.
The forecasts provided are based upon our opinion of the market as at this date and are subject to change, dependent on future changes in the market. Any prediction, projection or forecast on the economy, stock
market, bond market or the economic trends of the markets is not necessarily indicative of the future or likely performance.
For Investors in the United Kingdom:
Issued in the United Kingdom by Deutsche Asset Management (UK) Limited of One Appold Street, London, EC2A 2UU. Authorised and regulated by the Financial Services Authority. This document is a "non-retail
communication" within the meaning of the FSA’s Rules and is directed only at persons satisfying the FSA’s client categorisation criteria for an eligible counterparty or a professional client. This document is not
intended for and should not be relied upon by a retail client.
When making an investment decision, potential investors should rely solely on the final documentation relating to the investment or service and not the information contained herein. The investments or services
mentioned herein may not be appropriate for all investors and before entering into any transaction you should take steps to ensure that you fully understand the transaction and have made an independent
assessment of the appropriateness of the transaction in the light of your own objectives and circumstances, including the possible risks and benefits of entering into such transaction. You should also consider
seeking advice from your own advisers in making this assessment. If you decide to enter into a transaction with us you do so in reliance on your own judgment.
For Investors in Australia:
In Australia, Issued by Deutsche Asset Management (Australia) Limited (ABN 63 116 232 154), holder of an Australian Financial Services License. An investment with Deutsche Asset Management is not a deposit
with or any other type of liability of Deutsche Bank AG ARBN 064 165 162, Deutsche Asset Management (Australia) Limited or any other member of the Deutsche Bank AG Group. The capital value of and
performance of an investment with Deutsche Asset Management is not guaranteed by Deutsche Bank AG, Deutsche Asset Management (Australia) Limited or any other member of the Deutsche Bank Group.
Investments are subject to investment risk, including possible delays in repayment and loss of income and principal invested.
For Investors in Hong Kong:
Interests in the funds may not be offered or sold in Hong Kong or other jurisdictions, by means of an advertisement, invitation or any other document, other than to Professional Investors or in circumstances that
do not constitute an offering to the public. This document is therefore for the use of Professional Investors only and as such, is not approved under the Securities and Futures Ordinance (SFO) or the Companies
Ordinance and shall not be distributed to non-Professional Investors in Hong Kong or to anyone in any other jurisdiction in which such distribution is not authorised. For the purposes of this statement, a
Professional investor is defined under the SFO.
For Investors in MENA region:
This information has been provided to you by Deutsche Bank AG Dubai (DIFC) branch, an Authorised Firm regulated by the Dubai Financial Services Authority. It is solely directed at Market Counterparties or
Professional Clients of Deutsche Bank AG Dubai (DIFC) branch, which meets the regulatory criteria as established by the Dubai Financial Services Authority and may not be delivered to or acted upon by any other
person.
I-027677-1.1


![Brown to Green Report 2018: The G20 ... - Climate Transparency · Secretariat of Climate Transparency: [1] HUMBOLDT-VIADRINA Governance Platform gGmbH, Pariser Platz 6, 10117 Berlin](https://img.pdfslide.us/doc/110x75/60200d7ac8f25e3bd5485a55/brown-to-green-report-2018-the-g20-climate-transparency-secretariat-of-climate.jpg)