Embed Size (px)
Citation preview
How to View the Input-Output Tables
—Input-Output Tables Showing the Flow of Goods and Services in Japan—
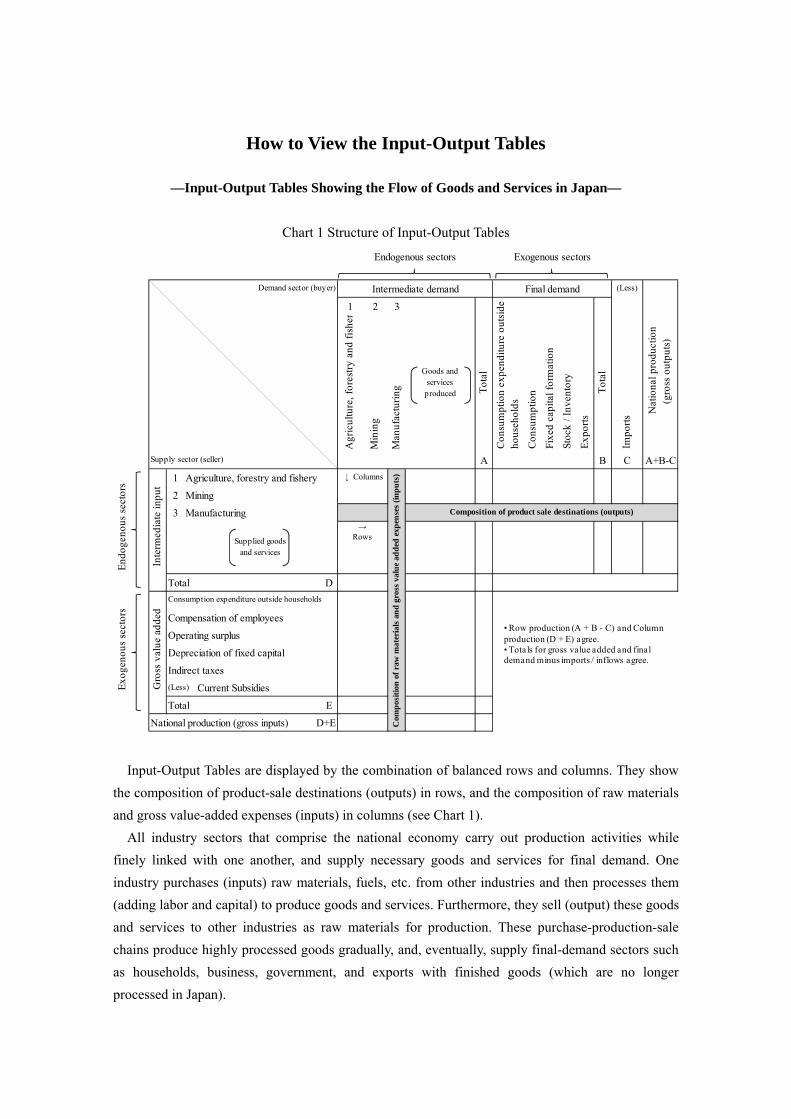
Chart 1 Structure of Input-Output Tables
Input-Output Tables are displayed by the combination of balanced rows and columns. They show
the composition of product-sale destinations (outputs) in rows, and the composition of raw materials
and gross value-added expenses (inputs) in columns (see Chart 1).
All industry sectors that comprise the national economy carry out production activities while
finely linked with one another, and supply necessary goods and services for final demand. One
industry purchases (inputs) raw materials, fuels, etc. from other industries and then processes them
(adding labor and capital) to produce goods and services. Furthermore, they sell (output) these goods
and services to other industries as raw materials for production. These purchase-production-sale
chains produce highly processed goods gradually, and, eventually, supply final-demand sectors such
as households, business, government, and exports with finished goods (which are no longer
processed in Japan).
Demand sector (buyer) (Less)
1 2 3
Agr
icul
ture
, for
estr
y an
d fi
sher
Min
ing
Man
ufac
turi
ng
Goods andservices
produced Tot
al
Tot
al
Supply sector (seller) A B C A+B-C
1
2 Mining
3 Manufacturing
Total D
Compensation of employees
Operating surplus
Depreciation of fixed capital
Indirect taxes
(Less) Current Subsidies
Total E
National production (gross inputs) D+E
End
ogen
ous
sect
ors
Exo
geno
us s
ecto
rs
→Rows
Gro
ss v
alue
add
ed
Endogenous sectors Exogenous sectors
Supplied goodsand services
Agriculture, forestry and fishery
Consumption expenditure outside households
↓ Columns
Composition of product sale destinations (outputs)
Com
pos
itio
n o
f ra
w m
ater
ials
an
d g
ross
val
ue
add
ed e
xpen
ses
(in
pu
ts)
Impo
rts N
atio
nal p
rodu
ctio
n(g
ross
out
puts
)
Intermediate demand Final demand
Inte
rmed
iate
inpu
t
Con
sum
ptio
n ex
pend
iture
out
side
hous
ehol
ds
Con
sum
ptio
n
Fixe
d ca
pita
l for
mat
ion
Stoc
k / I
nven
tory
Exp
orts
• Row production (A + B - C) and Column production (D + E) agree.• Totals for gross value added and final demand minus imports / inflows agree.
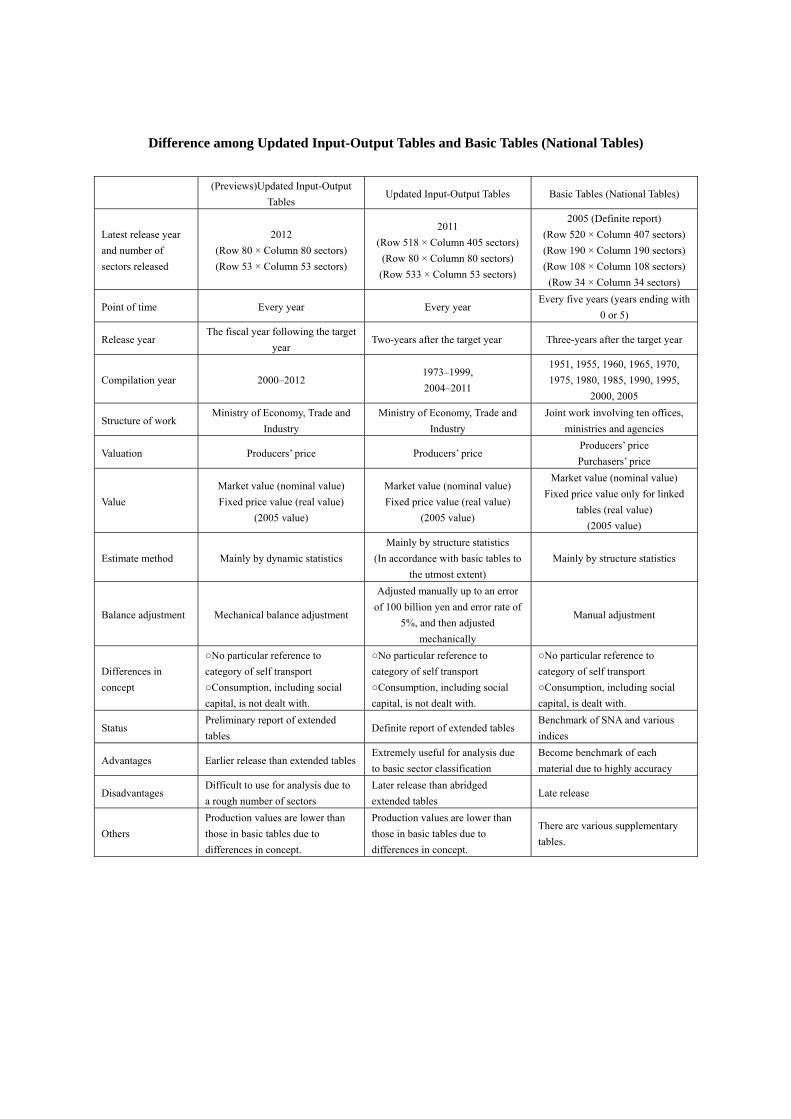
Difference among Updated Input-Output Tables and Basic Tables (National Tables)
(Previews)Updated Input-Output
Tables Updated Input-Output Tables Basic Tables (National Tables)
Latest release year
and number of
sectors released
2012
(Row 80 × Column 80 sectors)
(Row 53 × Column 53 sectors)
2011
(Row 518 × Column 405 sectors)
(Row 80 × Column 80 sectors)
(Row 533 × Column 53 sectors)
2005 (Definite report)
(Row 520 × Column 407 sectors)
(Row 190 × Column 190 sectors)
(Row 108 × Column 108 sectors)
(Row 34 × Column 34 sectors)
Point of time Every year Every year Every five years (years ending with
0 or 5)
Release year The fiscal year following the target
year Two-years after the target year Three-years after the target year
Compilation year 2000–2012 1973–1999,
2004–2011
1951, 1955, 1960, 1965, 1970,
1975, 1980, 1985, 1990, 1995,
2000, 2005
Structure of work Ministry of Economy, Trade and
Industry
Ministry of Economy, Trade and
Industry
Joint work involving ten offices,
ministries and agencies
Valuation Producers’ price Producers’ price Producers’ price
Purchasers’ price
Value
Market value (nominal value)
Fixed price value (real value)
(2005 value)
Market value (nominal value)
Fixed price value (real value)
(2005 value)
Market value (nominal value)
Fixed price value only for linked
tables (real value)
(2005 value)
Estimate method Mainly by dynamic statistics
Mainly by structure statistics
(In accordance with basic tables to
the utmost extent)
Mainly by structure statistics
Balance adjustment Mechanical balance adjustment
Adjusted manually up to an error
of 100 billion yen and error rate of
5%, and then adjusted
mechanically
Manual adjustment
Differences in
concept
○No particular reference to
category of self transport
○Consumption, including social
capital, is not dealt with.
○No particular reference to
category of self transport
○Consumption, including social
capital, is not dealt with.
○No particular reference to
category of self transport
○Consumption, including social
capital, is dealt with.
Status Preliminary report of extended
tables Definite report of extended tables
Benchmark of SNA and various
indices
Advantages Earlier release than extended tablesExtremely useful for analysis due
to basic sector classification
Become benchmark of each
material due to highly accuracy
Disadvantages Difficult to use for analysis due to
a rough number of sectors
Later release than abridged
extended tables Late release
Others
Production values are lower than
those in basic tables due to
differences in concept.
Production values are lower than
those in basic tables due to
differences in concept.
There are various supplementary
tables.