Embed Size (px)
Citation preview
Introduction
How to Use this Document
This document introduces prospective researchers to SPSS 11.5 for Windows, which currently runs under Windows 98/ME/NT/2000/XP. Those who do not own a personal copy of SPSS for Windows may access the software from various UITS Student Technology Centers at IU. Vendor-supplied documents are available for reference at the Swain Hall, Business/SPEA and Education Libraries' Reserve Collections, IUPUI University Library, and at the UITS Center for Statistical and Mathematical Computing (Stat/Math Center). You may also enroll in a UITS STEPS or PROSTEPS class by contacting the IT Training & Education. Faculty members who are interested in arranging introductory workshops for their classes in using SPSS for Windows may contact the UITS IT Training & Education Program. Contact the UITS Stat/Math Center if you are interested in leasing SPSS for Windows to install on IU owned PCs at an educational discount. Under the SPSS Enterprise License Agreement, faculty, staffs, and students can purchase an SPSS CD for use at home.
What is SPSS?
SPSS is a comprehensive and flexible statistical analysis and data management system. SPSS can take data from almost any type of file and use them to generate tabulated reports, charts, and plots of distributions and trends, descriptive statistics, and conduct complex statistical analyses. SPSS is available from several platforms; Windows, Macintosh, and the UNIX systems.
SPSS for Windows, brings the full power of the mainframe version of SPSS to the personal computer environment. It will enable you to perform many analyses on your PC that were once possible only on much larger machines. SPSS for Windows provides a user interface that makes statistical analysis more intuitive for all levels of users. Simple menus and dialog box selections make it possible to perform complex analyses without typing a single line of command syntax. The built-in SPSS Data Editor offers a simple and efficient spreadsheet-like utility for entering data and browsing the working data file. High-resolution, presentation-quality charts and plots can be created and edited. Using the SPSS Viewer, you can handle the output with greater flexibility. SPSS for Windows also reads data files from a variety of file formats including Excel, dBASE, Lotus, and SAS.
Hardware and Software Requirements
The minimum hardware and software requirements for SPSS for Windows are:
l Windows 98/ME/NT/2000/XP. l Pentium or Pentium-class processor l 32 MB minimum for Win 98/ME, 64 MB minimum for Win NT/2000/XP l 100 MB hard disk space l CD-ROM drive l SVGA (800x600 resolution) graphics card
Page 1 of 30Stat/Math - Getting Started with SPSS - Windows
Orientation
Windows in SPSS
There are a number of different types of windows that you will see in SPSS:
Data Editor window This window displays the contents of the data file. You may create new data files, or modify existing ones with the Data Editor. The Data Editor window opens automatically when you start an SPSS session.
Viewer window The Viewer window displays the statistical results, tables, and charts from the analysis you performed (e.g., descriptive statistics, correlations, plots, charts). A Viewer window opens automatically when you run a procedure that generates output. In the Viewer windows, you can edit, move, delete and copy your results in a Microsoft Explorer-like environment.
Draft Viewer window You can display output as simple text (instead of interactive pivot tables) in the Draft Viewer.
Pivot Table Editor window Output displayed in pivot tables can be modified in many ways with the Pivot Table Editor. You can edit text, swap data in rows and columns, add color, create multidimensional tables, and selectively hide and show results.
Chart Editor window You can modify and save high-resolution charts and plots in chart windows. You can change the colors, select different type fonts or sizes, switch the horizontal and vertical axes, rotate 3-D scatter plots, and even change the chart type.
Text Output Editor window Text output not displayed in pivot tables can be modified with the Text Output Editor. You can edit the output and change font characteristics (type, style, color, size).
Syntax Editor window You can paste your dialog box choices into a Syntax Editor window, where your selections appear in the form of command syntax. You can then edit the command syntax to utilize special features of SPSS not available through dialog boxes. If you are familiar with SPSS software under other operating systems (e.g., Unix), you can open up a Syntax Editor window and enter SPSS commands exactly as you did under those platforms and execute the job. You can save these commands in a file for use in subsequent SPSS sessions.
Script Editor window Scripting and OLE automation allow you to customize and automate many tasks in SPSS. Use the Script Editor to create and modify basic scripts.
If you have more than one open Viewer window, output is routed to the designated Viewer window. If you have more than one open Syntax Editor window, command syntax is pasted into the designated Syntax Editor window. (Paste feature will be explained later.) The designated windows are indicated by an exclamation point (!) in the status bar at the bottom of each SPSS window. You can change the designated window at any time by selecting it (making it active) and clicking the highlighted pushbutton on the toolbar. An active window is the currently selected window which appears in the foreground. An active window may not be a designated window until you instruct SPSS to make it a designated window (by clicking the icon on the toolbar).
Page 2 of 30Stat/Math - Getting Started with SPSS - Windows
Menus in SPSS for Windows
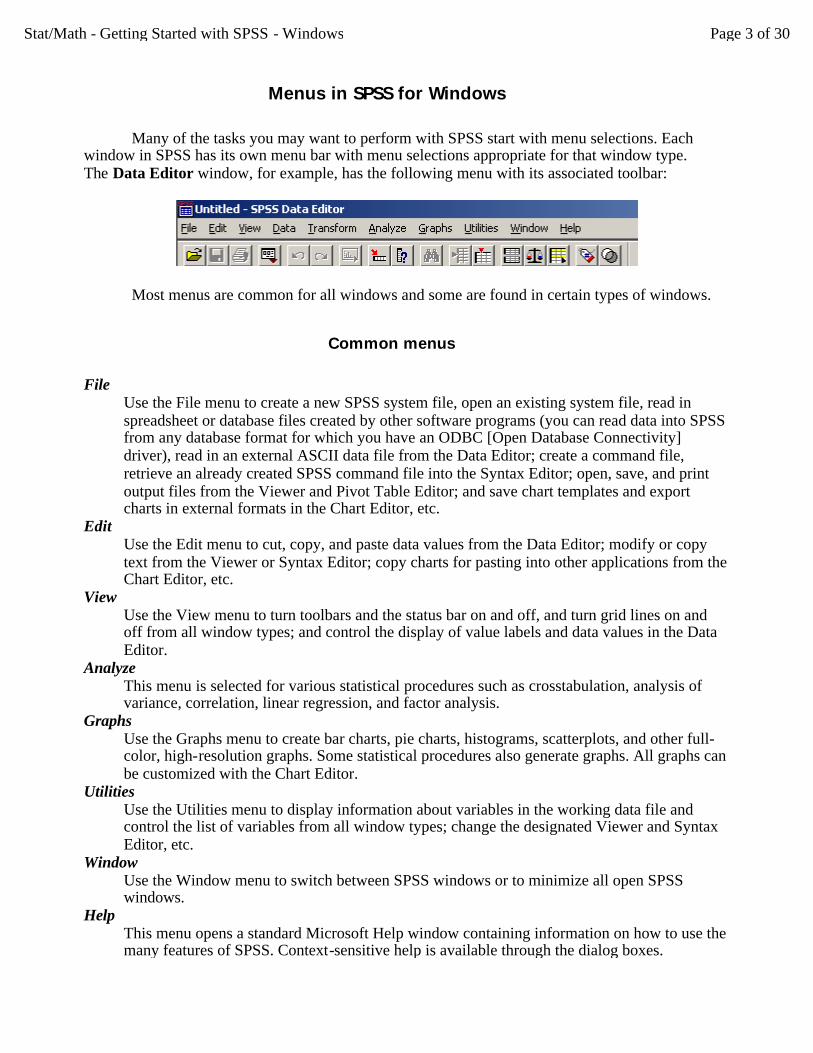
Many of the tasks you may want to perform with SPSS start with menu selections. Each window in SPSS has its own menu bar with menu selections appropriate for that window type. The Data Editor window, for example, has the following menu with its associated toolbar:
Most menus are common for all windows and some are found in certain types of windows.
Common menus
File Use the File menu to create a new SPSS system file, open an existing system file, read in spreadsheet or database files created by other software programs (you can read data into SPSS from any database format for which you have an ODBC [Open Database Connectivity] driver), read in an external ASCII data file from the Data Editor; create a command file, retrieve an already created SPSS command file into the Syntax Editor; open, save, and print output files from the Viewer and Pivot Table Editor; and save chart templates and export charts in external formats in the Chart Editor, etc.
Edit Use the Edit menu to cut, copy, and paste data values from the Data Editor; modify or copy text from the Viewer or Syntax Editor; copy charts for pasting into other applications from the Chart Editor, etc.
View Use the View menu to turn toolbars and the status bar on and off, and turn grid lines on and off from all window types; and control the display of value labels and data values in the Data Editor.
Analyze This menu is selected for various statistical procedures such as crosstabulation, analysis of variance, correlation, linear regression, and factor analysis.
Graphs Use the Graphs menu to create bar charts, pie charts, histograms, scatterplots, and other full-color, high-resolution graphs. Some statistical procedures also generate graphs. All graphs can be customized with the Chart Editor.
Utilities Use the Utilities menu to display information about variables in the working data file and control the list of variables from all window types; change the designated Viewer and Syntax Editor, etc.
Window Use the Window menu to switch between SPSS windows or to minimize all open SPSS windows.
Help This menu opens a standard Microsoft Help window containing information on how to use the many features of SPSS. Context-sensitive help is available through the dialog boxes.
Page 3 of 30Stat/Math - Getting Started with SPSS - Windows
Data Editor specific menus
Data Use the Data menu to make global changes to SPSS data files, such as transposing variables and cases, or creating subsets of cases for analysis, and merging files. These changes are only temporary and do not affect the permanent file unless you save the file with the changes.
Transform Use the Transform menu to make changes to selected variables in the data file and to compute new variables based on the values of existing ones. These changes are temporary and do not affect the permanent file unless you save the file with changes.
Draft View specific menus
Insert Use the Insert menu to change the page breaks.
Format Use the Format menu to change font characteristics, underline, and bold.
Pivot Table Editor specific menus
Insert Use the Insert menu to insert titles, captions, and footnotes; and to create table breaks.
Pivot Use the Pivot menu to perform basic pivoting tasks, to turn pivoting trays on and off, and to go to specific layers in a multidimensional pivot table.
Format Use the Format menu to modify table and cell properties; to apply and change TableLook formats; and to change font characteristics, footnote markers, and the width of data cells.
Chart Editor specific menus
Gallery Use the Galley menu to change the chart type.
Chart Use the Chart menu to modify layout and labeling characteristics of your chart.
Series Use the Series menu to select data series and categories to display or omit.
Format Use the Format menu to select fill patterns, colors, line styles, bar style, bar label styles, interpolation type, and text fonts and sizes. You can also swap axes of plots, explode one or more slices of a pie chart, change the treatment of missing values in lines, and rotate 3-D scatterplots.
Text Output Editor specific menu
Insert
Page 4 of 30Stat/Math - Getting Started with SPSS - Windows
Use the Insert menu to change the page breaks.
Syntax Editor specific menu
Run Use the Run menu to run the selected commands.
Script Editor specific menu
Debug Use the Debug menu to step through your code, executing one line or subroutine at a time and viewing the result. You can also insert a break point in tht script to pause the execution at the line that contains the break point.
Toolbars in SPSS for Windows
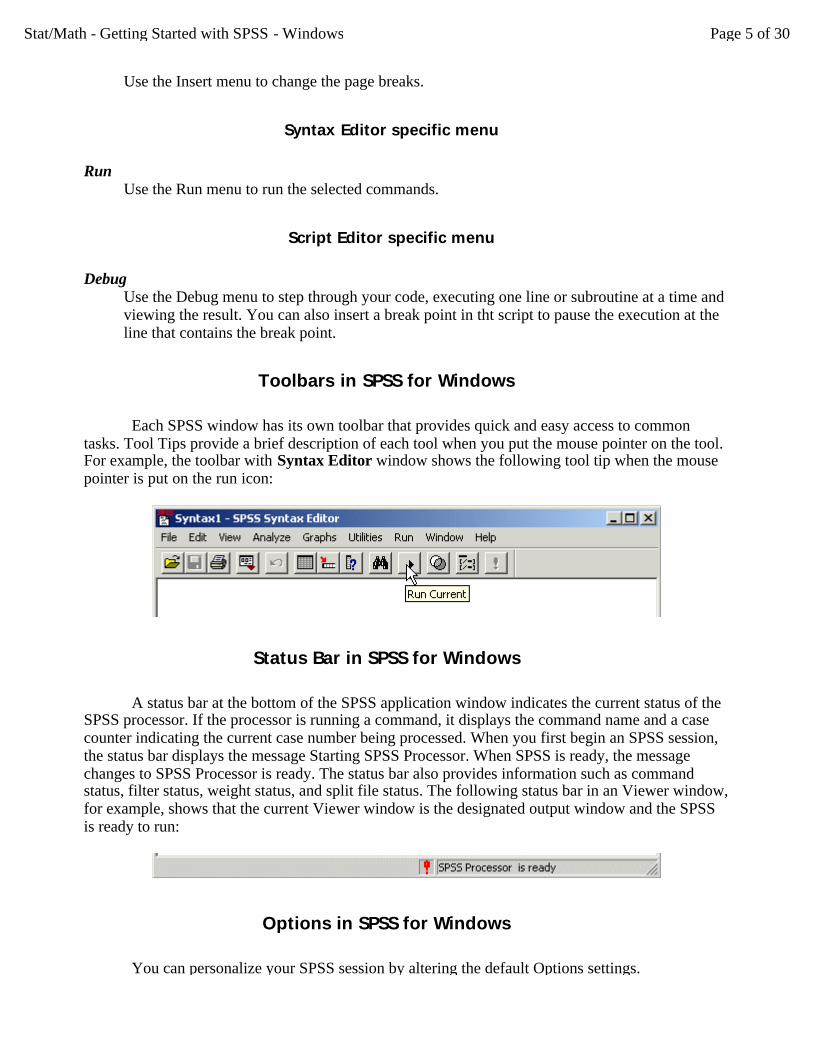
Each SPSS window has its own toolbar that provides quick and easy access to common tasks. Tool Tips provide a brief description of each tool when you put the mouse pointer on the tool. For example, the toolbar with Syntax Editor window shows the following tool tip when the mouse pointer is put on the run icon:
Status Bar in SPSS for Windows
A status bar at the bottom of the SPSS application window indicates the current status of the SPSS processor. If the processor is running a command, it displays the command name and a case counter indicating the current case number being processed. When you first begin an SPSS session, the status bar displays the message Starting SPSS Processor. When SPSS is ready, the message changes to SPSS Processor is ready. The status bar also provides information such as command status, filter status, weight status, and split file status. The following status bar in an Viewer window, for example, shows that the current Viewer window is the designated output window and the SPSS is ready to run:
Options in SPSS for Windows
You can personalize your SPSS session by altering the default Options settings.
Page 5 of 30Stat/Math - Getting Started with SPSS - Windows
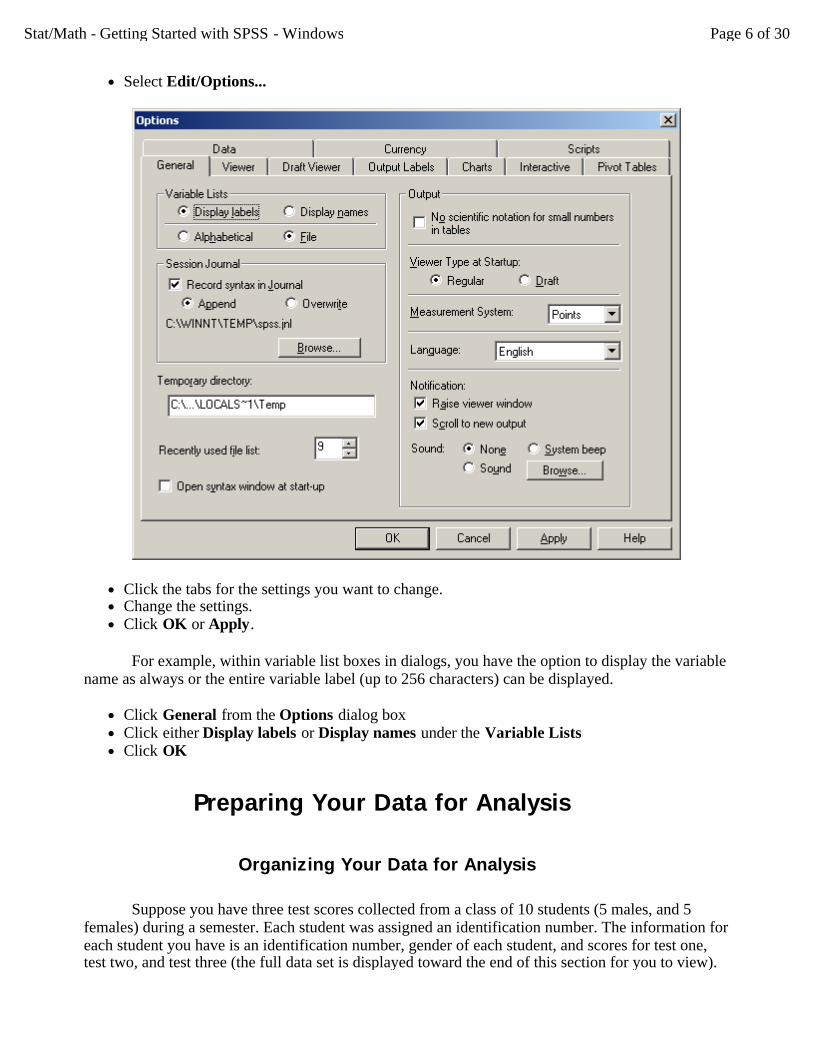
l Select Edit/Options...
l Click the tabs for the settings you want to change. l Change the settings. l Click OK or Apply.
For example, within variable list boxes in dialogs, you have the option to display the variable name as always or the entire variable label (up to 256 characters) can be displayed.
l Click General from the Options dialog box l Click either Display labels or Display names under the Variable Lists l Click OK
Preparing Your Data for Analysis
Organizing Your Data for Analysis
Suppose you have three test scores collected from a class of 10 students (5 males, and 5 females) during a semester. Each student was assigned an identification number. The information for each student you have is an identification number, gender of each student, and scores for test one, test two, and test three (the full data set is displayed toward the end of this section for you to view).
Page 6 of 30Stat/Math - Getting Started with SPSS - Windows
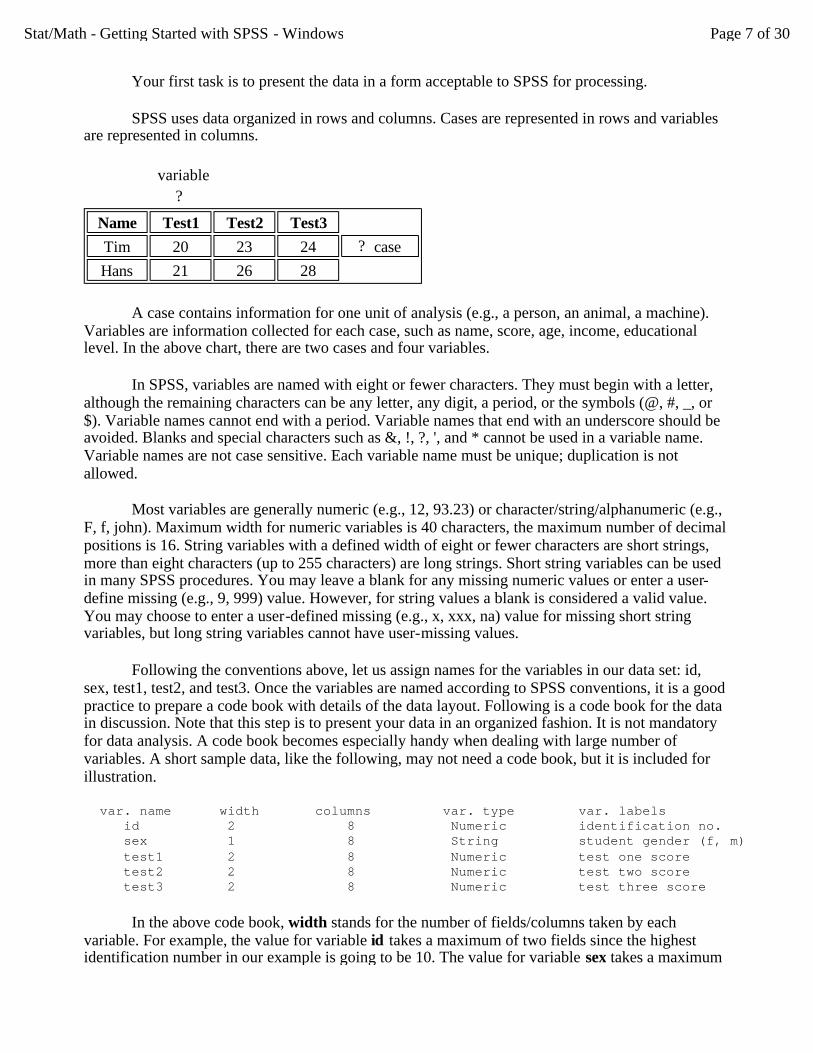
Your first task is to present the data in a form acceptable to SPSS for processing.
SPSS uses data organized in rows and columns. Cases are represented in rows and variables are represented in columns.
A case contains information for one unit of analysis (e.g., a person, an animal, a machine). Variables are information collected for each case, such as name, score, age, income, educational level. In the above chart, there are two cases and four variables.
In SPSS, variables are named with eight or fewer characters. They must begin with a letter, although the remaining characters can be any letter, any digit, a period, or the symbols (@, #, _, or $). Variable names cannot end with a period. Variable names that end with an underscore should be avoided. Blanks and special characters such as &, !, ?, ', and * cannot be used in a variable name. Variable names are not case sensitive. Each variable name must be unique; duplication is not allowed.
Most variables are generally numeric (e.g., 12, 93.23) or character/string/alphanumeric (e.g., F, f, john). Maximum width for numeric variables is 40 characters, the maximum number of decimal positions is 16. String variables with a defined width of eight or fewer characters are short strings, more than eight characters (up to 255 characters) are long strings. Short string variables can be used in many SPSS procedures. You may leave a blank for any missing numeric values or enter a user-define missing (e.g., 9, 999) value. However, for string values a blank is considered a valid value. You may choose to enter a user-defined missing (e.g., x, xxx, na) value for missing short string variables, but long string variables cannot have user-missing values.
Following the conventions above, let us assign names for the variables in our data set: id, sex, test1, test2, and test3. Once the variables are named according to SPSS conventions, it is a good practice to prepare a code book with details of the data layout. Following is a code book for the data in discussion. Note that this step is to present your data in an organized fashion. It is not mandatory for data analysis. A code book becomes especially handy when dealing with large number of variables. A short sample data, like the following, may not need a code book, but it is included for illustration.
var. name width columns var. type var. labels id 2 8 Numeric identification no. sex 1 8 String student gender (f, m) test1 2 8 Numeric test one score test2 2 8 Numeric test two score test3 2 8 Numeric test three score
In the above code book, width stands for the number of fields/columns taken by each variable. For example, the value for variable id takes a maximum of two fields since the highest identification number in our example is going to be 10. The value for variable sex takes a maximum
variable
?
Name Test1 Test2 Test3Tim 20 23 24 ? case Hans 21 26 28
Page 7 of 30Stat/Math - Getting Started with SPSS - Windows
of one field, and so on. Columns affect only the display of values in the Data Editor. Changing the column width does not change the defined width of a variable. Var. type specifies the data type (numeric, comma, dot, scientific notation, date, custom currency or string). In our example, sex is the only string variable coded as f for female, m for male.
The next issue is entering your data into the computer. There are several options. You may create a data file using one of your favorite text editors, or word processing packages (e.g., Word Perfect, MS-Word). Files created using word processing software should be saved in text format before trying to read them into an SPSS session. You may enter your data into a spreadsheet (e.g., Lotus 123, Excel, dBASE) and read it directly into SPSS for Windows. Finally, you may enter the data directly into the spreadsheet-like Data Editor of SPSS for Windows. In this document we are going to examine two of the above data entry methods: using a text editor/word processor, and using the Data Editor of SPSS for Windows.
Using an Editor/Word Processor to Enter Data
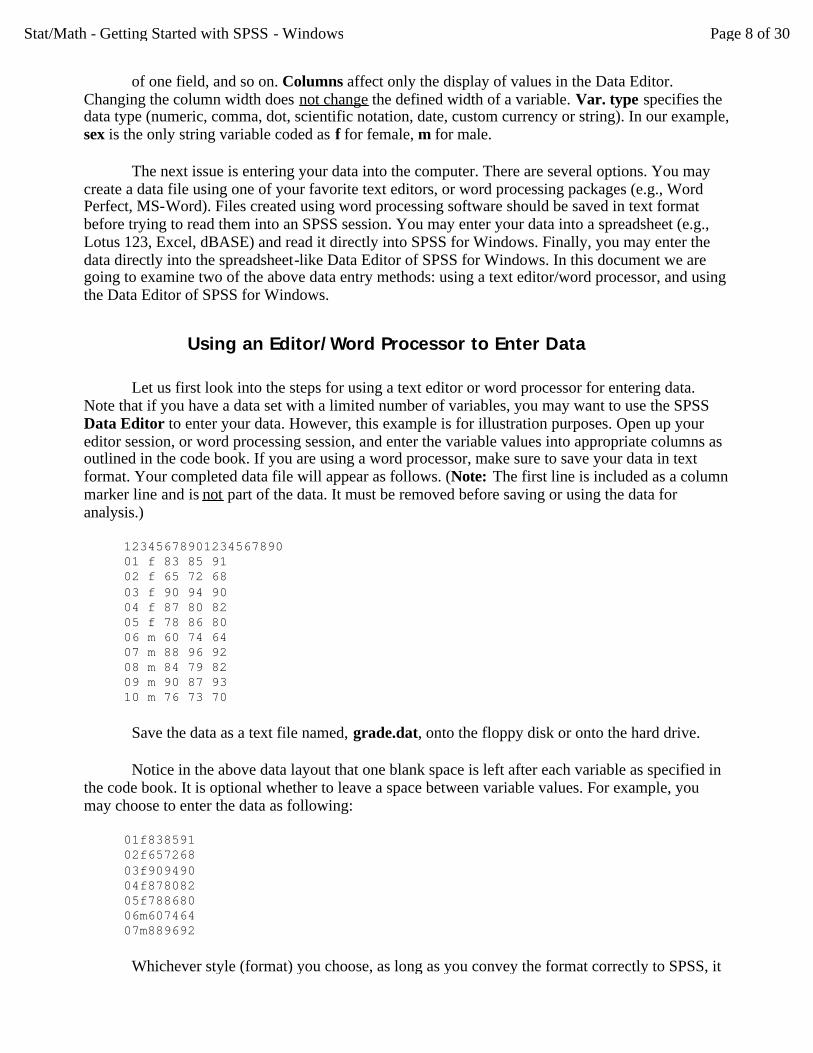
Let us first look into the steps for using a text editor or word processor for entering data. Note that if you have a data set with a limited number of variables, you may want to use the SPSS Data Editor to enter your data. However, this example is for illustration purposes. Open up your editor session, or word processing session, and enter the variable values into appropriate columns as outlined in the code book. If you are using a word processor, make sure to save your data in text format. Your completed data file will appear as follows. (Note: The first line is included as a column marker line and is not part of the data. It must be removed before saving or using the data for analysis.)
12345678901234567890 01 f 83 85 91 02 f 65 72 68 03 f 90 94 90 04 f 87 80 82 05 f 78 86 80 06 m 60 74 64 07 m 88 96 92 08 m 84 79 82 09 m 90 87 93 10 m 76 73 70
Save the data as a text file named, grade.dat, onto the floppy disk or onto the hard drive.
Notice in the above data layout that one blank space is left after each variable as specified in the code book. It is optional whether to leave a space between variable values. For example, you may choose to enter the data as following:
01f838591 02f657268 03f909490 04f878082 05f788680 06m607464 07m889692
Whichever style (format) you choose, as long as you convey the format correctly to SPSS, it
Page 8 of 30Stat/Math - Getting Started with SPSS - Windows
should not have any impact on the analysis. In the above layout, each case/observation has only one line (record) of data. In another situation you may have multiple records per observation.
Creating a Command file to read in your data
In many instances, you may have an external ASCII data file made available to you for analysis, just like the data, grade.dat, we discussed earlier. In such a situation, you do not have to enter your data again into the Data Editor. You can direct SPSS to read the file from the SPSS Syntax Editor window.
Suppose you want to read the file, grade.dat, into SPSS from a Syntax Editor window and create a system file -- as you did with the previous data (sample1.sav) by using the Data Editor. Creating a command file is a faster way to define your variables, especially if you have a large number of variables. You may create a command file using your favorite editor or word processor and then read it into a Syntax Editor window or open a Syntax Editor window and type in the command lines.
To read your already created command file into a Syntax Editor window
l Select File/Open/Syntax... l Choose the syntax file (with .sps extension) you want to read and click Open
In the following example we are opening a new Syntax Editor window to enter the following command lines.
l Select File/New/Syntax
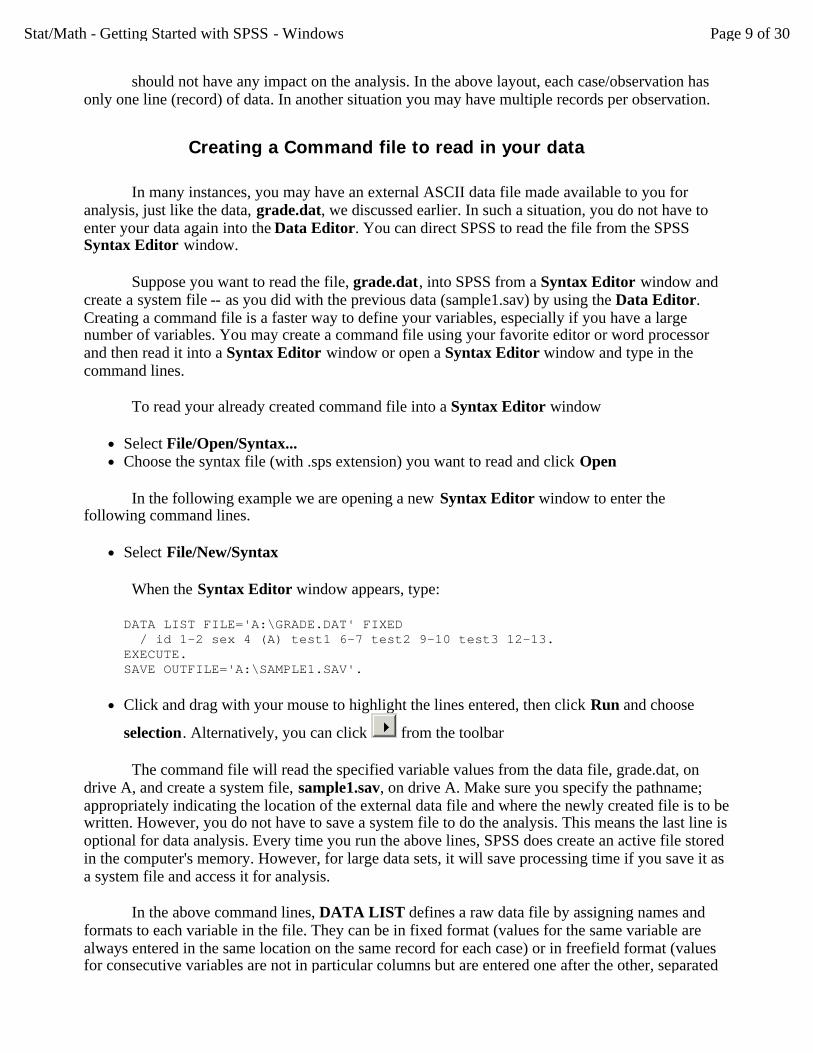
When the Syntax Editor window appears, type:
DATA LIST FILE='A:\GRADE.DAT' FIXED / id 1-2 sex 4 (A) test1 6-7 test2 9-10 test3 12-13. EXECUTE. SAVE OUTFILE='A:\SAMPLE1.SAV'.
l Click and drag with your mouse to highlight the lines entered, then click Run and choose
selection. Alternatively, you can click from the toolbar
The command file will read the specified variable values from the data file, grade.dat, on drive A, and create a system file, sample1.sav, on drive A. Make sure you specify the pathname; appropriately indicating the location of the external data file and where the newly created file is to be written. However, you do not have to save a system file to do the analysis. This means the last line is optional for data analysis. Every time you run the above lines, SPSS does create an active file stored in the computer's memory. However, for large data sets, it will save processing time if you save it as a system file and access it for analysis.
In the above command lines, DATA LIST defines a raw data file by assigning names and formats to each variable in the file. They can be in fixed format (values for the same variable are always entered in the same location on the same record for each case) or in freefield format (values for consecutive variables are not in particular columns but are entered one after the other, separated
Page 9 of 30Stat/Math - Getting Started with SPSS - Windows
by blanks or commas). In our example, we used the fixed format. FIXED is the default if no format is specified. That is, in our example we did not have to use the FIXED keyword, but it is included for the sake of illustration. The only string variable in the data is sex, which is identified with a (A) after the variable name and column location.
We do not have any numeric variables with decimal places. SPSS assumes that decimal points are explicitly coded in the data file. If there are no decimal points, the numeric variables are assumed to be integers. To indicate noninteger values for data that have not been coded with decimal points, specify the implied number of decimal places in parentheses after the variable name and column location as in gpa 16-18 (2). This means the variable gpa is in columns 16-18 and is recorded as, for example, 389, and it will be assigned 3.89 by SPSS.
Inline data
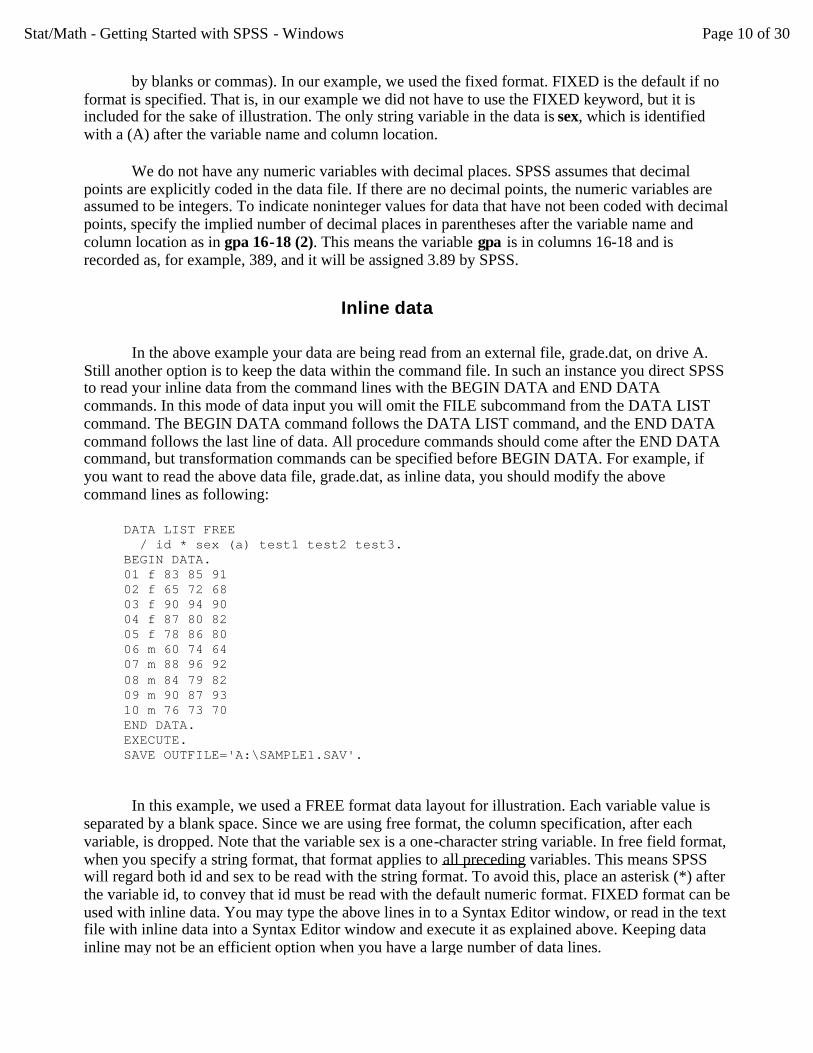
In the above example your data are being read from an external file, grade.dat, on drive A. Still another option is to keep the data within the command file. In such an instance you direct SPSS to read your inline data from the command lines with the BEGIN DATA and END DATA commands. In this mode of data input you will omit the FILE subcommand from the DATA LIST command. The BEGIN DATA command follows the DATA LIST command, and the END DATA command follows the last line of data. All procedure commands should come after the END DATA command, but transformation commands can be specified before BEGIN DATA. For example, if you want to read the above data file, grade.dat, as inline data, you should modify the above command lines as following:
DATA LIST FREE / id * sex (a) test1 test2 test3. BEGIN DATA. 01 f 83 85 91 02 f 65 72 68 03 f 90 94 90 04 f 87 80 82 05 f 78 86 80 06 m 60 74 64 07 m 88 96 92 08 m 84 79 82 09 m 90 87 93 10 m 76 73 70 END DATA. EXECUTE. SAVE OUTFILE='A:\SAMPLE1.SAV'.
In this example, we used a FREE format data layout for illustration. Each variable value is separated by a blank space. Since we are using free format, the column specification, after each variable, is dropped. Note that the variable sex is a one-character string variable. In free field format, when you specify a string format, that format applies to all preceding variables. This means SPSS will regard both id and sex to be read with the string format. To avoid this, place an asterisk (*) after the variable id, to convey that id must be read with the default numeric format. FIXED format can be used with inline data. You may type the above lines in to a Syntax Editor window, or read in the text file with inline data into a Syntax Editor window and execute it as explained above. Keeping data inline may not be an efficient option when you have a large number of data lines.
Page 10 of 30Stat/Math - Getting Started with SPSS - Windows
Using Text Import Wizard to Read Text Data
Using Text Import Wizard is another way to direct SPSS to read an external ASCII data file.
Suppose you want to read the file, grade.dat, into SPSS from Text Import Wizard.
l Select File/Read Text Data l Click Text(*.txt) for the file type from the Open File dialog box, choose the data file
grade.dat in your (A:) drive and click Open l Text Import Wizard is open, follow the Step1 to Step6 in this wizard to specify how the data
should be read.
In the following example we are opening grade.dat.
l Step 1 of 6: Check 'no' in 'Does your text file match a predefined format?' and click Next. l Step 2 of 6: Check 'fixed width' in 'How are your variables arranged?', check 'no' in 'Are
variable names included at the top of your file?' and click Next. l Step 3 of 6: Keep all default checks and click Next. l Step 4 of 6: Delete the last break line by dragging it out of the data preview area. Then click
Next. l Step 5 of 6: This step is for specifications of variables selected in the data preview. Click V1,
the column highlight. Type id in the Variable name dialog box, type numeric in the Data format dialog box. As the same way, change V2, V3, V4, V5 into sex, test1.test2, test3, respectively. Only sex is string variable. click Next.
l Step 6 of 6: Keep all default checks and click finish.
The data file is read into the SPSS. We can save the data file as SAMPLE1.SAV.
Using the SPSS Data Editor for entering data
Suppose you want to use the SPSS for Windows features for data entry. In that case, you enter data directly into the SPSS spreadsheet-like Data Editor. This is convenient if you have only a small number of variables. The first step is to enter the data into the Data Editor window by opening an SPSS for Windows session. You will define your variables, variable type (e.g., numeric, string), number of decimal places, and any other necessary attributes while you are entering the data. In this mode of data entry, you must define each variable in the Data Editor. You cannot define a group of variables (e.g., Q1 to Q10) using the Data Editor. To define a group of variables, without individually specifying them, you would use the Syntax window.
Let us start an SPSS for Windows session to enter the above data set. If you are using your own PC, start Windows and launch SPSS. If you are using a PC in a UITS Student Technology Center:
l Log on to an available workstation l Click the Start button l Click and drag Programs -> Statistics and Math -> SPSS for Windows -> SPSS 11.5 for
Windows.
Page 11 of 30Stat/Math - Getting Started with SPSS - Windows
This opens the SPSS Data Editor window (titled Untitled). The Data Editor window contains the menu bar, which you use to open files, choose statistical procedures, create graphs, etc. When you start an SPSS session, the Data Editor window always opens first.
You are ready to enter your data once the Data Editor window appears. The first step is to enter the variable names that will appear as the top row of the data file. When you start the session, the top row of the Data Editor window contains a dimmed var as the title of every column, indicating that no data are present. In our sample data set, discussed above, there are five variables named earlier as id, sex, test1, test2, and test3. Let us now enter these variable names into the Data Editor.
To define the variables, click on the Variable View tag at the lower left corner of the Data Editor window and:
l Type in the variable name, id, at the first row under the column Name. l Press the Tab key to fill-in the variable's attributes with default settings.
SPSS considers all variables as numeric variables by default. Since id is a numeric variable you do not have to redefine the variable type for id. However, you may want to change the current format for decimal places.
l Enter 0 for Decimals.
Now let us define the second variable, sex.
l Type in the variable name, sex, at the second row under the column Name. l Press the Tab key to fill-in the variable's attributes with default settings. l To modify the variable type, click on the icon in the Type column. l Select String by clicking on the circle to the left.
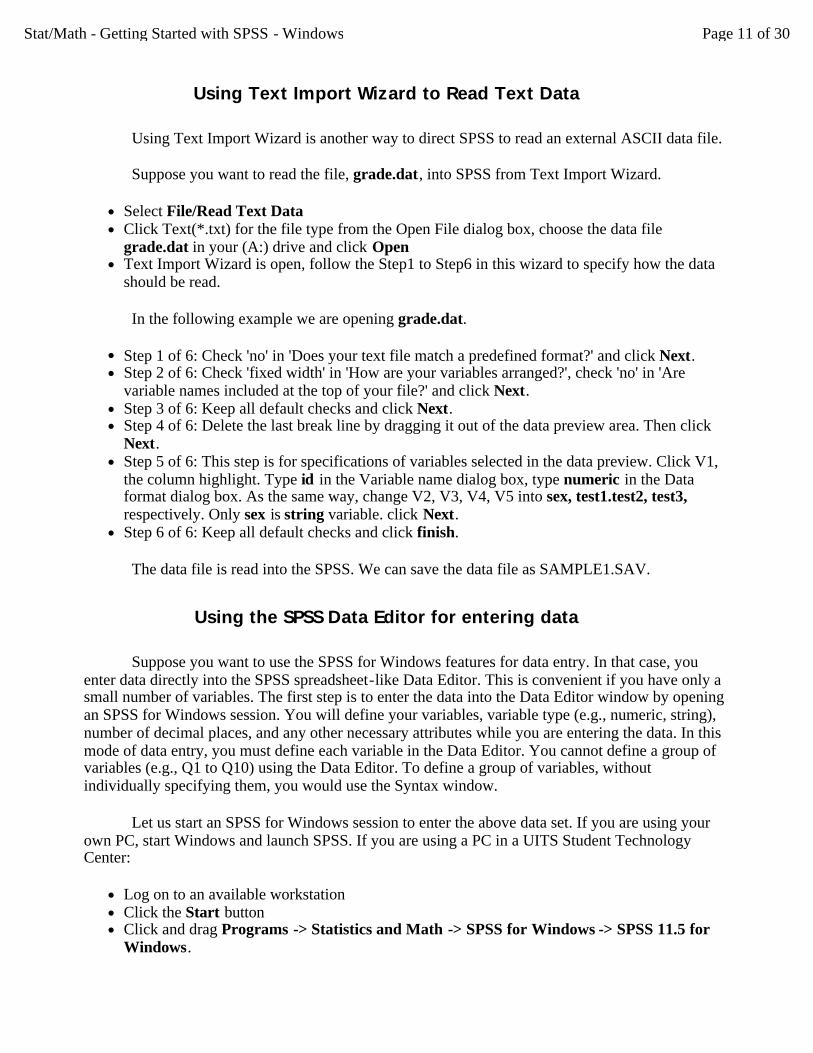
Define the remaining three numeric variables, test1, test2, and test3, the same way the variable id was defined. Once you have finished, the Variable View screen should look like:
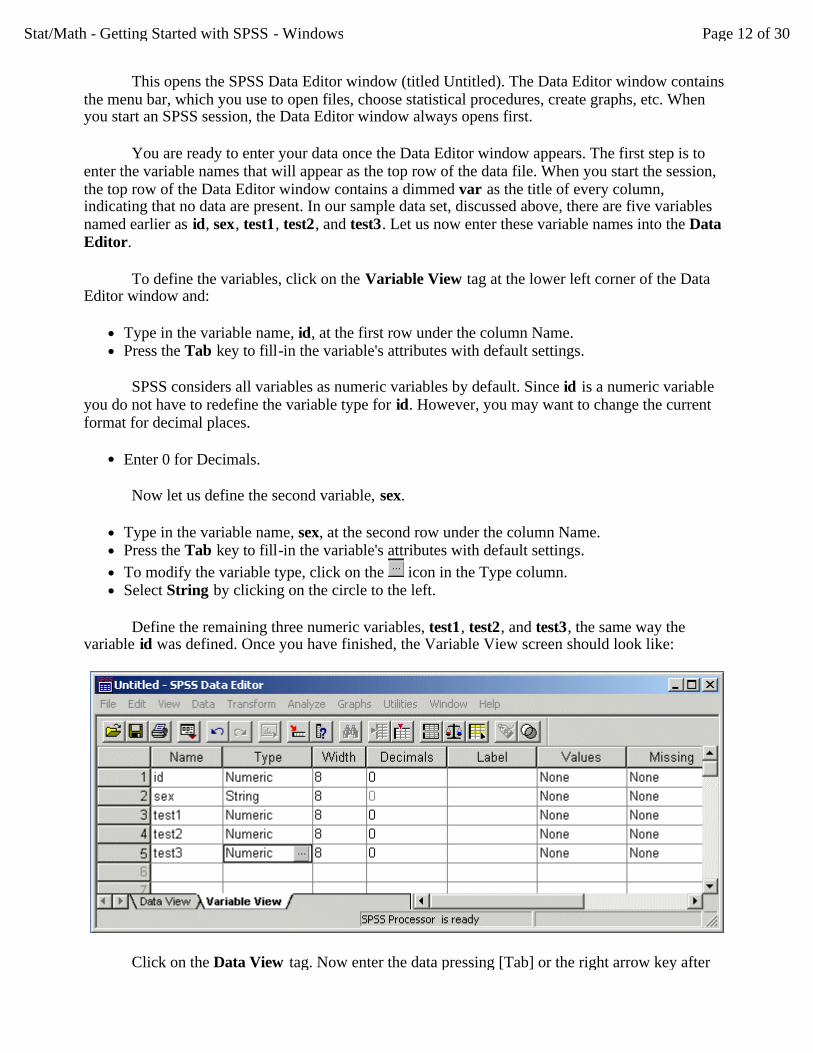
Click on the Data View tag. Now enter the data pressing [Tab] or the right arrow key after
Page 12 of 30Stat/Math - Getting Started with SPSS - Windows
each entry. After entering the last variable value for case number one use the arrow key to move the cursor to the beginning of the next line. Continue the process until all the data are entered.
Saving Your SPSS Data
After you have entered/read the data into the Data Editor, save it onto the diskette. Those who are working from personally owned computers might want to save the file to the hard disk.
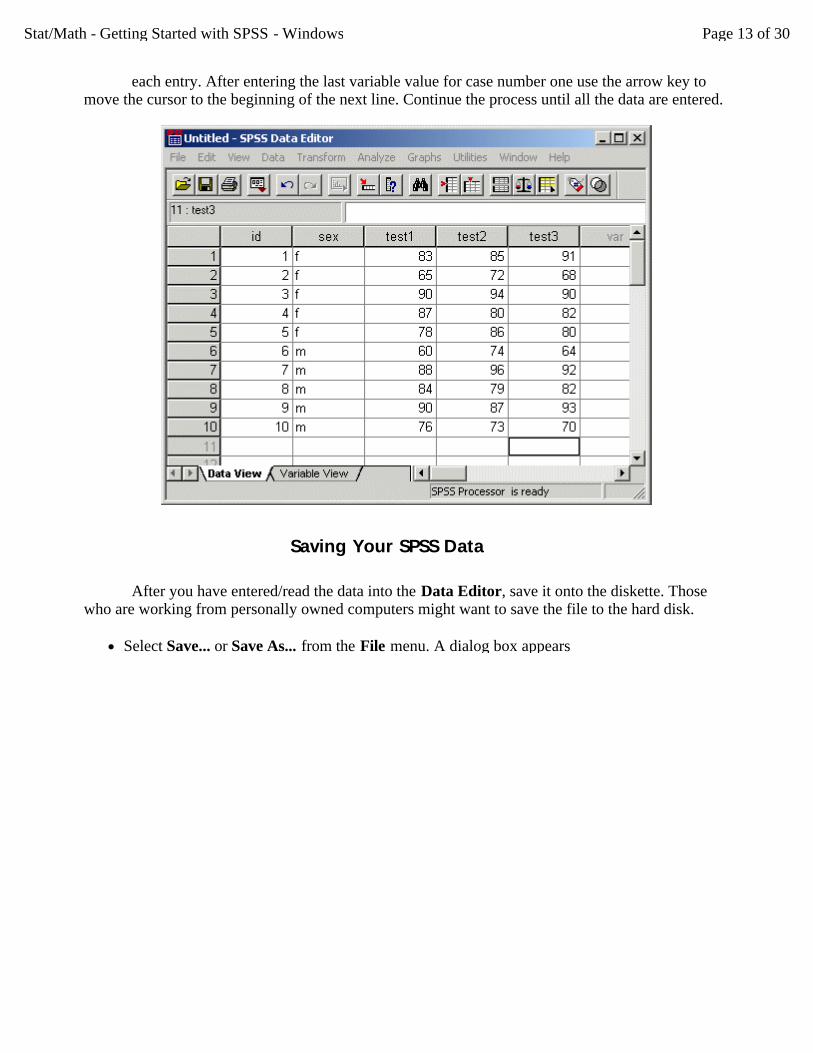
l Select Save... or Save As... from the File menu. A dialog box appears
Page 13 of 30Stat/Math - Getting Started with SPSS - Windows
l In the box below File Name type a:\sample1.sav. You can use a longer file name; for example, a:\first sample of data entry is a legitimate file name
l Click OK
The data will be saved as an SPSS format file which is readable only by SPSS for Windows. Note that the data file, grade.dat, you saved earlier and the file, sample1.sav, you saved now are in different formats.
Even after saving the data file, the data will still be displayed on your screen. If not, select sample1-SPSS Data Editor from the Window menu.
Descriptive Data Analysis
Suppose that you have the data set, sample1.sav, still displayed on your screen. If not, select SPSS Data Editor - sample1 from the Window menu.
The next step is to run some basic statistical analysis with the data you entered. The commands you use to perform statistical analysis are developed by simply pointing and clicking the mouse to appropriate menu options. This frees you from typing in your command lines.
However, you may paste the command selections you made to a Syntax Editor window. The command lines you paste to the Syntax Editor window may be edited and used for subsequent analysis, or saved for later use. Use the Paste pushbutton to paste your dialog box selections into a Syntax Editor window. If you don't have an open Syntax Editor window, one opens automatically the first time you paste from a dialog box. Click the Paste button only if you want to view the command lines you generated. Once you click the Paste pushbutton the dialog selections are pasted to the Syntax Editor window, and this window becomes active. To execute the pasted command
Page 14 of 30Stat/Math - Getting Started with SPSS - Windows
lines, highlight them and click run. You can always get back to the Data Editor window by selecting sample1-SPSS Data Editor from the Window menu.
Generating a New Variable
Before computing the descriptive statistics, we want to calculate the mean score from the three tests for each student. To compute the mean score:
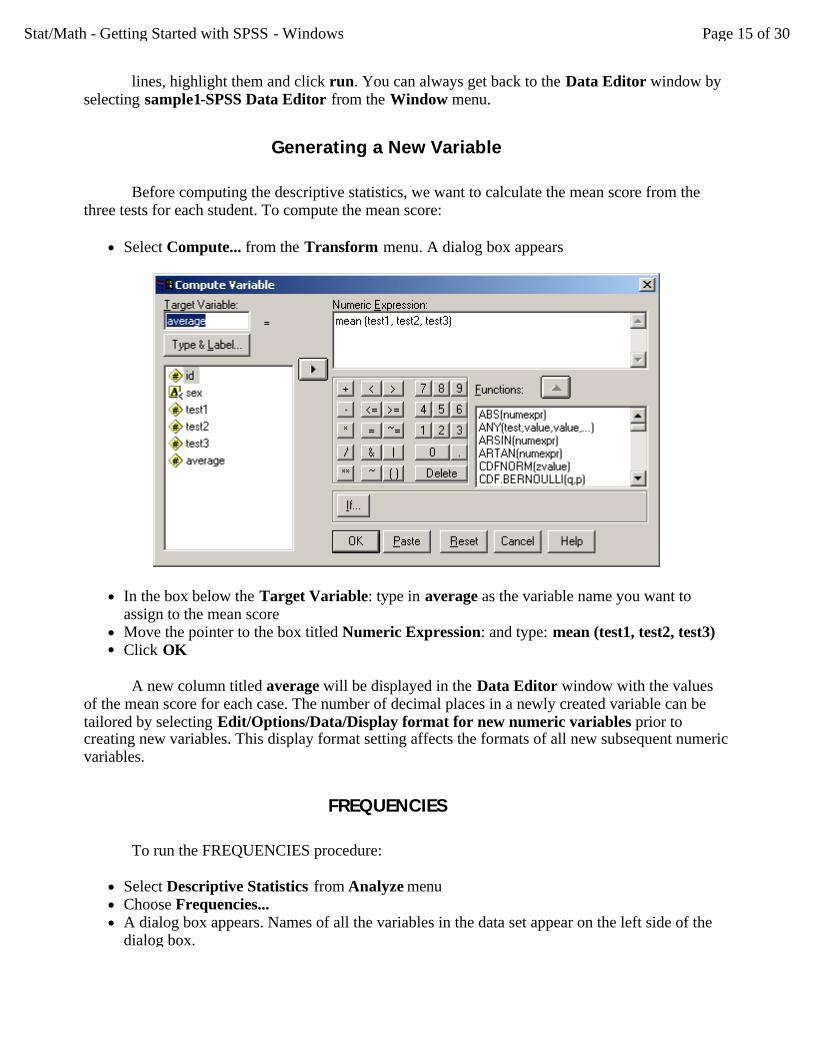
l Select Compute... from the Transform menu. A dialog box appears
l In the box below the Target Variable: type in average as the variable name you want to assign to the mean score
l Move the pointer to the box titled Numeric Expression: and type: mean (test1, test2, test3) l Click OK
A new column titled average will be displayed in the Data Editor window with the values of the mean score for each case. The number of decimal places in a newly created variable can be tailored by selecting Edit/Options/Data/Display format for new numeric variables prior to creating new variables. This display format setting affects the formats of all new subsequent numeric variables.
FREQUENCIES
To run the FREQUENCIES procedure:
l Select Descriptive Statistics from Analyze menu l Choose Frequencies... l A dialog box appears. Names of all the variables in the data set appear on the left side of the
dialog box.
Page 15 of 30Stat/Math - Getting Started with SPSS - Windows
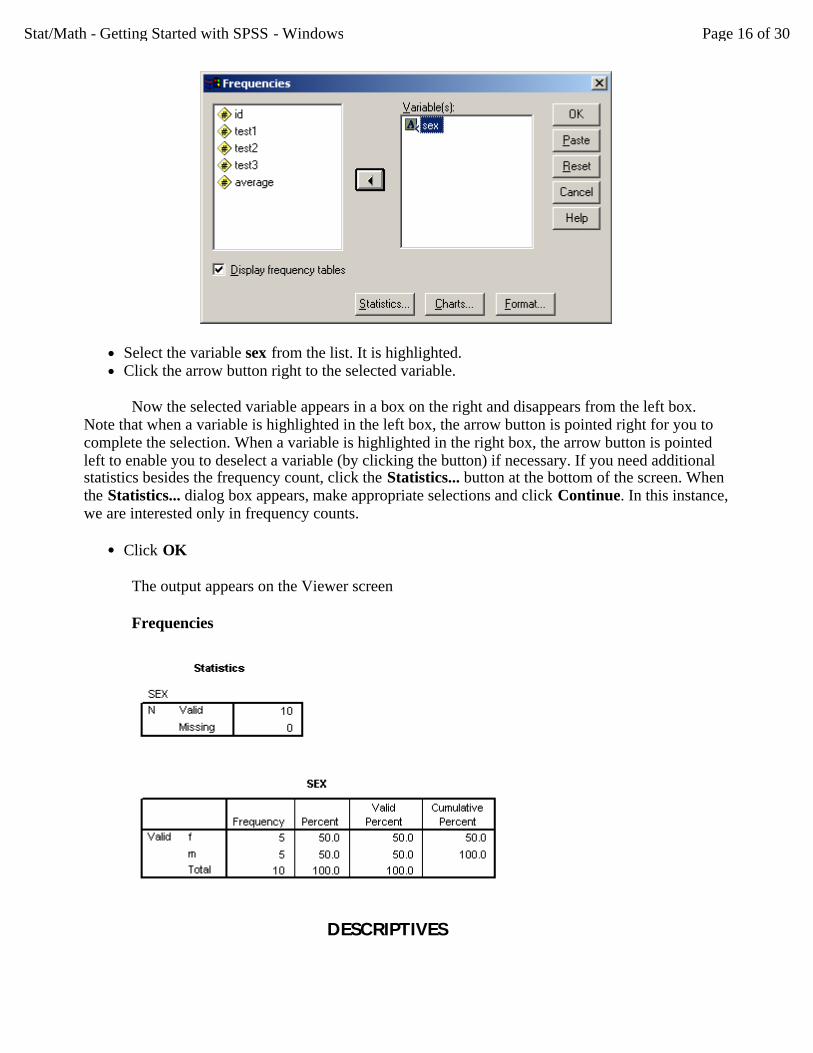
l Select the variable sex from the list. It is highlighted. l Click the arrow button right to the selected variable.
Now the selected variable appears in a box on the right and disappears from the left box. Note that when a variable is highlighted in the left box, the arrow button is pointed right for you to complete the selection. When a variable is highlighted in the right box, the arrow button is pointed left to enable you to deselect a variable (by clicking the button) if necessary. If you need additional statistics besides the frequency count, click the Statistics... button at the bottom of the screen. When the Statistics... dialog box appears, make appropriate selections and click Continue. In this instance, we are interested only in frequency counts.
l Click OK
The output appears on the Viewer screen
Frequencies
DESCRIPTIVES
Page 16 of 30Stat/Math - Getting Started with SPSS - Windows
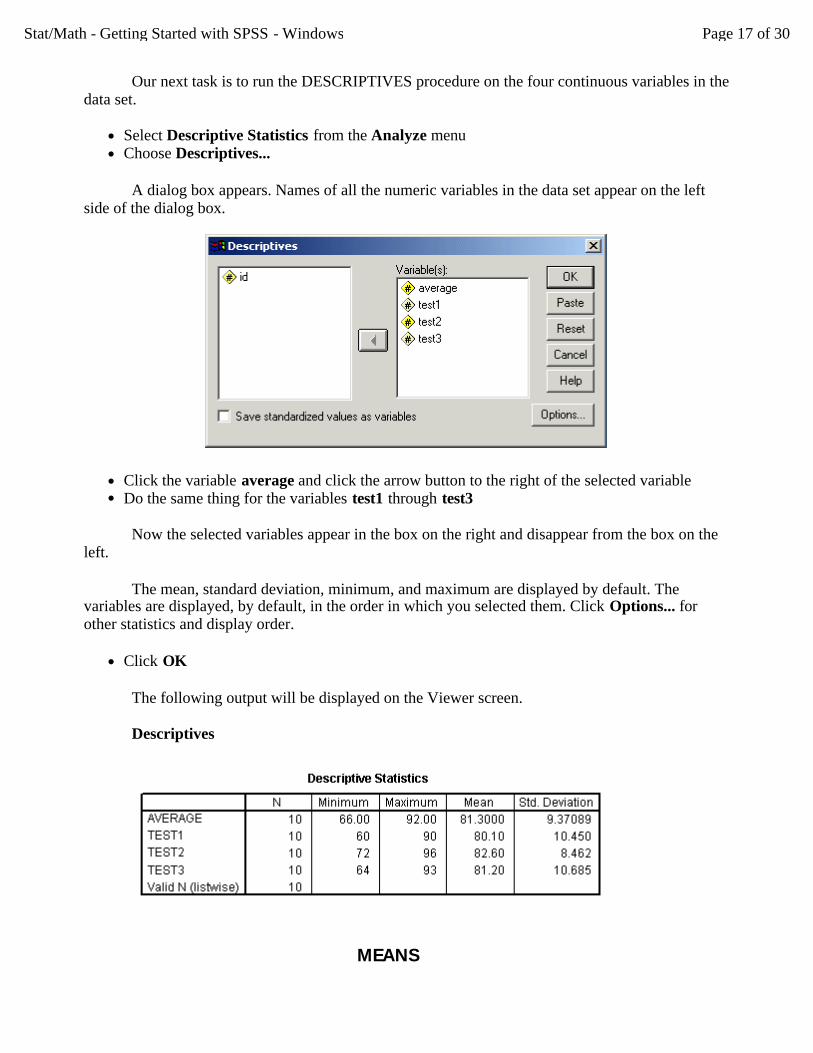
Our next task is to run the DESCRIPTIVES procedure on the four continuous variables in the data set.
l Select Descriptive Statistics from the Analyze menu l Choose Descriptives...
A dialog box appears. Names of all the numeric variables in the data set appear on the left side of the dialog box.
l Click the variable average and click the arrow button to the right of the selected variable l Do the same thing for the variables test1 through test3
Now the selected variables appear in the box on the right and disappear from the box on the left.
The mean, standard deviation, minimum, and maximum are displayed by default. The variables are displayed, by default, in the order in which you selected them. Click Options... for other statistics and display order.
l Click OK
The following output will be displayed on the Viewer screen.
Descriptives
MEANS
Page 17 of 30Stat/Math - Getting Started with SPSS - Windows
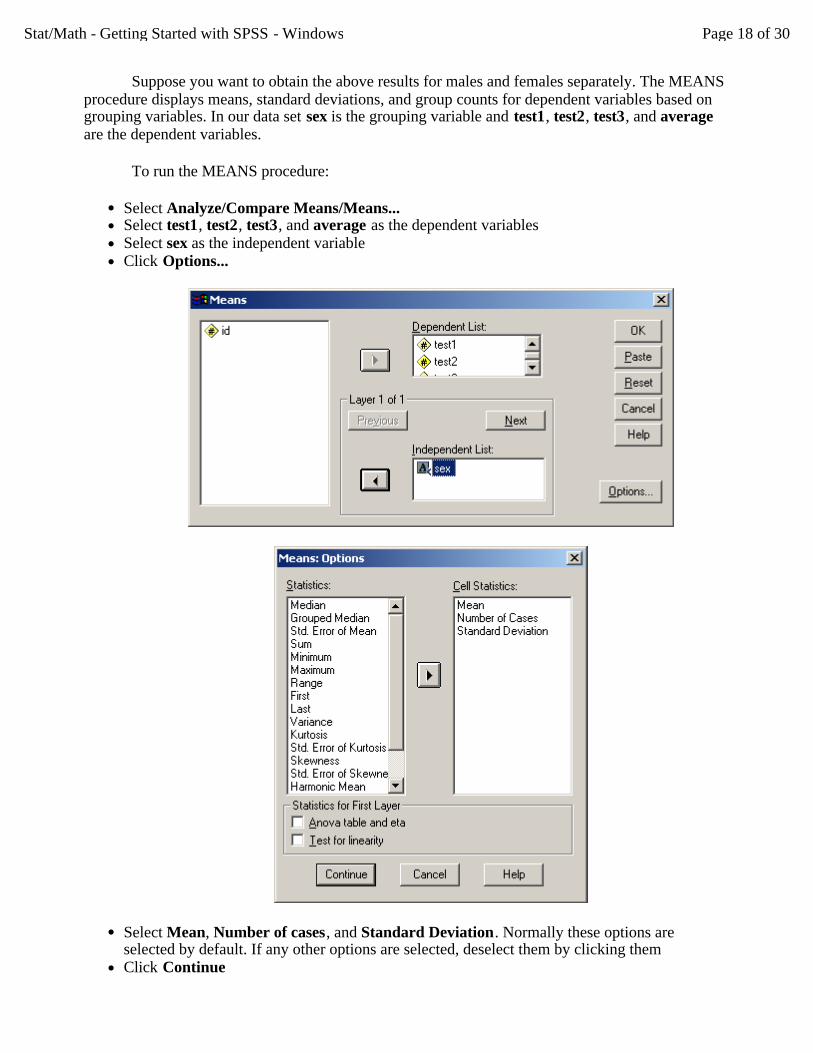
Suppose you want to obtain the above results for males and females separately. The MEANS procedure displays means, standard deviations, and group counts for dependent variables based on grouping variables. In our data set sex is the grouping variable and test1, test2, test3, and average are the dependent variables.
To run the MEANS procedure:
l Select Analyze/Compare Means/Means... l Select test1, test2, test3, and average as the dependent variables l Select sex as the independent variable l Click Options...
l Select Mean, Number of cases, and Standard Deviation. Normally these options are selected by default. If any other options are selected, deselect them by clicking them
l Click Continue
Page 18 of 30Stat/Math - Getting Started with SPSS - Windows
l Click OK
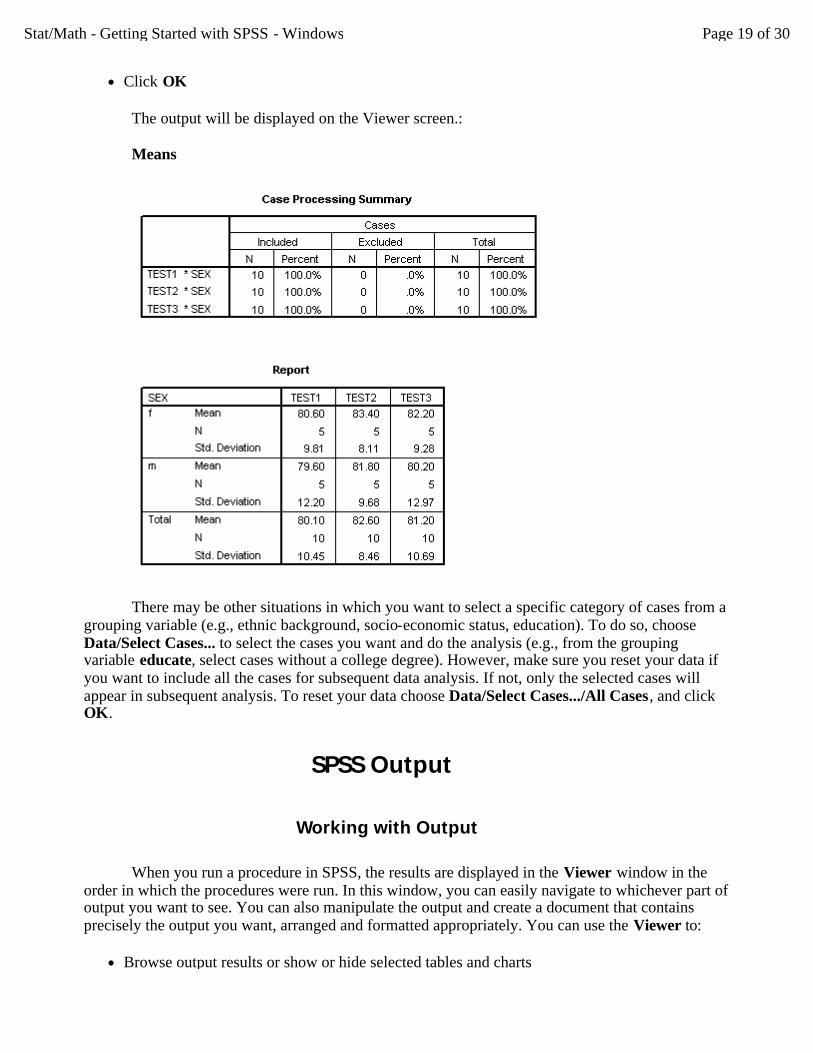
The output will be displayed on the Viewer screen.:
Means
There may be other situations in which you want to select a specific category of cases from a grouping variable (e.g., ethnic background, socio-economic status, education). To do so, choose Data/Select Cases... to select the cases you want and do the analysis (e.g., from the grouping variable educate, select cases without a college degree). However, make sure you reset your data if you want to include all the cases for subsequent data analysis. If not, only the selected cases will appear in subsequent analysis. To reset your data choose Data/Select Cases.../All Cases, and click OK.
SPSS Output
Working with Output
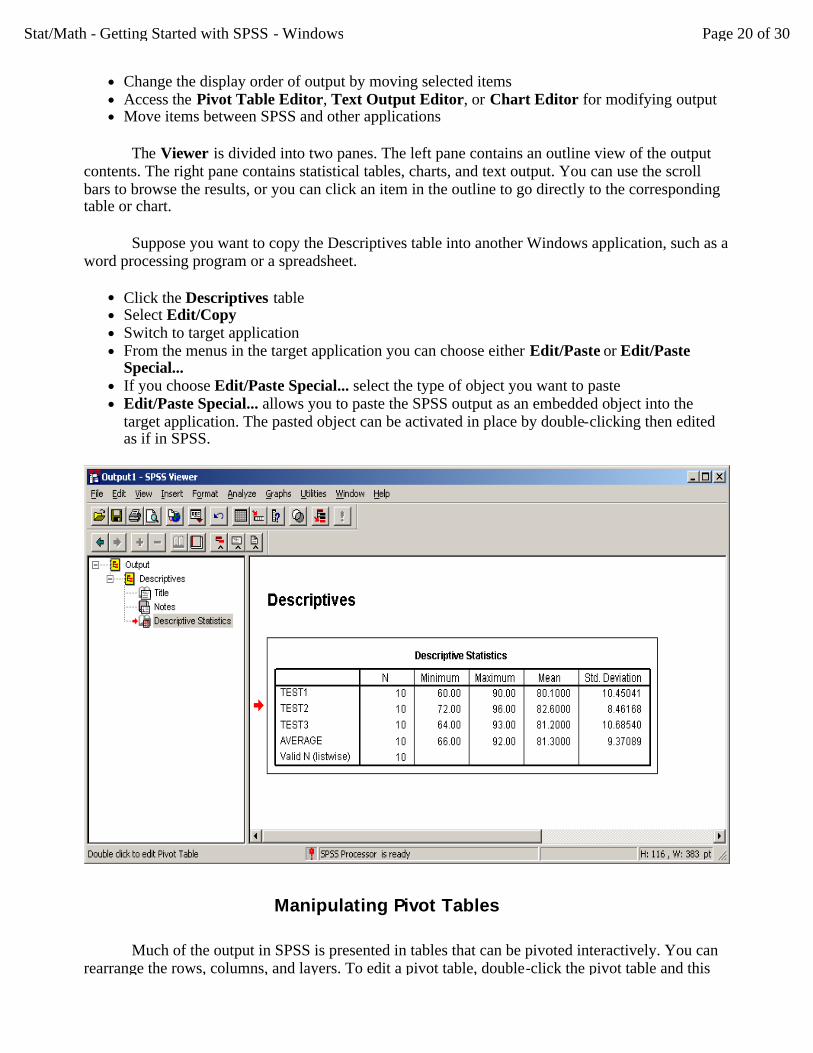
When you run a procedure in SPSS, the results are displayed in the Viewer window in the order in which the procedures were run. In this window, you can easily navigate to whichever part of output you want to see. You can also manipulate the output and create a document that contains precisely the output you want, arranged and formatted appropriately. You can use the Viewer to:
l Browse output results or show or hide selected tables and charts
Page 19 of 30Stat/Math - Getting Started with SPSS - Windows
l Change the display order of output by moving selected items l Access the Pivot Table Editor, Text Output Editor, or Chart Editor for modifying output l Move items between SPSS and other applications
The Viewer is divided into two panes. The left pane contains an outline view of the output contents. The right pane contains statistical tables, charts, and text output. You can use the scroll bars to browse the results, or you can click an item in the outline to go directly to the corresponding table or chart.
Suppose you want to copy the Descriptives table into another Windows application, such as a word processing program or a spreadsheet.
l Click the Descriptives table l Select Edit/Copy l Switch to target application l From the menus in the target application you can choose either Edit/Paste or Edit/Paste
Special... l If you choose Edit/Paste Special... select the type of object you want to paste l Edit/Paste Special... allows you to paste the SPSS output as an embedded object into the
target application. The pasted object can be activated in place by double-clicking then edited as if in SPSS.
Manipulating Pivot Tables
Much of the output in SPSS is presented in tables that can be pivoted interactively. You can rearrange the rows, columns, and layers. To edit a pivot table, double-click the pivot table and this
Page 20 of 30Stat/Math - Getting Started with SPSS - Windows
activates the Pivot Table Editor. Or click the right mouse button on the pivot table and from the context menu, choose SPSS Pivot Table Object/Open and the pivot table will be ready to edit in its own separate Pivot Table Editor window. The second feature is especially useful for viewing and editing a wide and long table that otherwise cannot be viewed at a full scale.
Further Data Analysis
So far, we've used SPSS to develop a basic idea about how SPSS for Windows works. Next step is to examine a few other data analysis techniques (CORRELATIONS, REGRESSION, T-TEST, ANOVA). All the statistical procedures available under a mini or mainframe version of SPSS are available from SPSS for Windows. Refer to the vendor documentation for the most complete information.
Sample Data Set
Now we will turn to another data set with more variables and cases. In this example, you will read an ASCII data file, clas.dat, created with a word processor and saved as a text file into the SPSS session. The data collected from 40 middle school students contains 26 variables including the following:
l id (student identification number) l sex (gender of the student) l exp (previous computer experience in months/yrs) l school (name of school system) l C1 thru C10 (10 scores on the computer anxiety scale) l M1 thru M10 (10 scores on the math anxiety scale) l mathscor (math score for the same testing period) l compscor (computer test score for a given testing period)
The first four variables (id, sex, exp, school) are background variables. The variable sex has two levels (M=male, F=female). Exp (prior computer experience) has three levels (1=less than one year, 2=1-2 years, 3=more than 2 years), school (type of school system) has three levels (1=rural, 2=suburban school, 3=urban school). The next 20 variables (C1..C10, M1..M10) are Likert type responses to computer opinion and math anxiety surveys. The remaining variables (mathscor, compscor) are scores on the math test and computer test.
A copy of the sample data file is available from the Stat/Math Web home page (http://www.indiana.edu/~statmath). To obtain a copy of the file:
l Launch a Web browser (e.g. Internet Explorer or Netscape) l Go to the URL: http://www.indiana.edu/~statmath l Select Software Title then SPSS l Select SPSS Sample Data and Commands, then clas.dat l Save this as a text file (e.g. in Netscape go to File /Save as... and change Save File as Type to
text) to a floppy disk on drive A.
Page 21 of 30Stat/Math - Getting Started with SPSS - Windows
Creating a Program to Read the Data File
Let us assume that the data file, clas.dat, is on drive A. At this point the fastest way to read this data into SPSS for Windows is using the Syntax window. You may open a Syntax Editor window (File/New/Syntax) and type in the following lines or create a command file with the following lines using a word processor or editor and then read it into the Syntax Editor window (File/Open and read it by clicking Syntax(*.sps) for the file type from the Open File dialog box). Suppose the following command lines are stored (in text format) in a file, clas.sps , on drive A.
DATA LIST FILE='a:\clas.dat' /id 1-2 sex 3 (A) exp 4 school 5 c1 to c10 6-15 m1 to m10 16-25 mathscor 26-27 compscor 28-29. MISSING VALUES mathscor compscor (99). RECODE c3 c5 c6 c10 m3 m7 m8 m9 (1=5) (2=4) (3=3) (4=2) (5=1). RECODE sex ('M'=1) ('F'=2) INTO nsex. /* char var into numeric var COMPUTE compopi=SUM (c1 TO c10). /* find sum of 10 items using sum function COMPUTE mathatti=m1+m2+m3+m4+m5+m6+m7+m8+m9+m10. /* adding each item VARIABLE LABELS id 'Student Identification' sex 'Student Gender' exp 'Yrs of Comp Experience' school 'School Representing' mathscor 'Score in Mathematics' compscor 'Score in Computer Science' compopi 'Total for Comp Survey' mathatti 'Total for Math Atti Scale'. VALUE LABELS sex 'M' 'Male' 'F' 'Female'/ exp 1 'Up to 1 yr' 2 '2 years' 3 '3 or more'/ school 1 'Rural' 2 'City' 3 'Suburban'/ c1 TO c10 1 'Strongly Disagree' 2 'Disagree' 3 'Undecided' 4 'Agree' 5 'Strongly Agree'/ m1 TO m10 1 'Strongly Disagree' 2 'Disagree' 3 'Undecided' 4 'Agree' 5 'Strongly Agree'/ nsex 1 'Male' 2 'Female'. EXECUTE.
Use the mouse to highlight the command lines and click Run. The command lines will be executed and an active SPSS file will be created. Select Window/Untitled - SPSS Data Editor to see the data file you just read in. Save the data file as an SPSS system file to drive A or to a hard drive.
l Select File/Save l Type in a filename (e.g., clas.sav) l A copy of the file will now be saved in SPSS format. Now you are ready for further data
analysis.
Correlation analysis
A correlation analysis is performed to quantify the strength of association between two numeric variables. In the following task we will perform Pearson correlation analysis. The variables used in the analysis are mathscor (Score in Mathematics), compscor (Score in Computer Science), compopi (Total for Comp Survey), and mathatti (Total for Math Atti Scale).
l Select Analyze/Correlate/Bivariate... This opens the Bivariate Correlations dialog box. The numeric variables in your data file appear on the source list on the left side of the screen.
Page 22 of 30Stat/Math - Getting Started with SPSS - Windows
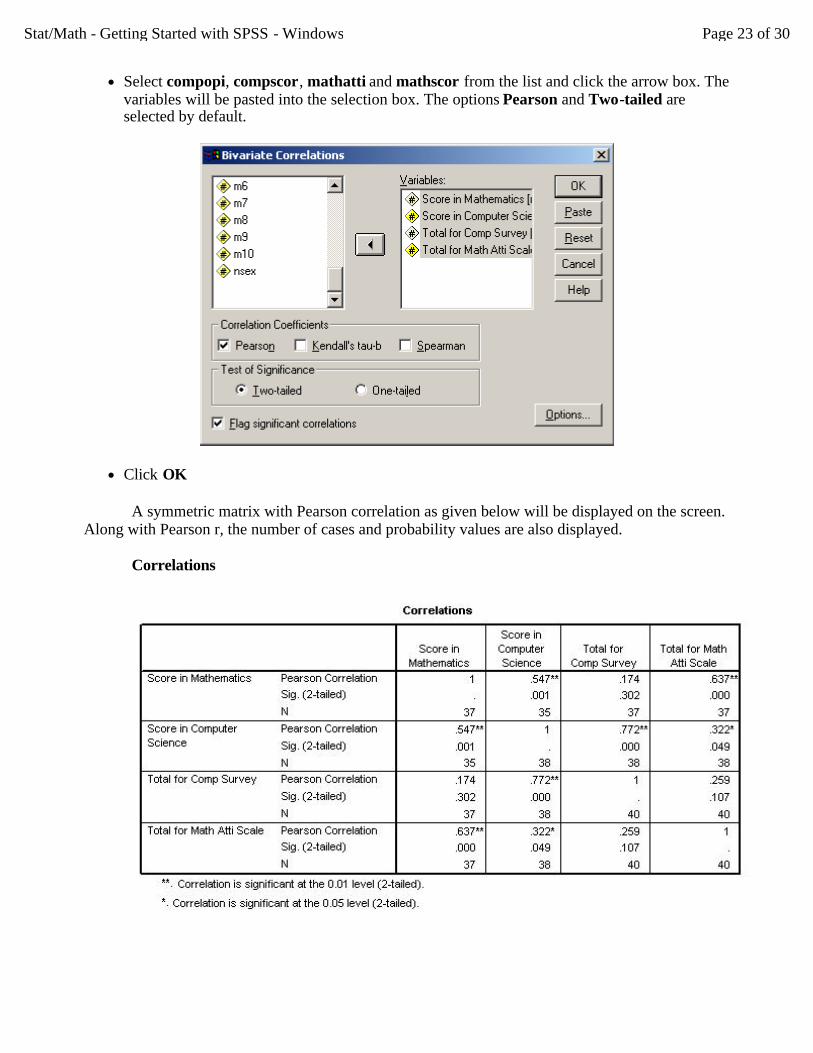
l Select compopi, compscor, mathatti and mathscor from the list and click the arrow box. The variables will be pasted into the selection box. The options Pearson and Two-tailed are selected by default.
l Click OK
A symmetric matrix with Pearson correlation as given below will be displayed on the screen. Along with Pearson r, the number of cases and probability values are also displayed.
Correlations
Page 23 of 30Stat/Math - Getting Started with SPSS - Windows
Simple Linear Regression
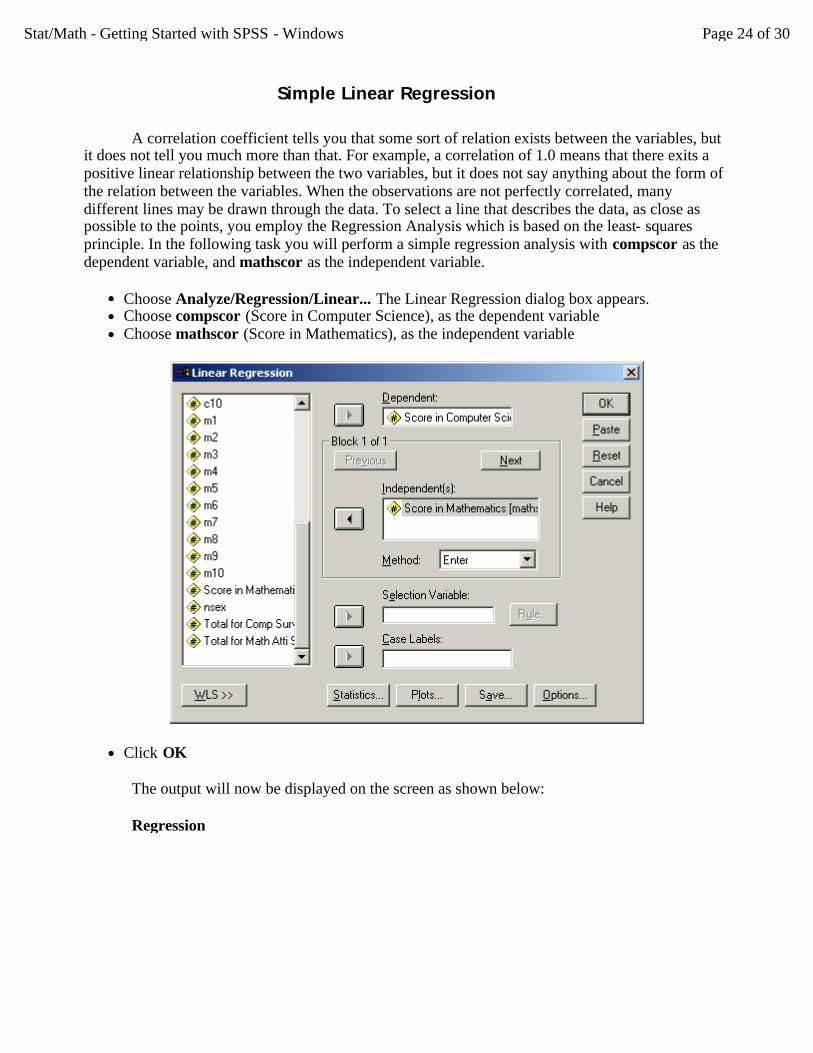
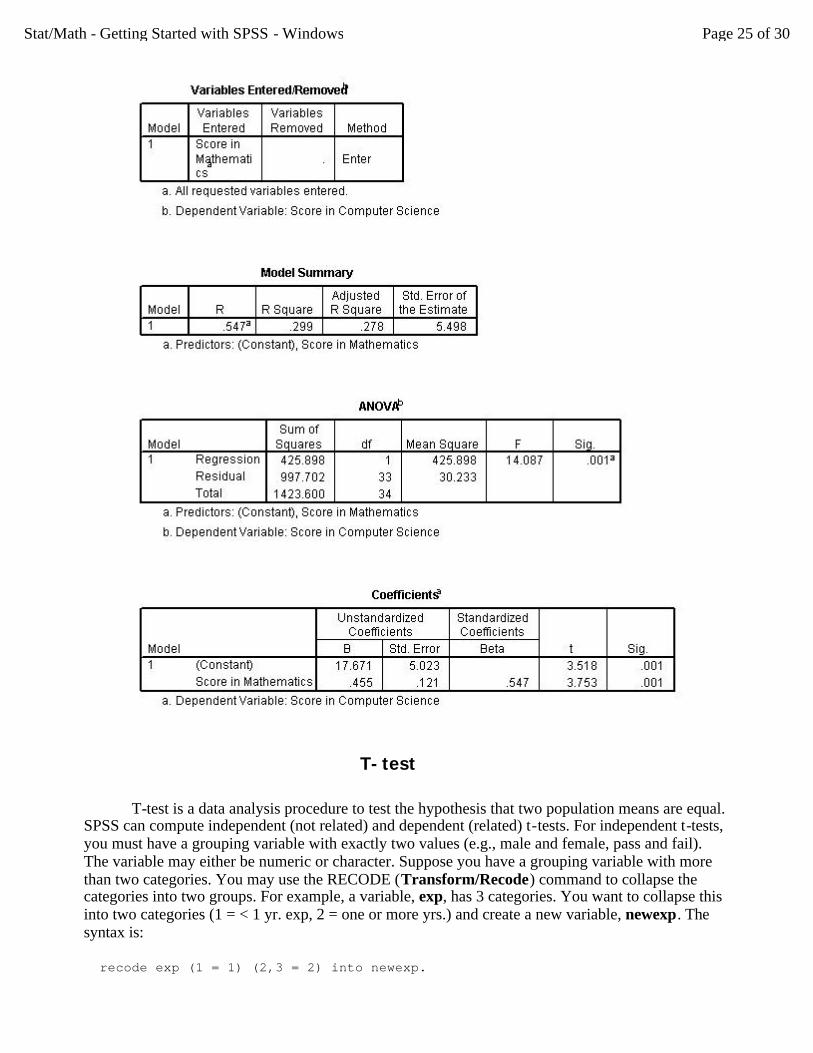
A correlation coefficient tells you that some sort of relation exists between the variables, but it does not tell you much more than that. For example, a correlation of 1.0 means that there exits a positive linear relationship between the two variables, but it does not say anything about the form of the relation between the variables. When the observations are not perfectly correlated, many different lines may be drawn through the data. To select a line that describes the data, as close as possible to the points, you employ the Regression Analysis which is based on the least- squares principle. In the following task you will perform a simple regression analysis with compscor as the dependent variable, and mathscor as the independent variable.
l Choose Analyze/Regression/Linear... The Linear Regression dialog box appears. l Choose compscor (Score in Computer Science), as the dependent variable l Choose mathscor (Score in Mathematics), as the independent variable
l Click OK
The output will now be displayed on the screen as shown below:
Regression
Page 24 of 30Stat/Math - Getting Started with SPSS - Windows
T-test
T-test is a data analysis procedure to test the hypothesis that two population means are equal. SPSS can compute independent (not related) and dependent (related) t-tests. For independent t-tests, you must have a grouping variable with exactly two values (e.g., male and female, pass and fail). The variable may either be numeric or character. Suppose you have a grouping variable with more than two categories. You may use the RECODE (Transform/Recode) command to collapse the categories into two groups. For example, a variable, exp, has 3 categories. You want to collapse this into two categories (1 = < 1 yr. exp, 2 = one or more yrs.) and create a new variable, newexp. The syntax is:
recode exp (1 = 1) (2,3 = 2) into newexp.
Page 25 of 30Stat/Math - Getting Started with SPSS - Windows
execute.
RECODE is a powerful SPSS command for data transformation with both numeric and string variables.
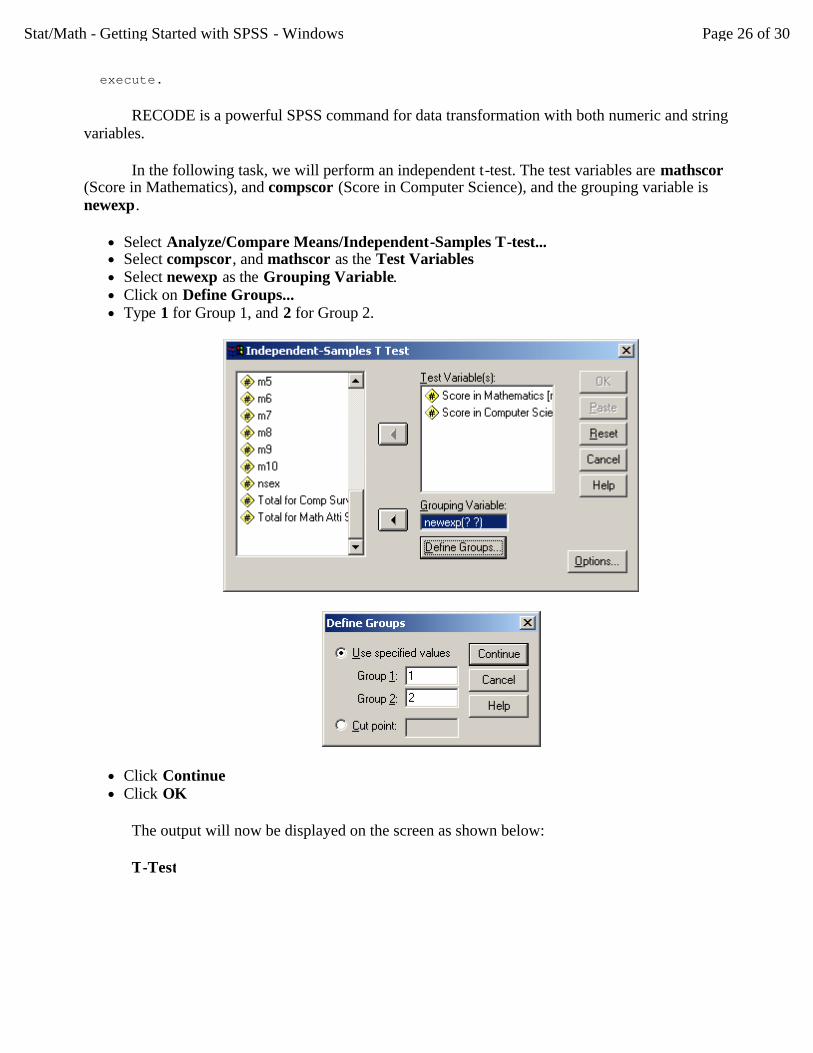
In the following task, we will perform an independent t-test. The test variables are mathscor (Score in Mathematics), and compscor (Score in Computer Science), and the grouping variable is newexp.
l Select Analyze/Compare Means/Independent-Samples T-test... l Select compscor, and mathscor as the Test Variables l Select newexp as the Grouping Variable. l Click on Define Groups... l Type 1 for Group 1, and 2 for Group 2.
l Click Continue l Click OK
The output will now be displayed on the screen as shown below:
T-Test
Page 26 of 30Stat/Math - Getting Started with SPSS - Windows
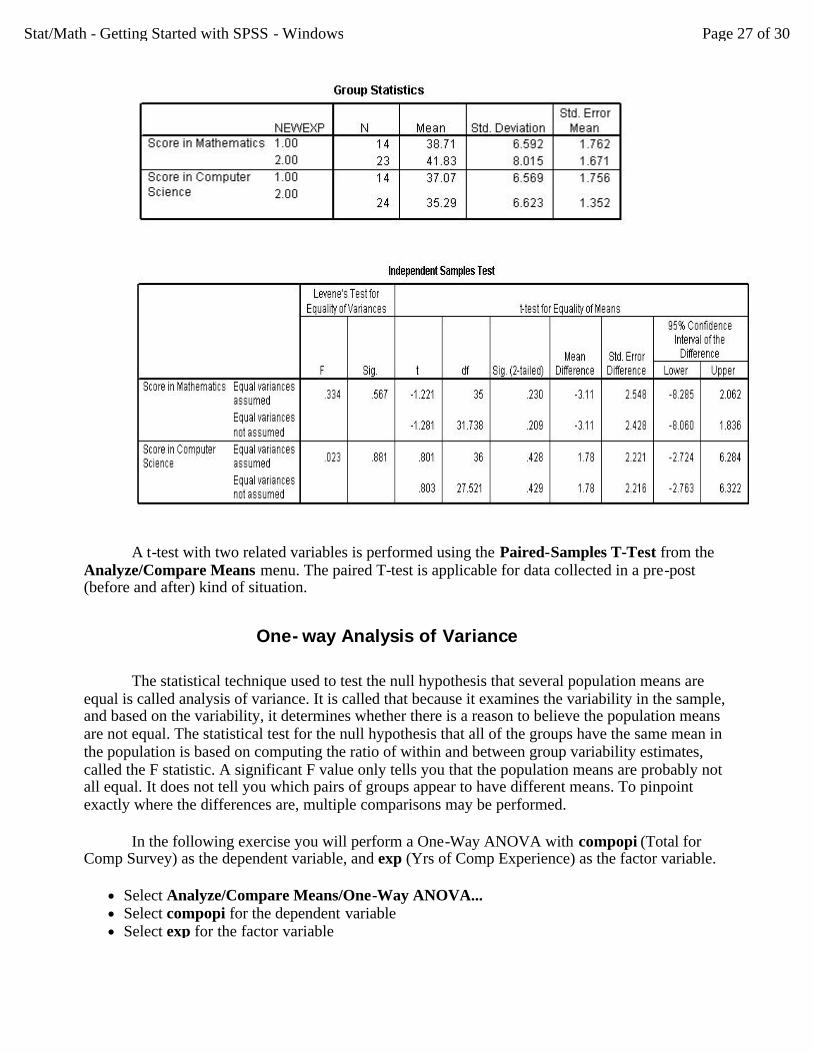
A t-test with two related variables is performed using the Paired-Samples T-Test from the Analyze/Compare Means menu. The paired T-test is applicable for data collected in a pre-post (before and after) kind of situation.
One-way Analysis of Variance
The statistical technique used to test the null hypothesis that several population means are equal is called analysis of variance. It is called that because it examines the variability in the sample, and based on the variability, it determines whether there is a reason to believe the population means are not equal. The statistical test for the null hypothesis that all of the groups have the same mean in the population is based on computing the ratio of within and between group variability estimates, called the F statistic. A significant F value only tells you that the population means are probably not all equal. It does not tell you which pairs of groups appear to have different means. To pinpoint exactly where the differences are, multiple comparisons may be performed.
In the following exercise you will perform a One-Way ANOVA with compopi (Total for Comp Survey) as the dependent variable, and exp (Yrs of Comp Experience) as the factor variable.
l Select Analyze/Compare Means/One-Way ANOVA... l Select compopi for the dependent variable l Select exp for the factor variable
Page 27 of 30Stat/Math - Getting Started with SPSS - Windows
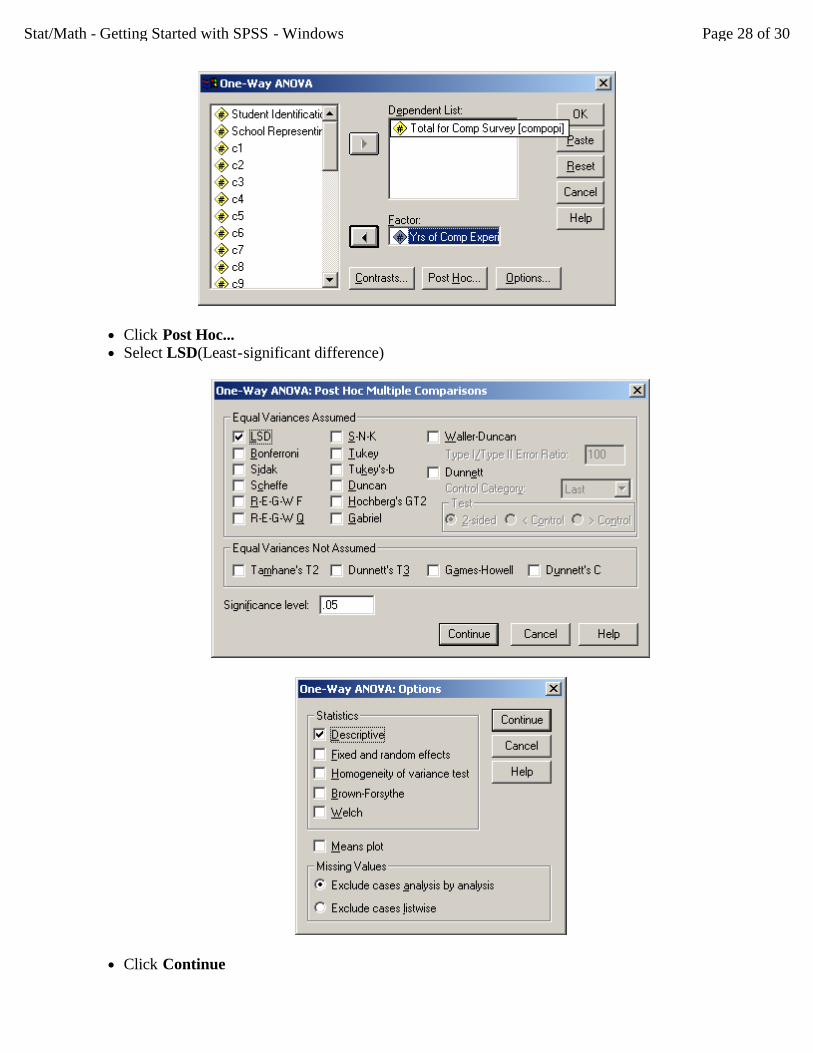
l Click Post Hoc... l Select LSD(Least-significant difference)
l Click Continue
Page 28 of 30Stat/Math - Getting Started with SPSS - Windows
l Click Options... l Select descriptive l Click Continue l Click OK
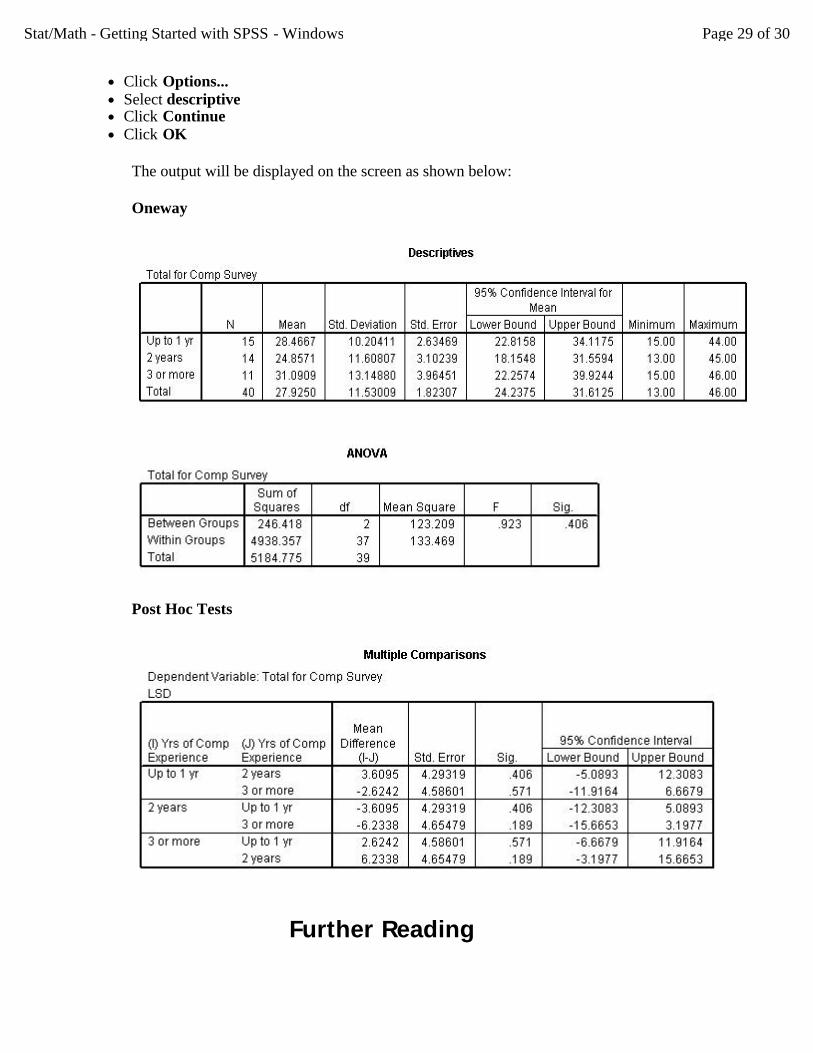
The output will be displayed on the screen as shown below:
Oneway
Post Hoc Tests
Further Reading
Page 29 of 30Stat/Math - Getting Started with SPSS - Windows
The material covered in this document illustrates some of the basic features of SPSS for Windows. Examining additional features of SPSS for Windows is beyond the scope of this document. For further help, refer to SPSS for Windows documents. If you need assistance in using SPSS for Windows contact the UITS Stat/Math Center.
The basic documents for SPSS for Windows are:
l SPSS Base 11.0 for Windows User's Guide l SPSS Base 11.0 Syntax Reference Guide l SPSS Base 11.0 Applications Guide l SPSS Advanced Models 11.0 l SPSS Regression Models 11.0 l SPSS Interactive Graphics 11.0 l SPSS Brief Guide 11.0
Documentation for other add-on modules (e.g., Tables, Trends, and Categories) are also available. All these modules are available with SPSS 11.5 from the Student Technology Centers. Documents may be purchased through any local bookstore, or directly ordered from SPSS, Inc. Those who wish to contact SPSS, Inc. directly for information on SPSS for Windows may call 800/543-2185.
Permission to use this document is granted so long as the author is acknowledged and notified. Please send comments and suggestions to: http://pytheas.ucs.indiana.edu/~statmath/contact/index.html
Copyright 1995-2003, Indiana University . Last modified: Tuesday, 05-Aug-2003 12:00:22 EST
URL /~statmath/stat/spss/win/giant.html
Page 30 of 30Stat/Math - Getting Started with SPSS - Windows