Embed Size (px)
Citation preview

To find out more visit ecompliance.comContractorCheck eCompliance Field iD
HOW TO USE LEADINGINDICATORS TO SCALEYOUR SAFETY PROGRAM
ECOMPLIANCE
and amplify your safety culture

With Alcumus eCompliance, our customers are able to properly analyze and leverage the insights from leading indicators to identify risks and trends, reducing injury rates by 60% and TRIF rates from an industry average of 3.0 to 1.3. This means organizations are 130.7% safer when using our digital safety software.
With the right leading indicators you can start taking the necessary corrective actions to prevent incidents before they happen.
A number of studies have proven that failure-focused lagging indicators don’t help companies improve their safety cultures. But action-orientated leading indicators can help provide tangible progress.
However, a large number of EHS leaders are still using lagging indicators as their KPIs. The key issue with this is that lagging indicators (i.e. incident rates) are measured after an incident has occurred.
Relying on this data is being reactive instead of proactive, and last year’s safety data is not necessarily predictive of next year’s safety performance.
HOW TO USE LEADING INDICATORS TO SCALE YOUR SAFETY PROGRAM
ecompliance.com 2

We are inspired every day by seeing how access to the right data can help safety leaders improve their safety cultures.
We help our clients by giving their front-line workers a simple digital solution, while providing management with access to real-time safety data.
This helps them improve their safety cultures, while also helping them scale their programs to the next level.
Using our digital EHS solution, we found that:
• Our customers have reduced injury rates by 60%
• 24% have achieved zero incidents sinceimplementing our software solution
• 90% have improved their overall safety records
In 2019 we introduced a standard way to track incidents so that Total Recordable Injury Frequency (TRIF) could be captured and standardized across a subsection of our customer base.
Take a look at the chart on the right to see some of the improvements we have helped customers achieve in only one year.
According to OSHA’s statistics, the average TRIF across all industries is roughly 3.0, with anything below 3 considered good. We are incredibly proud of the fact that 30% of the sample size used in this data, achieved zero TRIF with the help of our system.
THE IMPACT OF THE RIGHT DATA
2019 2020
HIGHEST TRIF 18.1 20
LOWEST TRIF 0 0
AVERAGE TRIF 3.0 1.31
AVERAGE TRIF From Top Quartile
0.08 0
AVERAGE TRIF From Bottom Quartile
9.12 7.9
% OF CUSTOMERS WITH ZERO TRIF
NA 30%
With the average TRIF at 1.31, we are happy and honored to say that organizations are 130.7% safer when using our software. This is a testament to the importance of having the right data and tools in order to elevate your safety program.
ecompliance.com 3

Our customers are also using leading indicators to deliver safer workplaces. Here are specific examples of what access to the right leading and lagging indicators can do.
SUCCESS STORIES
Client: Marek Brothers Systems
Industry: Construction
Problem: A lack of data and insights into their employees’ actions, job sites, and safety risks.
Result: Alcumus eCompliance’s real-time insights enabled Marek to make more informed decisions, while also helping them recognize their A-Safety Players and build their safety culture from within.
THE FACT THAT THERE WAS A SYSTEM OUT THERE THAT ALLOWS US TO LOOK IN THE SAME DIRECTION, TO LOOK AT THE TREND ANALYSIS, AND TO LOOK AT WHAT WAS HAPPENING IN THE FIELD, THAT WAS A GOOD FEATURE FOR US — TO BE ABLE TO MEASURE OUR PERFORMANCE IN SO MANY DIFFERENT WAYS.
Jorge VazquezDirector of SafetyMarek Brothers Systems
Client: Richcraft Homes
Industry: Construction
Problem: A paper-based system that required their team to manually input hazard inspections.
Result: Using Alcumus eCompliance, Richcraft was able to increase the number of monthly corrective actions completed by 400%.
ALCUMUS ECOMPLIANCE HAS MADE AT LEAST 30% OF MY TIME MORE EFFICIENT, FREEING UP TIME FOR MORE IMPORTANT EHS MANAGEMENT TASKS.
Aris FinnsonSafety ManagerRichcraft Homes
Client: South Country Co-op
Industry: Retail
Problem: Actionable safety information was inaccessible and trapped in filing cabinets.
Result: Alcumus eCompliance helped South Country Co-op centralize all information and optimize all processes by giving them a powerful operational and organizational tool.
I’M GETTING THE INFORMATION AND ACCESS TO IT FAR SOONER THAN I EVER WAS BEFORE, AND I HAVE SO MUCH MORE TIME ON THE OPERATIONAL END TO DO OTHER THINGS
Heather Smith-SchenkeyHSE ManagerSouth Country Co-op
Feel free to call one of our safety experts to learn more about how these customers used leading indicators to improve their safety program.
ecompliance.com 4

Perhaps the most famous example of using leading indicators to deliver safer workplaces comes from Caterpillar Inc., a global leader in construction machinery and equipment.
They saw an urgent need to improve their safety culture, with over 20,000 injuries and 63,000 lost workdays in the year 2002. They shifted their focus to utilizing leading indicators to identify areas of improvement.
The results were staggering. They were able to reduce lost-time injuries and illnesses by 85% over 10 years, while saving the company an estimated $450 million in direct and indirect injury costs.
Now that you’ve seen what the impact of the right data and leading indicators can have on an organization, let’s take a step back.
Unfortunately, too many EHS professionals today, do not:
• Have the time or resources to properly analyze it
• Know how to turn the data into corrective/preventive actions
• Know the true value of leading indicators
This whitepaper will explore the value of leading indicators, while also giving EHS leaders a framework to help them turn this data into actionable changes in their safety culture.
No two companies are alike, nor are their safety cultures; however, this document should give you a strong overview of where to begin and what can be done to strengthen your approach.
ecompliance.com 5
HOW TO FIND THE RIGHT LEADING INDICATORS FOR YOUR BUSINESS
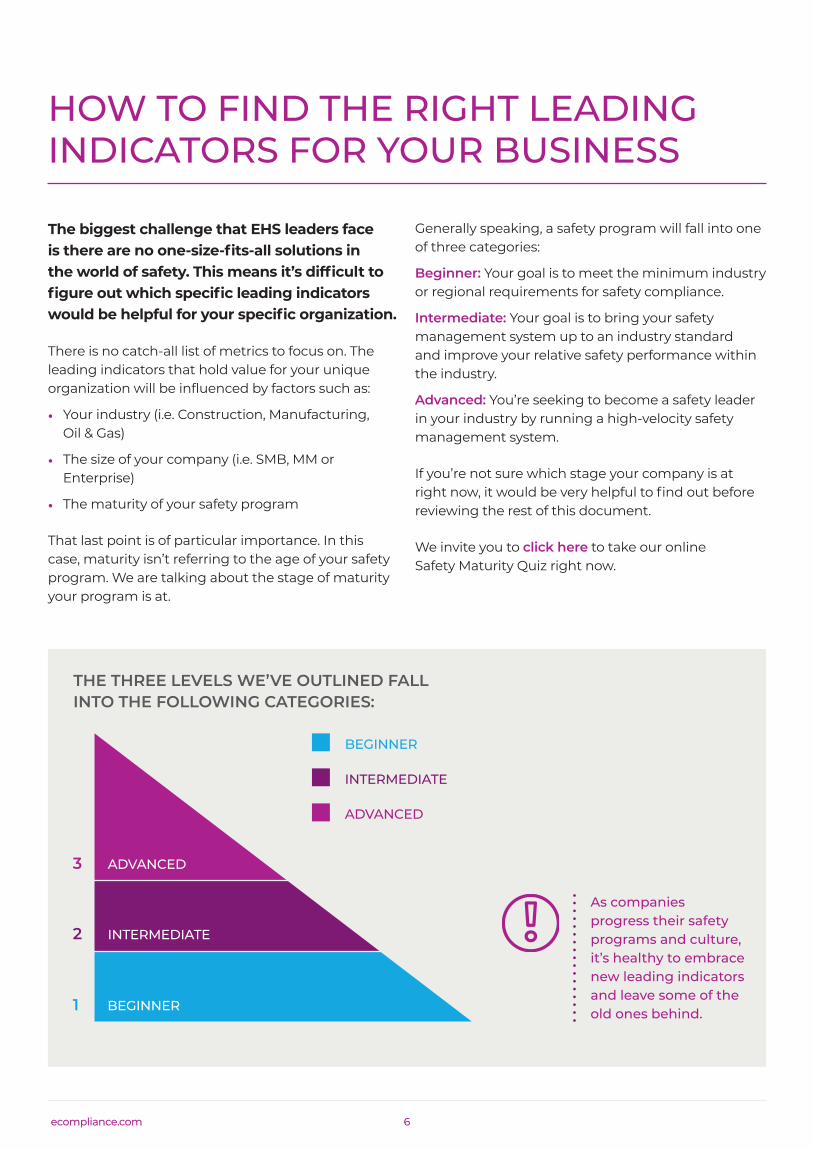
The biggest challenge that EHS leaders face is there are no one-size-fits-all solutions in the world of safety. This means it’s difficult to figure out which specific leading indicators would be helpful for your specific organization.
There is no catch-all list of metrics to focus on. The leading indicators that hold value for your unique organization will be influenced by factors such as:
• Your industry (i.e. Construction, Manufacturing,Oil & Gas)
• The size of your company (i.e. SMB, MM orEnterprise)
• The maturity of your safety program
That last point is of particular importance. In this case, maturity isn’t referring to the age of your safety program. We are talking about the stage of maturity your program is at.
Generally speaking, a safety program will fall into one of three categories:
Beginner: Your goal is to meet the minimum industry or regional requirements for safety compliance.
Intermediate: Your goal is to bring your safety management system up to an industry standard and improve your relative safety performance within the industry.
Advanced: You’re seeking to become a safety leader in your industry by running a high-velocity safety management system.
If you’re not sure which stage your company is at right now, it would be very helpful to find out before reviewing the rest of this document.
We invite you to click here to take our online Safety Maturity Quiz right now.
THE THREE LEVELS WE’VE OUTLINED FALL INTO THE FOLLOWING CATEGORIES:
ADVANCED
INTERMEDIATE
BEGINNER
3
2
1
As companies progress their safety programs and culture, it’s healthy to embrace new leading indicators and leave some of the old ones behind.
BEGINNER
INTERMEDIATE
ADVANCED
ecompliance.com 6

MATCHING YOUR LEADING INDICATORS TO YOUR SAFETY PROGRAM’S MATURITY
The 3 tables below can help you choose the leading indicators you may want to focus on, based on the level you’re currently at.
You will notice that the earlier you are in your safety journey, the fewer metrics we recommend focusing on. You can add more metrics as your safety program matures and scales.
GOALS
ADVANCED
INTERMEDIATE
BEGINNER
3
2
1
1. BEGINNERTo meet the minimum requirements for safety compliance to qualify for work within your industry / region.
LEADING INDICATOR IDEAS — PICK 2-3 TO FOCUS ON
• OHS legislation addressed by procedures i.e. level of compliance to standard
• Completed hazard assessments• Completed inspections• Employees trained• Near miss reports• Non-conformances on site / operations non-conformances with policies
or procedures• Safety meetings completed• Training hours (per employee, per site, per time frame)
#
%
ecompliance.com 7

GOALS
ADVANCED
INTERMEDIATE
BEGINNER
3
2
1
2. INTERMEDIATETo bring your safety management system up to an industry standard and improve your relative safety performance within the industry.
LEADING INDICATOR IDEAS — PICK 3-5 TO FOCUS ON
• Completed toolbox talks (planned vs actual)• Risk assessments completed per schedule / plan• Staff read acknowledgements for roles and responsibilities• Training complete across training matrix of all employees
• Corrective / preventive actions recorded• Corrective / preventve actions relative to staff count created
(or completed) per month• Near miss reports with resolved or unresolved corrective actions• People trained in hazard identification• Positive safety acknowledgements generated across the team• Proactive risk or hazard identifications recorded• Procedures re-evaluated• Risks identified by specific category (e.g. fall protection, confined space,
housekeeping, etc.)• Root cause analyses completed• Safety procedure / policy documents read across entire company• Training gaps (courses or certificates) outstanding at period end
across workforce• Training hours (per employee, per site, per time frame)• Unsafe observations recorded by trained person
#
%
ecompliance.com 8

GOALS
ADVANCED
INTERMEDIATE
BEGINNER
3
2
1
3. ADVANCEDTo become a safety leader in your industry by running a high velocity safety management system.
LEADING INDICATOR IDEAS — PICK 5-8 TO FOCUS ON
• Assessments deemed unacceptable to EHS manager (i.e. sent back for re-submission)• Assessments to evaluate potential severity• Average # of days to completion on corrective / preventive actions• Completed toolbox talks, planned vs actual• Corrective actions prioritized by risk (e.g. high severity, low severity, life-threatening, etc.)• Facilities experiencing >X % turnover• Gaps in the hazard identification process• Incidents with a root cause related to inadequate hazard assessment• Proactive safety opportunities recorded• Recognitions for safe behavior• Repeat negative findings on audits• Safety meetings attended by non-safety personnel• Safety procedure / policy documents read by non-safety personnel• Staff read acknowledgements for roles and responsibilities• Unsafe observations reported per employee per time period
#
• Participation rate for safety meetings• Ratio of unsafe to safe observations• Residual risk score change vs last period on all formal hazard assessments
%
• Corrective / preventive actions overdue vs. on schedule• Correlation rate between your top leading and top lagging indicators• Frequency of safety briefings / meetings occurring• Job / risk assessment tasks completed• Predictive measures meeting performance outcomes• Preventive and corrective actions communicated to all staff• Ratio of corrective actions according to hazard type (e.g. confined space,
fall protection, etc.)• Staff who believe safety is a priority for management
?
ecompliance.com 9

ecompliance.com 10
Once again, the specic leading indicators that can best help your safety program can vary, and they will also change over time.
We recommend following these steps:
1. Look for holes in your existing management system.
2. Analyze your lagging indicators against industry averages.
3. Experiment with leading indicators to figure out what makes sense for your company.
4. Expect to refresh your leading and lagging KPIs once you know more.
HOW DO I KNOW WHICH METRICSTO CHOOSE?

Now that you have selected your leading indicators, you will want to track them in the most effective way possible to ensure the data is accurate.
Consider these 4 steps:
STEP 1: Set Performance Levels
Set the target/desired performance levels that you will benchmark against your actual results.
Stay mindful of the relationship between these metrics and throughput. If your company’s throughput increases, the analysis of leading indicators is likely to reflect that increase..
STEP 2: Collect DataThe process will start with the actions completed by your front-line workers, and then that data will be propagated upwards to management and safety leaders.
This can be difficult if your company is using a paper-based or spreadsheet-based safety reporting system. Forms can be easily lost, and the data might be old or stale by the time your safety program reaches the next level.
The best results come from using a digital solution that empowers front-line employees to quickly carry out actions on mobile devices, while also giving supervisors and safety leaders real-time access to the data.
To find out more about the benefits of moving away from pen and paper, check out our whitepaper, How to Save Time and Achieve Digital Excellence.
STEP 3: Analyze the Data
This is also much easier with a digital solution in place.
Look for any trends, outliers, or potential hazards that need to be addressed. If you find that tracking a particular metric isn’t providing useful information, consider replacing that metric.
STEP 4: Make Proactive Changes This data is only useful if it’s actionable. We will take a deeper dive into how to turn your data into actionable items in the next section.
HOW TO EFFECTIVELY TRACK LEADING INDICATORS
ecompliance.com 11
This process revolves around examining all the data you have collected, while observing the relationship between leading and lagging indicators.
Together, they provide a 360° view of what is and is not working in your safety program.
STEP 1: Find The Baseline For Your Relevant Leading Indicators Collect front-line data to find out where your safety activities are at today, so you can accurately determine what success and failure will look like.
STEP 2: Create Real-Time Dashboards Use these dashboards to isolate the leading indicators that prove to be consistent signals of near misses, incidents, and injuries. Also, define which leading indicators are hit or miss depending on the situation.
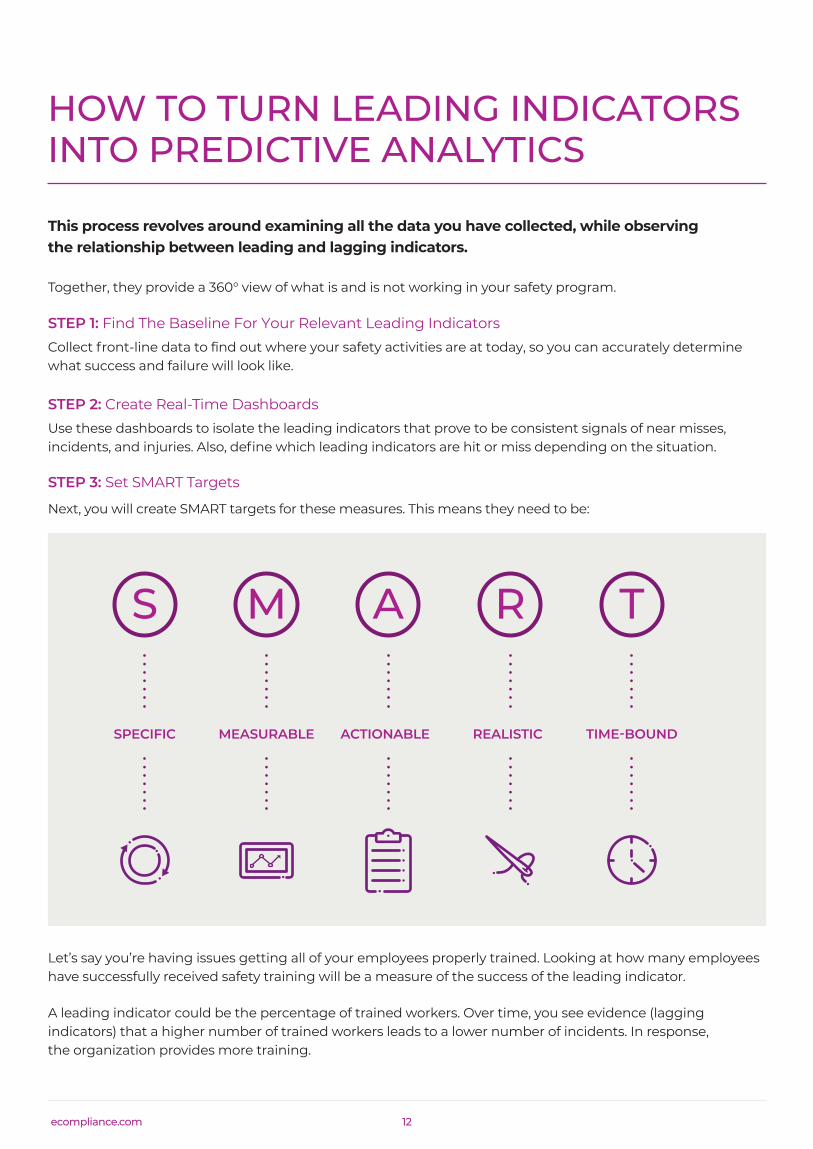
STEP 3: Set SMART Targets
Next, you will create SMART targets for these measures. This means they need to be:
HOW TO TURN LEADING INDICATORS INTO PREDICTIVE ANALYTICS
Let’s say you’re having issues getting all of your employees properly trained. Looking at how many employees have successfully received safety training will be a measure of the success of the leading indicator.
A leading indicator could be the percentage of trained workers. Over time, you see evidence (lagging indicators) that a higher number of trained workers leads to a lower number of incidents. In response, the organization provides more training.
S M A R T
SPECIFIC MEASURABLE ACTIONABLE REALISTIC TIME-BOUND
ecompliance.com 12

It’s somewhat puzzling that leading indicators are still not being broadly used by safety departments, particularly when other parts of the same organization likely use some sort of leading KPIs. For example, HR may look at metrics such as attendance and engagement levels (leading indicators) to control employee turnover rates (a lagging indicator). But unfortunately, most companies only use lagging indicators to measure their safety program.
This means they are being reactive instead of proactive, as lagging indicators only expose risks after they have resulted in an incident. Looking at leading indicators could show EHS professionals where/why future incidents are likely to occur, helping to strengthen safety programs and safety culture, ultimately saving lives.
It can be challenging to find the right mix of leading indicators to track. It may even be a bit of a trial and error process, as you will find your KPIs change as your organization grows and your safety program matures.
Once you have established your maturity level by taking our online Safety Maturity Quiz, start examining the leading indicators we have recommended above and within the quiz to start scaling your safety program and amplifying your safety culture.
Want to see what Alcumus Compliance can do to transform your workplace? Feel free to reach out to us at 1-800-686-1915, or book a demo with one of our Safety Experts by clicking here today.
CONCLUSION
ecompliance.com 13

To find out more visit ecompliance.comContractorCheck eCompliance Field iD
ECOMPLIANCE
ABOUT ALCUMUS ECOMPLIANCEAlcumus eCompliance safety software is the leader for improving worker participation in safety.
The Alcumus eCompliance mobile app connects workers with head office, creating a two-way conversation so safety leaderscan make faster, fact-based decisions, and executives gainan unrivaled view of safety risks across their company.
With a mission to protect 5 million workers from workplace incidents by 2025, Alcumus eCompliance is the fastest growing safety softwarecompany in the world with hundreds of client success stories.
Alcumus eCompliance empowers organizations to improve EHSperformance and use safety as a competitive differentiator.For more information, visit ecompliance.com
ABOUT ALCUMUSAlcumus is a leading provider of technology-led risk managementsolutions providing clients with advice, expertise and support to helpthem identify and mitigate risks, navigate compliance and keep peoplesafe. It supports clients with a wide range of risk management services,including products across Supply Chain Management, EHS Software, and Asset Inspection Systems.
Our people are at the heart of our business, building strongrelationships with our clients to understand their needs,minimize risks and navigate compliance through our in-depthknowledge of your sector, regulations and challenges.
ALC_139_04_03_21