Embed Size (px)
Citation preview
How to Use Candlestick
Patterns in Stock and Forex Markets
Candlestick patterns are one of the oldest forms of technical and price action
trading analysis.
Candlesticks are used to predict and give descriptions of price movements of a
security, derivative, or currency pair.
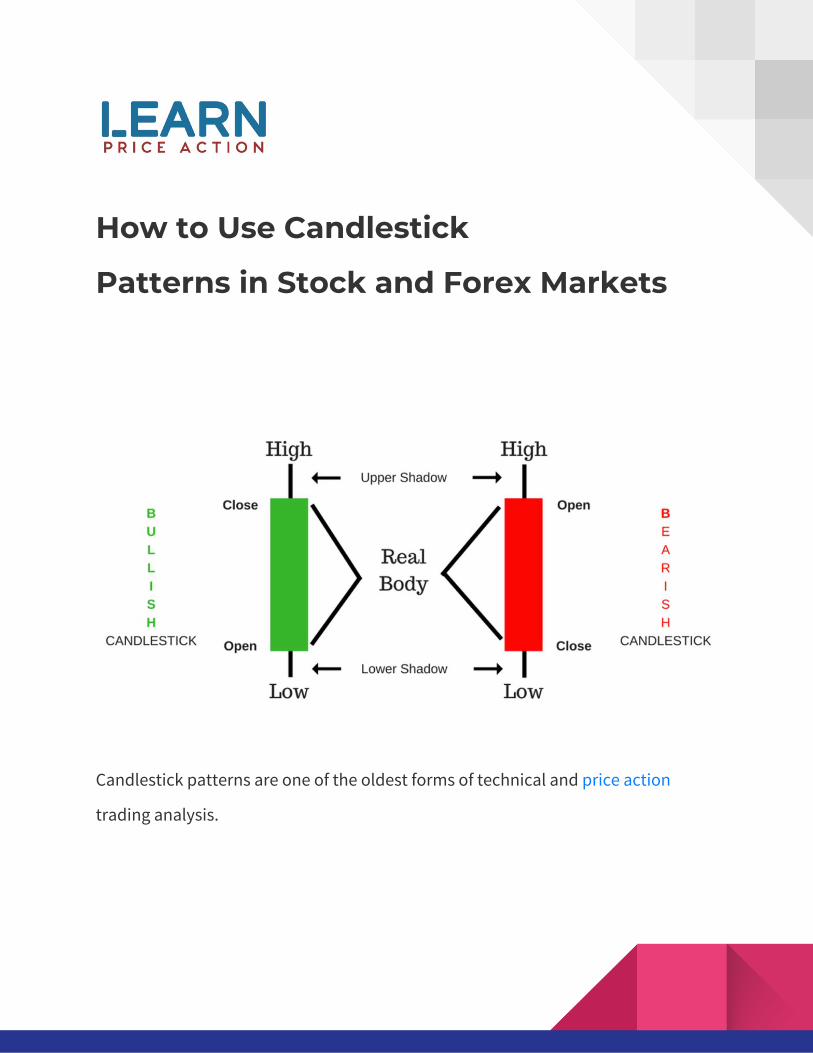
Candlestick charting consists of bars and lines with a body, representing
information showing the price open, close, high, and low.
It dates back to the 16th century when a man named Homma Munehisa used this to
trade rice contracts. He was also thought to have developed the Candlestick Chart
which was later brought to the Western world by Steve Nison.
Steve Nison introduced candlesticks to the world in his 1991 book “Japanese
Candlestick Charting Techniques” and is now very popular because of its simplicity
and unique insight into the sentiment of the market.
Candlestick charts are most often used in technical analysis of equity and currency
price patterns.
What are Candlestick Charts?
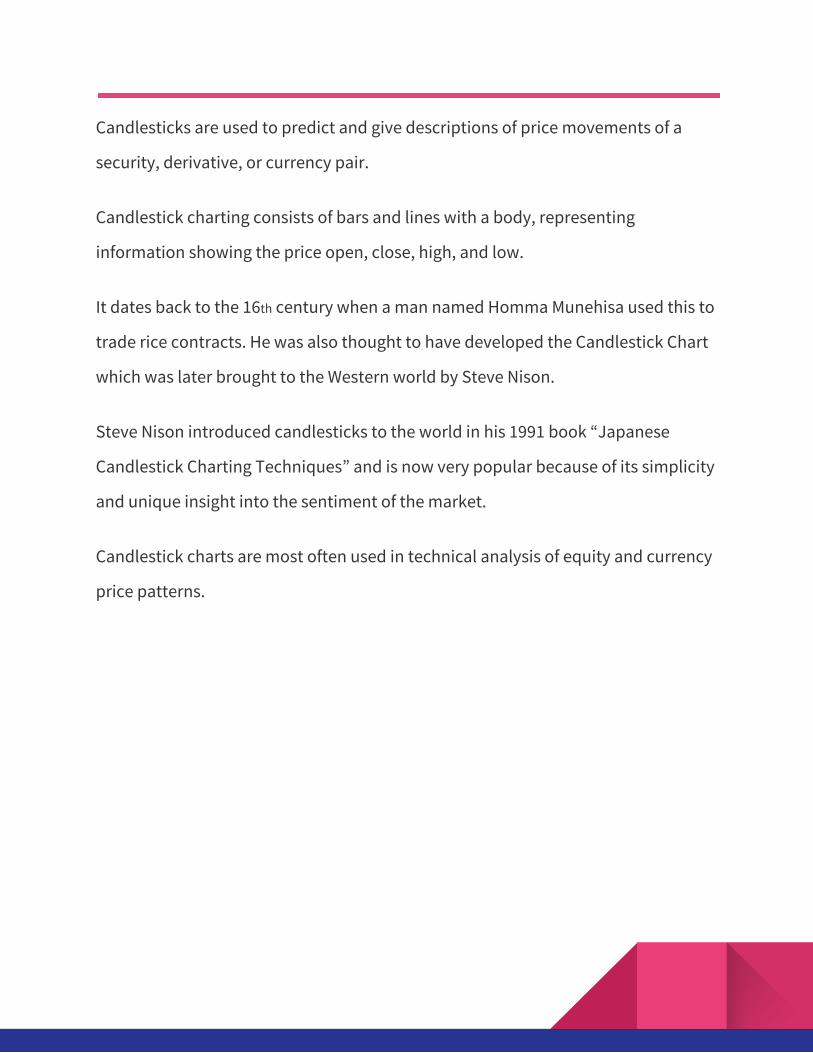
Candlesticks are visual representations of market movements. Traders use
candlesticks to help them make better trading decisions by studying patterns that
forecast a markets short-term direction.
A candlestick is a chart that shows a specific period of time that displays the
opening, closing, high and low prices of a security. It is a fundamental component
of technical analysis since it helps a trader understand a market movement at a
glance. It is a very suitable technique for trading liquid financial assets such as
forex, and futures.
What is the Difference Between Candlestick
Charts and Bars?
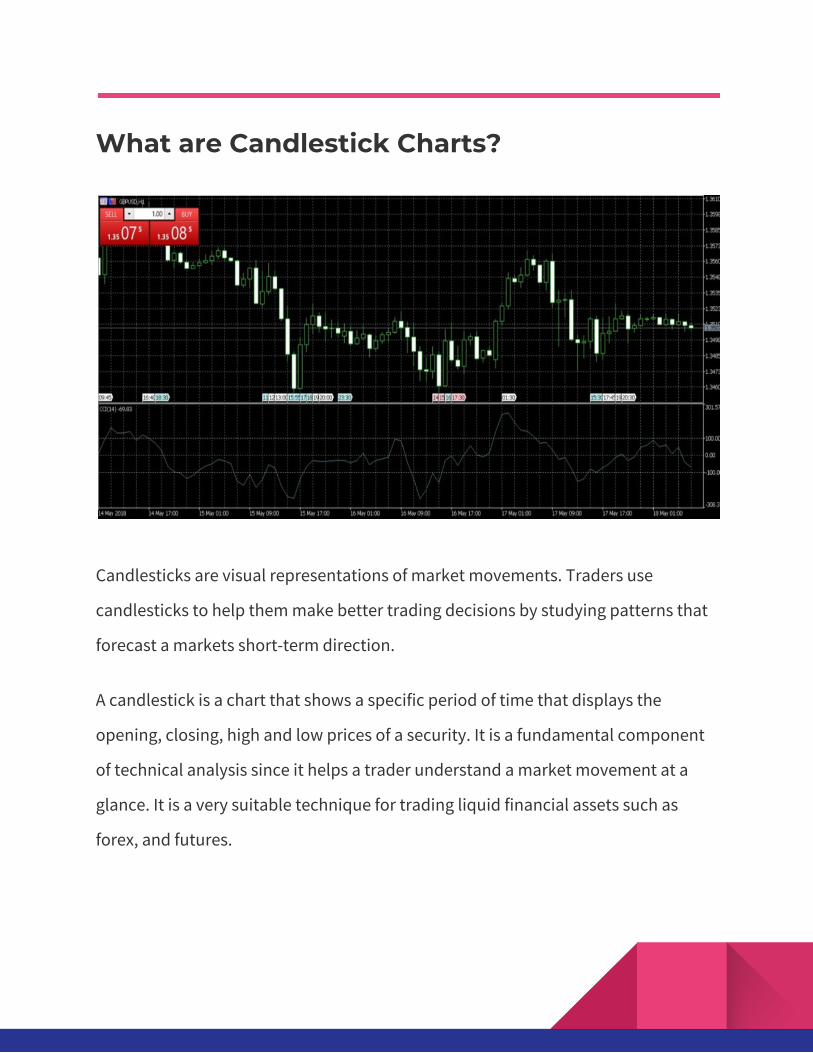
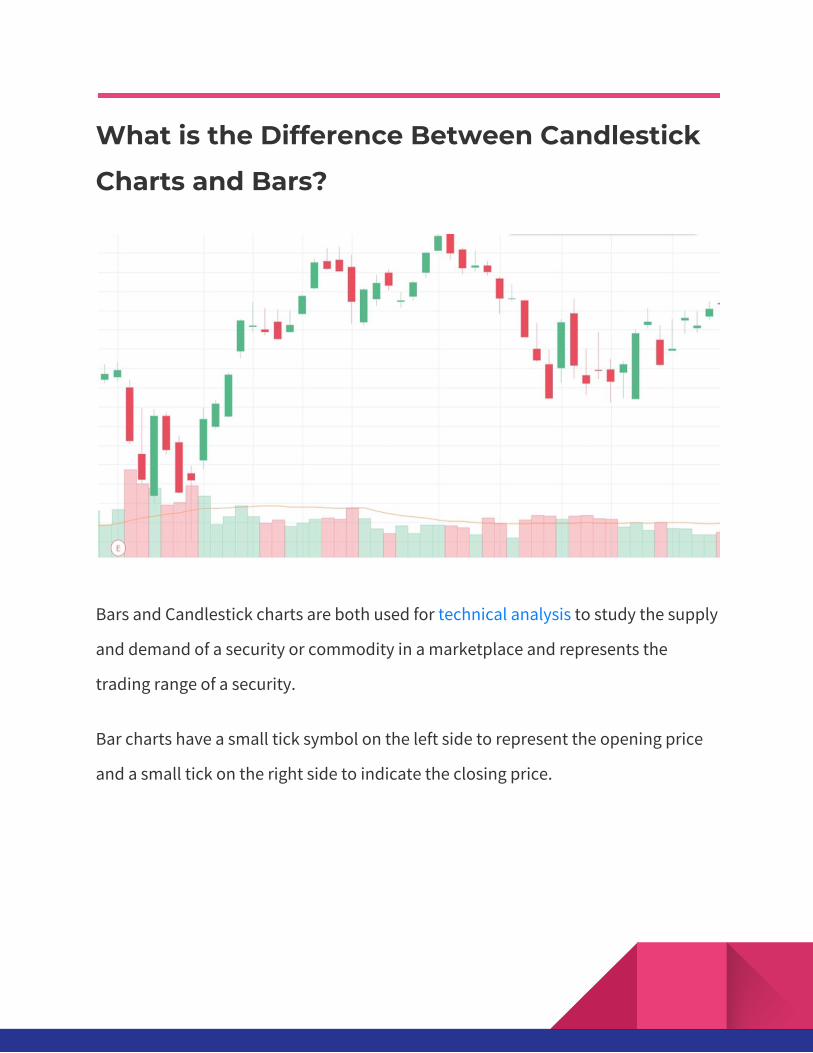
Bars and Candlestick charts are both used for technical analysis to study the supply
and demand of a security or commodity in a marketplace and represents the
trading range of a security.
Bar charts have a small tick symbol on the left side to represent the opening price
and a small tick on the right side to indicate the closing price.
As for Candlestick chart, it has a body and a shadow. Bodies are defined as the
range between the opening and closing price. Shadows represent the range of the
day outside of the opening and closing of the prices.
How can you use Candlestick Patterns in
your Forex and Stock Trading?
Candlestick Patterns are an efficient way for you to view an asset’s price chart. It
shows you which way the price moved during a specific period of time using colors,
as well as how far the price moved on that period.
Time frames are shown for the time frame you are using or have selected. For
example; if you are using a 5-minute time frame, a candle will show the HIGH, LOW,
OPEN and CLOSING in 5 minute intervals.
Candlestick: Real Bodies
There are two types of Candles, the Bullish Candle,
and the Bearish Candle.
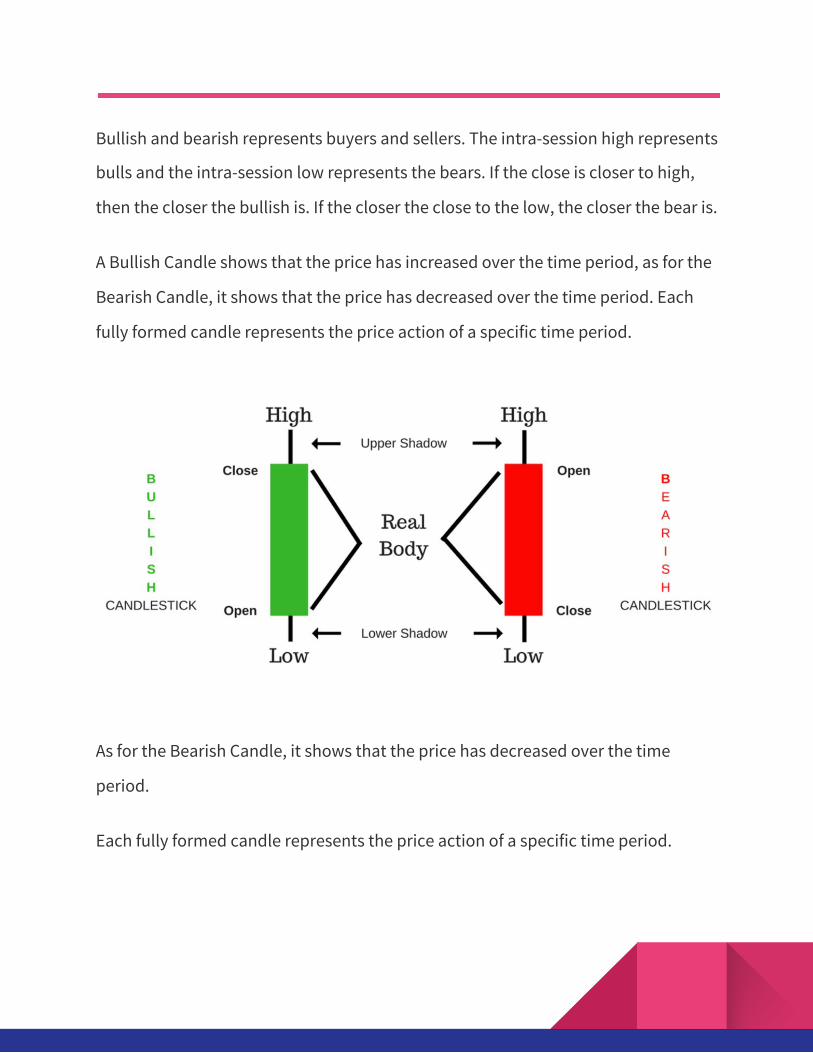
Bullish and bearish represents buyers and sellers. The intra-session high represents
bulls and the intra-session low represents the bears. If the close is closer to high,
then the closer the bullish is. If the closer the close to the low, the closer the bear is.
A Bullish Candle shows that the price has increased over the time period, as for the
Bearish Candle, it shows that the price has decreased over the time period. Each
fully formed candle represents the price action of a specific time period.
As for the Bearish Candle, it shows that the price has decreased over the time
period.
Each fully formed candle represents the price action of a specific time period.
For example:
The Bullish Candle’s top is the closing price and the bottom is the opening price
and the Bearish Price’s top is the opening price and its bottom is the closing price.
Candlesticks have 2 parts, a real body and a wick (tail). The open and close prices
are the first and last transaction prices of that time frame. If no real body was
shown or the real body is very small, then it means that the open and close are
almost the same. In addition, real bodies have color but differ in every charting
platform.
The most common color of real bodies is green, red, white, and black, however you
can change this to your liking.
A green or white candle means the price finished higher or the closing price is
above the open price. A red or black candle means that the price has decreased
over the time period or the top of the real body is the open price and below is the
closing price.
The Bullish Candle and the Bearish Candle similarly reflect the difference between
the open and close price during that period.
Remember that most charting platforms allow traders to make adjustments on
your candlesticks to be visually appealing and easily identifiable. Alter the colors of
your up and down candles to make the contrast distinct. Net Change will color a
candlestick whether it closes or below the close of its prior candle.
What are Some of the Best Candlestick Chart
Patterns?
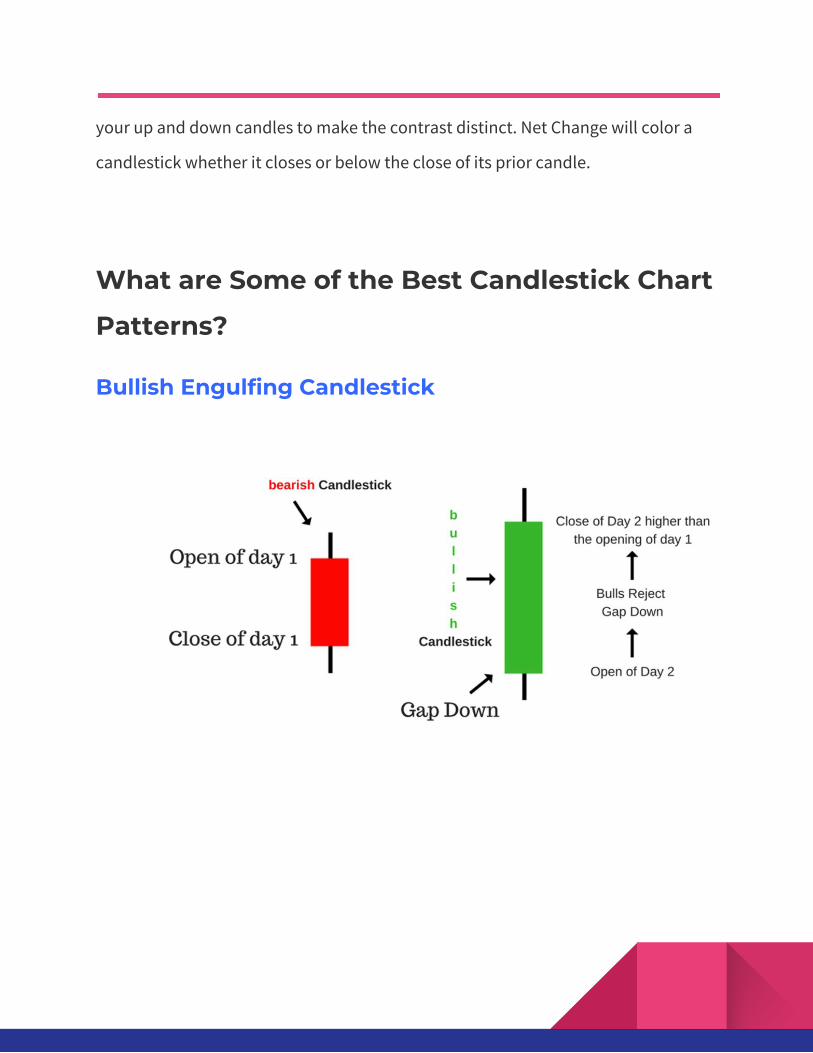
Bullish Engulfing Candlestick
Quite a name for a candlestick. This pattern consists of two candles and shows
when the price of a stock moves beyond high and low of the previous day range.
This candle is your signal for a sustained upward move or trend change.
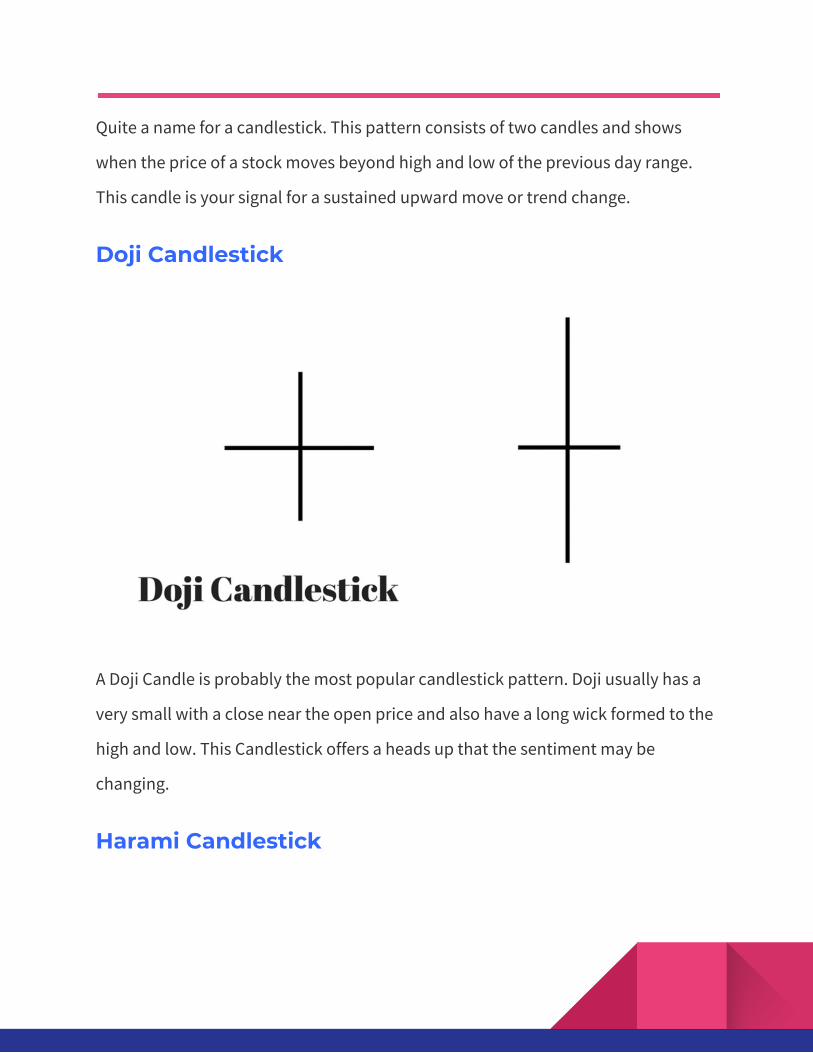
Doji Candlestick
A Doji Candle is probably the most popular candlestick pattern. Doji usually has a
very small with a close near the open price and also have a long wick formed to the
high and low. This Candlestick offers a heads up that the sentiment may be
changing.
Harami Candlestick
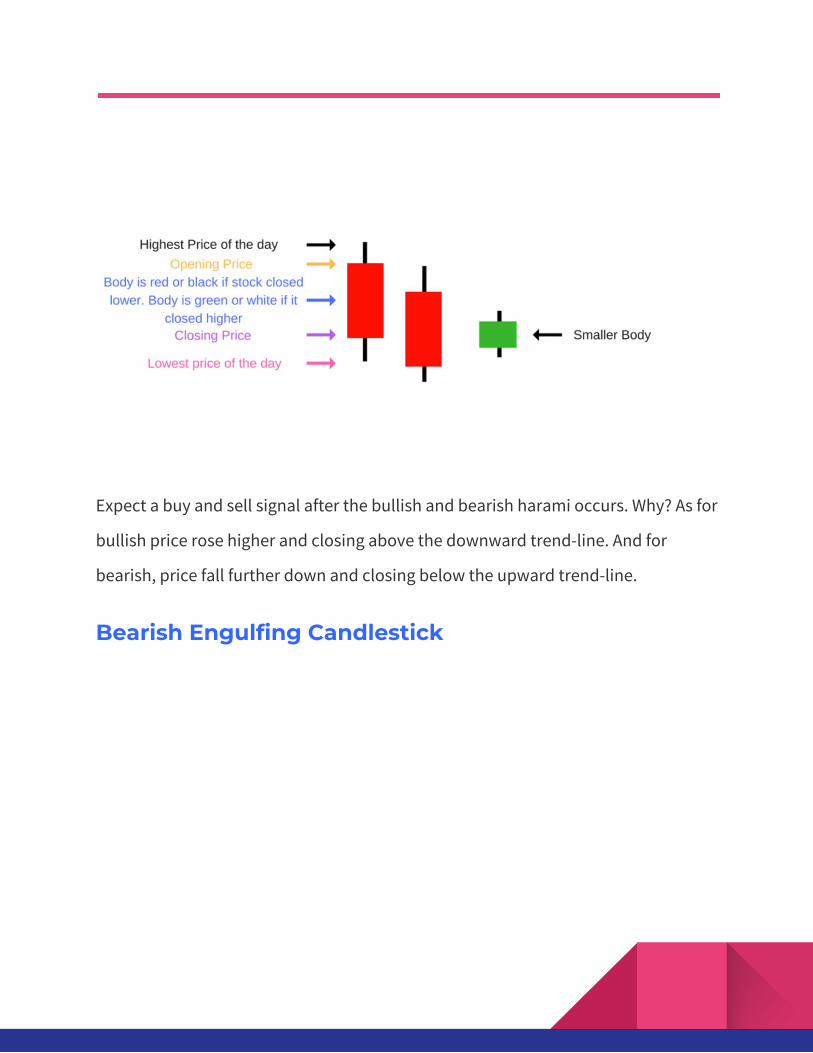
Expect a buy and sell signal after the bullish and bearish harami occurs. Why? As for
bullish price rose higher and closing above the downward trend-line. And for
bearish, price fall further down and closing below the upward trend-line.
Bearish Engulfing Candlestick
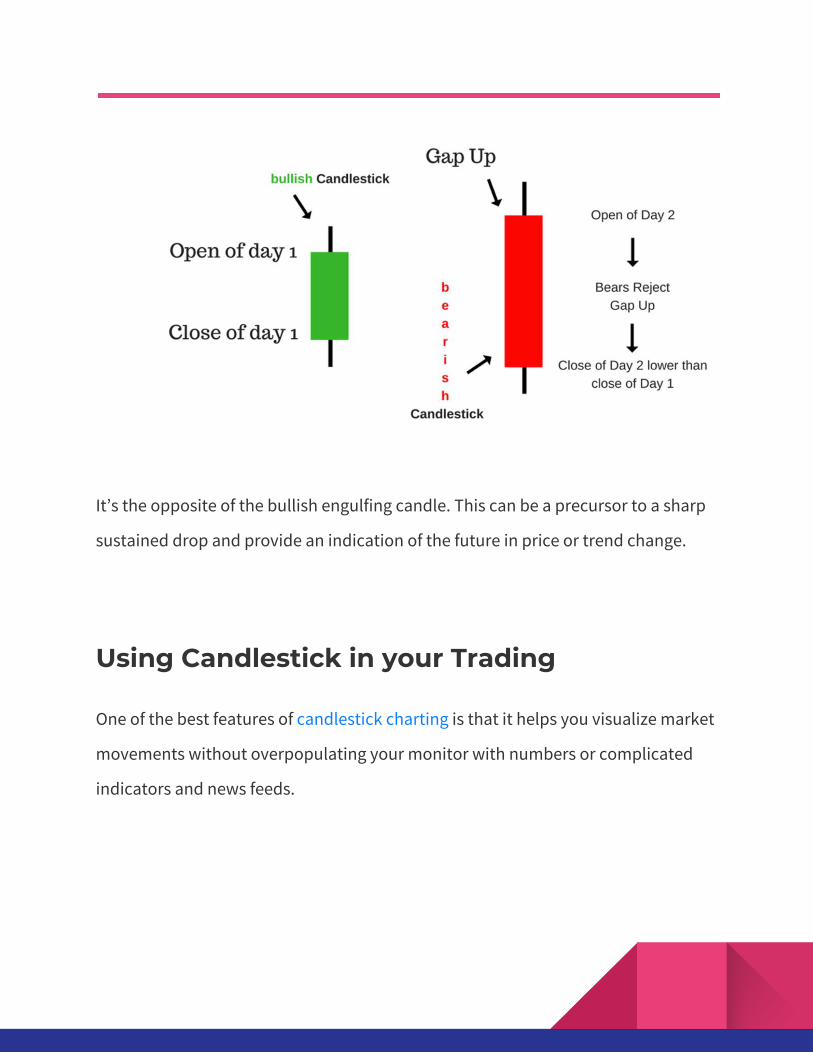
It’s the opposite of the bullish engulfing candle. This can be a precursor to a sharp
sustained drop and provide an indication of the future in price or trend change.
Using Candlestick in your Trading
One of the best features of candlestick charting is that it helps you visualize market
movements without overpopulating your monitor with numbers or complicated
indicators and news feeds.
Because of the candlestick, you can quickly understand what’s going on with the
price of a security at a single glance.
You can also tell whether other sellers or buyers have dominated on a given day,
and sense the trends. It is an excellent way for traders to identify and decide when
is the best time to buy, sell, or wait.
After reading the most rudimentary of candlestick basics, you can easily spot the
opening and closing price of a security and start to see patterns forming.
All the success!
Learn Price Action