Embed Size (px)
Citation preview

How To Troubleshoot vSphere 5.x Performance Issues Using vCenter Operations April 2013
P E R F O R M A N C E C O M M U N I T Y D O C U M E N T
How To Troubleshoot vSphere 5.x Performance Issues Using vCenter Operations VMware, Inc. Page 2 of 38
Contents 1. Introduction .................................................................................................................................................................................................................................. 4 2. Defining Performance Problems ........................................................................................................................................................................................ 5
2.1. Service-Level Agreements ............................................................................................................................................................................................ 5 2.2. Baseline Performance Tests ......................................................................................................................................................................................... 5 2.3. Complaints about Application Response Time or Throughput ................................................................................................................... 5 2.4. Virtual-to-Physical Comparison ................................................................................................................................................................................ 6
3. Traditional Performance Troubleshooting Methodology ....................................................................................................................................... 7 4. vCenter Operations Overview ............................................................................................................................................................................................ 9 5. The vCenter Operations Approach ................................................................................................................................................................................. 10
5.1. Methodology ...................................................................................................................................................................................................................... 10 5.1.1. Finding an Object with a Problem .................................................................................................................................................................... 10 5.1.2. Identifying the Cause ............................................................................................................................................................................................. 10 5.1.3. Addressing the Cause ........................................................................................................................................................................................... 10
5.2. Finding a Virtual Machine with a Problem ........................................................................................................................................................... 11 5.2.1. EnvironmentOverview ...................................................................................................................................................................................... 11 5.2.2. Search ........................................................................................................................................................................................................................... 11
5.3. Identifying the Cause .................................................................................................................................................................................................... 12 6. Troubleshooting Storage ..................................................................................................................................................................................................... 14
6.1. Overview .............................................................................................................................................................................................................................. 14 6.2. Basic Questions to Ask ................................................................................................................................................................................................. 14 6.3. vCenter Operations Workflow and Analysis ...................................................................................................................................................... 14 6.1. Sample Conclusion .......................................................................................................................................................................................................... 21 6.2. Common Counters and Thresholds........................................................................................................................................................................ 21
7. Troubleshooting Compute ................................................................................................................................................................................................. 23 7.1. Overview ............................................................................................................................................................................................................................. 23 7.2. Basic Questions to Ask ................................................................................................................................................................................................ 23 7.3. vCenter Operations Workflow and Analysis ..................................................................................................................................................... 23 7.1. Sample Conclusion ......................................................................................................................................................................................................... 27 7.2. Common Counters and Thresholds ....................................................................................................................................................................... 27
8. Troubleshooting Memory ................................................................................................................................................................................................... 29 8.1. Overview ............................................................................................................................................................................................................................. 29 8.2. Basic Questions to Ask ................................................................................................................................................................................................ 29 8.3. vCenter Operations Workflow and Analysis ..................................................................................................................................................... 29 8.4. Sample Conclusion........................................................................................................................................................................................................ 33 8.5. Common Counters and Thresholds ....................................................................................................................................................................... 33
How To Troubleshoot vSphere 5.x Performance Issues Using vCenter Operations VMware, Inc. Page 3 of 38
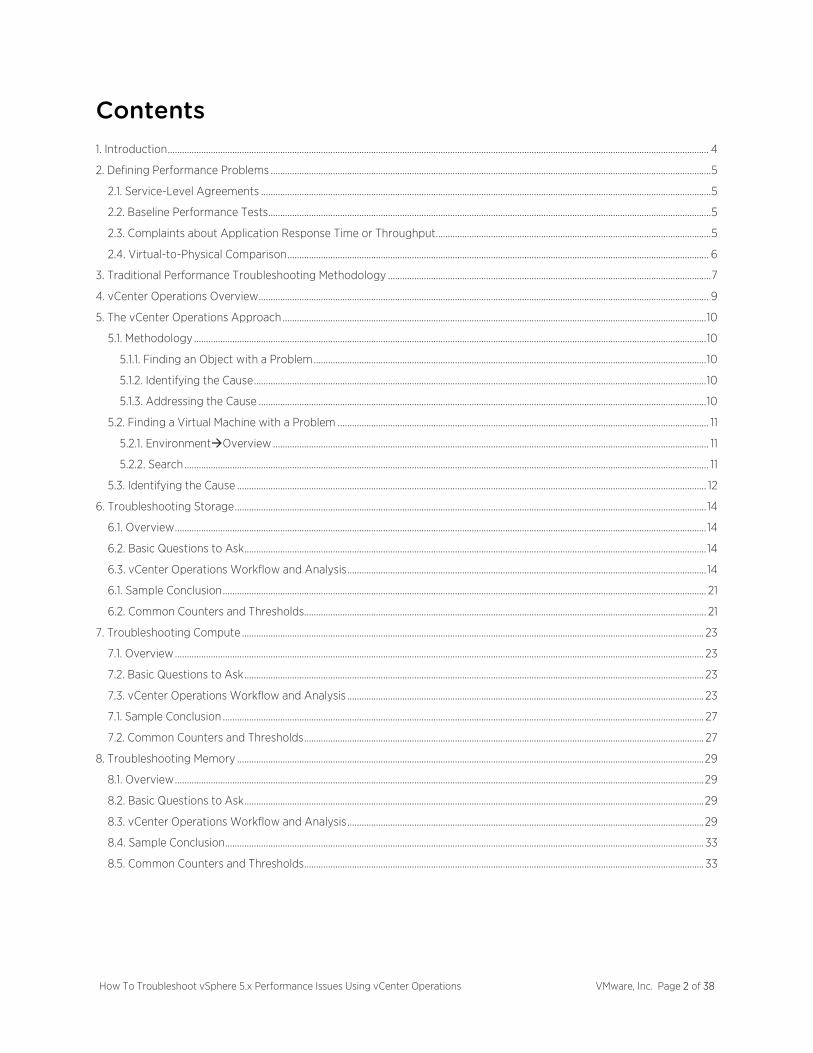
9. Troubleshooting Network .................................................................................................................................................................................................. 34 9.1. Overview ............................................................................................................................................................................................................................. 34 9.2. Basic Questions to Ask ................................................................................................................................................................................................ 34 9.3. vCenter Operations Workflow and Analysis ..................................................................................................................................................... 34 9.1. Sample Conclusion ......................................................................................................................................................................................................... 36 9.2. Common Counters and Thresholds....................................................................................................................................................................... 37
10. Document Information ....................................................................................................................................................................................................... 38 10.1. References ........................................................................................................................................................................................................................ 38 10.2. Change Information .................................................................................................................................................................................................... 38 10.3. About the Authors ....................................................................................................................................................................................................... 38

How To Troubleshoot vSphere 5.x Performance Issues Using vCenter Operations VMware, Inc. Page 4 of 38
1. Introduction Performance problems can arise in any computing environment. Complex application behaviors, changing demands, and shared infrastructure can lead to problems arising in previously stable environments. Troubleshooting performance problems requires an understanding of the interactions between the software and hardware components of a computing environment. Moving to a virtualized computing environment adds new software layers and new types of interactions that must be considered when troubleshooting performance problems. Proper performance troubleshooting requires that you start with a broad view of the computing environment and systematically narrow the scope of the investigation as you eliminate possible sources of problems. Troubleshooting efforts that start with a narrowly conceived idea of the source of a problem often get bogged down in detailed analysis of one component, when the actual source of the problem is elsewhere in the infrastructure. In order to quickly isolate the source of performance problems, you need to adhere to a logical troubleshooting methodology that avoids preconceptions about the source of the problems. Often, though, many environments are susceptible to the same performance issues, so this document is focused on addressing the most common performance issues VMware sees in the field and how these issues can be diagnosed using the VMware® vCenter Operations Manager™ suite. vCenter Operations Manager is a complex tool and can be leveraged many different ways. This guide will focus on the Virtual Machine object primarily as a starting point for learning to leverage the vCenter Operations Manager tool. This is a living document. Reader comments, questions, and suggestions are encouraged. See Change Information for change and version information.

How To Troubleshoot vSphere 5.x Performance Issues Using vCenter Operations VMware, Inc. Page 5 of 38
2. Defining Performance Problems Performance troubleshooting is a task that is undertaken with the goal of solving performance problems. Therefore, before we begin to discuss performance troubleshooting, we need to clearly define what is, and is not, a performance problem.
Performance problems can arise during the following scenarios:
• An established service-level agreement (SLA) is not met. • A routine comparison of baseline performance tests against current activity indicates a problem. • Poor response time or throughput of an application workload is reported by users. • A virtualized system, when compared to a physical system, displays performance issues.
Regardless of which situation exists, it is important to eliminate changes in load as the source of performance problems before investigating the software and hardware infrastructure. Changes in load, such as growth in the number of users, or increased demand from existing users, can cause performance problems in applications that previously had acceptable performance.
If your organization follows performance management and capacity planning, you can use baseline data to determine whether changes in application load are responsible for performance degradations. If such data is not available, pursue other avenues of investigation, including customer interviews, to determine whether there have been recent changes in load.
2.1. Service-Level Agreements
The proper way to define performance problems is in the context of an ongoing performance management and capacity planning process. Performance management refers to the process of establishing performance requirements for applications, in the form of SLAs and then tracking and analyzing the achieved performance to ensure that those requirements are met. A complete performance management methodology would include collecting and maintaining baseline performance data for applications, systems, and subsystems (for example, storage and network). Capacity planning refers to the process of using modeling and analysis techniques to project the impact of anticipated workload or infrastructure changes on the ability of an infrastructure to satisfy SLAs.
In the context of performance management, a performance problem exists when an application fails to meet its predetermined SLA. Depending on the specific SLA, the failure may be in the form of excessively long response times or throughput below some defined threshold. You should undertake performance troubleshooting to find the cause and bring performance back within limits defined by the SLAs.
2.2. Baseline Performance Tests
When SLAs or other performance criteria have not been defined, the definition of performance problems becomes more subjective. Baseline performance data, from periods in which performance was deemed acceptable, can be used as a means of quantifying deviations in performance and determining whether problems exist. Ideally, this baseline data should cover the application, the load applied to the application, and the performance characteristics of the server, storage, and network infrastructure. If you decide that the deviations in application performance are severe enough, then performance troubleshooting is necessary to bring performance back within a predetermined range of the baseline..
2.3. Complaints about Application Response Time or Throughput
In environments where no SLAs have been established, and where no baseline data is available, user complaints about slow response time or poor throughput may lead to the declaration that a performance problem exists. In this situation, there is no objective way of determining whether current performance is problematic. In order to avoid unnecessary investigations, formulate a clear statement of the perceived problem and acceptable solution before undertaking performance troubleshooting.
How To Troubleshoot vSphere 5.x Performance Issues Using vCenter Operations VMware, Inc. Page 6 of 38
2.4. Virtual-to-Physical Comparison
Using a virtualized environment adds one new factor to the definition of performance problems. Often baseline data collected when an application was running on non-virtualized systems is compared to data collected after the application is virtualized. Many factors can lead to differences in performance, including different server hardware, different CPU and memory allocations, sharing of resources with other high-load applications, and different storage subsystems. Consider the following point when comparing performance between virtualized and non-virtualized environments:
• Performance comparisons should be based on actual application performance metrics, such as response time or throughput of the workloads being run. Comparisons in terms of lower-level performance metrics, such as CPU utilization, are rarely valid when moving from a physical to virtual environment.
Performance comparisons between virtual and non-virtual environments are only valid when the same underlying infrastructure is used. This includes the same type and number of CPU cores, the same amount of memory, and storage, which is either the same or has comparable performance characteristics.

How To Troubleshoot vSphere 5.x Performance Issues Using vCenter Operations VMware, Inc. Page 7 of 38
3. Traditional Performance Troubleshooting Methodology
After you have determined that a performance problem exists, follow a logical methodology for finding and fixing the cause of the problem. In this section we describe a general troubleshooting methodology that we’ll map to the vCenter Operations suite for finding and fixing performance problems in a vSphere environment. In discussing our performance troubleshooting methodology, we use the following terms:
• Observed Symptoms: These are the observed effects that lead to the decision that a performance problem exists. They are based on high-level metrics such as throughput or response time. Ideally, the presence or absence of a problem is defined by an SLA or other set of performance targets or baselines.
• Observable Problem: These are the problems that can be identified in the lower-level infrastructure by the values of specific performance metrics. The performance metrics are typically provided by performance monitoring tools. An observable problem may be directly causing the symptoms, but there is typically something more fundamental that is causing the problem to occur.
• Root Cause: The root cause is the ultimate source of the observable problems. It may be a configuration issue, a contention for resources, application tuning, etc. Root causes often cannot be directly observed by monitoring tools, but instead must be inferred by the presence of observable problems. Finally identifying a root cause may require an iterative tuning effort.
The following figure shows the relationship among symptoms, problems, and cause.

How To Troubleshoot vSphere 5.x Performance Issues Using vCenter Operations VMware, Inc. Page 8 of 38
A performance troubleshooting methodology must provide guidance on how to find the root cause of the observed performance symptoms, and how to fix the cause once it is found. To do this, it must answer the following questions:
1. How do we know when we are done? 2. Where do we start looking for problems? 3. How do we know what to look for to identify a problem? 4. How do we find the root cause of a problem we have identified? 5. What do we change to fix the root cause? 6. Where do we look next if no problem is found?
The first step of any performance troubleshooting methodology must be deciding on the criteria for successful completion. If SLAs or other baselines exist, use these to generate the success criteria. Otherwise, utilize application-specific knowledge, an understanding of user expectations, and an understanding of available resources to help determine the criteria. The process of setting SLAs or selecting appropriate performance goals is beyond the scope of this document, but it is critical to the success of the troubleshooting process that some stopping criteria be set. In the absence of defined goals, performance troubleshooting can turn into an endless performance-tuning process. After you have decided on an end-goal, the next step in the process is deciding where to start looking for observable problems. There can be many different places in the infrastructure to start an investigation, and many different ways to proceed. The goal of our performance troubleshooting methodology is to select at each step the component which is most likely to be responsible for the observed problems. In our experience, a large percentage of performance problems in a vSphere environment are caused by a small number of common causes. As a result, the method used in this document is to follow a fixed-order flow through the most common observable performance problems. For each problem, we specify checks on specific performance metrics made available by the vSphere performance monitoring tools. These checks are embodied in flow-charts that describe each step necessary to access the metrics, and values that indicate the presence or absence of the problem. If a problem is identified, the problem checks direct you to the section of this document that discusses the possible root causes for the problem and possible solutions. After you identify and resolve the problem, the re-evaluate the performance of the environment in the context of the completion criteria you defined at the start of the process. If the criteria are satisfied, then the troubleshooting process is complete. Otherwise, follow the problem checks again to identify additional problems. As in all performance tuning and troubleshooting processes, it is important to fix only one problem at a time so that you understand the impact of each change.

How To Troubleshoot vSphere 5.x Performance Issues Using vCenter Operations VMware, Inc. Page 9 of 38
4. vCenter Operations Overview The vCenter Operations Management Suite is a tool that makes it easy to administer ongoing performance management and monitoring in complex virtualized environments. This suite provides comprehensive performance, capacity, and configuration management. The VMware vCenter Operations Management Suite is tightly integrated with VMware vSphere and leverages that deeper integration to give you greater visibility and understanding of your datacenter infrastructure. The software features easy-to-read and customizable dashboards and smart alerts for quicker, more effective health analysis. The vCenter Operations Management Suite simplifies and automates root-cause analysis and gives you a view into the health, risk, and efficiency of your cloud infrastructure.
This guide assumes some familiarity with the vCenter Operations interfaces, the concept of badges, their relationships, and navigation.
For more information please see the getting started guide:
• vCenter Operations Manager Getting Started Guide http://www.vmware.com/pdf/vcops-56-getting-started-guide.pdf
How To Troubleshoot vSphere 5.x Performance Issues Using vCenter Operations VMware, Inc. Page 10 of 38
5. The vCenter Operations Approach 5.1. Methodology
vCenter Operations Manager provides visual and metric indicators that enable you to research performance and capacity problems in your IT environment. It leverages historical data to not only produce baseline performance but also predict future consumption and gaps in infrastructure.
The troubleshooting process consists of these main steps:
1. Find an object that has a problem. 2. Identify the cause of the problem. 3. Fix the cause of the problem.
For example, a user might call the help desk and report a performance problem. You can use the Health major badge and Workload, Anomalies, and Faults minor badges to identify the object that is experiencing performance degradation. After you identify the problem area, you can relocate the object or transfer resources to it.
5.1.1. Finding an Object with a Problem
A troubleshooting process is often initiated in one of these ways:
• An end user reports a problem with their system. • One or more alert notifications are received, reporting problems with the environment. • A vCenter Operations Manager user, such as a system administrator, identifies an immediate or near-term
problem.
5.1.2. Identifying the Cause
Consider these items to help find and isolate the cause of a problem:
• The symptoms that appear in vCenter Operations Manager. For example, what are the Workload, Faults, and Anomalies scores?
• The population affected. Which objects are experiencing the symptoms? • The time frame of the problem. Is it temporary or long-term? • Change events. Do planned or unplanned events leading to a problem?
5.1.3. Addressing the Cause
After you understand the cause, you can take appropriate action in the virtual environment to fix the problem. Typically, remediation involves shifting or adding resources in the environment and rolling back any unwanted changes. The remediation can be automated using VMware vCenter™ Orchestrator™ workflows. In environments with strict change control, vCenter Operations also provides integration with service desk systems to log incidents and service tickets. This document only provides some very simple remediation suggestions.

How To Troubleshoot vSphere 5.x Performance Issues Using vCenter Operations VMware, Inc. Page 11 of 38
5.2. Finding a Virtual Machine with a Problem
vCenter Operations Manager provides many ways to identify objects that have an associated performance issue. This guide will highlight two of the most common ways to find these objects by staying focused on the virtual machine perspective.
5.2.1. EnvironmentOverview
From the default dashboard screen select: EnvironmentOverview
The Environment overview provides a single-screen view of the entire environment. You can switch between various badges to change focus from day-to-day operations management to longer term planning activities. For example, select the Workload badge:
This summary screen shows all objects monitored within vCenter Operations Manager and can be quickly used to identify virtual machines under contention by their color: yellow or red. A single-click on the object shows the hierarchy of all related objects connected to it. A double-click on the object takes you to the details of that object.
5.2.2. Search
The search function can be used to query for an object by name and will then take you to the details of that object.

How To Troubleshoot vSphere 5.x Performance Issues Using vCenter Operations VMware, Inc. Page 12 of 38
5.3. Identifying the Cause
After you select a virtual machine with an associated performance problem a Bound By resource is reported. This is the resource dimension (Storage, Compute, Memory or Network) that is most likely causing contention and the level of stress is identified as yellow or red. If the Bound By dimension is green, it identifies that the virtual machine is within dynamic thresholds (indicated by a blue ribbon next to the metrics) If the specific resource dimension is numerically the largest value compared to the other dimensions, this does not necessarily indicate an active performance issue.
The following image is an example of a virtual machine within dynamic thresholds. Notice that all badges and icons are shown in green.
The following image is an example of a virtual machine bound by memory. You can see the workload shield is orange, the problem has existed over the last 6 hours, and memory usage is at 85% of its maximum allotment. We will look at these indicators in more depth in the next sections.
How To Troubleshoot vSphere 5.x Performance Issues Using vCenter Operations VMware, Inc. Page 13 of 38
Performance troubleshooting will begin with the Bound By resource dimension identified by vCenter Operations Manager. Throughout the investigation, the following questions should be considered to assist in identifying a root cause:
1. Is the virtual machine’s configured capacity meeting demand?
Since sizing methodologies typically recommend configuring a virtual machine with only the resources it requires, you should confirm that demand by the workload does not exceed the configured capabilities. Example: a virtual machine configured with a single vCPU is demanding more CPU than that configuration can provide.
2. Are reservations or limits impacting demand? These vSphere features can dynamically control the resources allocated to a virtual machine and can effect demand and consumption and need to be investigated. Example: a virtual machine is demanding 2Ghz of CPU but a limit is throttling its consumption to 1 Ghz.
3. Are there any reported anomalies and change events?
Changes to a virtual machine’s behavior is detected by the analytics engine and reported as both a stack ranked set of abnormal metrics and change events. This information gives clues to other metrics to investigate in order of importance and changes to the virtual machine that may also be a root cause. Example: someone imposed a CPU limit on the virtual machine, which changed its default behavior.
4. Is this the only the virtual machine affected? It is important to assess if peer virtual machines are exhibiting the same behaviors, which could mean a virtual machine population or consolidation problem. Example: all virtual machines are not having their CPU demand met.
5. Is the host affected?
Looking at resources from the host perspective can give you clues to issues that may be affecting more than a single virtual machine or host. Example: datastore latency is extremely high, affecting various workloads throughout a cluster.
6. Is it a chronic issue?
Looking at stress historically can provide details as to the frequency and level of stress for a given virtual machine thereby helping to identify if this is a chronic issue. Example: memory demand spikes within a virtual machine only on the last day of the month.
After the Virtual Machine Bound By dimension is identified, proceed to the appropriate next sections of this guide to continue the troubleshooting process.
How To Troubleshoot vSphere 5.x Performance Issues Using vCenter Operations VMware, Inc. Page 14 of 38
6. Troubleshooting Storage 6.1. Overview
This section covers the basic steps for investigating a storage-related performance problem using vCenter Operations.
6.2. Basic Questions to Ask
After vCenter Operations has identified the performance issue existing within the storage dimension, you next need to ask yourself a number of questions to help identify the root cause.
Is the issue throughput- or capacity-based? Are there any reported anomalies or change events? Is this the only virtual machine affected? Is the host affected? Is the datastore affected? Is this a one-time or chronic issue?
6.3. vCenter Operations Workflow and Analysis
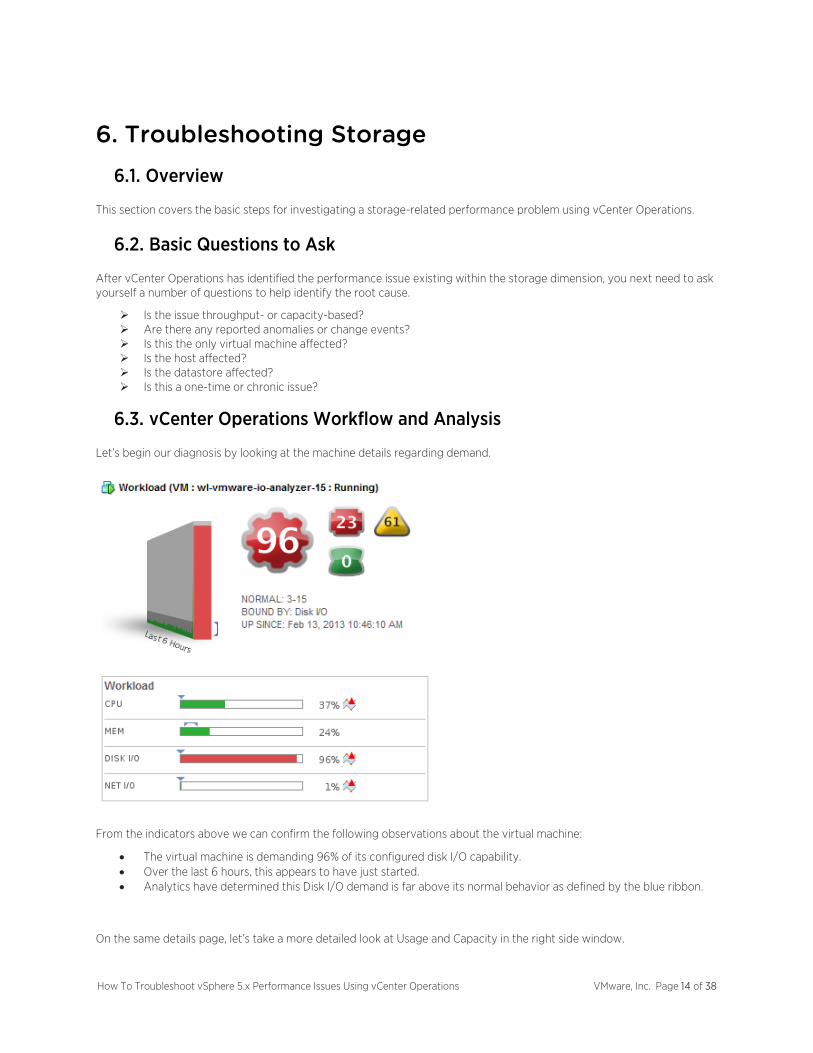
Let’s begin our diagnosis by looking at the machine details regarding demand.
From the indicators above we can confirm the following observations about the virtual machine:
• The virtual machine is demanding 96% of its configured disk I/O capability. • Over the last 6 hours, this appears to have just started. • Analytics have determined this Disk I/O demand is far above its normal behavior as defined by the blue ribbon.
On the same details page, let’s take a more detailed look at Usage and Capacity in the right side window.
How To Troubleshoot vSphere 5.x Performance Issues Using vCenter Operations VMware, Inc. Page 15 of 38
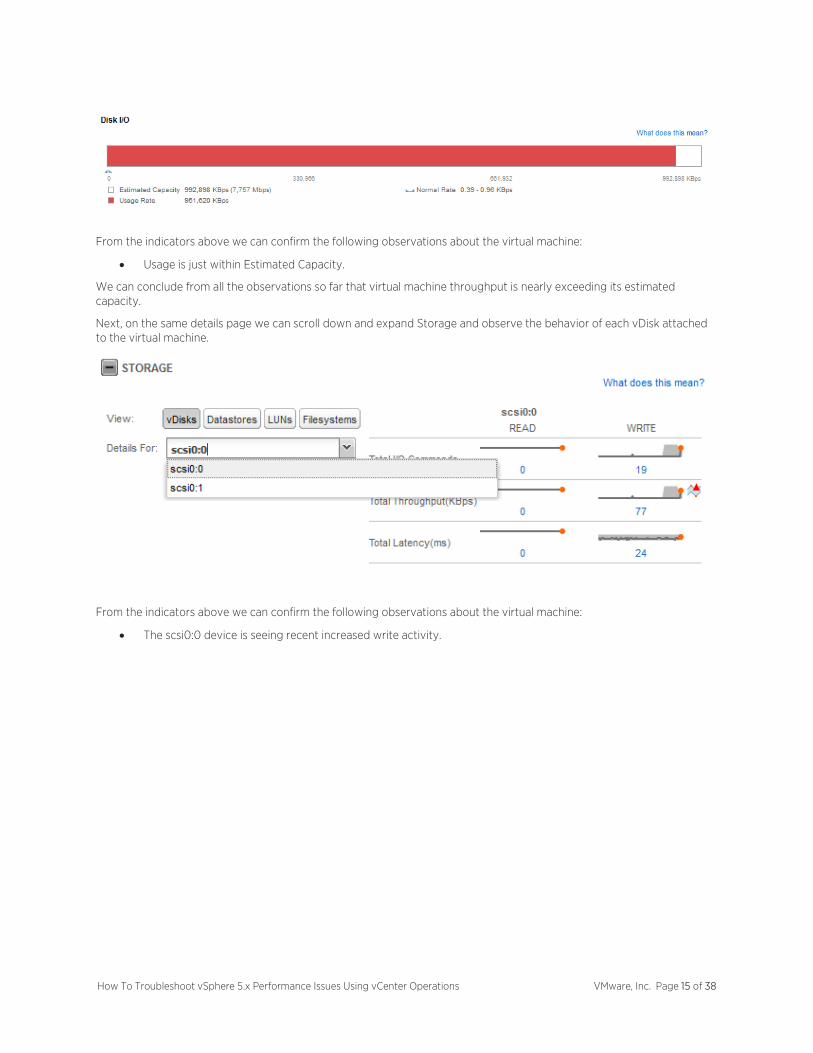
From the indicators above we can confirm the following observations about the virtual machine:
• Usage is just within Estimated Capacity.
We can conclude from all the observations so far that virtual machine throughput is nearly exceeding its estimated capacity.
Next, on the same details page we can scroll down and expand Storage and observe the behavior of each vDisk attached to the virtual machine.
From the indicators above we can confirm the following observations about the virtual machine:
• The scsi0:0 device is seeing recent increased write activity.

How To Troubleshoot vSphere 5.x Performance Issues Using vCenter Operations VMware, Inc. Page 16 of 38
Next, we can observe the behavior of each Datastore containing virtual machine disk files.
From the indicators above we can confirm the following observations about the virtual machine:
• The associated datastore is also seeing increased write activity.
Next, on the same details page, let’s observe the behavior of the virtual machines’ peers by referencing the Related Objects on the same screen.
From the indicators above we can confirm the following observations about the virtual machines’ peers:
• Only this virtual machine is reporting high (red) disk demand. • The parent vSphere host is reporting being Bound By Disk I/O.
We can conclude from these observations that this is not a population problem and its peers are not affected in the same way. Instead this may be a case of single “noisy” virtual machine saturating the vSphere host, and may start affecting performance of its peers.

How To Troubleshoot vSphere 5.x Performance Issues Using vCenter Operations VMware, Inc. Page 17 of 38
Let’s observe the behavior of the vSphere host disk I/O by double-clicking on the workload badge under the related objects.
From the indicators above we can confirm the following observations about the vSphere host:
• The host is demanding 97% of its configured disk capability. • Over the last 6 hours, this appears to have just started. • Analytics have determined this Disk I/O demand is far above its normal behavior.
On the same details page, let’s take a more detailed look at Usage and Capacity in the right side window.
From the indicators above we can confirm the following observations about the host:
• Usage is just within Estimated Capacity.
We can conclude from all the observations so far that a single virtual machine is nearly exceeding the host's estimated capacity.
Next, using the Search dialog box, find the datastore this virtual machine is contained within.

How To Troubleshoot vSphere 5.x Performance Issues Using vCenter Operations VMware, Inc. Page 18 of 38
Now let’s observe the behavior of the Datastore.
From the indicators above we can confirm the following observations about the datastore:
• The datastore is reporting 99% of its Disk I/O capability is consumed. • Over the last 6 hours, this appears to have just started. • Analytics have determined this Disk I/O demand is far above its normal behavior.
On the same details page, let’s take a more detailed look at Space, IOps, Throughput, and Latency in the right side window.
From the indicators above we can confirm the following observations about the datastore:
• The datastore is not out of disk space.

How To Troubleshoot vSphere 5.x Performance Issues Using vCenter Operations VMware, Inc. Page 19 of 38
From the indicators above we can confirm the following observations about the datastore:
• The I/O pattern is predominately write-based. • Analytics have determined the number of writes is above normal dynamic thresholds. • The current number of IOps does not exceed the estimated capacity.
From the indicators above we can confirm the following observations about the datastore:
• The I/O pattern is predominately write-based. • Analytics have determined the write throughput is above normal dynamic thresholds. • The current write throughput is nearly exceeding the estimated capacity.
From the indicators above we can confirm the following observations about the datastore:
• Analytics have determined the read and write latency is higher than the dynamic thresholds.
We can conclude from all the datastore observations so far that:
• The virtual machine is generating a lot of write throughput. • Throughput is bound over IOps.

How To Troubleshoot vSphere 5.x Performance Issues Using vCenter Operations VMware, Inc. Page 20 of 38
• The increase in throughput is driving up latency.
Navigate back the virtual machine details by using the Search dialog box.
Next, let’s check for reported anomalies by clicking on the anomalies badge.
In this case, there are some anomalies reported. Let’s observe the stack ranked metrics for additional clues:
From the indicators above we can confirm the following observations:
• The issue appears to be storage-related due to the high number of abnormal storage metrics.
How To Troubleshoot vSphere 5.x Performance Issues Using vCenter Operations VMware, Inc. Page 21 of 38
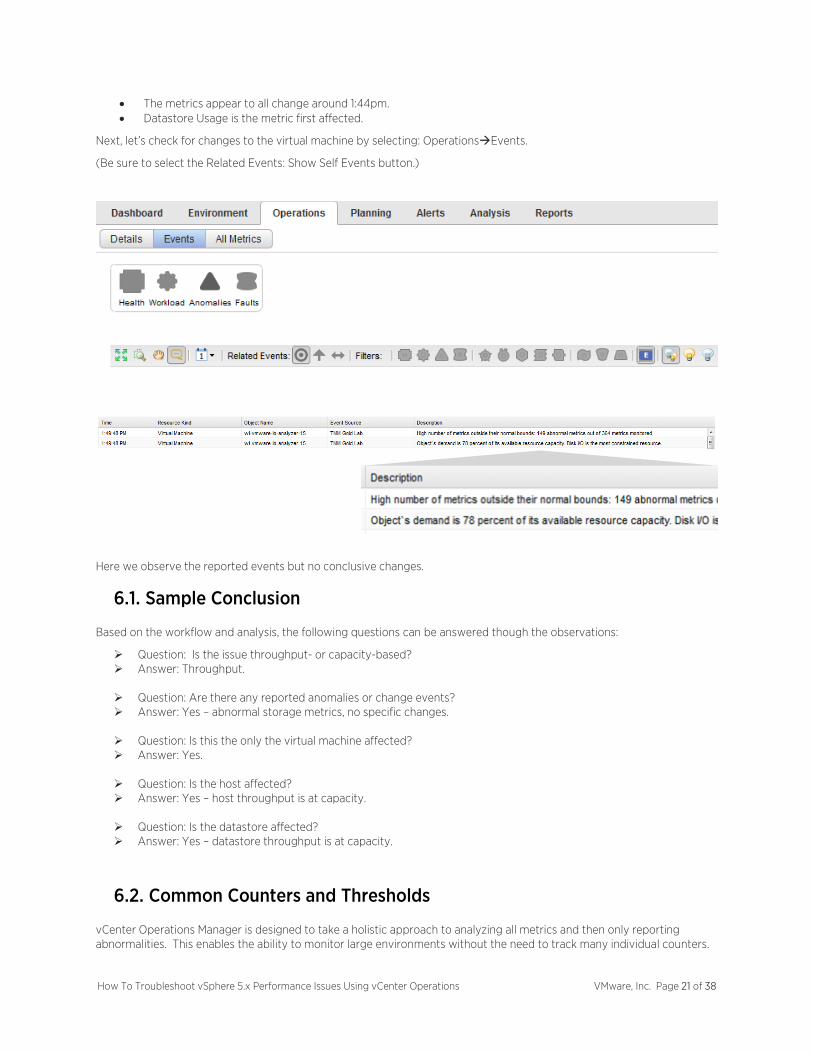
• The metrics appear to all change around 1:44pm. • Datastore Usage is the metric first affected.
Next, let’s check for changes to the virtual machine by selecting: OperationsEvents.
(Be sure to select the Related Events: Show Self Events button.)
Here we observe the reported events but no conclusive changes.
6.1. Sample Conclusion
Based on the workflow and analysis, the following questions can be answered though the observations:
Question: Is the issue throughput- or capacity-based? Answer: Throughput.
Question: Are there any reported anomalies or change events? Answer: Yes – abnormal storage metrics, no specific changes.
Question: Is this the only the virtual machine affected? Answer: Yes.
Question: Is the host affected? Answer: Yes – host throughput is at capacity.
Question: Is the datastore affected? Answer: Yes – datastore throughput is at capacity.
6.2. Common Counters and Thresholds
vCenter Operations Manager is designed to take a holistic approach to analyzing all metrics and then only reporting abnormalities. This enables the ability to monitor large environments without the need to track many individual counters.

How To Troubleshoot vSphere 5.x Performance Issues Using vCenter Operations VMware, Inc. Page 22 of 38
Through the use of the OperationsAll Metrics tab, administrators can still access and view the individual metrics they may have used in the past.
Here are some other metrics available with common thresholds that can be referenced for more detailed investigation.
Object Level Metric Threshold Description
VM Virtual Disk:Read Latency (ms)
> 15-20ms The I/O read response time for a virtual disk. High latency here has an immediate impact on performance.
VM Virtual Disk:Write Latency (ms)
> 15-20ms The I/O write response time for a virtual disk. High latency here has an immediate impact on performance. Write is typically slower than read.
Host Devices:Kernel Disk Command Latency (ms)
> 1ms (known in esxtop as KAVG) The latency incurred passing the I/O through the hypervisor. Latency here typically indicates a host-based issue.
Host Physical Device Command Latency (ms)
> 15-20ms (known in esxtop as DAVG) The latency incurred for an I/O headed to the array and back. Latency here typically indicates an array-based issue.
Note: When using NFS, device latency is not available.

How To Troubleshoot vSphere 5.x Performance Issues Using vCenter Operations VMware, Inc. Page 23 of 38
7. Troubleshooting Compute 7.1. Overview
This section covers the basic steps for investigating a compute-related performance problem using vCenter Operations. Compute can be defined as both physical and virtual processor usage.
7.2. Basic Questions to Ask
After vCenter Operations has identified the performance issue existing within the compute dimension, you next need to ask yourself a number of questions to help identify the root cause.
Is virtual machine configured capacity meeting demand? Are reservations or limits impacting demand? Are there any reported anomalies or change events? Is this the only virtual machine affected? Is the host affected? Is it a chronic issue?
7.3. vCenter Operations Workflow and Analysis
Let’s begin our diagnosis by looking at the machine details regarding demand.
From the indicators above we can confirm the following observations about the virtual machine:
• The virtual machine is demanding 80% of its configured CPU. • Over the last 6 hours, this appears to be happening consistently.

How To Troubleshoot vSphere 5.x Performance Issues Using vCenter Operations VMware, Inc. Page 24 of 38
• Analytics have determined this compute demand is within its normal behavior, also validating it has been happening for some time and the default static threshold of >70% is triggering an alert.
On the same details page, let’s check if reservations or limits are affecting demand by looking at compute in more detail in the right side window.
From the indicators above we can confirm the following observations about the virtual machine:
• Entitlement is 1500Mhz, while configured capacity is 2667 MHz, which identifies a compute limit was set. • Demand is above Entitlement (147%).
We can conclude from all the observations so far that reservations and (or) limits are impacting demand and that, in fact, demand is exceeding configured capacity.
Next, on the same details page, let’s observe the behavior of the virtual machines’ peers by referencing the Related Objects on the same screen.
From the indicators above we can confirm the following observations about the virtual machines’ peers:
• Only this virtual machine is reporting high compute demand. • The parent vSphere host is reporting being Bound By CPU.
We can conclude from these observations that this is not a population problem and its peers are not affected in the same way.
Let’s observe the behavior of the vSphere host compute demand by double-clicking on the workload badge under the related objects.

How To Troubleshoot vSphere 5.x Performance Issues Using vCenter Operations VMware, Inc. Page 25 of 38
From the indicators above we can confirm the following observations about the vSphere host:
• There is only one virtual machine alerting high compute demand. • The physical host compute Demand is far below Usable capacity. • Analytics have determined that current Demand is within the Normal Demand range
We can conclude from all the observations so far that this issue is related only to the virtual machine and not its host.
Navigate back the virtual machine details by double-clicking the yellow compute demand segment representing the virtual machine.
Next, let’s check for reported anomalies by clicking on the anomalies badge:
In this case, there are some anomalies reported but nothing significant in the stack ranked set of metrics.
Next, let’s check for changes to the virtual machine by selecting: OperationsEvents.
(Be sure to select Related Events: Show Self Events button.)
How To Troubleshoot vSphere 5.x Performance Issues Using vCenter Operations VMware, Inc. Page 26 of 38
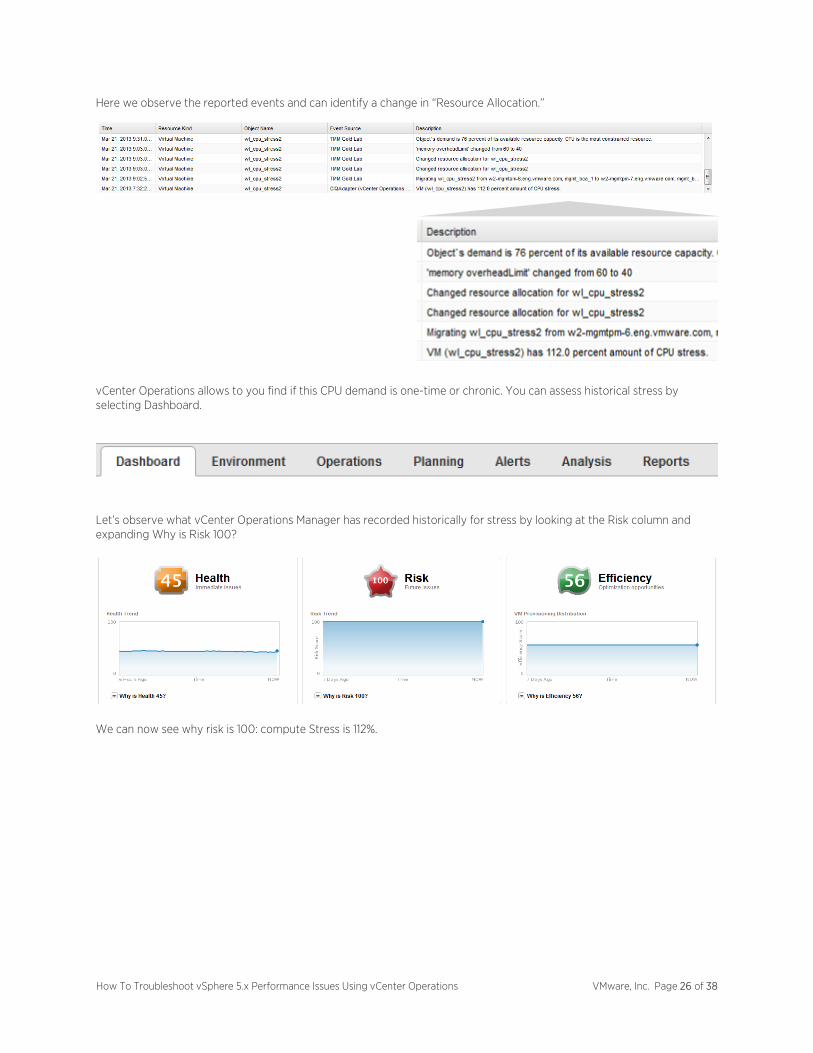
Here we observe the reported events and can identify a change in “Resource Allocation.”
vCenter Operations allows to you find if this CPU demand is one-time or chronic. You can assess historical stress by selecting Dashboard.
Let’s observe what vCenter Operations Manager has recorded historically for stress by looking at the Risk column and expanding Why is Risk 100?
We can now see why risk is 100: compute Stress is 112%.
How To Troubleshoot vSphere 5.x Performance Issues Using vCenter Operations VMware, Inc. Page 27 of 38
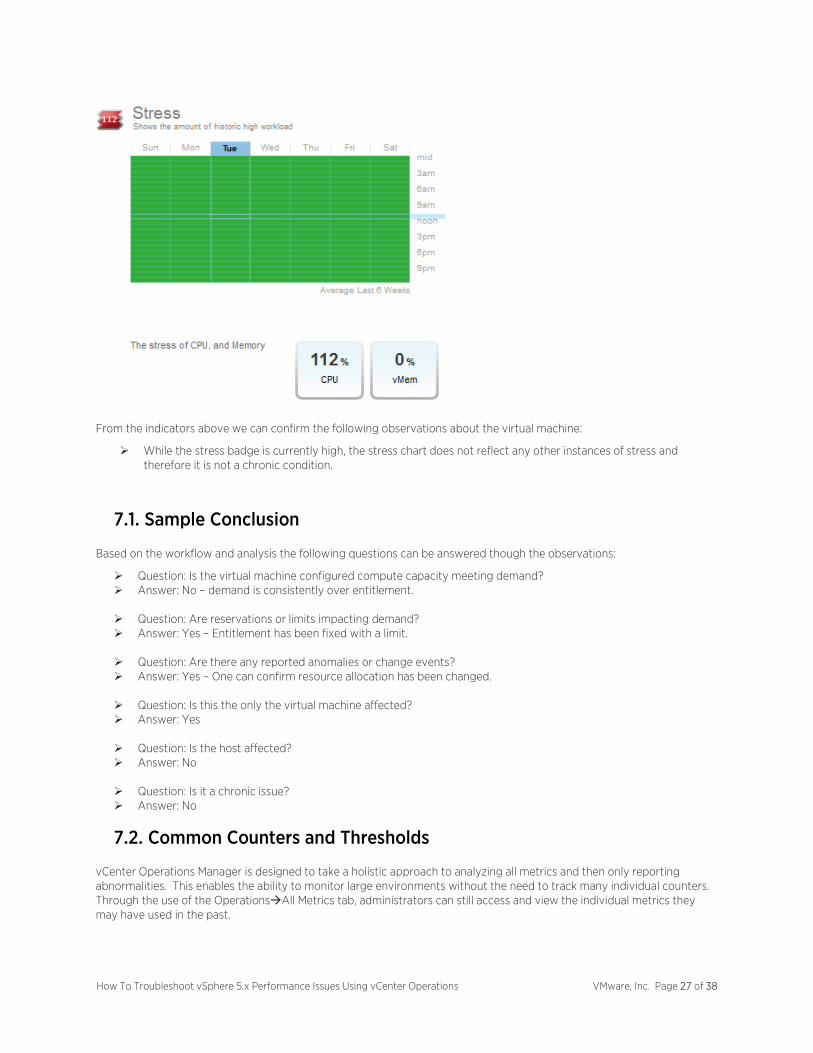
From the indicators above we can confirm the following observations about the virtual machine:
While the stress badge is currently high, the stress chart does not reflect any other instances of stress and therefore it is not a chronic condition.
7.1. Sample Conclusion
Based on the workflow and analysis the following questions can be answered though the observations:
Question: Is the virtual machine configured compute capacity meeting demand? Answer: No – demand is consistently over entitlement.
Question: Are reservations or limits impacting demand? Answer: Yes – Entitlement has been fixed with a limit.
Question: Are there any reported anomalies or change events? Answer: Yes – One can confirm resource allocation has been changed.
Question: Is this the only the virtual machine affected? Answer: Yes
Question: Is the host affected? Answer: No
Question: Is it a chronic issue? Answer: No
7.2. Common Counters and Thresholds
vCenter Operations Manager is designed to take a holistic approach to analyzing all metrics and then only reporting abnormalities. This enables the ability to monitor large environments without the need to track many individual counters. Through the use of the OperationsAll Metrics tab, administrators can still access and view the individual metrics they may have used in the past.
How To Troubleshoot vSphere 5.x Performance Issues Using vCenter Operations VMware, Inc. Page 28 of 38
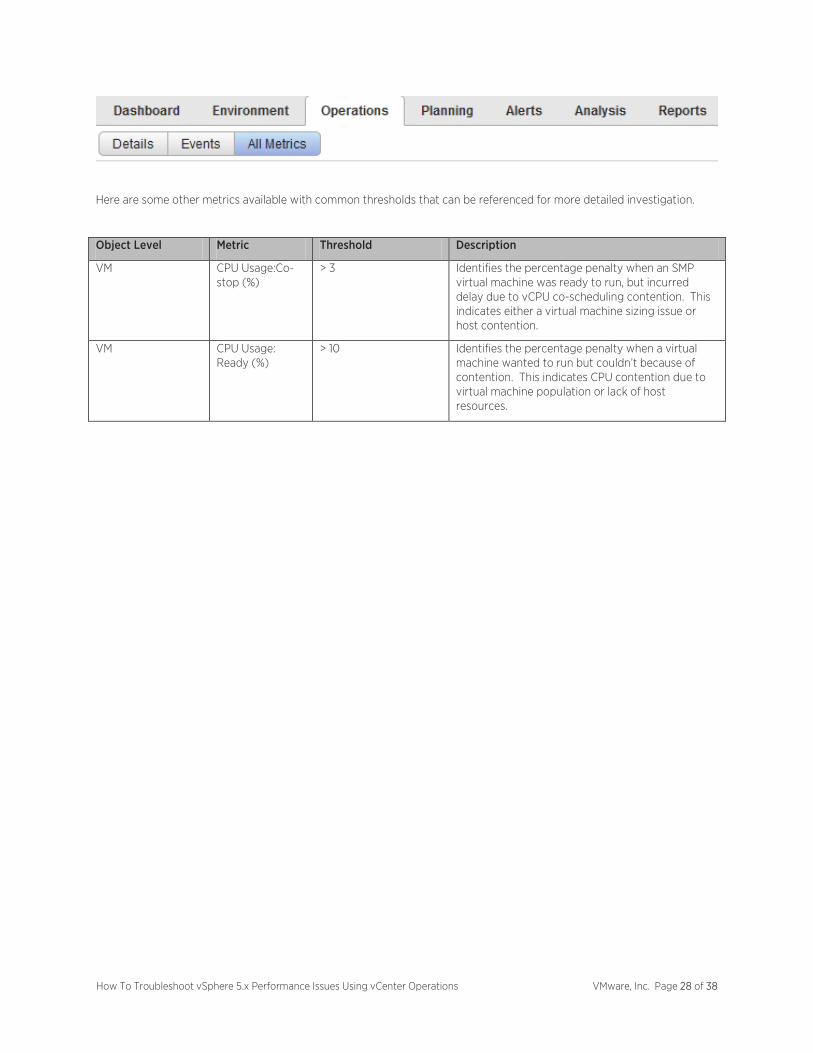
Here are some other metrics available with common thresholds that can be referenced for more detailed investigation.
Object Level Metric Threshold Description
VM CPU Usage:Co-stop (%)
> 3 Identifies the percentage penalty when an SMP virtual machine was ready to run, but incurred delay due to vCPU co-scheduling contention. This indicates either a virtual machine sizing issue or host contention.
VM CPU Usage: Ready (%)
> 10 Identifies the percentage penalty when a virtual machine wanted to run but couldn’t because of contention. This indicates CPU contention due to virtual machine population or lack of host resources.

How To Troubleshoot vSphere 5.x Performance Issues Using vCenter Operations VMware, Inc. Page 29 of 38
8. Troubleshooting Memory 8.1. Overview
This section covers the basic steps for investigating a memory-related performance problem using vCenter Operations.
8.2. Basic Questions to Ask
After vCenter Operations has identified the performance issue existing within the memory dimension, you next need to ask yourself a number of questions to help identify the root cause.
Is configured memory capacity meeting virtual machine demand? Are reservations or limits impacting demand? Are there any reported anomalies or change events? Is this the only virtual machine affected? Is the host affected? Is it a chronic issue?
8.3. vCenter Operations Workflow and Analysis
Let’s begin our diagnosis by looking at the machine details regarding demand.
From the indicators above we can confirm the following observations about the virtual machine:
• The virtual machine is demanding 100% of its configured memory. • Over the last 6 hours, this appears to be happening consistently.

How To Troubleshoot vSphere 5.x Performance Issues Using vCenter Operations VMware, Inc. Page 30 of 38
• Analytics have determined this memory demand is within its normal behavior, as demonstrated by the both the blue ribbon on the workload chart as well as the grey shaded area in the key metrics chart. This helps to validate the problem has been happening for some time and the default static threshold of >95% is triggering an alert.
On the same details page, let’s check if reservations or limits are affecting demand by looking at memory at the virtual machine physical layer. The two layers are tracked and displayed differently as there may be differences between them when advanced memory optimizations, such as transparent page sharing, are active.
From the indicators above we can confirm the following observations about the virtual machine:
• There are no Reserved or Entitlement limits affecting the demand. • Demand is just below the Max Usage (which includes virtual machine overhead) at 97% of Entitlement.
We can conclude from all the observations so far that reservations and limits are not impacting demand and that, in fact, capacity is at demand. Since demand seems to be high consistently, this virtual machine might be suffering from a chronic issue. We’ll confirm this in a later troubleshooting step.
Next, on the same details page, let’s observe the behavior of the virtual machines’ peers by referencing the Related Objects on the same screen.
From the indicators above we can confirm the following observations about the virtual machines’ peers:
• While one peer virtual machine appears to be reporting moderate demand, this in the only virtual machine reporting high memory demand.
• The parent vSphere host is not bound by memory
We can conclude from these observations that this is not a population problem and its peers are not affected in the same way.
Let’s observe the behavior of the vSphere host memory demand by double-clicking on the workload badge under the related objects.

How To Troubleshoot vSphere 5.x Performance Issues Using vCenter Operations VMware, Inc. Page 31 of 38
From the indicators above we can confirm the following observations about the vSphere host:
• There is only one virtual machine alerting high memory demand with a second virtual machine reporting moderate demand.
• The physical host memory Demand is far below Usable capacity. • Analytics have determined that current Demand is within the Normal Demand range
We can conclude from all the observations so far that this issue is related only to the virtual machine and not its host.
Navigate back the virtual machine details by double-clicking the red memory demand segment representing the virtual machine.
Next, let’s check for reported anomalies by clicking on the anomalies badge:
In this case, there are zero reported anomalies, again suggesting that the consistent high memory demand may be typical for this virtual machine.
Next, let’s check for changes to the virtual machine by selecting: OperationsEvents.
(Be sure to select the Related Events: Show Self Events button.)
Here we can observe that the only reported virtual machine change is the demand alarm.

How To Troubleshoot vSphere 5.x Performance Issues Using vCenter Operations VMware, Inc. Page 32 of 38
Last, let’s assess historical stress by selecting Dashboard.
Let’s observe what vCenter Operations Manager has recorded historically for stress by looking at the Risk column and expanding Why is Risk 100?
We can now see why risk is 100: memory Stress is at 100 as well.
From the indicators above we can confirm the following observations about the virtual machine:
It has consistently high demand of its configured memory
How To Troubleshoot vSphere 5.x Performance Issues Using vCenter Operations VMware, Inc. Page 33 of 38
8.4. Sample Conclusion
Based on the workflow and analysis, the following questions can be answered though the observations:
Question: Is virtual machine configured memory capacity meeting demand? Answer: Barely – demand is consistently high.
Question: Are reservations or limits impacting demand? Answer: No.
Question: Are there any reported anomalies or change events? Answer: No
Question: Is this the only virtual machine affected? Answer: Yes
Question: Is the host affected? Answer: No
Question: Is it a chronic issue? Answer: Yes
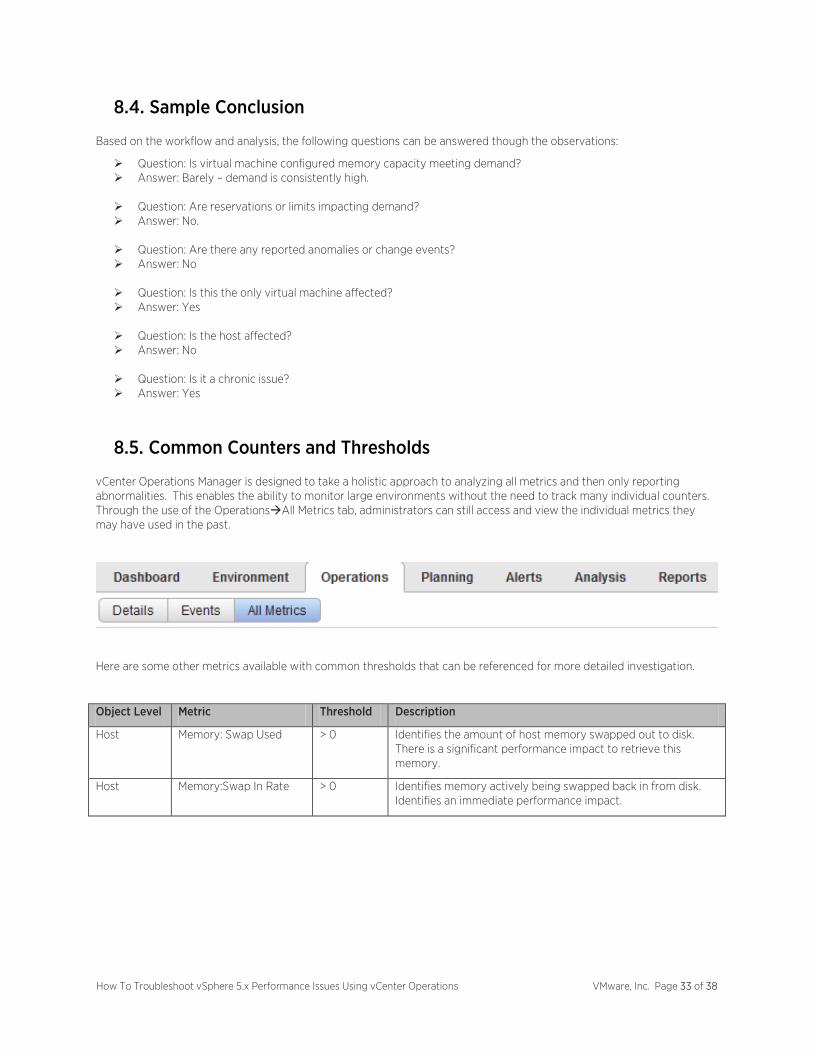
8.5. Common Counters and Thresholds
vCenter Operations Manager is designed to take a holistic approach to analyzing all metrics and then only reporting abnormalities. This enables the ability to monitor large environments without the need to track many individual counters. Through the use of the OperationsAll Metrics tab, administrators can still access and view the individual metrics they may have used in the past.
Here are some other metrics available with common thresholds that can be referenced for more detailed investigation.
Object Level Metric Threshold Description
Host Memory: Swap Used > 0 Identifies the amount of host memory swapped out to disk. There is a significant performance impact to retrieve this memory.
Host Memory:Swap In Rate > 0 Identifies memory actively being swapped back in from disk. Identifies an immediate performance impact.

How To Troubleshoot vSphere 5.x Performance Issues Using vCenter Operations VMware, Inc. Page 34 of 38
9. Troubleshooting Network 9.1. Overview
This section covers the basic steps for investigating a network-related performance problem using vCenter Operations.
9.2. Basic Questions to Ask
After vCenter Operations has identified the performance issue existing within the network dimension, you next need to ask yourself a number of questions to help identify the root cause.
Is the issue throughput-based? Are there any reported anomalies or change events? Is this the only virtual machine affected? Is the host affected?
9.3. vCenter Operations Workflow and Analysis
Let’s begin our diagnosis by looking at the machine details regarding demand.
From the indicators above we can confirm the following observations about the virtual machine:
• The virtual machine is demanding 76% of its configured network capacity. • Over the last 6 hours, this just started to happen.
How To Troubleshoot vSphere 5.x Performance Issues Using vCenter Operations VMware, Inc. Page 35 of 38
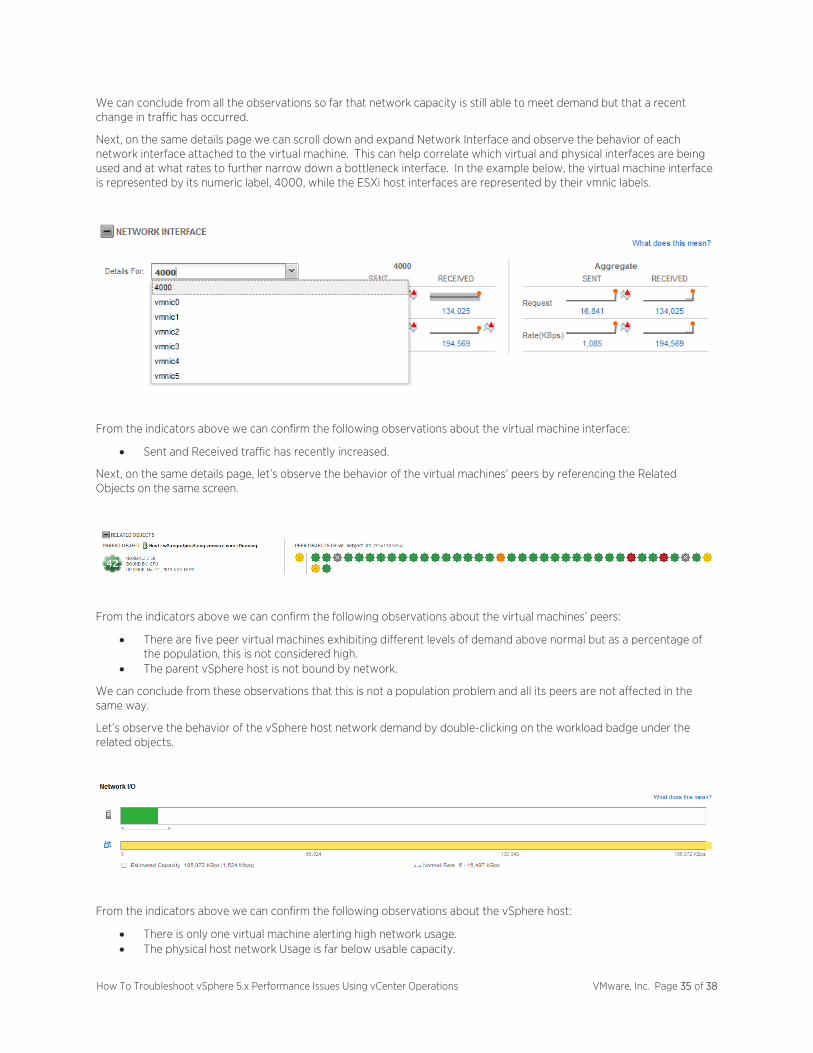
We can conclude from all the observations so far that network capacity is still able to meet demand but that a recent change in traffic has occurred.
Next, on the same details page we can scroll down and expand Network Interface and observe the behavior of each network interface attached to the virtual machine. This can help correlate which virtual and physical interfaces are being used and at what rates to further narrow down a bottleneck interface. In the example below, the virtual machine interface is represented by its numeric label, 4000, while the ESXi host interfaces are represented by their vmnic labels.
From the indicators above we can confirm the following observations about the virtual machine interface:
• Sent and Received traffic has recently increased.
Next, on the same details page, let’s observe the behavior of the virtual machines’ peers by referencing the Related Objects on the same screen.
From the indicators above we can confirm the following observations about the virtual machines’ peers:
• There are five peer virtual machines exhibiting different levels of demand above normal but as a percentage of the population, this is not considered high.
• The parent vSphere host is not bound by network.
We can conclude from these observations that this is not a population problem and all its peers are not affected in the same way.
Let’s observe the behavior of the vSphere host network demand by double-clicking on the workload badge under the related objects.
From the indicators above we can confirm the following observations about the vSphere host:
• There is only one virtual machine alerting high network usage. • The physical host network Usage is far below usable capacity.

How To Troubleshoot vSphere 5.x Performance Issues Using vCenter Operations VMware, Inc. Page 36 of 38
• Analytics have determined that current usage for the ESXi host is within the Normal range
We can conclude from all the observations so far that this issue is related only to the virtual machine and not its host.
Navigate back the virtual machine details by double-clicking the yellow usage segment representing the virtual machine.
Next, let’s check for reported anomalies by clicking on the anomalies badge:
In this case, there are some reported network anomalies in the stack ranked metrics. From the indicators above we can confirm the following observations about the virtual machine:
• It appears to have a high number of local interface receive (Rx) traffic anomalies.
Next, let’s check for changes to the virtual machine by selecting: OperationsEvents
(Be sure to select the Related Events: Show Self Events button.)
Here we can observe the only reported virtual machine change is the usage alarm.
9.1. Sample Conclusion
Based on the workflow and analysis, the following questions can be answered though the observations:

How To Troubleshoot vSphere 5.x Performance Issues Using vCenter Operations VMware, Inc. Page 37 of 38
Question: Is virtual machine configured network usage exceeding configured capacity? Answer: No.
Question: Are there any reported anomalies or change events? Answer: No
Question: Is this the only the virtual machine affected? Answer: Yes
Question: Is the host affected? Answer: No
9.2. Common Counters and Thresholds
vCenter Operations Manager is designed to take a holistic approach to analyzing all metrics and then only reporting abnormalities. This enables the ability to monitor large environments without the need to track many individual counters. Through the use of the OperationsAll Metrics tab, administrators can still access and view the individual metrics they may have used in the past.
Here are some other metrics available with common thresholds that can be referenced for more detailed investigation.
Object Level Metric Threshold Description
Host Network:Received Packets Dropped
> 0 Identifies the number of received packets dropped by the ESXi host. This value can suggest the ESXi host is overloaded and unable to keep up with network processing.
Host Network:Transmit Packets Dropped
> 0 Identifies the number of transmit packets dropped by the ESXi host. This value can suggest the ESXi host is overloaded and unable to keep up with network processing.

How To Troubleshoot vSphere 5.x Performance Issues Using vCenter Operations VMware, Inc. Page 38 of 38
10. Document Information 10.1. References
• Performance Best Practices for VMware vSphere 5.1 http://www.vmware.com/pdf/Perf_Best_Practices_vSphere5.1.pdf
• Best Practices for Performance Tuning of Latency-Sensitive Workloads in vSphere VMs
http://www.vmware.com/files/pdf/techpaper/VMW-Tuning-Latency-Sensitive-Workloads.pdf
• Troubleshooting Performance Related Problems in vSphere 5.0 Environments http://communities.vmware.com/servlet/JiveServlet/download/19166-1-87130/vsphere5-performance-troubleshooting.pdf
• vCenter Operations Manager Getting Started Guide
http://www.vmware.com/pdf/vcops-56-getting-started-guide.pdf
10.2. Change Information
Current Version: How To Troubleshoot vSphere Performance Issues Using vCenter Operations, April 2013
Previous Versions: n/a
10.3. About the Authors
Mark Achtemichuk is a Senior Technical Marketing Architect specializing in Performance within the Cloud Infrastructure Marketing group at VMware. Certified as VCDX #50, @vmMarkA has a strong background in datacenter infrastructures and cloud architectures, experience implementing enterprise application environments, and a passion for solving problems. He has driven virtualization adoption and project success by methodically bridging business with technology. His current challenge is ensuring that performance is no longer a barrier, perceived or real, to virtualizing an organization's most critical applications on their journey to the cloud.
Hemant Gaidhani is a Senior Technical Marketing Architect at VMware responsible for evangelizing VMware's virtualization management products. Hemant has extensive experience in product management and marketing, software development, and performance engineering. Hemant is co-author of the book "Virtualizing Microsoft Tier 1 Applications with VMware vSphere 4" and has been instrumental in developing best practices for several multi-tier enterprise applications in VMware environments. Hemant is a regular speaker at several VMware and other industry trade conferences.
Contains content originally published by:
Chethan Kumar works as a performance engineer at VMware. His focus areas are performance of virtualized databases, storage performance in virtual environments, and performance troubleshooting of applications. Prior to coming to VMware, he worked at Dell on validation, and performance engineering and analysis of Oracle based database solutions.
Hal Rosenberg is a performance engineer at VMware. His focus areas are Java, VDI/terminal services, and performance troubleshooting. Prior to coming to VMware, he has over 10 years of experience working on performance engineering and analysis for hardware and software projects at IBM and Sun Microsystems.
VMware, Inc. 3401 Hillview Ave., Palo Alto, CA 94304 www.vmware.com Copyright © 2013 VMware, Inc. All rights reserved. This product is protected by U.S. and international copyright and intellectual property laws. VMware products are covered by one or more patents listed at http://www.vmware.com/go/patents. VMware is a registered trademark or trademark of VMware, Inc. in the United States and/or other jurisdictions. All other marks and names mentioned herein may be trademarks of their respective companies.