Embed Size (px)
Citation preview

strategies
66
www.tradersonline-mag.com 11.2014
How to trade Breakouts in Forex
the Daily Breakout strategy
It is always the same question for traders of all experience-levels in Forex: Which
strategy achieves the most profi t and which trading system will save the account
in the forex market? We cannot promise the Holy Grail, because it simply does not
exist in trading. But there is a helpful strategy that achieves high profi ts in volatile
market phases: the breakout strategy.
» Simple Approach – Huge EffectBreakouts are best used with the majors, the five major
currency pairs. We use the volatile trading times of the
European and American trading session (8 am until 10 pm
Central European Time) to cover the fundamental events.
The price range that the price shall “break” is formed
from 12 am to 8 am CET and offers the trader the basic
Maite Krausse
Maite Krausse has been interested in the stock markets since taking her degree in business administration. Today she is a professional day trader and is specialised on forex. Her husband and Maite offer professional support to traders – fi nding daily trading signals, analysis and tips.
www.maimarfx.com, [email protected]
Maite Krausse
Maite Krausse has been interested in the stock markets since taking her degree in business administration. Today she is a professional day trader and is specialised on forex. Her husband and Maite offer professional support to traders – fi nding daily trading signals, analysis and tips.
strategies
67
strategies
67
trading approach for the following day at 8 am. This
range is valid for the particular day – you’ll define it again
on the next day and therefore this strategy is useful for
day traders.
The highs until 8 am are the upper border and the
resistance level and the lows are the support levels. If
the price exceeds the high or undercuts the low, the buy
order above the high or the sell order below the low is
executed. The trader does not need to watch the chart the
whole time – we enter pending orders at 8 am for the buy
and sell entries.
As soon as a buy or sell order is executed the trade
is managed all day – we use a 1:2 risk-reward ratio on
quiet days and a risk-reward ratio of 1:4 on economically
important days, for example a Fed decision regarding
interest rates.
We do not risk more than one
or two per cent of trading capital
per trade – in contrast to four or
eight per cent of profit possibility.
Trade management is simple with
an automatic trailing stop of 15 to 25
pips.
EntriesWe observe the price range between
12 am to 8 am CET in the 15-minute
chart. During this time we determine
the highs and lows. We enter two to
five pips above the high or two to
five pips below the low.
Furthermore, we look at support
and resistance levels in the hourly
chart. We determine sell orders
above resistance and sell orders
below support.
ExitsGreed is one of the cardinal sins in
trading. But every trader knows the
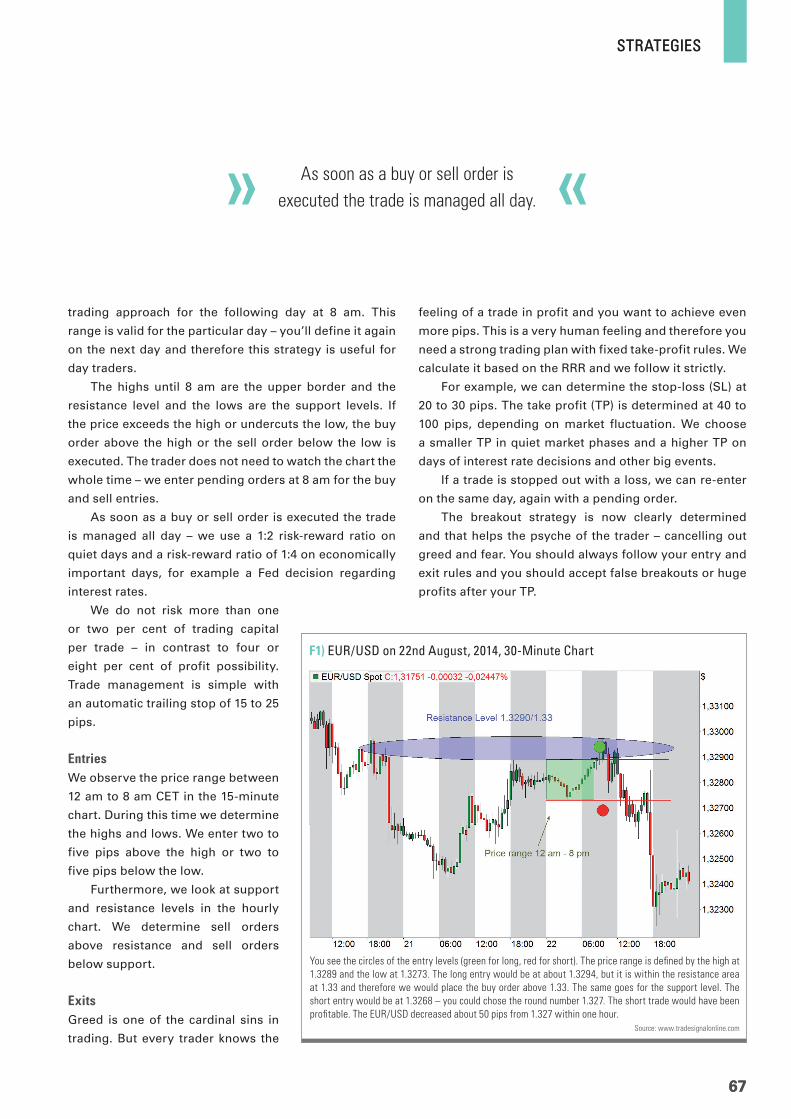
You see the circles of the entry levels (green for long, red for short). The price range is defined by the high at 1.3289 and the low at 1.3273. The long entry would be at about 1.3294, but it is within the resistance area at 1.33 and therefore we would place the buy order above 1.33. The same goes for the support level. The short entry would be at 1.3268 – you could chose the round number 1.327. The short trade would have been profitable. The EUR/USD decreased about 50 pips from 1.327 within one hour.
Source: www.tradesignalonline.com
F1) eUr/UsD on 22nd august, 2014, 30-Minute Chart
feeling of a trade in profit and you want to achieve even
more pips. This is a very human feeling and therefore you
need a strong trading plan with fixed take-profit rules. We
calculate it based on the RRR and we follow it strictly.
For example, we can determine the stop-loss (SL) at
20 to 30 pips. The take profit (TP) is determined at 40 to
100 pips, depending on market fluctuation. We choose
a smaller TP in quiet market phases and a higher TP on
days of interest rate decisions and other big events.
If a trade is stopped out with a loss, we can re-enter
on the same day, again with a pending order.
The breakout strategy is now clearly determined
and that helps the psyche of the trader – cancelling out
greed and fear. You should always follow your entry and
exit rules and you should accept false breakouts or huge
profits after your TP.
As soon as a buy or sell order is executed the trade is managed all day.
strategies
68
www.tradersonline-mag.com 11.2014
and you define the new entries on
the following day.
Breakouts and FakeoutsEvery strategy has its ups and
downs. The breakout strategy works
well during trend phases and volatile
markets, but there are more false
breakouts, so-called fakeouts, during
sideways phases.
Therefore it is important to limit
losses and secure profits by using
trailing stops. If a trade is stopped
out with a loss, we can re-enter a
second time, if the signal appears
again. Of course we again limit our
risk to one to two per cent of our
trading account.
There are days where you think
there are only fakeouts and then it is
wise to stop trading or to minimise
the risk further. Because one thing
is sure: The market never reacts the same, but the next
profitable phase will arrive!
Daily Breakouts with the Highest ProfitsThe highest profit probability is usually coincident with
price developments influenced by
fundamental events. Therefore
it is helpful to take a look at the
economic calendar, because the
biggest moves often occur on
surprises and new information on
the economic situation of a country
and its currency.
Especially interesting are Fed
decisions regarding the interest rates
and protocols. You can raise your TP
to 100 or more pips on such days.
The market includes speculation
and news in the monetary policy of
important currencies in advance.
Therefore, it is very important to get
an overview of the current economic
and political situation and you should
always take a look at the higher time
frame like the 4-hour or daily chart to
recognise primary trends.
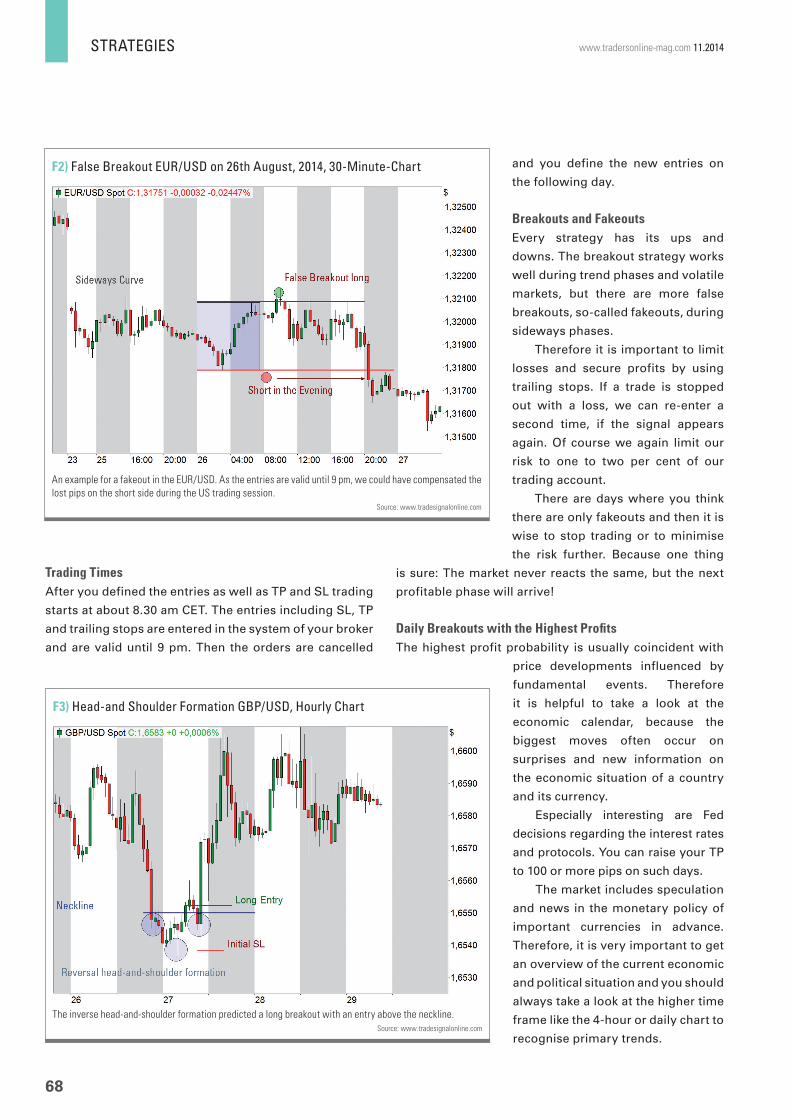
An example for a fakeout in the EUR/USD. As the entries are valid until 9 pm, we could have compensated the lost pips on the short side during the US trading session.
Source: www.tradesignalonline.com
F2) False Breakout eUr/UsD on 26th august, 2014, 30-Minute-Chart
The inverse head-and-shoulder formation predicted a long breakout with an entry above the neckline.Source: www.tradesignalonline.com
F3) Head-and shoulder Formation gBP/UsD, Hourly Chart
Trading TimesAfter you defined the entries as well as TP and SL trading
starts at about 8.30 am CET. The entries including SL, TP
and trailing stops are entered in the system of your broker
and are valid until 9 pm. Then the orders are cancelled
strategies
69
This way you can increase the hit rate in the direction
of the trend. A glance at the chart of the past week
confirms the enormous downtrend-potential – due to
political crisis and speculation about the interest rate
policy of the Fed. You can also enter swing trades of
several days in strong trend phases – but always trail the
stop and take profits!
Evaluation and HelpNot every breakout offers the same profit possibility and
you should be able to evaluate the better possibilities and
the valuable entries. The professional trader uses tools to
help with the decision.
For example breakouts from symmetrical patterns,
like increasing or decreasing triangles, double top/bottom-
and head-and-shoulder formations. If the price formed
such a pattern you should be alert and you should plan
your entries based on these patterns. The intensity of such
Gerald Appel developed the indicator that is very well known
in trading. It calculates two lines. The faster line (MACD-line) is
the difference between the exponentially smoothed moving
average based on the closes, most of the time over a period
of twelve and 26 days. The slower line (signal line) is the
exponentially smoothed 9-period average of the MACD-line.
Most investors trade buy and sell signals at the cross of these
two lines. The difference between the lines can be displayed
in the MACD-histogram.
Moving Average Convergence Divergence (MACD)
the December issue of traDers´ will be published on 27th November 2014.
Preview of the next issue
the sorrows of Young traderYou probably heard about some great success stories of traders
that doubled or tripled their accounts in no time, or even became
Market Wizards. But what about the path of getting there? What
about the path of becoming good enough? Today Maite Krausse
of MaimarFx.com will tell a fi ction backstory. A backstory that’s
happening way more often, but which is rarely if ever told.
interview Jens rabeIn the current November issue, we’re publishing a
cover story about options trading written by Jens
Rabe of r2fag.com. Marko Graenitz went to interview
him in his trading room. Stay tuned for some insights
to how he managed to shift his career from selling
insurance to professionally writing options for a living.
PEOPLECOVERSTORY
breakouts is often stronger if a pattern formed on a higher
timeframe (for example on the daily or 4-hour chart).
Another way to identify breakout chances is to
recognise certain candle patterns on the daily chart.
For example the inside-bar candle is a very popular
strategies
70
www.tradersonline-mag.com 11.2014
pattern for predicting a breakout in
trend direction or as a reversal. An
inside-bar formation is confirmed, if
the following daily candle with the
contrary colour (day 2) has its high
and low within the range of the prior
daily candle (day 1). The entry on day
3 is above/below the high/low of the
second daily candle.
There are countless other
methods for rating the strength
of a breakout, for example based
on the RSI (Relative Strength
Index) or MACD (Moving Average
Convergence Divergence). If the
MACD-histogram is small and has
short bars, the momentum is low
and the breakout may not have much
strength. If the MACD-histogram is
large it induces a strong momentum
and therefore the probability of a
strong breakout is high.
It is important to focus on strong price developments
and to ignore small details. The trader has to follow his
rules and must not try to predict the price. Because one
day the market acts logically for the disciplined trader,
but on the next day it may react totally illogically.
ConclusionTrading breakouts is a strategy that many traders use
and it delivers good results for swing trading as well as
day trading. The best results are achieved during volatile
market phases or strong trends – indecision of market
participants most of the time results in a low hit rate.
If you can identify breakouts, there is a good possibility
of getting high-quality entries and to swim with the “big
fishes”. The trader will not miss a trade and he will achieve
good profits in big trends and strong movements. «
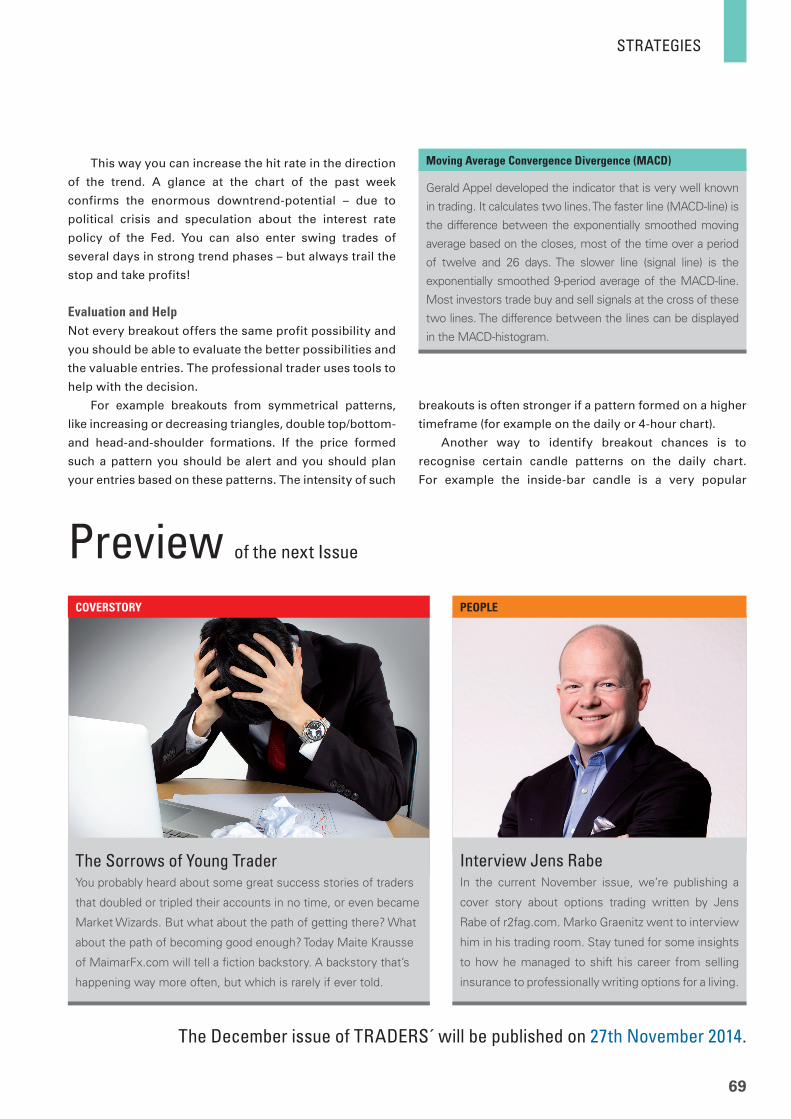
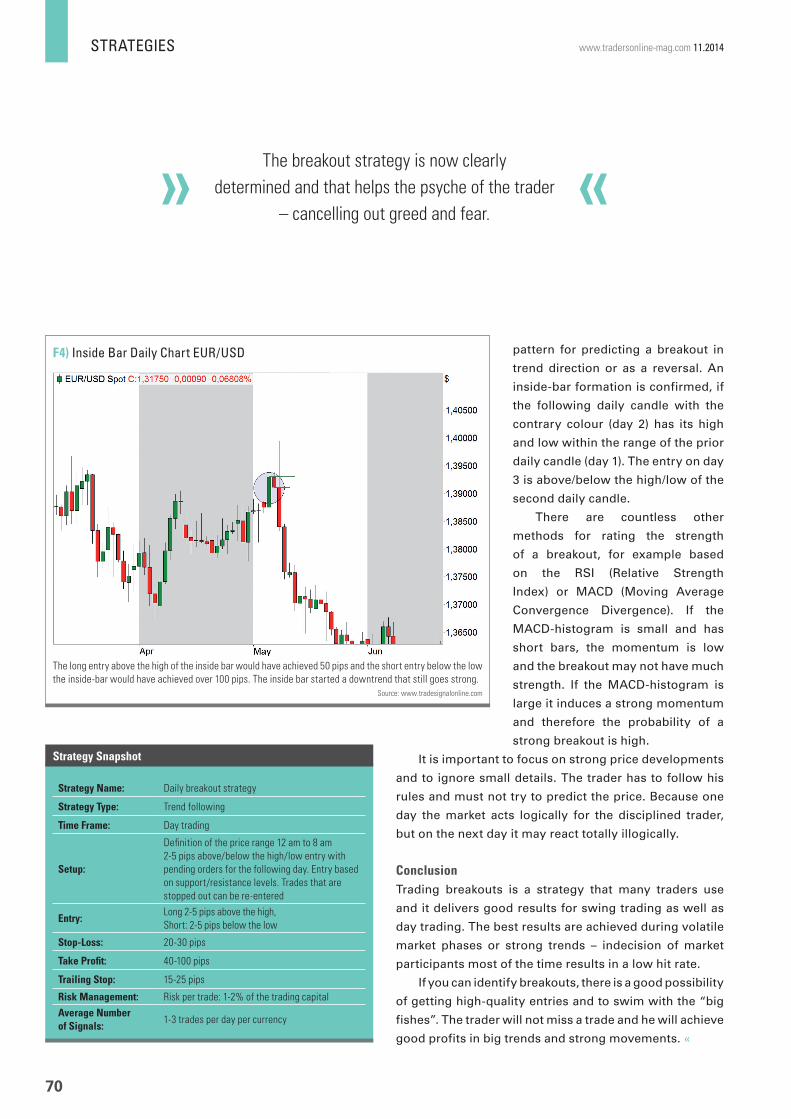
The long entry above the high of the inside bar would have achieved 50 pips and the short entry below the low the inside-bar would have achieved over 100 pips. The inside bar started a downtrend that still goes strong.
Source: www.tradesignalonline.com
F4) inside Bar Daily Chart eUr/UsD
Strategy Name: Daily breakout strategy
Strategy Type: Trend following
Time Frame: Day trading
Setup:
Definition of the price range 12 am to 8 am 2-5 pips above/below the high/low entry with pending orders for the following day. Entry based on support/resistance levels. Trades that are stopped out can be re-entered
Entry: Long 2-5 pips above the high, Short: 2-5 pips below the low
Stop-Loss: 20-30 pips
Take Profit: 40-100 pips
Trailing Stop: 15-25 pips
Risk Management: Risk per trade: 1-2% of the trading capital
Average Number of Signals:
1-3 trades per day per currency
Strategy Snapshot
The breakout strategy is now clearly determined and that helps the psyche of the trader
– cancelling out greed and fear.