Embed Size (px)
Citation preview
MENDEL UNIVERSITY
Faculty of Regional Development and International Studies
International Territorial Studies
How to Support the Convergence of Socioeconomic Indicators
in Provinces of Indonesia?
Diploma Thesis
Author: Bc. Veronika Jeţková
Supervisor: Ing. Zbyšek Korecki, Ph.D.
Brno 2016


DECLARATION
I declare that I carried out this thesis independently, and only with the cited sources, literature
and other professional sources.
I agree that my work will be published in accordance with Section 47b of Act No. 111/1998
Coll. on Higher Education as amended thereafter and in accordance with the Guidelines
on Publishing University Student Theses.
I understand that my work relates to the rights and obligations under the Act No. 121/2000
Coll., the Copyright Act, as amended, in particular the fact that Mendel University in Brno
has the right to conclude a license agreement on the use of this work as a school work
pursuant to Section 60 paragraph 1 of the Copyright Act.
Before closing a license agreement on the use of my thesis with another person (subject)
I undertake to request for a written statement of the university that the license agreement
in question is not in conflict with the legitimate interests of the university, and undertake to
pay any contribution, if eligible, to the costs associated with the creation of the thesis, up to
their actual amount.
In Brno, 22. 12. 2016
……………………………………………………..
Bc. Veronika Jeţková

AKNOWLEDGEMENT
I would like to express words of gratitude to my supervisor Ing. Zbyšek Korecki, Ph.D. for his
advices, help and patience throughout the writing of the thesis. My acknowledgement also
belongs to my family, friends and my life mentor for unlimited support and continuous
encouragement.
ABSTRACT
The thesis looks for the answer to the question how to support the convergence of
Socioeconomic Indicators in Provinces of Indonesia. Together with literature review, the
analytical part concerns the regional disparities and convergence of socioeconomic indicators
in given period from 2010 to 2015. The analytical contains the analysis of beta-convergence
calculated by regression line and the analysis of sigma-convergence computed on the base of
standard deviation change throughout the years. All this implies in proposal part where the
suggestion to continuous convergence are specified: sustainable development, human
development, capital mobility, labour force mobility.
Keywords: Indonesia, provinces, convergence, socioeconomic indicators, regional
disparities, analyses
ABSTRAKT
Závěrečná práce hledá odpověď na otázku jak prohloubit konvergenci v rámci
socioekonomických indikátorů v provinciích Indonésie. Společně s literární rešerší se
analytická část věnuje regionálním rozdílům a konvergenci socioekonomických indikátorů v
průběhu stanoveného období 2010 aţ 2015. Analytická část obsahuje analýzu beta-
konvergence počítanou na základě regresní křivky a analýzu sigma-konvergence, která
kalkuluje změnu směrodatné odchylky v průběhu časového období. Tyto analýzy vyplývají v
návrhovou část, ve které je navrţena soustavná nepřetrţitá konvergence na základě:
dlouhodobě udrţitelného rozvoje, lidského rozvoje, mobility kapitálu a mobility pracovní síly.
Klíčová slova: Indonésie, provincie, konvergence, socioekonomické indikátory, regionální
rozdíly, analýzy
TABLE OF CONTENT
1. INTRODUCTION ..............................................................................................................1
2. OBJECTIVES ....................................................................................................................3
3. METHODOLOGY .............................................................................................................4
4. LITERATURE REVIEW ...................................................................................................6
4.1 REGION .......................................................................................................................6
4.2 REGION CLASSIFICATION .......................................................................................7
4.2.1 Regions according to partial sectors .......................................................................8
4.2.2 Regions according to methodology.........................................................................9
4.2.3 Regions according to taxonomy .............................................................................9
4.2.4 Regions according to structure ...............................................................................9
4.3 REGIONAL DEVELOPMENT................................................................................... 10
4.4 REGIONAL DISPARITIES ........................................................................................ 12
4.5 REGIONAL DISPARITIES MEASUREMENT AND EVALUATION ...................... 15
4.5.1 Method based on scaling technique ...................................................................... 15
4.5.2 Traffic-lights method............................................................................................ 16
4.5.3 Average deviation method .................................................................................... 16
4.5.4 Point-by-point method.......................................................................................... 16
4.5.5 Standardize variable method................................................................................. 17
4.6 CORRELATION ........................................................................................................ 18
4.7 CONVERGENCE ....................................................................................................... 19
4.7.1 Beta-convergence ................................................................................................. 20
4.7.2 Sigma-convergence .............................................................................................. 20
4.8 INTEGRATED INDICATORS ................................................................................... 21
4.8.1 Gross Regional Domestic Product (GRDP) .......................................................... 21
4.8.2 Human Development Index (HDI) ....................................................................... 23
4.8.3 Poverty Gap Index ............................................................................................... 25
4.8.4 Unemployment ..................................................................................................... 27
4.8.5 Net Migration ....................................................................................................... 28
4.8.6 Foreign Direct Investment (FDI) .......................................................................... 29
5. ANALYTICAL PART ..................................................................................................... 31
5.1 INDONESIA ............................................................................................................... 31
5.1.1 Indonesian Economic Overview ........................................................................... 32
5.1.2 Indonesian Population Overview .......................................................................... 33
5.2 INDONESIAN PROVINCES ..................................................................................... 35
5.3 CONVERGENCE OF INTEGRATED INDICATORS ............................................... 40
5.3.1 Basic Statistics ..................................................................................................... 40
5.3.2 Correlation Matrix................................................................................................ 42
5.3.3 Beta-Convergence Analysis ................................................................................. 43
5.3.4 Sigma-Convergence Analysis ............................................................................... 52
6. PROPOSAL PART........................................................................................................... 55
6.1 SUSTAINABLE GROWTH ....................................................................................... 55
6.2 PROMOTING OF HUMAN DEVELOPMENT .......................................................... 57
6.3 PROMOTING OF CAPITAL MOBILITY .................................................................. 59
6.4 PROMOTING OF MOBILITY OF LABOUR FORCE ............................................... 61
7. CONCLUSION ................................................................................................................ 63
8. LIST OF ACRONYMS .................................................................................................... 65
9. LITERATURE REFERENCES ........................................................................................ 66
10. INTERNET REFERENCES ........................................................................................... 72
11. LIST OF FIGURES ........................................................................................................ 77
12. LIST OF TABLES .......................................................................................................... 78
13. APPENDIXES................................................................................................................ 79
APPENDIX 1: Explanatory Notes to Equations ................................................................ 79
APPENDIX 2: Initial Data ................................................................................................ 81
APPENDIX 3: Sigma-convergence Graphs ....................................................................... 85
1
1. INTRODUCTION
Regional inequality has become an issue of academic research and policy debate. From
the point of encouraging of globalization and internalization, the government and non-
government organizations have an interest in decreasing the regional disparities
and straightening of the entire world population.
It is almost twenty years, Indonesia has become a decentralized country and the discussion
about the change of system has been positive as well as negative. Decentralization happened
over/on the base of the fact that Indonesia had been going through the Asian Financial Crisis
that time. The fact is that Indonesian provinces are various in meaning of geographic
conditions, natural resources, structures of agriculture, industry and services, with a plenty of
ethnic representation and different conditions of all types of infrastructure.
Nowadays, Indonesia is the most fast growing economy among ASEAN member countries
and has a high potential in many spheres of business. Even though, there are the remote
provinces that are still untouched by tourism and industry, provinces with low population
density, highly forested areas and at the same time provinces which are attached to civil wars
and armed conflicts or big cities and islands full of high technologies where the direct
investments flow constantly.
Those are reasons why the thesis concerns the regional disparities, measurement of disparities
and seeks for answers to question: “How to Support the Convergence of Socioeconomic
Indicators in Provinces of Indonesia?”. The partial analyses give the leads to the overall
picture of socioeconomic standard within Indonesia and set a direction to suggestions how to
promote the convergence in the country. Measuring of the changes in inequality helps to
determine the effectiveness of policies and to generate the data that necessary use inequality
as an explanatory variable in policy analysis. Inequality becomes an important matter if the
level is too high since it becomes one factor that can cause the social unrest, especially in
countries with stronger economic growth and lower poverty rate.
From the point of decentralization change in Indonesia, many various analyses and research
are available. Majority of them are considered to inequalities of GDP and economic
conditions. In contrary, the thesis roofs the economic indicators together with social indicators
2
and evaluates them with the same weight and importance. In spite of this, the thesis has few
limits which will be restricted thanks to analytical tools.
Firstly, the correlation of indicators will be verified, as the double of indicators with very high
correlation is not desirable for the sake of the thesis. Secondly, Indonesian Statistic Office
provided the primary data in order on analysis. However some of the data was published in
Indonesian Rupiah and some of the data is missing. For higher transparency and more suitable
data management, the data are recounted to US dollars according to average exchange rate.
The missing data are replaced by mean, or not considered at all. Furthermore, migration is a
part of important factor of socioeconomic state of development thus it is taken into account.
In order of thesis it is subsequently divided into two sub-indicators of immigration and
emigration. Even thought, the migration indicators do not correspond to the geographical size,
population size and density and other relatives, and are robust characteristics connected to
capital mobility.
The thesis follows the structure of the literature review, analytical part and proposal part. The
review considers the theoretical level of regional disparities together with the outline of
integrated indicators. The analytical part serves the results of convergence analysis and builds
the basement for proposal part where the socioeconomic situation is evaluated and subjective
support of regional convergence is suggested.
3
2. OBJECTIVES
The thesis sets a target to assess development of individual Indonesian provinces on the base
of general and specific scientific methods and finally, the suggestion how to support the
convergence of regional disparities and possibly use the variance of disparities for specific
provinces. The practical part follows the theoretical part of the thesis, where the general
phenomenon, procedures of analysis and integrated indicators are introduced and their
fundamental theories are described. Establishing of the most convergent indicators, that have
eliminated their variation in individual provinces throughout the time, provide the foundation
for the Proposal Part. Suggestions that would point to sustainable convergence or would
improve the inequality among Indonesian provinces are stated in Proposal Part. The chapter
focuses to sustainable growth of socioeconomic indicators, promoting of labour force
mobility and capital mobility, improving of human development regarding education and
health care, and employment. Also, it suggests how to overcome the disparities caused by
geographical factors and uses the natural regional dissimilarity.
Before the determination of propositions, how to course the growth of diverging
socioeconomic indicators, if so, the thesis must found the following partial goals:
1) Calculating the basic statistical methods and correlation between integrated indicators
to find out the specificities about the dataset
2) Assuming whether the Indonesian provinces point to convergence on the base of
statistical procedures of beta-convergence for each individual integrated indicator,
3) Subsequently, computing of variance for each individual integrated indicator
throughout the given period
4) Calculating the sigma-convergence and percentage of convergence/divergence speed
5) Decide whether sigma-convergence support beta-convergence, or whether the
calculated convergence is significant
4
3. METHODOLOGY
In order of thesis, number of various professional, scientific and methodological publications
and articles are used. Most of the literature is written in English and published by
international organizations, research institutes and faculties studying phenomena of regional
disparities and methods of convergence. The foundations for analysis are drawn from data of
the Indonesian Statistical Offices.
The Literature review serves an overview of knowledge from the primary and secondary
literature sources of regionalism, regional development and regional disparities. An effort is
to articulate the general definitions of regions as a fundamental and key concept of regional
development. Secondly, the review looks into detail to the scientific methods of measurement
and evaluation of regional disparities, for the sake of the thesis, the analysis of convergence is
considered. Regarding to general definitions and measurement methods, the part explains the
equations of factors and phenomena to introduce the mathematic outline. The explanatory
notes to equations are further attached in Appendix 1. Finally, the literature review thoroughly
introduces the integrated indicators that are used as variables throughout analysis
subsequently.
The Analysis part familiarizes Indonesia as a country of subject, its economic overview and
details about population since these information is necessary as a springboard for the research
work. Afterwards, this part outlines the characteristics of analyzed dataset, respectively the
basic statistics methods of variance, standard deviation, skeweness, kurtosis and correlation
matrix of integrated indicators, etc. The basic statistical methods are used for appropriate
interpretation of data composition and better orientation in analysis´ output. In order to
analysis, indicator of GRDP has been recalculated from Indonesian rupiah to US dollars.
Inferior calculation of geometric mean and secondary computing of improvement of 34 cases
(province) throughout the given period 2010 – 2015 is provided in Microsoft Excel 2010.
Furthermore, the convergence analysis is found in the chapter of Analytical Part. The analysis
has three general objectives. With application of STATISTICA Software, the dataset is
analyzed for beta-convergence trend occurrence. Further question is whether sigma-
convergence supports the results of beta-convergence and if so, calculation of
improvement/deterioration is announced in regard to reduction of regional disparities. The

5
graphical outputs of beta-convergence are found in text as the interpretation of results relies to
regression line of scatter plot. The graphical results of sigma-convergence are attached in
appendix as the final scores may be seen in text.
The Proposal part stands on the foundation of previous scientific researches that are
concentrated to regional disparities and supporting of convergence. The surveys and studies
from which the inspiration of proposal part flows are worked for Indonesian provinces and are
published by international and Indonesian universities, international organizations and
Indonesian Bank.
6
4. LITERATURE REVIEW
4.1 REGION
First notion of the composition is known from the ancient times when the foundations for the
word as itself had been laid. Very likely, “regio” in the meaning of boarders or landscape has
been united with the “regnum” which means the establishment of the power over land.
(Krejčí, 2011) Other sources tend to continual development of “regere” world (which means
to rule) into “regio” world and in figurative sense it had the same impact to determination of
territory by power. (Klapka & Tonev, 2008)
Regions are still geographic or political objects that are described on the basis of diverse
conclusions as mutually dissimilar parts of geographic sphere that are smaller than the overall
area of analysis´ interest (world, continent, state, mountain range) but at the same time are
bigger than the specific place (every region is a part of superior spatial unit and contains
subordinate units). From the analytical point of view, regions are the most logic way of
organization of geographic information and play a role of valid sphere for chosen criterion.
(Klapka & Tonev, 2008)
The meaning of the region concept represents various forms of interpretation and academic
definitions. The presentation of the term comes with the general presentation or – on the other
hand – is specified very tightly. (Krejčí, 2011) Generality that is connected with vagueness
does not performance the sufficient answers to the questions of the regionalist exploratory.
Especially, under the development of economy and practical usage of regionalism the
different theories of region have been constructed.1
Klapka & Tonev (2008) describe that within two last centuries four approaches have been
settled to understand the form of region. Deterministic approach classifies the regions as
social, economic and cultural units that diverse by their natural conditions. At the same time,
the natural potential is crucial for development of specific economic activity. Possibilistic
1 As an example of the advanced theories of region, Wokoun (2001) highlights authors as following: Walter
Christaller (1933) and Adam Lösch (1940) who progressively worked out the Theory of Central Place Hierarchy
– one of the most influential theories of theoretical geography and theoretical spatial economic analysis; Nikolaj
Kolosovsky who presented the Theory of Territorial Production Complex in which the economic divisions are
delivered into regions intentionally in the course of planned economy. (Wokoun, 2001)
7
approach sees each region as a unit of unique qualities that outcomes on the base of natural
and socio-economic interaction. This implies in complexity of approach. Indeterministic
approach follows the possibilism, however, deny the relationship of socioeconomic system
with nature. This approach concerns these components as independent to each other in
process of developing. Postmodern approach – understands region as a social construction
which has a subjective disposition. The approach distinguishes the perception of individuality
of region for particular groups that have various traditions and habits (state, community, etc.).
In contrary to other approaches, the postmodernism supports to reveal the common issues
across the regions.
According to Hudec and his concept in the context of system, the region is a spatial complex
of the open and dynamic systems with high number of components. These components have a
various quality and relations, structures, and have a plenty of diverse characteristics,
respectively attributes. (Hudec, 2009) Krejčí extends this theory by addition of actors who
performance the interaction and put forward the assumptions of regions (Krejčí, 2011, p. 116).
Krejčí concerns the region as an outcome of regionalist processes as abstraction and
construction. On the base of regional policy, the region is the district where the territorial
policy comes into implementation and realization. Thus, it is a subject that roofs the
cooperation of municipalities (e.g. voluntary beam of municipalities). Eventually, from the
geographic point a region is a complex which is determined by landscape differentiation.
Therefore, the above mentioned explains region as a more less bounded, difficult, dynamic
and spatial system, which was settled as a result of social activity of natural and
socioeconomic phenomena and processes, and which shows the specific type of
organizational unit so it differs from the other regions.
4.2 REGION CLASSIFICATION
The general meaning of region serves greatly wide foundation for the most of analytical
reasons. Thus the classification needed to be carried on the base of specific criterions. The
classification is used for identification of the significant types of regions. According to
Klapka & Tonev (2008), there is sorting of regions due to four specific attitudes shown in the
Figure 1 below.
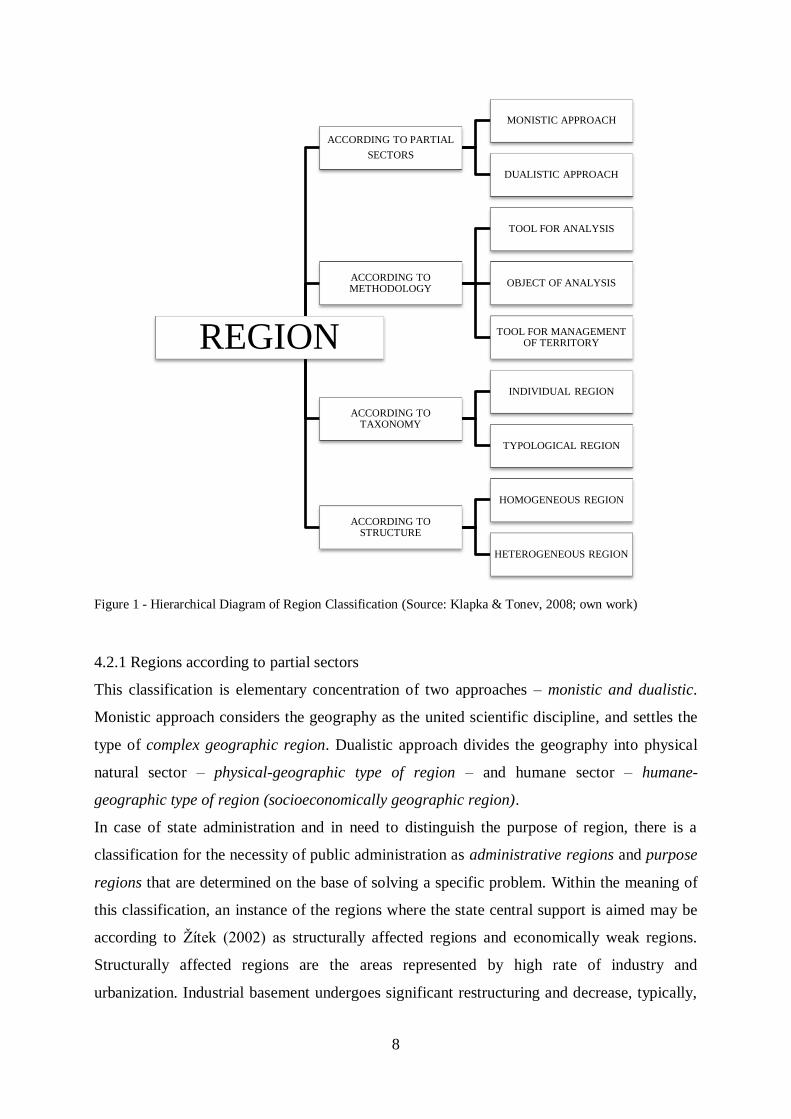
8
Figure 1 - Hierarchical Diagram of Region Classification (Source: Klapka & Tonev, 2008; own work)
4.2.1 Regions according to partial sectors
This classification is elementary concentration of two approaches – monistic and dualistic.
Monistic approach considers the geography as the united scientific discipline, and settles the
type of complex geographic region. Dualistic approach divides the geography into physical
natural sector – physical-geographic type of region – and humane sector – humane-
geographic type of region (socioeconomically geographic region).
In case of state administration and in need to distinguish the purpose of region, there is a
classification for the necessity of public administration as administrative regions and purpose
regions that are determined on the base of solving a specific problem. Within the meaning of
this classification, an instance of the regions where the state central support is aimed may be
according to Ţítek (2002) as structurally affected regions and economically weak regions.
Structurally affected regions are the areas represented by high rate of industry and
urbanization. Industrial basement undergoes significant restructuring and decrease, typically,
REGION
ACCORDING TO PARTIAL
SECTORS
MONISTIC APPROACH
DUALISTIC APPROACH
ACCORDING TO METHODOLOGY
TOOL FOR ANALYSIS
OBJECT OF ANALYSIS
TOOL FOR MANAGEMENT OF TERRITORY
ACCORDING TO TAXONOMY
INDIVIDUAL REGION
TYPOLOGICAL REGION
ACCORDING TO STRUCTURE
HOMOGENEOUS REGION
HETEROGENEOUS REGION
9
with high rate of unemployment. Economically weak regions represent the areas familiar for
low life standard, high employment rate within primary sector, low population density, low
unemployment rate, on the other hand there is acceptable environmental standard.
Respectively, rural regions with low rate of urbanisation and economic development account
here.
From the economic development point of view, general classification is represented by three
types of region. The growth regions built new segments of industry and services which is
supported by the growth of population and migration. In the stagnate regions, economic
development is not significant in contrary to actual structure. The problematic regions usually
show long-time low economic performance or contain more unfavourable socioeconomic
phenomenon.
4.2.2 Regions according to methodology
Methodological viewpoint clarify the purpose of the region classification. Regions are used as
a tool for analysis, where region plays the role of complex statistical unit, object of analysis,
where the determination of region is the output of analysis, or tool for management of
territory, where the strategic/regulating plan for region is settled and the plan of development
is in place. (Klapka & Tonev, 2008)
4.2.3 Regions according to taxonomy
Taxonomy classification works with the exact geographic location of region. The individual
regions are determined on the base of specific characteristics and marks and commonly have
own name (e.g. the Himalayas, the Maghreb, etc.). Therefore, the individual region is unique
and cannot be repeated in any geographical material.
The typological regions are more numerous and repeatable. These regions are determined by
common characteristic (e. g. any nature park, regions containing high share of men
population).
4.2.4 Regions according to structure
The structure of region is one of the most significant properties of region. Interpretation of
Johan Heinrich von Thühen and Alfred Weber or German geographer Hans H. Blotevogel
refers to two types of region according to their structures. (Krejčí, 2011) Homogeneous region
10
is characterized by the identical attributes within the whole area. It is favourable to search for
the criterion of homogeneity and for the types of interrelationship between landscape spheres.
Commonly, the homogeneous regions represent the physical geography rather than the
socioeconomic geography. (Wokoun, 2001)
Heterogeneous region are united in the internal structure/organizational relations. It is
composed by nodal centres and peripheries which are connected with centres via flows and
lines. Heterogeneous region requires for interrelationship among components of landscape
spheres. This regionalism determinates the mutually active spatial elements, flows of material,
energy, information which act as linkage. At the same time it describes the position of these
elements within the hierarchical scale of system. (Wokoun, 2001)
4.3 REGIONAL DEVELOPMENT
In order to establish theories, the former movement that studied regions and tried to
implement existence of unsubstantial disparity and name the uniqueness of individual region
was regionalism. At the same time, regionalism endeavored to deal with cultural and ethnic
emancipation of regions on the beginning of 20th
century (after the World War I). Besides the
social issues, the movement searched for administrative (municipal), economic and cultural
concerns. (Krejčí, 2011) Simultaneously, the precondition of classical economic theories
about renovation of economic balance seemed to be unfilled. Thus the analysis of the causes
of diversification and looking for solution in reducing the disparities induced in the forming
of regional policy. (Ţítek, 2002)
The strategy of regional development2 according to OECD (2016) is in meaning of a broad
term but can be seen as a general effort to reduce regional disparities by supporting economic
activities in regions.
According to Stejskal & Kovárník (2009) the term of regional development is understood as a
complex growth of socioeconomic potential and standard of region. The activity of local
regional potential and rising of competitiveness is purposeful and strategically aimed effort of
2 The development can be understood as the process of changes which are held progressively and which bring
the higher efficiency and utility in terms of using the sources and realizing of possibilities from the initial state
towards desirable state. (Macháček, 2011)
11
local participants that is oriented to improvement of social, economic and environmental
(overall) quality of living.
The phenomena of reducing regional disparities and the rising of regional competiveness are
obviously staying in contradiction to each other. Practically, the regional development could
be divided into two general groups in which the criterions are delimiting or – on the other
hand – partially overlapping.
First group is so-called convergent group. The theories of regional balance are covered in this
group and authors tend to the hypothesis that regional development improves the disparities
among regions. Secondly, the group of divergence supports the hypothesis that development
on the level of regions broads the interregional disparity and affect the natural balance. The
classification needs to be taken only in the general account and goes in line with the trends in
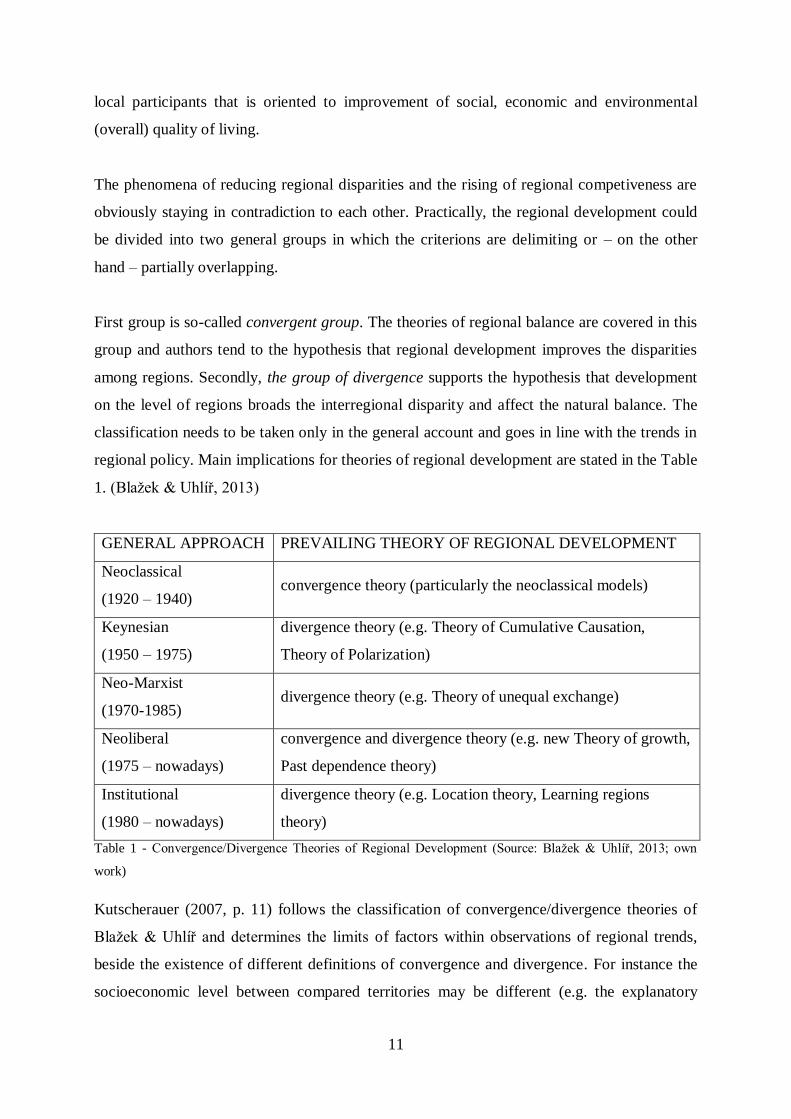
regional policy. Main implications for theories of regional development are stated in the Table
1. (Blaţek & Uhlíř, 2013)
GENERAL APPROACH PREVAILING THEORY OF REGIONAL DEVELOPMENT
Neoclassical
(1920 – 1940) convergence theory (particularly the neoclassical models)
Keynesian
(1950 – 1975)
divergence theory (e.g. Theory of Cumulative Causation,
Theory of Polarization)
Neo-Marxist
(1970-1985) divergence theory (e.g. Theory of unequal exchange)
Neoliberal
(1975 – nowadays)
convergence and divergence theory (e.g. new Theory of growth,
Past dependence theory)
Institutional
(1980 – nowadays)
divergence theory (e.g. Location theory, Learning regions
theory)
Table 1 - Convergence/Divergence Theories of Regional Development (Source: Blaţek & Uhlíř, 2013; own
work)
Kutscherauer (2007, p. 11) follows the classification of convergence/divergence theories of
Blaţek & Uhlíř and determines the limits of factors within observations of regional trends,
beside the existence of different definitions of convergence and divergence. For instance the
socioeconomic level between compared territories may be different (e.g. the explanatory
12
power of factor is various for developing countries in comparison to developed countries) and
the level of reliability and comparability of the dataset may differ. In addition, there are
subjective differences in the spheres that are just difficult to quantify, but still have a
significant impact to regional development (differences in social-functioning phenomenon –
prestige, fame, power, etc.). Character of used indicators is relevant, aggregate indicators and
partial indicators need to be distinguished and the aspect of absolute or relative monitoring of
territorial disparities must not to be overlooked. Another limit can be removed by emphasis to
selection of areas and specific factors that reflect the development of regional disparities as
various indicators have diverse representativeness in capturing the regional trends.
Simultaneously, the developmental paradigm is specific for each period which is connected
with various fashionable indicators. The length of period is important in terms of convergence
trends – the period in which an analysis is carried out and the length of the period during
which the analysis is performed must be reviewed. Time plays an important role within the
analysis in relation to the progressive reduction of inequality in observed phenomenon.
4.4 REGIONAL DISPARITIES
According to Kutscherauer (2010, p. 8) regional disparity means divergence or inequality of
characters, phenomena or processes having specific territorial allocation (may be allocated in
defined territorial structure) and occurring at least in two entities of the territorial structure.
As the most significant disparities that show differences between regions are considered
socioeconomic indicators. (Matlovič & Matlovičová, 2005) Due to the study of European
Parliament, the disparities account for results of the process of polarization. Growing of
regional disparities is caused by steep performance growth of particular regions what leads to
accumulation of wealth and producing means on one hand and on the other hand on overall
social situation and unemployment of region. (Dubois, 2007)
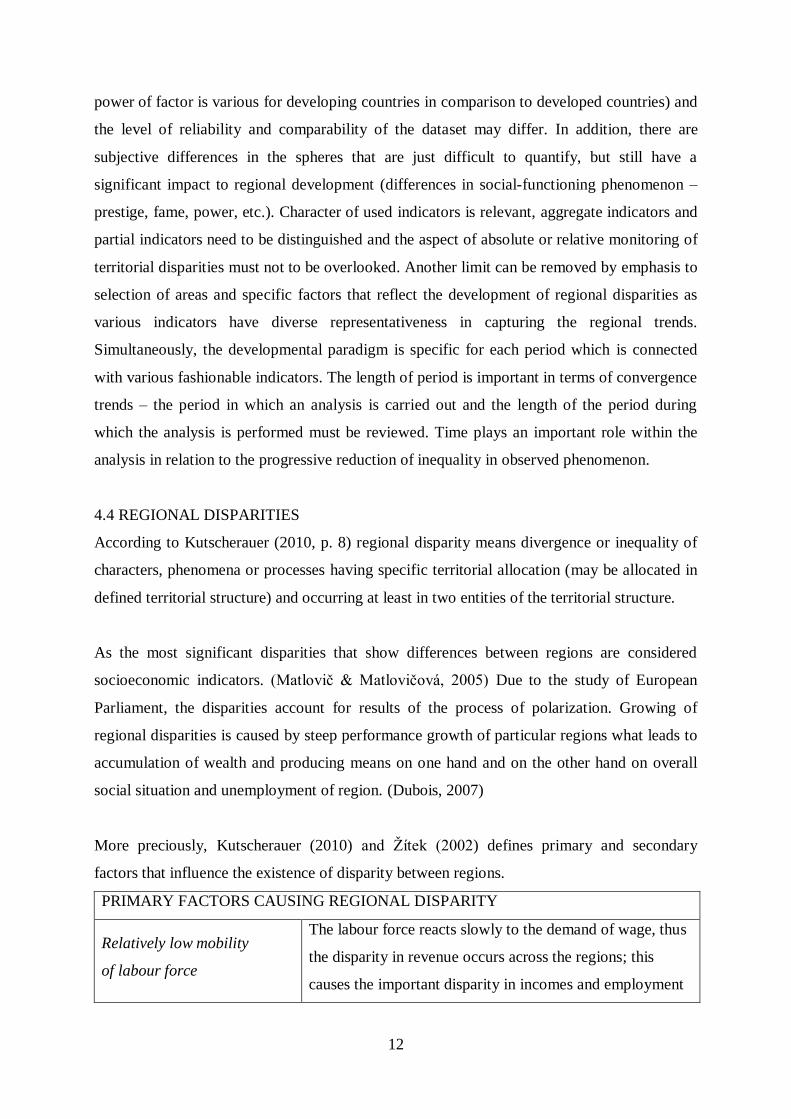
More preciously, Kutscherauer (2010) and Ţítek (2002) defines primary and secondary
factors that influence the existence of disparity between regions.
PRIMARY FACTORS CAUSING REGIONAL DISPARITY
Relatively low mobility
of labour force
The labour force reacts slowly to the demand of wage, thus
the disparity in revenue occurs across the regions; this
causes the important disparity in incomes and employment
13
Relatively low mobility
of capital
The rigidity of capital exist toward the differences in
producing costs; this causes the important disparity in
incomes and employment together with relatively low
mobility of labour force
Geographical factors
Geography directly affects the disparity and creates the
disadvantage of peripheral region or regions with weak
natural diversity (high shipping costs leads to high prices,
low revenues and limited markets, limited access to city
centres for specific services, high distance from client, low
frequency of public transportation)
Economic structure
of regions
There are regions that stagnate or are slow in economic
development in contrary to economically growing regions
where the demand for labour is progressive
Other primary factors Centralization/decentralization, state regional policy,
psychological factors
Table 2 - Primary Factors causing regional disparity (Source: Kutscherauer, 2010; Ţítek, 2002; own work)
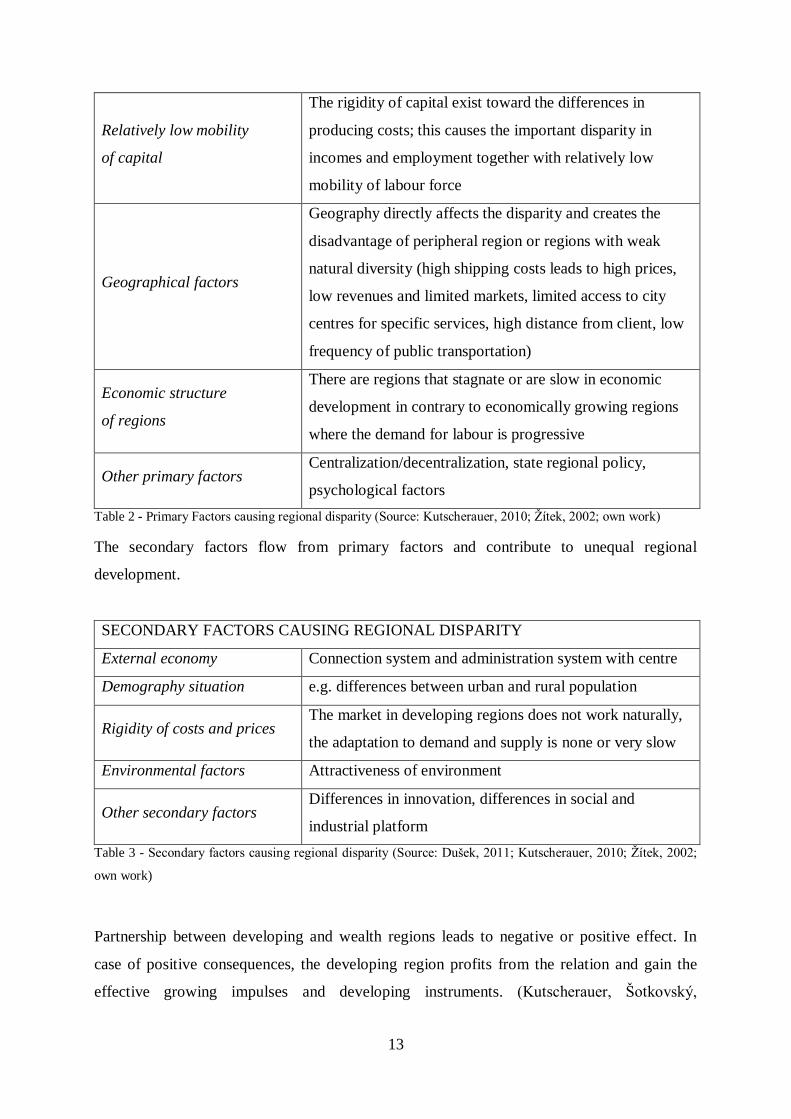
The secondary factors flow from primary factors and contribute to unequal regional
development.
SECONDARY FACTORS CAUSING REGIONAL DISPARITY
External economy Connection system and administration system with centre
Demography situation e.g. differences between urban and rural population
Rigidity of costs and prices The market in developing regions does not work naturally,
the adaptation to demand and supply is none or very slow
Environmental factors Attractiveness of environment
Other secondary factors Differences in innovation, differences in social and
industrial platform
Table 3 - Secondary factors causing regional disparity (Source: Dušek, 2011; Kutscherauer, 2010; Ţítek, 2002;
own work)
Partnership between developing and wealth regions leads to negative or positive effect. In
case of positive consequences, the developing region profits from the relation and gain the
effective growing impulses and developing instruments. (Kutscherauer, Šotkovský,
14
Adamovský & Ivan, 2013) These instruments by which the development is driven flow from
external or internal application. The regional policy concerns an optimal combination of these
instruments for specific object and region. In order to support economic growth regions apply
means from financial sphere as is straightening of intensity of interregional economic
relations, providing of capital to entrepreneurs, grants, subsidy, endowment etc., further on
from administrative sphere where direct or indirect impacts of state policy, legislation,
organizational norms and obligatory procedures plays important role. Administration sphere is
tightly connected with institutional sphere where cooperation among institutions, regional
management and localization of firms support economic growth. As a result from
administration and institutional sphere flows the means of conceptual and reconstruction
sphere that is made up from development strategy, programmes, local planning, land
modification, investing building, reconstruction of infrastructure, providing of specialized
services and consultancy etc. Essential for economic growth is the socio-psychological sphere
in meaning of education, communication, motivation and the like. (Dušek, 2011, p. 34;
Stejskal & Kovárník, 2009; Ţítek 2002)
The application of economical instruments relates with competitiveness of regions. Wokoun
and Kouřilová (2012) quoted Turok´s classification of competitiveness of regions and
municipalities. Besides descriptive economic indicators (employment rate, GDP per capita,
FDI) it is necessary to monitor the general and supportive factors of economic development.
Firstly, it is the ability of local firms to purchase products on external markets and the
effectiveness of production and value of these products. Secondary, the usage of labour,
capital and natural resources must be regarded.
In the meaning of primary factors that influence the interregional balance, phenomena of
labour and capital cause the disparity. According to Ţítek (2002, p. 117) the standard of
wages is pivotal to remove differences or renewal a balance in regional economic
development. The developing region decreases wages and establishes the competitiveness
advantage for capital. After the flow of the capital in the region, unemployment rate declines,
average standard of wages is growing and therefore the disparity in socioeconomic level is
removed. This hypothesis works in case that the limits of wage policy do not cause emigration
and population of region is cooperating with the regional strategy.
15
Currently, the social alternative indicators take place in the analysis more frequently. The
individual is not perceived only as a unit of GDP but is taken as a personality with many
needs which cannot be stabilized only by monetary means. There are globally introduced
Human development index, Human poverty index, Gender-related development index,
Gender Empowerment Measure, etc. (Trávníčková, 2010)
For instance, within the framework of the Initiative for ASEAN Integration established to
narrow the development divide and enhance competitiveness, the organization aims to three
essential pillars in which the development is supported. Economic policy, socio-cultural
policy and political security are the issues to provide a structure for regional cooperation
through which the more developed ASEAN members could help those member countries that
most need it. This includes specific regional cooperation activities aimed at assisting the less
developed member states to achieve closer economic integration, to benefit from ASEAN
schemes for regional economic integration activities, to supplement national efforts directly
aimed at poverty reduction and the promotion of equitable and inclusive development.
(ASEAN, 2009)
4.5 REGIONAL DISPARITIES MEASUREMENT AND EVALUATION
The attitude of researchers towards the measurement and evaluation of regional disparities is
not homogenous. Most of the actual approaches to regional disparity evaluation use several
disparity indicators that are processed by different mathematical and statistical methods.
Usually, the aim is to obtain one comprehensive index that represents each of the analysed
territories. (Poledníková, 2014) However, five general methods have been assessed for
practical measurement of regional disparities (Kutscherauer, Šotkovský, Adamovský, & Ivan,
2013, pp. 67-72):
4.5.1 Method based on scaling technique
When estimating own classification scale, a list of various indicators must be developed. In
any case, these indicators must be precisely and unambiguously defined.
An advantage of this approach is the quite good transparency and trouble free extensibility of
analysed group due to the fact that when the number of examined indicators is increasing no
additional calculations of values of different indices are needed to be performed. But, the
process itself is not a form of measurement and does not provide concrete quantitative data.
16
4.5.2 Traffic-lights method
Traffic-lights method is a sophisticated scaling method. Specific symbols (green, orange, red
colour) are assigned to each values of indicator that match with given percentage level of
indicator. The clear arrangement and fast results is the advantage of the method. Traffic-lights
method is appropriate in case of analysing and evaluation of dataset organized in tables.
4.5.3 Average deviation method
Average deviation method shows variability defined as an arithmetic mean of absolute
deviations of different values of examined indices from chosen value.
The way of calculation depends on formula of unvalued absolute average deviation:
∑ | |
valuable absolute average deviation:
∑ | |
∑
,
or as a relative average deviation:
Disadvantage of above approach consists namely in impossibility to define average value of
the whole system from average deviations defined for different sets of indicators, i.e. from
average sub-deviations.
4.5.4 Point-by-point method
The result of point-by-point method is assessment of region which reach the
minimum/maximum value in case of analysed indicator. The minimum is concerned in
situation that decline is a progress of indicator. The maximum value is evaluated in the
17
opposite situation. This region is evaluated by point-by-point method by 1,000 points while
other regions score within 0 up to 1,000 points depending on per mile range given by value of
their own indicators from criteria value given in advance. In case of the MIN criterion, the
dataset is arranged in ascending order.
The point-by-point method is suitable for graphical presentation when the changes throughout
development of disparities are preferred and the long-term dataset is required.
The minimum indicator is defined by formula:
The maximum indicator comes on the basis of formula:
Total summarization of calculated points put the final value of aggregated indicator. The
principal advantage can be seen in the opportunity to gather indicators expressed in different
units. At the same time, the result of analyse gives the scoring number of each region, define
the regional disparities and formulate the conclusion.
4.5.5 Standardize variable method
The method has the cumulative value approach and provides knowledge of actual situation or
the development in recent years thanks to standard deviation across the regions. The value of
variables is calculated on the base formula:
or
18
After the detailed look to methods mentioned above is obvious that each method has own pros
and cons while their usage depends not only on the level of difficulty in the practice but, at the
same time, on existence of suitable indicators due to the fact that only quantitative indicators
may be used.
Kutscherauer et al. (2013, p. 66) defines the methods for evaluation of regional disparities as
following. However, in order to following application in the thesis not all methods mentioned
below are closer delineated:
- interregional comparison method
- methods utilizing the Geographical information system
- method of real convergence
- variability level (spatial statistical methods)
- cluster analysis
- factor analysis
- simplistic model
- territorial Gini coefficient modified by OECD
- method of artificial neuron nets
4.6 CORRELATION
The correlation shows the proximity and similarity between variables. In case that variables
are highly correlated, the overall analysis´ result would be distorted by multiple weights of
correlated variables. (Řehoř, 2010; Minařík, Borůvková, & Vystčil, 2013)
The correlation as a statistical linear dependency is measured by correlation coefficient. The
coefficient is a number in absolute terms for which stands |r| ≤ 1. The dependency of r has
levels as following (Řehoř, 2010):
|1.0| ≥ r ≥ |0.9| indicates very high correlation,
|0.9| > r ≥ |0.7| indicates high correlation
|0.7| > r ≥ |0.5| indicates moderate correlation
|0.5| > r ≥ |0.3| indicates low correlation
19
|0.3| > r = 0 indicates no correlation
4.7 CONVERGENCE
The term of convergence became popular in 80´s and 90´s of the last century to define growth
of the GDP. Nowadays, the meaning has spread among other fields as well. According to
Minařík, Borůvková & Vystčil (2013), the convergence is assessed in case that statistical units
draw near in time. If they draw apart, the divergence is observed. In the strict meaning, the
phenomena may be measured only in a two-object-case. Otherwise the phenomena are
understood only as a prevailing tendency. Units standing outside the prevailing tendency are
referred to as negative or positive disparities.
In the meaning of real convergence, the method is at first assessed development of different
indicators characterising territorial differences and then is defined whether these differences
are converging or – on the contrary – diverging. (Kutscherauer, Šotkovský, Adamovský, &
Ivan, 2013) The development of growth is measured by mean coefficient of growth written as
(Dufek, Minařík, & Sojková, 2009):
√
There are three types of convergence which the economists work with. From the hypothesis
that the developing regions are generally economically faster growing than the developed
regions follows the absolute type of (unconditional) convergence that has never been and
never will be occurred. The economies must converge to the same level of steady state with
the same institutional, technological, etc. organization. (Gaspár, 2012; Čadil, 2010)
However, there are many factors that may lead to divergence apart from others that may show
convergence. This state is called conditional convergence. Thus countries with different
structural variables automatically diverge. At the same time, the states having same initial
conditions will always converge. In this order the convergence club exists. (Gaspár, 2012;
Čadil, 2010)
20
Convergence itself covers two approaches that are suitable in terms of the thesis. These
processes differ according to calculation the change within given period with utility of
different indicators (Minařík, Borůvková, & Vystčil, 2013; Gaspár, 2012):
4.7.1 Beta-convergence
Beta-convergence works on the assumption that units showing originally low values grew
faster than units showing originally high values. The base-year values (or log-values if right-
skewed or in case of outliers) are plotted on x-axis against mean coefficient of growth (log-
geometric mean) on y-axis. A scatterplot obtains a straight line with slope down tendency.
The method of least squares is used. The regression model is calculated according to formula:
Based on sign of slope β the sloping line must be assumed:
β < 0 downward sloping line – prevailing tendency is convergence
β > 0 upward sloping line – prevailing tendency is divergence
β = 0 line is parallel to x-axis – neither convergence nor divergence occurs
The coefficient of determination is calculated and expressed as following formula. If
coefficient of determination approaches 100, the indicated tendency is significant. In contrary,
if it approaches zero, the tendency is deemed as non-significant:
4.7.2 Sigma-convergence
Sigma-convergence is based on underlying assumption whether variability of values (or log-
values if original values are right-skewed or the outliers exist) decrease in time systematically
then the convergence takes place.
Variability of dataset is measured by standard deviation. If standard deviation increases
systematically, divergence occurs. Sigma convergence is calculated as (Dufek, Minařík, &
Sojková, 2009):
21
√
∑( )
Sigma-convergence may be assessed without beta-convergence. Beta-convergence is
necessary however not sufficient precondition for sigma-convergence. Sigma-convergence
shows the result on the ground of each period of time. Thus the standard deviations of given
years create plot where the systematic development can be observed.
Minařík, Borůvková & Vystčil (2013) focus on few limits of convergence analysis. When
measuring convergence, the attention must be paid to the fact, that some indicators cannot
exceed the value of 100 %. If the sample is made up from developed regions with high values
of indicator, the measuring of convergence may be a problematic issue as the change is in
very small-scale. Secondary, if the convergence and divergence occurs at the same time
throughout the same sample, the issue must be solved. Typically, the convergence is observed
among less developed regions and divergence is found among more developed ones. In such
instance, the dataset is supposed to be split to analyse the regions separately. Finally, sigma-
convergence may explain inconclusive/monotone results of beta-convergence while analysing
the long-term period. Sigma-convergence may reveal that within the period the tendencies of
convergence and divergence are changing.
4.8 INTEGRATED INDICATORS
The integrated indicators are supposed to represent the socioeconomic sphere and lead to
appropriate conclusion. One of the indicators combines three sub-indicators from economic
and social sector. The rest are determined by either economic, social or demography theories.
All integrated indicators are commonly and widely used in terms of evaluation of
development.
4.8.1 Gross Regional Domestic Product (GRDP)
The gross domestic product at purchasing power parity represents the final conclusion of
production activity in the given country of producing units. It goes in line with overall
production of goods and services together with overall consumptions. In addition, GDP is
calculated with value added taxes, custom duty and net exports. (Ţítek, 2002)
22
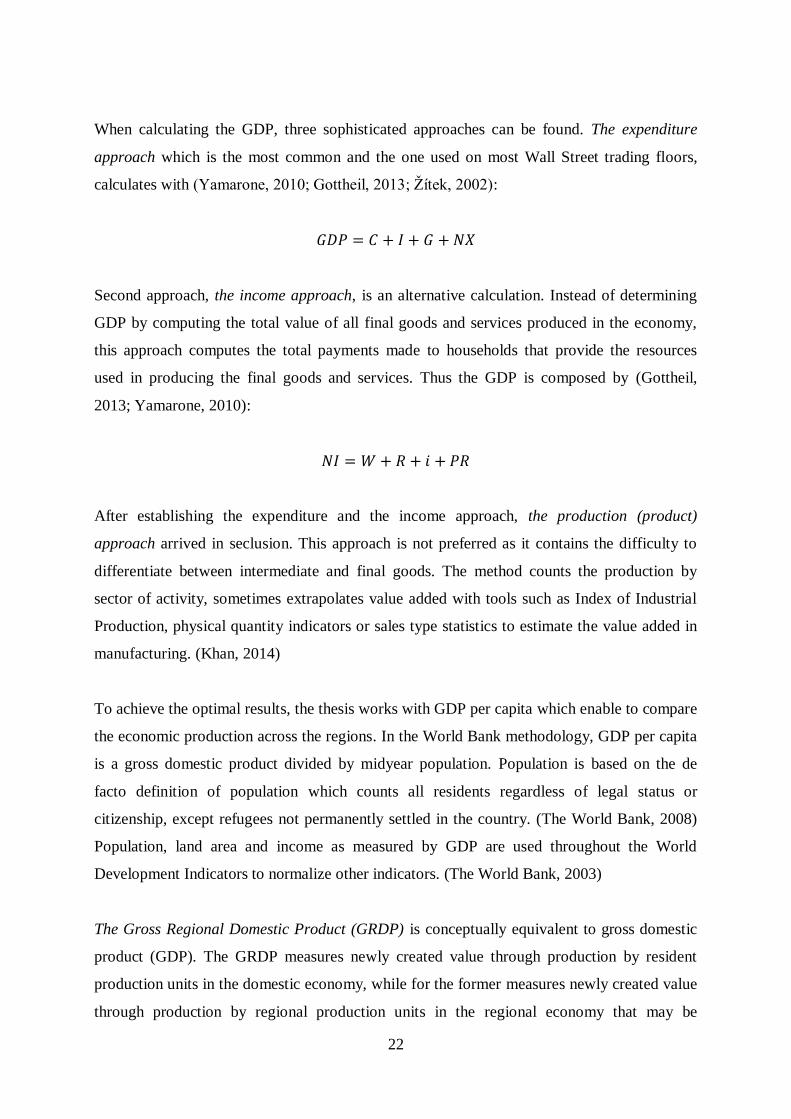
When calculating the GDP, three sophisticated approaches can be found. The expenditure
approach which is the most common and the one used on most Wall Street trading floors,
calculates with (Yamarone, 2010; Gottheil, 2013; Ţítek, 2002):
Second approach, the income approach, is an alternative calculation. Instead of determining
GDP by computing the total value of all final goods and services produced in the economy,
this approach computes the total payments made to households that provide the resources
used in producing the final goods and services. Thus the GDP is composed by (Gottheil,
2013; Yamarone, 2010):
After establishing the expenditure and the income approach, the production (product)
approach arrived in seclusion. This approach is not preferred as it contains the difficulty to
differentiate between intermediate and final goods. The method counts the production by
sector of activity, sometimes extrapolates value added with tools such as Index of Industrial
Production, physical quantity indicators or sales type statistics to estimate the value added in
manufacturing. (Khan, 2014)
To achieve the optimal results, the thesis works with GDP per capita which enable to compare
the economic production across the regions. In the World Bank methodology, GDP per capita
is a gross domestic product divided by midyear population. Population is based on the de
facto definition of population which counts all residents regardless of legal status or
citizenship, except refugees not permanently settled in the country. (The World Bank, 2008)
Population, land area and income as measured by GDP are used throughout the World
Development Indicators to normalize other indicators. (The World Bank, 2003)
The Gross Regional Domestic Product (GRDP) is conceptually equivalent to gross domestic
product (GDP). The GRDP measures newly created value through production by resident
production units in the domestic economy, while for the former measures newly created value
through production by regional production units in the regional economy that may be
23
represented by a state, province or a district. (Department of Economic and Social Affairs,
UN, 2010)
The GRDP calculates the difference between total production and intermediate consumption
of individual sectors of the region. The regionalization of GDP is provided by methods
bottom-up/top-down or pseudo-bottom-up/pseudo-top-down (if regional data are missing; are
compensated by highly correlated data). (Ţítek, 2002) Since it is expressed in current market
prices, it includes the development of changes due to price fluctuations. (Český statistický
úřad, 2016)
4.8.2 Human Development Index (HDI)
The Human Development Index (HDI) is relatively modern demographic criterion. HDI was
published in 1990 by the United Nations Development Programme (UNDP). The measure
was established to emphasize that people and their capabilities should be the ultimate criteria
for assessing the development of a country. At the same time, economists struggled with the
fact that no national accounting concepts capture all dimensions of economic welfare (e.g.
quality of life, social justice, etc.). The HDI provides a means by which inter-country and
inter-temporal comparisons of living levels may be undertaken. (Doessel & Gounder, 1994)
The HDI may also be used to question national policy choices asking how two countries with
the same level of GNI per capita may turn out with different human development outcomes.
The HDI is the geometric mean of normalized indicators for the three dimensions. The scores
for the three HDI dimension indicators are then aggregated into a composite index using
geometric mean. The measure summarizes three sub-indicators, respectively the key
dimensions of human development (Development Programme, UN, 2015):
- Health (Life expectancy)
- Education (Literacy and school enrolment)
- Decent standard of living (GDP/GDRP)
- It does not reflect on inequalities, poverty, human security, empowerment, food
security, migration etc.
According to International Development Department of OECD (2016) the link between
economic growth and human development operates in two manners. Firstly, from the
macroeconomic perspective the growth increases a tax base of country and therefore makes
24
government to spend more on the key public services of health and education. Growth is
essential if government continues to provide public services which directly benefit the poor
population. Although aid may provide initial support, increasing public expenditure in
developing countries must ultimately be financed by collecting greater tax revenues.
Secondary, the primary and secondary school enrolment are positively associated with higher
level of per capita income. Life expectancy is clearly positively related to level of GDP per
capita according to cross-county evidence.
Health is represented by life expectancy, education by literacy and school enrolment. The
literacy and school enrolment indicators are combined in weighted average as the education
and standard of living by GDP per capita. The value for each these components is transformed
into an index using a normalization formula in which the actual value is compared to a
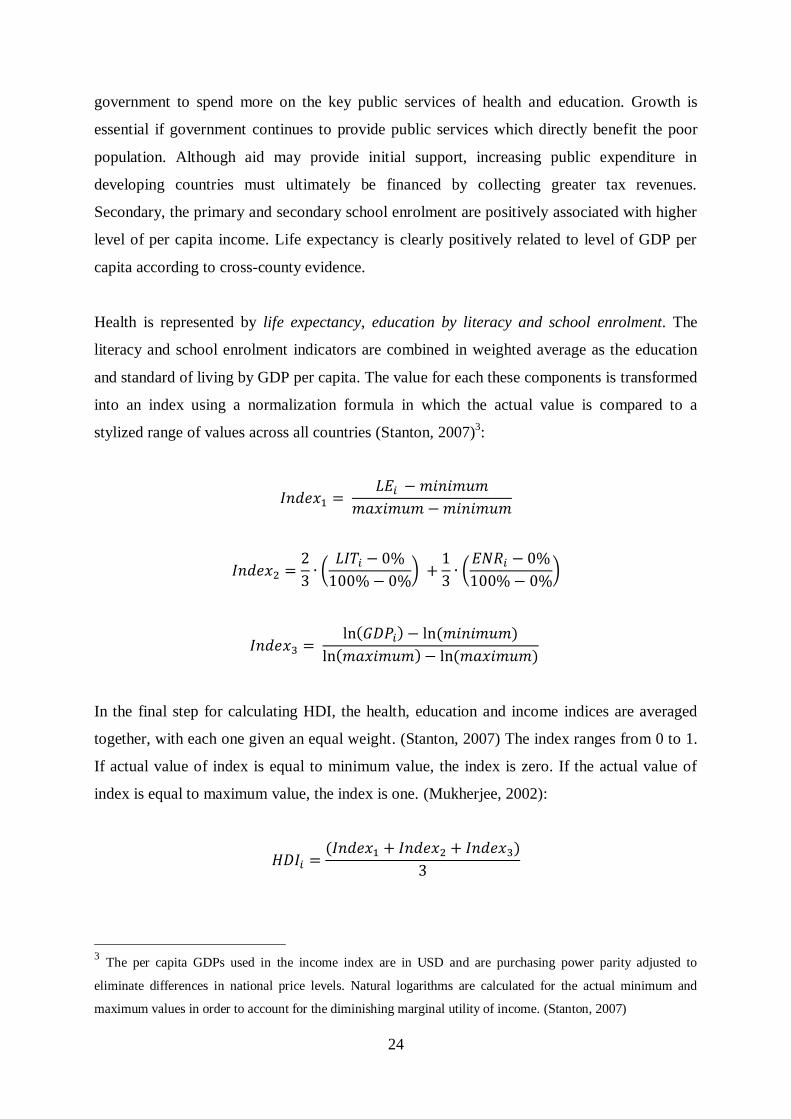
stylized range of values across all countries (Stanton, 2007)3:
(
)
(
)
( ) ( )
( ) ( )
In the final step for calculating HDI, the health, education and income indices are averaged
together, with each one given an equal weight. (Stanton, 2007) The index ranges from 0 to 1.
If actual value of index is equal to minimum value, the index is zero. If the actual value of
index is equal to maximum value, the index is one. (Mukherjee, 2002):
( )
3 The per capita GDPs used in the income index are in USD and are purchasing power parity adjusted to
eliminate differences in national price levels. Natural logarithms are calculated for the actual minimum and
maximum values in order to account for the diminishing marginal utility of income. (Stanton, 2007)
25
HDI has plays two roles in the field of applied development economics. Firstly, HDI as a tool
to popularize human development as a new understanding of well-being, and secondly, it is an
alternative to GDP per capita as a way to measure levels of development for comparison
across the countries and time. Ranking of countries according to their HDI fairly correlate to
ranking of per capita income rankings. The deviation is found in case of the oil-exporting
countries which have high GDP per capita but low values on social development indexes.
(Mukherjee, 2002)
It is important to note that national and international data of HDI (and other indexes) can
differ because international agencies standardize national data to allow comparability across
countries, and in some cases may not have access to the most recent national data.
(Development Programme, UN, 2015)
4.8.3 Poverty Gap Index
The poverty phenomenon is a multidimensional topic that covers various forms of material
aspects of poverty. Hunger and food insecurity remain the core concerns. Thus next to
classification of poverty by monetary income (per capita income, consumption of households,
consumption per capita, etc.), there are indicators taking the food and health into account (the
health data of population, the basic needs, calories per capita, etc.). In addition, poor
population is less able to access the heath care, is under higher risk of illness and disability.
Although, the poverty rate clearly relates to national income, it is a global phenomenon which
is seen in low, middle and high income countries. (WHO, 2016)
In order to consequences, the poverty is classified by two terms. Absolute poverty refers to a
set of amount by which the individual´s basic necessities of life may be purchased or reached.
Once the individual´s income drops under the level of given amount, theoretically the
individual may be confronted by death. For the establishing of the absolute minimum of
income, the national and cultural differences must be regarded. Relative poverty defines
poverty in relation to the economic status of other members in the society. The poverty then
flows from the set at 60 % of a country´s respective median disposable income. (UNESCO,
2016; Ţelinský, 2009; The International Labour Organization, 2016)
The most objective source of calculation the poverty is the World Bank, undoubtedly. The
mission of this institution is concerning the issues of world poverty and its sustainable
26
reduction. For computing of the rate of poverty, so-called head-count index is the most spread
measurement of proportion of poor population, formally quoted as a percentage calculated in
direct proportion as (The World Bank Institute, 2005; Ţelinský, 2009):
Disadvantages of the general proportion are described by the World Bank Institute (2005).
Firstly, the intensity of poverty is not taken into consideration. Secondly, the head-count
index does not indicate how poor the poor people are and does not capture if the line of
poverty increase/decrease.
Next to Gini index of distribution of poverty across the society/state, far more suitable
measure of poverty is the poverty gap index that adds up the extent to which individuals on
average fall below the poverty line. As the poverty gap is a poverty line minus the income of
the poor individuals, the individuals which fall under into the poverty gap have a gap of zero.
The aggregated deficit of poverty is in proportion to the poverty line. After a determination of
the poverty gap, the index may be written as (The World Bank Institute, 2005; Ţelinský,
2009):
∑
In particular, for emerging and developing countries was estimated poverty line of USD 1.25
a day and USD 2 a day for extreme and moderate poverty. Respectively, extreme poverty is
defined as living on a household per capita income of less than USD 1.90 PPP per day.
Moderate poverty is defined as living on between USD 1.90 PPP and USD 3.10 PPP per
capita per day.4 (The International Labour Organization, 2016; The World Bank Institute,
2005)
4 Beside the risk rate of poverty, there are others primary indicators affecting the society. The European
Commission (2006) determinates indices as the rate of long-term unemployment, population living within
unemployment households, people premature quitting education, gap in employment of immigrants, material
deprivation, standard of living, welfare of children, etc.
27
However, according to the International Labour Organization (2016) there are data limitations
and related methodological issues regarding to analysis across countries. When comparing the
poverty, the countries provide data from various sources (registered data, specific surveys,
etc.). Some countries lack the data of national income thus not all variables required for
complete analysis are presented. In particular situations, the data are not treated and
harmonizes in the same way and the methodological approaches may differ as well.
4.8.4 Unemployment
According to Ţítek (2002, pp. 59-61), the willingness to work represents the cognition of
effect of work that is at least equal to sacrifice during the performance. This performance of
work directly leads to achieving of means which is necessary to satisfying the needs. In the
contradiction to supply of work from individuals, there is a supply of work from employers,
more preciously the demand of work. This demand is affected by microeconomic,
demographic and social factors.
The theory of unemployment due to the Guidelines of the International Labour Organisation,
which is now the most widely used definition, is determined by condition valid for
unemployed person, such as someone aged from 15 up to 74 years without working at least
one hour during the reference period but is available for and actively seeking work.
(O´Higgins, 1997)
Eurostat (2016) specifies the theory of an unemployment person by the availability to start
working within the next two weeks (or has already found a job to start within the next three
months) and the fact that the individual had actively sought employment at some time during
the last four weeks.
Ţítek (2002) shares the definitions mentioned above and provides the emerging conclusion. If
anyone does not fulfil the conditions, is classified as employed or economically inactive. At
the same time Ţítek provides the essential formulas of direct proportion (defined in
percentage) for computing the rate of unemployment as following, respectively L = E + U:
28
or
The traditional classification of unemployment serves three types. Frictional unemployment
implies from the vivid character of the market. The dynamic decision making results in any
period when frictional unemployment depends on the natural processes in population.
Structural unemployment occurs in the case of discrepancy of qualification demands on the
side of market, or unfulfilled professional qualification on the side of labour. The structural
unemployment ends in migration or requalification. Respectively, sometimes is so-called
balance unemployment. The third type is cyclical unemployment. It occurs during the
recession phase of the market cycle when investment and consumption expenditures begin to
fall and the economy is unable to generate same number of jobs as existed at the previous
cyclical peak. It falls as the prosperity is restored. Cyclical unemployment is a variance
between real and natural unemployment rate. (Hughes & Perlman, 1984; Ţítek, 2002; Baumol
& Blinder, 2009)
4.8.5 Net Migration
Migration represents the moving of population as well as the increase or decrease of the total
summary of population. From the above mentioned follows the migration is made up from
two essential processes (Koschin, 2005):
- Immigration, calculated as:
- Emigration, calculated as:
29
These two processes are sometimes completed by return migration when the migrating people
come back to the former place of living within one year. (Zemánek, 2012; Muţáková, 2010)
For interpretation of the change within population the difference of immigration and
emigration is made. Even though, many countries either do not have accurate figures
for immigration and emigration, or have no figures at all, net migration could be estimated. It
is usually calculated as the difference between the total population change and the natural
increase during the year. Net migration gives no indication of the relative scale of the separate
immigration and emigration flows to and from a country (e.g. a country may report low net
migration but experience high immigration and emigration flows). (Eurostat, 2015)
Klufová & Poláková (2010) describe the internal migration is caused due to better job
opportunity, the expected life quality and the rate of unemployment, the public background
and access to facilities, services and activities, the standard of traffic lines, transportation and
technical operation.
The internal migration is classified as inside-municipality migration (moving within the
municipality), outside-municipality migration (moving out of the municipality), horizontal
migration (moving from a city to another city, from rural area to another rural region), or
vertical migration (moving from rural area to city). (Klufová & Poláková, 2010)
The consequences of migration are determined by contradictory theoretical concepts.
Neoclassical growing concept leads to the hypothesis that – owing to migration – the
equalization of wage rate is realized across the regions. At the same time, empirical analysis
proves that migration mutually correlates with economic growth.5 (Čadil, 2010; Varadzin,
Frait & Červenka, 2004)
4.8.6 Foreign Direct Investment (FDI)
Foreign direct investment belongs among key indicators according which the success and
development of economic transformation and the economic integration is evaluated. On the
5 However, migration may have the negative impact. In case of situation that supply of educated labour force
grows, the demand for educated labour grows simultaneously. Those two effects press the wage rate down. This
is specified in cumulative causality concept. (Čadil, 2010)
30
macroeconomic level, the structure and significance of FDI is assessed within national
economics. At the same time, the FDI is an element of international integration, referred to as
globalization. (Hlaváček, 2012; OECD, 2008)
Within the regional development references, the FDI is one factor by which the economic
growth and competitive position of regions as well as international market is supported. It also
provides a means for creating direct, stable and long-lasting links between economies. FDI
also encourage the flow of technology and know-how into the hosting country. (OECD, 2008;
Turnock, 2005)
OECD (2008) provides a complex definition of FDI as following. Foreign direct investment
reflects the objective of establishing a lasting interest by a resident enterprise in one economy
(direct investor) in an enterprise (direct investment enterprise) that is resident in an economy
other than that of the direct investor. The lasting interest implies the existence of a long-term
relationship between the direct investor and the direct investment enterprise and a significant
degree of influence on the management of the enterprise.
The character of FDI may be direct in form of provided capital or through the related
enterprises. The direct investment transactions are made up of three basic instruments (Duce,
2003, p. 5; OECD, 2008). Firstly, the equity capital containing comprising equity in branches,
shares in subsidiaries and associates and other capital contributions such as provisions of
machinery. Furthermore, the reinvested earnings consisting of the direct investor´s share of
earnings not distributed, as dividends by subsidiaries or associates and earnings of branches
not remitted to direct investor. And other direct investment capital in meaning of borrowing
and lending of funds, including debt securities and trade credits between direct investors and
direct investment enterprises and between two direct investment enterprises that share the
same direct investor.
The methodological basis for the compilation of FDI statistics is the IMF Balance of
Payments and International Investment Position Manual and the OECD Benchmark
Definition of FDI. The OECD Manual sets the world standard for FDI statistics whereas the
IMF Balance of Payments provide the statistical framework for national accounting. All these
manuals share basic concepts, definitions, classifications and conventions in order to ensure
consistency and data comparability. (Eurostat, 2014)
31
5. ANALYTICAL PART
The analytical part concerns the Indonesia as a country of research, its economic and
population overview and serves basic schema of differences among provinces according to
GRDP indicator. Furthermore, the chapter provides the results of basic statistics method and
correlation analysis of integrated indicators what is used subsequently to breakdown of the
data characteristics. The beta-convergence analysis finds the approximation or extension of
regional disparities. The sigma-convergence analysis put forward the results that either prove
the results of beta-convergence, or displays another direction of regional development.
In order to compute the convergence, the variable of net migration needs to be split into two
sub-indicators – immigration and emigration (in thesis, labelled by terms of IN-migration and
OUT-migration for better orientation). The dividing is held due to the fact that overall net
migration works with negative values of immigration and therefore the logarithmic
transformation is not able to perform whereupon the sub-indicators are calculated in positive
values.
5.1 INDONESIA
The official name of the country is the Indonesian Republic. Indonesia is situated in the
Southeast Asia, as an archipelago between the Indian Ocean and the Pacific Ocean. The total
area accounts to 1,904,569 km2. (Central Intelligence Agency, 2016) Indonesia lies in the
tropic temperate zone. It crosses the equator, so the country is situated in both hemispheres,
largely on the southern hemisphere. Indonesia is located on about 17,000 islands, of which the
largest are Kalimantan and Papua, but the best known by tourists are Java, Sumatra and Bali.
(Orbion, 2014)
Indonesia is a presidential republic where the president and vice president are directly elected
by absolute majority popular vote. Country’s strategic location lies along major sea lanes
from the Indian Ocean to the Pacific Ocean. (Central Intelligence Agency, 2016) Before and
on the beginning of 21st century, the strategic power – Netherlands – lied on different
continent. Indonesia went through exhausting form from the colony over early democracy to
dictatorship and one round again. History of Indonesia is accompanied by many various forms
of forces and terrorism as well as the outbreak of civil conflicts and violence (religious,
ethnic, state or communal violence). (Svoboda, 2010)
32
In the modern history, Indonesia went down in the world´s awareness by civil war in Aceh.
(Amnesty International, 2015) When the tension within population was released, the Asian
financial crisis occurred and caused poverty, unemployment and uncertainty about the future
in many households. (Indonesia Investments, 2016b)
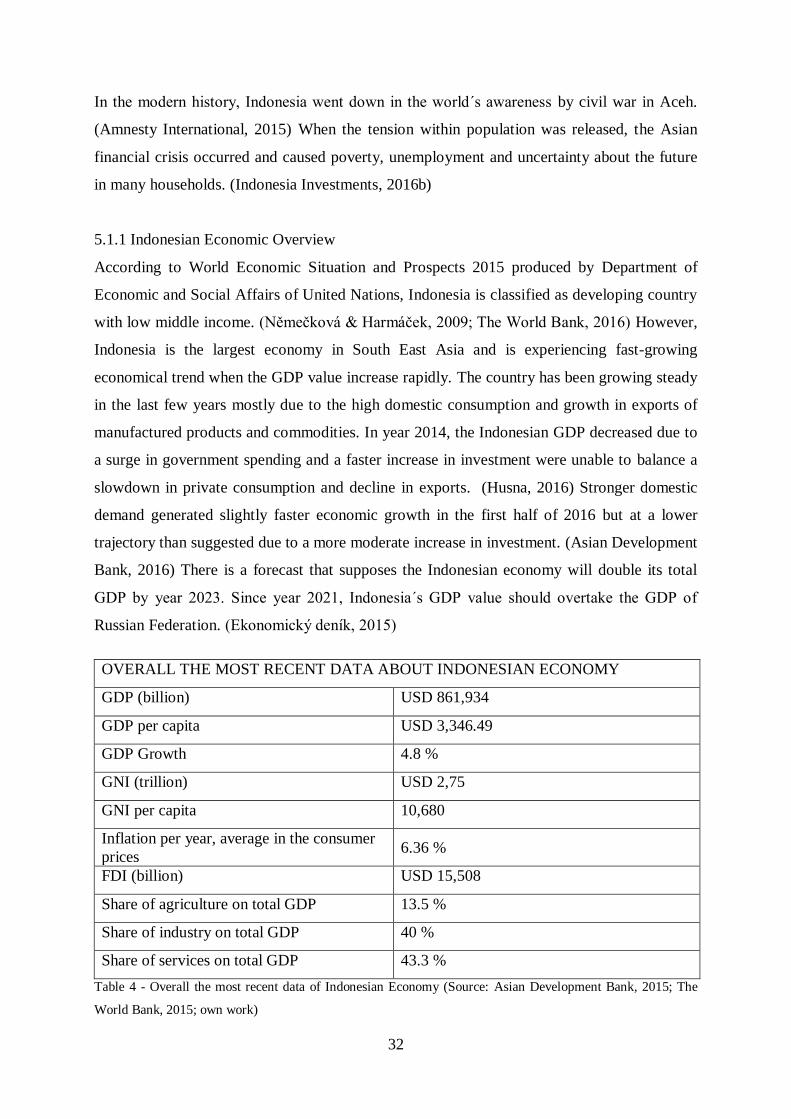
5.1.1 Indonesian Economic Overview
According to World Economic Situation and Prospects 2015 produced by Department of
Economic and Social Affairs of United Nations, Indonesia is classified as developing country
with low middle income. (Němečková & Harmáček, 2009; The World Bank, 2016) However,
Indonesia is the largest economy in South East Asia and is experiencing fast-growing
economical trend when the GDP value increase rapidly. The country has been growing steady
in the last few years mostly due to the high domestic consumption and growth in exports of
manufactured products and commodities. In year 2014, the Indonesian GDP decreased due to
a surge in government spending and a faster increase in investment were unable to balance a
slowdown in private consumption and decline in exports. (Husna, 2016) Stronger domestic
demand generated slightly faster economic growth in the first half of 2016 but at a lower
trajectory than suggested due to a more moderate increase in investment. (Asian Development
Bank, 2016) There is a forecast that supposes the Indonesian economy will double its total
GDP by year 2023. Since year 2021, Indonesia´s GDP value should overtake the GDP of
Russian Federation. (Ekonomický deník, 2015)
OVERALL THE MOST RECENT DATA ABOUT INDONESIAN ECONOMY
GDP (billion) USD 861,934
GDP per capita USD 3,346.49
GDP Growth 4.8 %
GNI (trillion) USD 2,75
GNI per capita 10,680
Inflation per year, average in the consumer
prices 6.36 %
FDI (billion) USD 15,508
Share of agriculture on total GDP 13.5 %
Share of industry on total GDP 40 %
Share of services on total GDP 43.3 %
Table 4 - Overall the most recent data of Indonesian Economy (Source: Asian Development Bank, 2015; The
World Bank, 2015; own work)
33
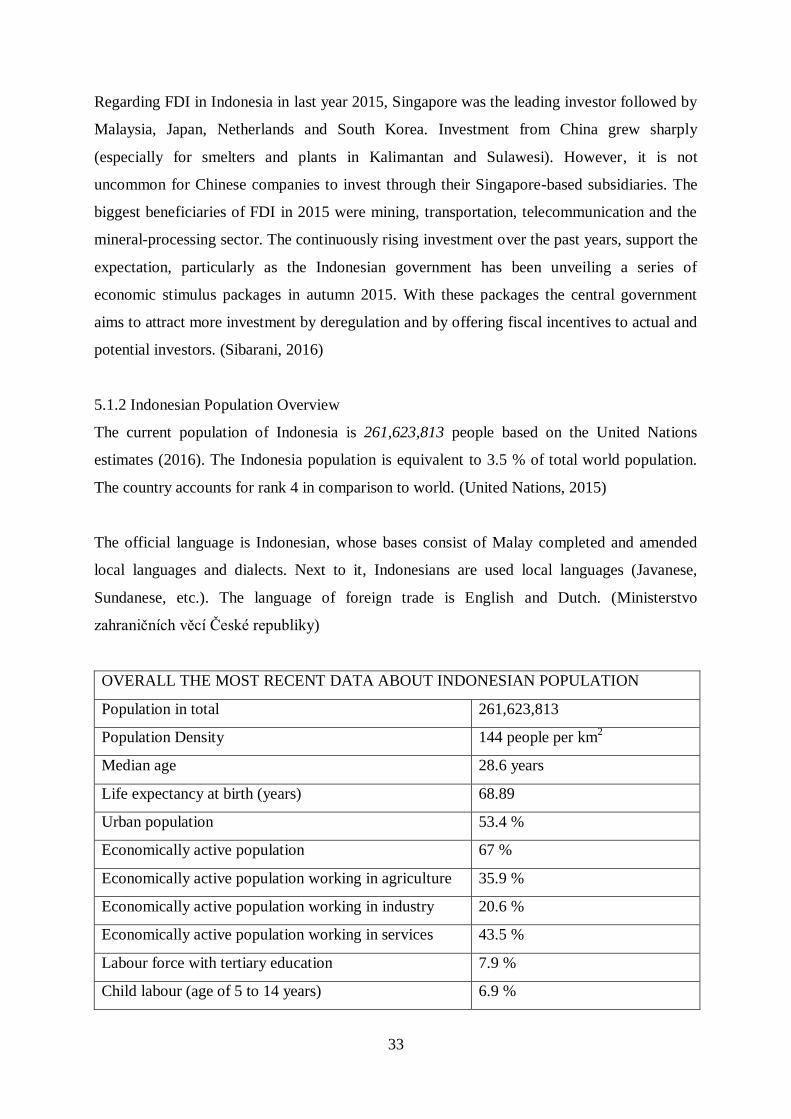
Regarding FDI in Indonesia in last year 2015, Singapore was the leading investor followed by
Malaysia, Japan, Netherlands and South Korea. Investment from China grew sharply
(especially for smelters and plants in Kalimantan and Sulawesi). However, it is not
uncommon for Chinese companies to invest through their Singapore-based subsidiaries. The
biggest beneficiaries of FDI in 2015 were mining, transportation, telecommunication and the
mineral-processing sector. The continuously rising investment over the past years, support the
expectation, particularly as the Indonesian government has been unveiling a series of
economic stimulus packages in autumn 2015. With these packages the central government
aims to attract more investment by deregulation and by offering fiscal incentives to actual and
potential investors. (Sibarani, 2016)
5.1.2 Indonesian Population Overview
The current population of Indonesia is 261,623,813 people based on the United Nations
estimates (2016). The Indonesia population is equivalent to 3.5 % of total world population.
The country accounts for rank 4 in comparison to world. (United Nations, 2015)
The official language is Indonesian, whose bases consist of Malay completed and amended
local languages and dialects. Next to it, Indonesians are used local languages (Javanese,
Sundanese, etc.). The language of foreign trade is English and Dutch. (Ministerstvo
zahraničních věcí České republiky)
OVERALL THE MOST RECENT DATA ABOUT INDONESIAN POPULATION
Population in total 261,623,813
Population Density 144 people per km2
Median age 28.6 years
Life expectancy at birth (years) 68.89
Urban population 53.4 %
Economically active population 67 %
Economically active population working in agriculture 35.9 %
Economically active population working in industry 20.6 %
Economically active population working in services 43.5 %
Labour force with tertiary education 7.9 %
Child labour (age of 5 to 14 years) 6.9 %
34
Human development index 0.684
Poverty headcount ration (USD 1.9 per day) 8.25 %
Unemployment 6.2 %
Net migration -700,000
Table 5 - Overall the most recent data about Indonesian population (Source: United Nation, 2015; United
Nations Development Programme, 2015; Worldometers, 2016; The World Bank, 2016; own work)
Close to 80 % of the Indonesian population lives in the west of the country, on the islands of
Java and Sumatra, but this part of the population is growing in the slower trend than the rest
of the country. (Piesse, 2015) On the base of the UN data, the Indonesia is one of the nine
countries where the half of the world population will live by the year 2050. Indonesia
population lives in intermediate fertility phase that have already experienced substantial
fertility decline and women have on average between 2 and 5 children. (United Nations,
2015)
The region from both of Maluku over West Papua to Papua has the next smallest population.
According to the 2010 census, roughly 3.6 million people live here. In the decade up to 2010,
the population increased by 64 % due to increasing migration and a higher than average birth
rate. In the west of the country, outward migration and low birth rates contributed to a slower
rate of population growth. (Piesse, 2015)
After stabilization of Asian Financial Crises, Indonesia has experienced robust
macroeconomic growth in recent years and the country has started in supporting the
unemployment rate into steady downward trend. The success in decreasing of unemployment
goes in line with the economic development and broadens working opportunities. (Indonesia
Investments, 2016a) On the base of wider job supply, the internal migration is in the process.
Beside the job seeking, the reason to migrate is study opportunities, movement due to pension
or returning to the original region. (Susanti & Damayanti, 2015)
According to the UN Development Programme, the Indonesia is ranked 110 on the base of
HDI. (Development Programme, UN, 2015) Between 1980 and 2014, Indonesia´s life
expectancy at birth increased by 9.3 years, average years of schooling increased by 4.5 years
and expected years of schooling increased by 4.3 years. In comparison to countries that are
close to Indonesia, the HDI of Indonesia is above the average for countries in the medium
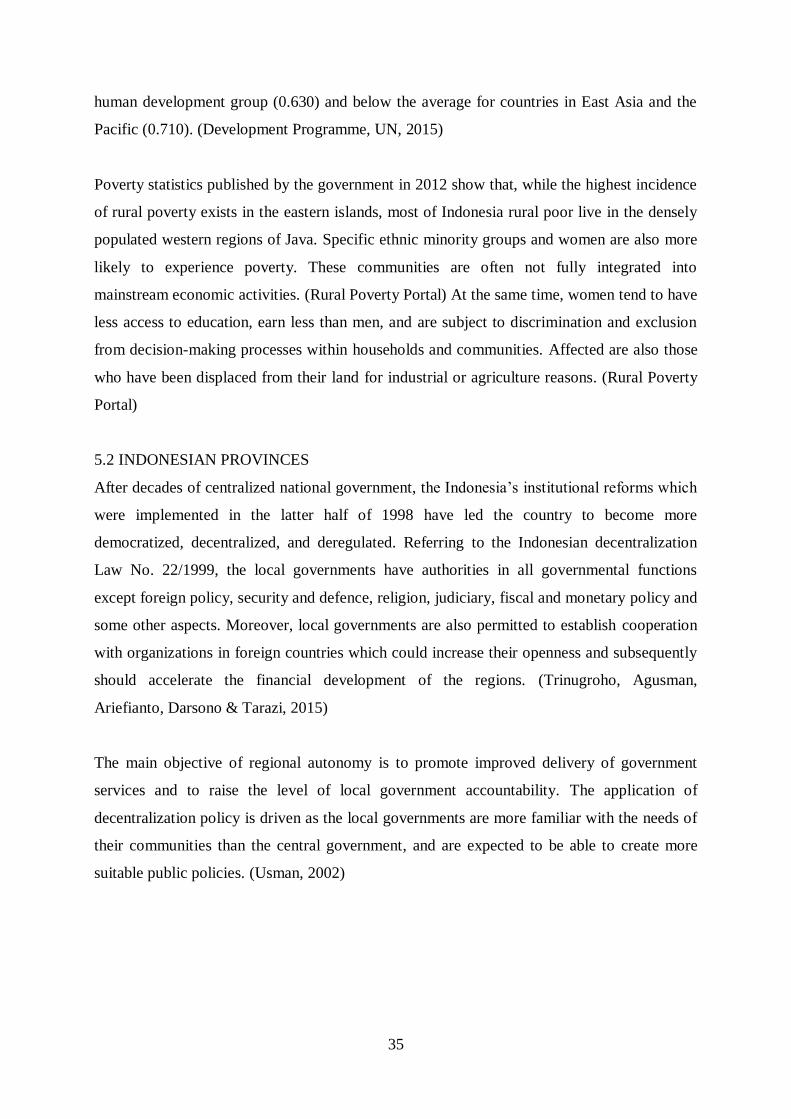
35
human development group (0.630) and below the average for countries in East Asia and the
Pacific (0.710). (Development Programme, UN, 2015)
Poverty statistics published by the government in 2012 show that, while the highest incidence
of rural poverty exists in the eastern islands, most of Indonesia rural poor live in the densely
populated western regions of Java. Specific ethnic minority groups and women are also more
likely to experience poverty. These communities are often not fully integrated into
mainstream economic activities. (Rural Poverty Portal) At the same time, women tend to have
less access to education, earn less than men, and are subject to discrimination and exclusion
from decision-making processes within households and communities. Affected are also those
who have been displaced from their land for industrial or agriculture reasons. (Rural Poverty
Portal)
5.2 INDONESIAN PROVINCES
After decades of centralized national government, the Indonesia’s institutional reforms which
were implemented in the latter half of 1998 have led the country to become more
democratized, decentralized, and deregulated. Referring to the Indonesian decentralization
Law No. 22/1999, the local governments have authorities in all governmental functions
except foreign policy, security and defence, religion, judiciary, fiscal and monetary policy and
some other aspects. Moreover, local governments are also permitted to establish cooperation
with organizations in foreign countries which could increase their openness and subsequently
should accelerate the financial development of the regions. (Trinugroho, Agusman,
Ariefianto, Darsono & Tarazi, 2015)
The main objective of regional autonomy is to promote improved delivery of government
services and to raise the level of local government accountability. The application of
decentralization policy is driven as the local governments are more familiar with the needs of
their communities than the central government, and are expected to be able to create more
suitable public policies. (Usman, 2002)
36
During the time the number of provinces is rising and the borders of regions are getting
closer. The North Kalimantan has been established as the newest province thus most of data
are not available for entire period of 2010 – 2015 determined for the purposes of thesis.
The provinces of Indonesia are displayed on Figure 2, defined due to GRDP per capita
standard. The white provinces are the poorest, produce only less than UDS 1,400. The grey
coloured are the under-average provinces (up to USD 2,800). Above-average up to USD 4.200
provinces are the light blue ones (West Papua, Papua). Three purple provinces (Riau, Riau
Islands, and North Kalimantan) reach up to USD 7,000. The darkest (DKI Jakarta, East
Kalimantan) achieve over USD 10,000.
Figure 2 - Indonesian Map of Provinces (Source: World Press, 2014)6
6 ACH – Aceh, NSM – North Sumatra, WSM – West Sumatra, RIU – Riau, RIUI – Riau Islands, JMB – Jambi,
BGL – Bengkulu, SSM – South Sumatra, BNBL – Bangka Belitung Islands, LAM – Lampung, BAN – Banten,
JKT – DKI Jakarta, WJV – West Java, CJV – Central Java, YKT – DI Yogyakarta, EJV – East Java, BAL –
Bali, WNT – West Nusa Tenggara, ENT – East Nusa Tenggara, WKA – West Kalimantan, CKA – Central
Kalimantan, SKA – South Kalimantan, EKA – East Kalimantan, NKA – North Kalimantan, NSW – North
Sulawesi, GRN – Gorontalo, CSW – Central Sulawesi, WSW – West Sulawesi, SSW – South Sulawesi, SESW –
Southeast Sulawesi, MLK – Maluku, NMLK – North Maluku, WPAP – West Papua, PAP - Papua
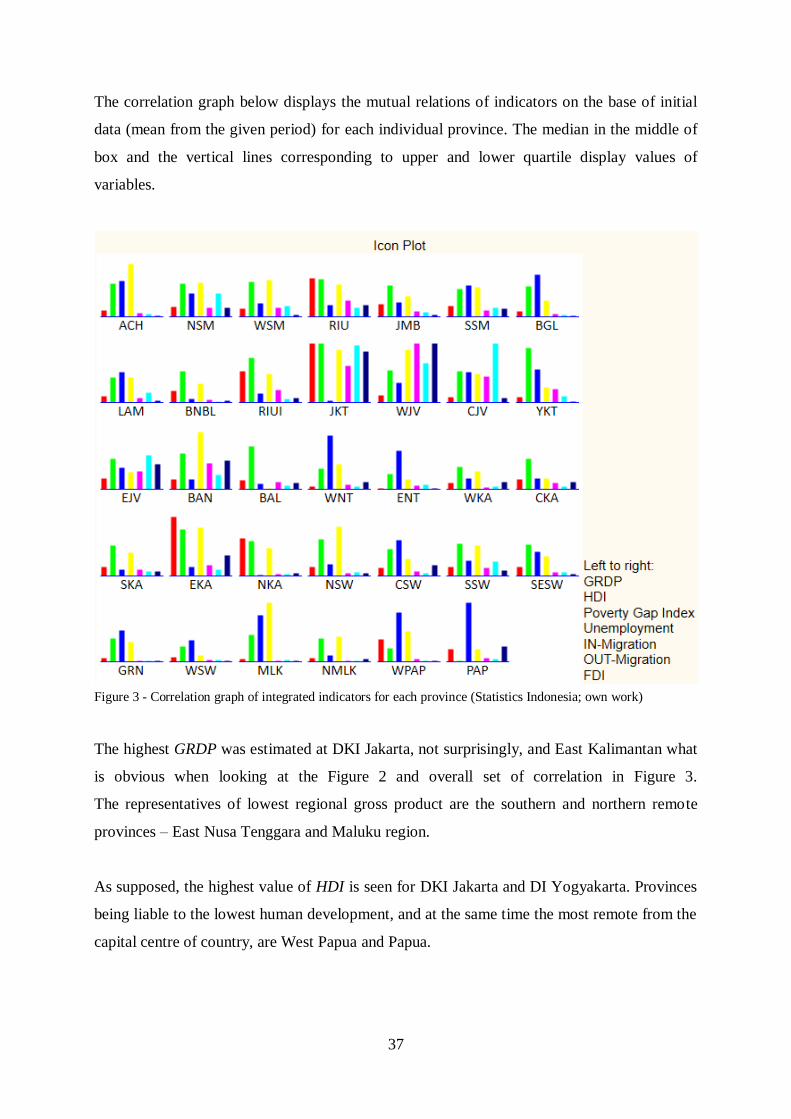
37
The correlation graph below displays the mutual relations of indicators on the base of initial
data (mean from the given period) for each individual province. The median in the middle of
box and the vertical lines corresponding to upper and lower quartile display values of
variables.
Figure 3 - Correlation graph of integrated indicators for each province (Statistics Indonesia; own work)
The highest GRDP was estimated at DKI Jakarta, not surprisingly, and East Kalimantan what
is obvious when looking at the Figure 2 and overall set of correlation in Figure 3.
The representatives of lowest regional gross product are the southern and northern remote
provinces – East Nusa Tenggara and Maluku region.
As supposed, the highest value of HDI is seen for DKI Jakarta and DI Yogyakarta. Provinces
being liable to the lowest human development, and at the same time the most remote from the
capital centre of country, are West Papua and Papua.
38
Considering the poverty gap index, there is obvious development comparing year 2010 and
2015 at cases West Papua, Papua, Maluku, Gorontalo, Southeast Sulawesi and East Nusa
Tenggara when the poverty gap become lower very significantly. However, these provinces
still rank among ones with higher average poverty gap rate. In the contrary, Benguku province
experiences upward trend in poverty gap index.
Perhaps due to the advanced tourism and growing connected services the lowest rate of
unemployment is in Bali province followed by West Sulawesi. The numerous unemployment
within the country may be found in Maluku and Banten although the share of unemployment
people has been decreased rapidly, followed by DKI Jakarta.
Central Java and DKI Jakarta are the regions with high values of OUT-migration. On the
other side, the West Java experiences the extra values of IN-migration. The question could be
whether West Java province is the gradient area to DKI Jakarta and Central Java, or whether
there are different socioeconomic phenomena causing such a significant immigration. In
contrary, the West Java together with Banten are found in the relatively high IN-migration,
which may correspond with the FDI described immediately afterwards, respectively the new
job opportunities. The steadiest region concerning migration is the North Maluku displaying
low values of IN-migration as well as OUT-migration. The differences in overall net
migration are certainly caused by the size of province and the population density.
The object for foreign direct investments seems to be West Java, DKI Jakarta and Banten. On
the other side, the investors are not interested in provinces of West Sulawesi and East Nusa
Tenggara and Gorontalo.
In interest of the assuming dynamics of convergence within socioeconomic indicators, the
essential variable is GDP that is essential when assuming the level of regional disparities.
However, not only GDP growth is the concern on possible outliers. In the set of the cases,
there may be provinces that experience faster growth/decline or have extreme values of
indicators and may distort the results of convergence analysis. Therefore the possible outliers
must be taken into account and at the same time, the estimation of these values is done before
techniques of basic statistics are displayed in Table 6.
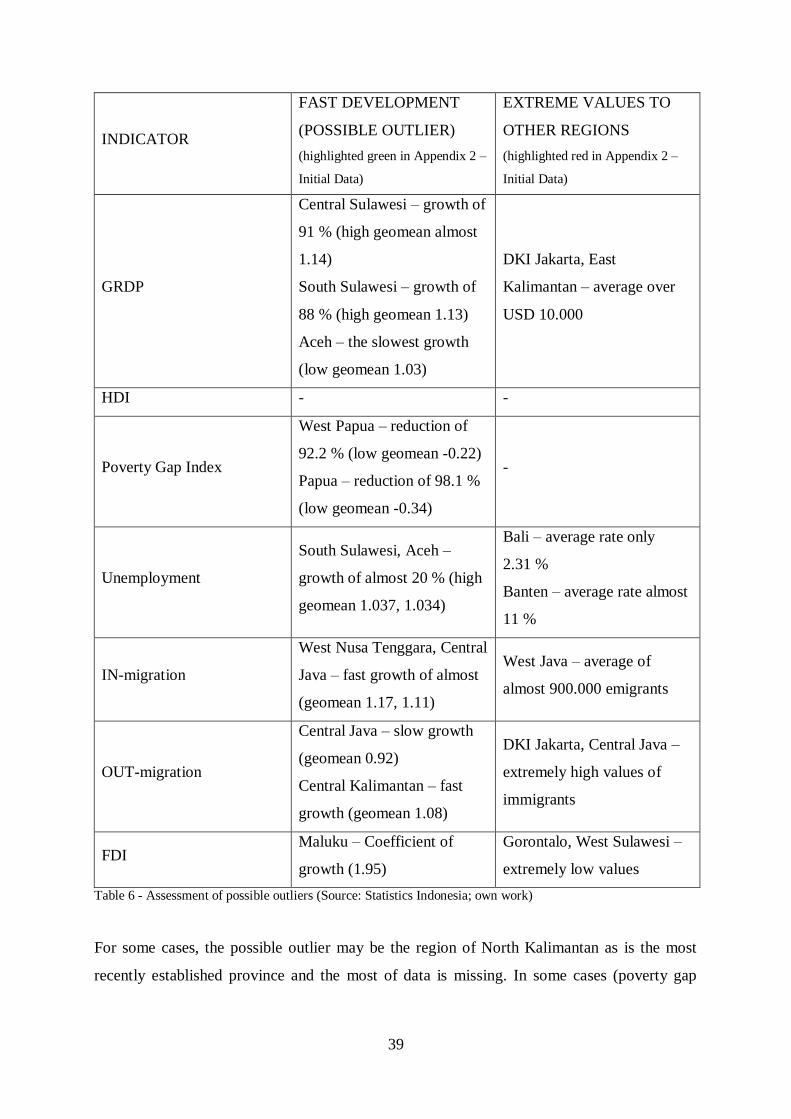
39
INDICATOR
FAST DEVELOPMENT
(POSSIBLE OUTLIER)
(highlighted green in Appendix 2 –
Initial Data)
EXTREME VALUES TO
OTHER REGIONS
(highlighted red in Appendix 2 –
Initial Data)
GRDP
Central Sulawesi – growth of
91 % (high geomean almost
1.14)
South Sulawesi – growth of
88 % (high geomean 1.13)
Aceh – the slowest growth
(low geomean 1.03)
DKI Jakarta, East
Kalimantan – average over
USD 10.000
HDI - -
Poverty Gap Index
West Papua – reduction of
92.2 % (low geomean -0.22)
Papua – reduction of 98.1 %
(low geomean -0.34)
-
Unemployment
South Sulawesi, Aceh –
growth of almost 20 % (high
geomean 1.037, 1.034)
Bali – average rate only
2.31 %
Banten – average rate almost
11 %
IN-migration
West Nusa Tenggara, Central
Java – fast growth of almost
(geomean 1.17, 1.11)
West Java – average of
almost 900.000 emigrants
OUT-migration
Central Java – slow growth
(geomean 0.92)
Central Kalimantan – fast
growth (geomean 1.08)
DKI Jakarta, Central Java –
extremely high values of
immigrants
FDI Maluku – Coefficient of
growth (1.95)
Gorontalo, West Sulawesi –
extremely low values
Table 6 - Assessment of possible outliers (Source: Statistics Indonesia; own work)
For some cases, the possible outlier may be the region of North Kalimantan as is the most
recently established province and the most of data is missing. In some cases (poverty gap
40
index, unemployment) are data available only for year 2015 thus the coefficient of growth is
not possible to calculate.
5.3 CONVERGENCE OF INTEGRATED INDICATORS
The objective of this chapter is to analyse the dataset and decide whether the disparities across
Indonesian provinces converge or diverge considering the integrated socioeconomic
indicators. Results of the analysis reply the questions as following:
1. Does the beta-convergence occur in each case of indicator/variable?
2. Do the results of sigma-convergence support the results of beta-convergence?
3. If so, what is the reduction of disparities expressed as a percentage?7
Particularly, the measuring of convergence/divergence is used for assuming of the economic
phenomena for group of regions having something in common (e.g. membership in particular
union). In this case, the analysis is applied for demographic and socioeconomic indicators
what is not typical. Therefore the results are presented more universally.
5.3.1 Basic Statistics
For statistical measuring the basic analysis of data distribution is carried. In STATISTICA
Software, the minimum and maximum value, the variability characteristics of variance,
standard deviation and coefficient of variation, and asymmetry parameters as skeweness and
kurtosis.
7 The calculation of sigma-convergence speed follows the analysis of Minařík & Dufek & Sojková (2009).
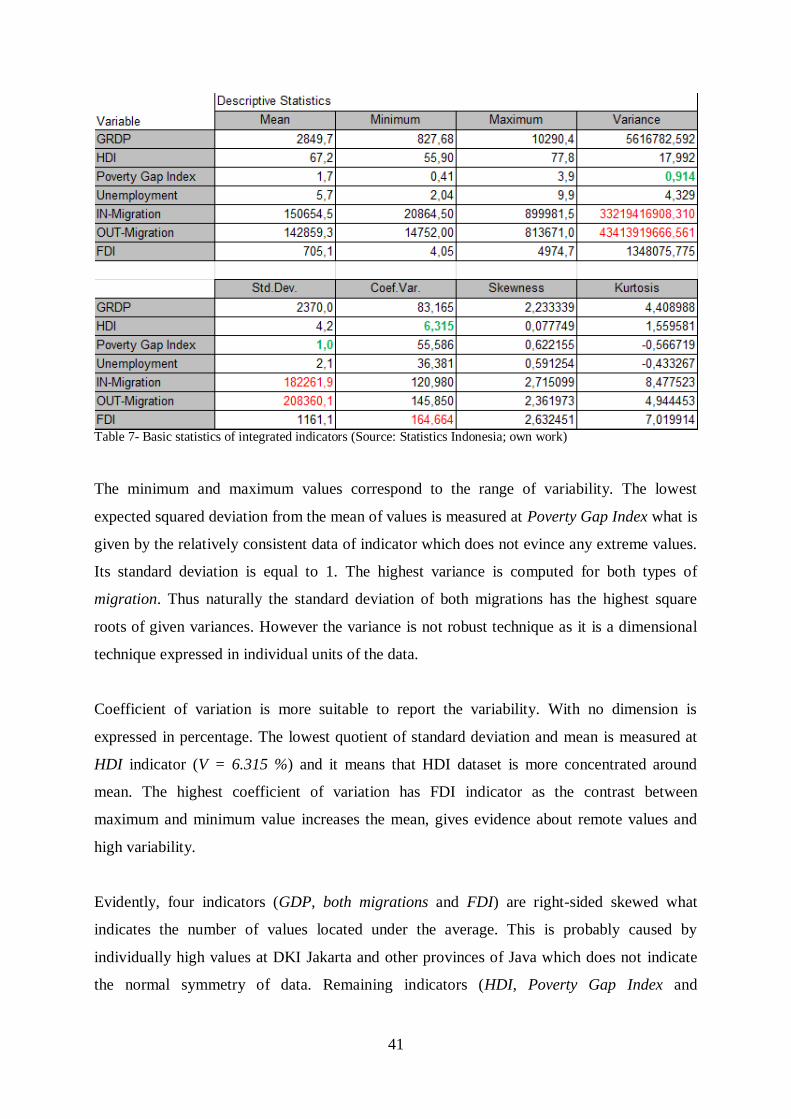
41
Table 7- Basic statistics of integrated indicators (Source: Statistics Indonesia; own work)
The minimum and maximum values correspond to the range of variability. The lowest
expected squared deviation from the mean of values is measured at Poverty Gap Index what is
given by the relatively consistent data of indicator which does not evince any extreme values.
Its standard deviation is equal to 1. The highest variance is computed for both types of
migration. Thus naturally the standard deviation of both migrations has the highest square
roots of given variances. However the variance is not robust technique as it is a dimensional
technique expressed in individual units of the data.
Coefficient of variation is more suitable to report the variability. With no dimension is
expressed in percentage. The lowest quotient of standard deviation and mean is measured at
HDI indicator (V = 6.315 %) and it means that HDI dataset is more concentrated around
mean. The highest coefficient of variation has FDI indicator as the contrast between
maximum and minimum value increases the mean, gives evidence about remote values and
high variability.
Evidently, four indicators (GDP, both migrations and FDI) are right-sided skewed what
indicates the number of values located under the average. This is probably caused by
individually high values at DKI Jakarta and other provinces of Java which does not indicate
the normal symmetry of data. Remaining indicators (HDI, Poverty Gap Index and
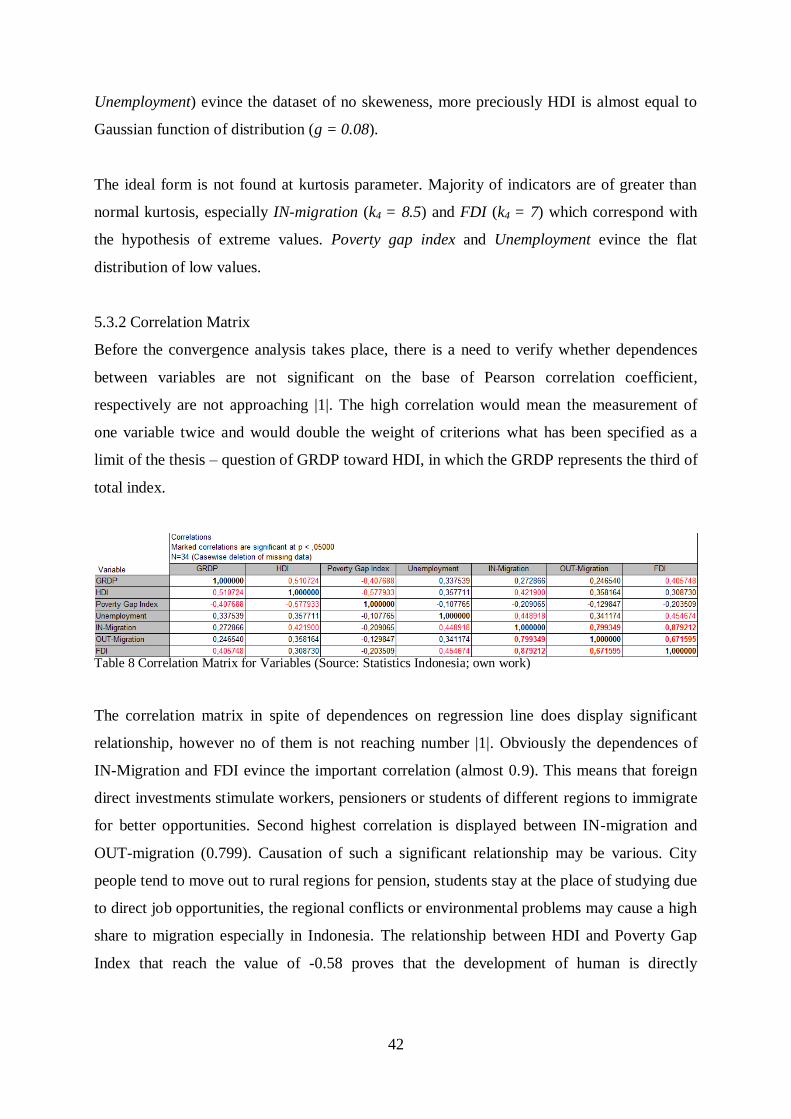
42
Unemployment) evince the dataset of no skeweness, more preciously HDI is almost equal to
Gaussian function of distribution (g = 0.08).
The ideal form is not found at kurtosis parameter. Majority of indicators are of greater than
normal kurtosis, especially IN-migration (k4 = 8.5) and FDI (k4 = 7) which correspond with
the hypothesis of extreme values. Poverty gap index and Unemployment evince the flat
distribution of low values.
5.3.2 Correlation Matrix
Before the convergence analysis takes place, there is a need to verify whether dependences
between variables are not significant on the base of Pearson correlation coefficient,
respectively are not approaching |1|. The high correlation would mean the measurement of
one variable twice and would double the weight of criterions what has been specified as a
limit of the thesis – question of GRDP toward HDI, in which the GRDP represents the third of
total index.
Table 8 Correlation Matrix for Variables (Source: Statistics Indonesia; own work)
The correlation matrix in spite of dependences on regression line does display significant
relationship, however no of them is not reaching number |1|. Obviously the dependences of
IN-Migration and FDI evince the important correlation (almost 0.9). This means that foreign
direct investments stimulate workers, pensioners or students of different regions to immigrate
for better opportunities. Second highest correlation is displayed between IN-migration and
OUT-migration (0.799). Causation of such a significant relationship may be various. City
people tend to move out to rural regions for pension, students stay at the place of studying due
to direct job opportunities, the regional conflicts or environmental problems may cause a high
share to migration especially in Indonesia. The relationship between HDI and Poverty Gap
Index that reach the value of -0.58 proves that the development of human is directly
43
connected with poverty in meaning of GDP increasing. The correlation of GRDP and HDI
(0.51) shows that the specified limitation of thesis is not a serious concern.
5.3.3 Beta-Convergence Analysis
In order of beta-convergence, the coefficient of growth needs to be calculated. The computing
is processed as a quotient of yn and y0 for single variable with regard to the determined period.
In this analysis, it is fifth root for the vast majority of cases. The only case when the root
differs is the province of North Kalimantan. The root depends on the shorter period for which
the data is published.
Generally, the beta-convergence works with logarithmic transformation of dependent
variables (base-year value and coefficient of growth). The base-year value is fitted on
horizontal x-axis and coefficient of growth is fitted on y-axis of scatterplot. Logarithmic
transformation has been carried concerning to eliminate right skeweness that is determined by
basic statistics techniques, eliminate the extreme values of outliers and transmit the different
units of indicators into dimensionless form. Due to regression model, the beta coefficient is
calculated as well as coefficient of determination by which the quality of the fit is indicated.
All the outputs are computed via STATISTICA Software. The results are displayed on regular
linear-fit type scatterplot graph. The graph contains the correlation diagram to divide the
scatter into four quadrants. The correlation diagram is an intersection of parallel lines to axis
established by the mean of depended variables. In situation of unproved
convergence/divergence (determination coefficient does not approach at least 50 %) the result
follows from the distribution of cases across the quadrants. If the most of cases is located in
second and fourth quadrant, the convergence is ascertained. The majority of cases founded in
first and fourth quadrants indicate highly proved divergence. The lowest coefficient of
determination, the wider variability of cases occurs over quadrants.
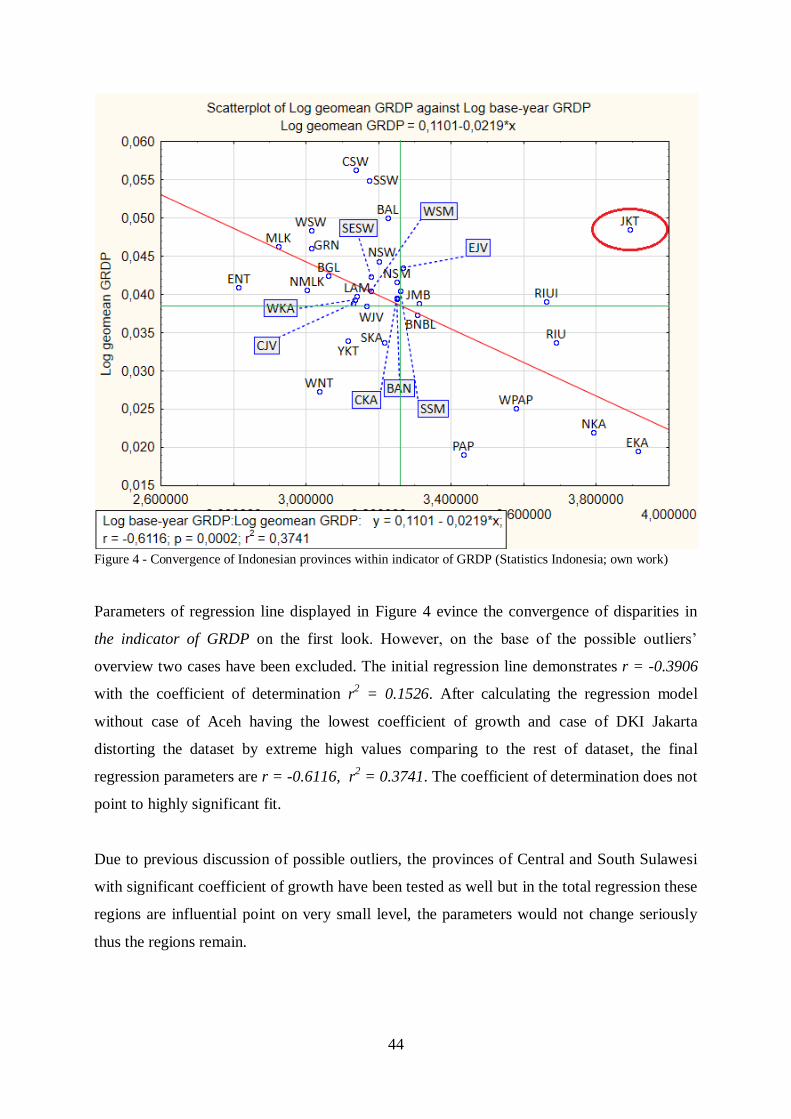
44
Figure 4 - Convergence of Indonesian provinces within indicator of GRDP (Statistics Indonesia; own work)
Parameters of regression line displayed in Figure 4 evince the convergence of disparities in
the indicator of GRDP on the first look. However, on the base of the possible outliers’
overview two cases have been excluded. The initial regression line demonstrates r = -0.3906
with the coefficient of determination r2 = 0.1526. After calculating the regression model
without case of Aceh having the lowest coefficient of growth and case of DKI Jakarta
distorting the dataset by extreme high values comparing to the rest of dataset, the final
regression parameters are r = -0.6116, r2 = 0.3741. The coefficient of determination does not
point to highly significant fit.
Due to previous discussion of possible outliers, the provinces of Central and South Sulawesi
with significant coefficient of growth have been tested as well but in the total regression these
regions are influential point on very small level, the parameters would not change seriously
thus the regions remain.
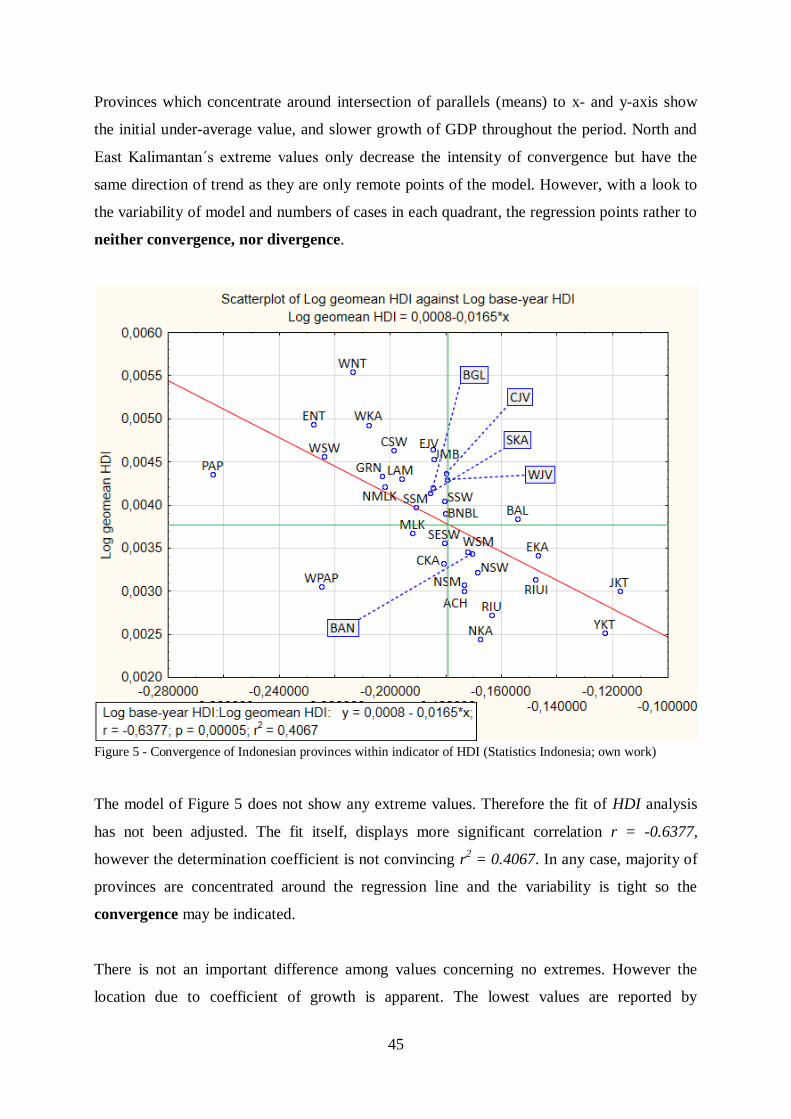
45
Provinces which concentrate around intersection of parallels (means) to x- and y-axis show
the initial under-average value, and slower growth of GDP throughout the period. North and
East Kalimantan´s extreme values only decrease the intensity of convergence but have the
same direction of trend as they are only remote points of the model. However, with a look to
the variability of model and numbers of cases in each quadrant, the regression points rather to
neither convergence, nor divergence.
Figure 5 - Convergence of Indonesian provinces within indicator of HDI (Statistics Indonesia; own work)
The model of Figure 5 does not show any extreme values. Therefore the fit of HDI analysis
has not been adjusted. The fit itself, displays more significant correlation r = -0.6377,
however the determination coefficient is not convincing r2 = 0.4067. In any case, majority of
provinces are concentrated around the regression line and the variability is tight so the
convergence may be indicated.
There is not an important difference among values concerning no extremes. However the
location due to coefficient of growth is apparent. The lowest values are reported by
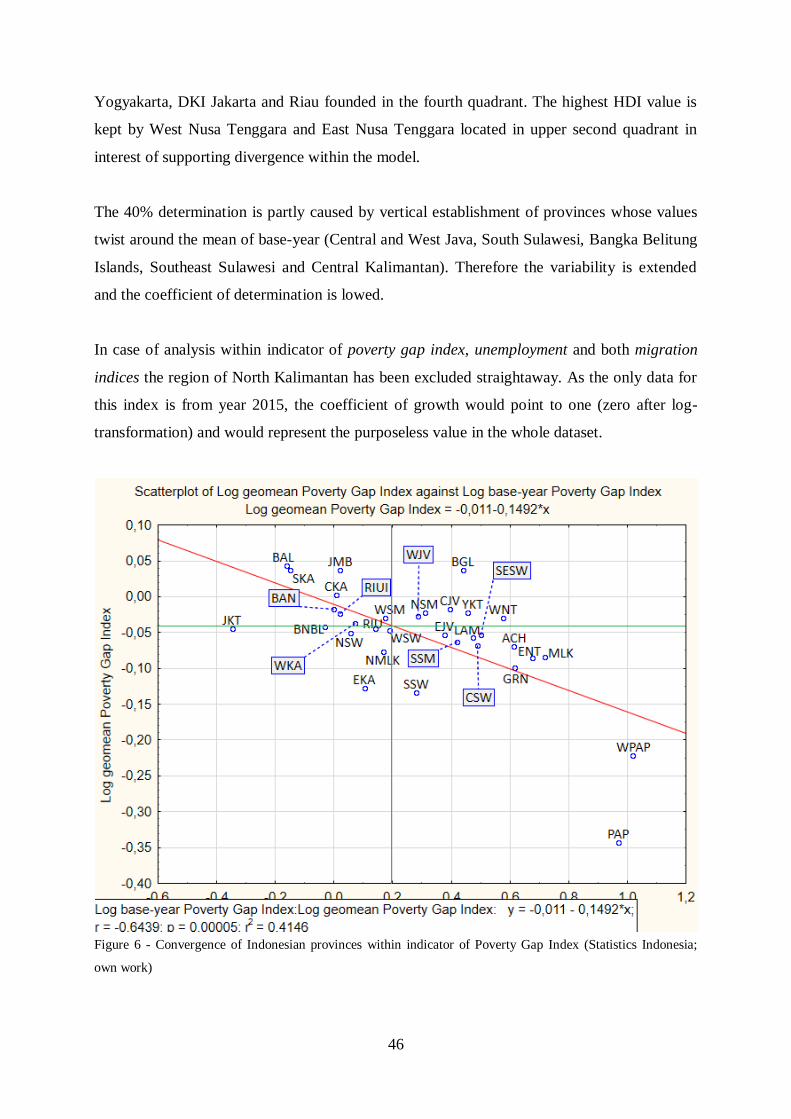
46
Yogyakarta, DKI Jakarta and Riau founded in the fourth quadrant. The highest HDI value is
kept by West Nusa Tenggara and East Nusa Tenggara located in upper second quadrant in
interest of supporting divergence within the model.
The 40% determination is partly caused by vertical establishment of provinces whose values
twist around the mean of base-year (Central and West Java, South Sulawesi, Bangka Belitung
Islands, Southeast Sulawesi and Central Kalimantan). Therefore the variability is extended
and the coefficient of determination is lowed.
In case of analysis within indicator of poverty gap index, unemployment and both migration
indices the region of North Kalimantan has been excluded straightaway. As the only data for
this index is from year 2015, the coefficient of growth would point to one (zero after log-
transformation) and would represent the purposeless value in the whole dataset.
Figure 6 - Convergence of Indonesian provinces within indicator of Poverty Gap Index (Statistics Indonesia;
own work)
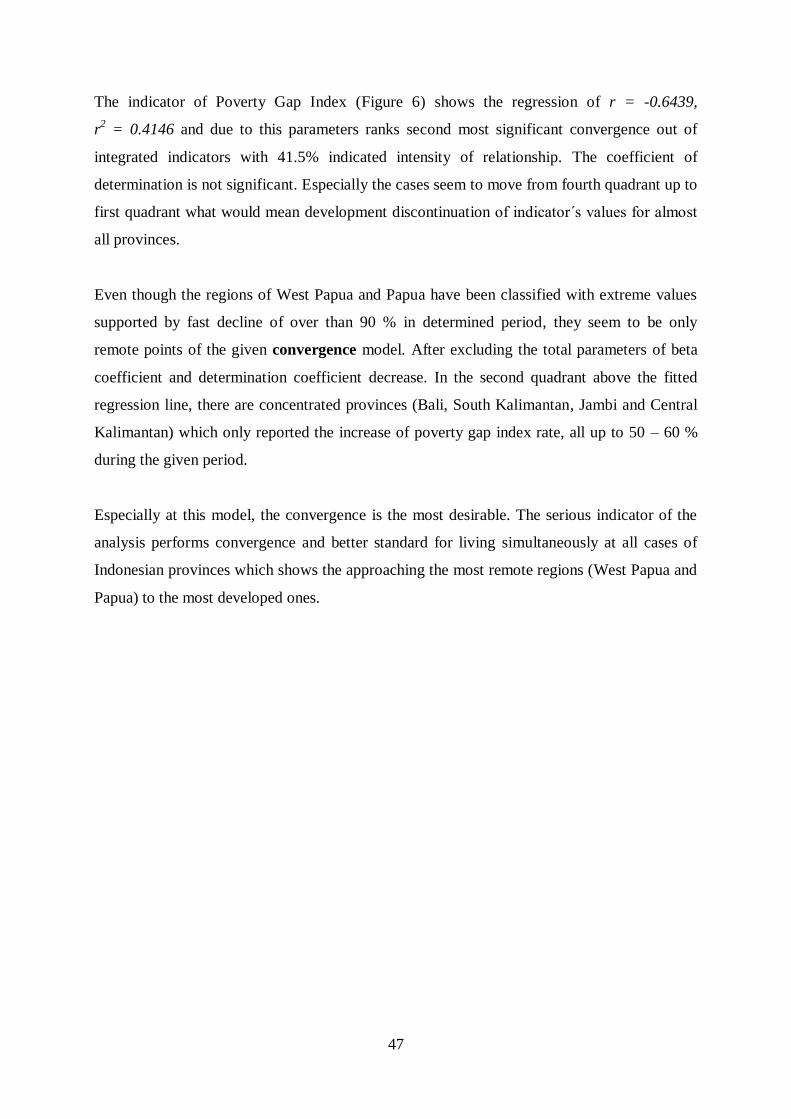
47
The indicator of Poverty Gap Index (Figure 6) shows the regression of r = -0.6439,
r2 = 0.4146 and due to this parameters ranks second most significant convergence out of
integrated indicators with 41.5% indicated intensity of relationship. The coefficient of
determination is not significant. Especially the cases seem to move from fourth quadrant up to
first quadrant what would mean development discontinuation of indicator´s values for almost
all provinces.
Even though the regions of West Papua and Papua have been classified with extreme values
supported by fast decline of over than 90 % in determined period, they seem to be only
remote points of the given convergence model. After excluding the total parameters of beta
coefficient and determination coefficient decrease. In the second quadrant above the fitted
regression line, there are concentrated provinces (Bali, South Kalimantan, Jambi and Central
Kalimantan) which only reported the increase of poverty gap index rate, all up to 50 – 60 %
during the given period.
Especially at this model, the convergence is the most desirable. The serious indicator of the
analysis performs convergence and better standard for living simultaneously at all cases of
Indonesian provinces which shows the approaching the most remote regions (West Papua and
Papua) to the most developed ones.
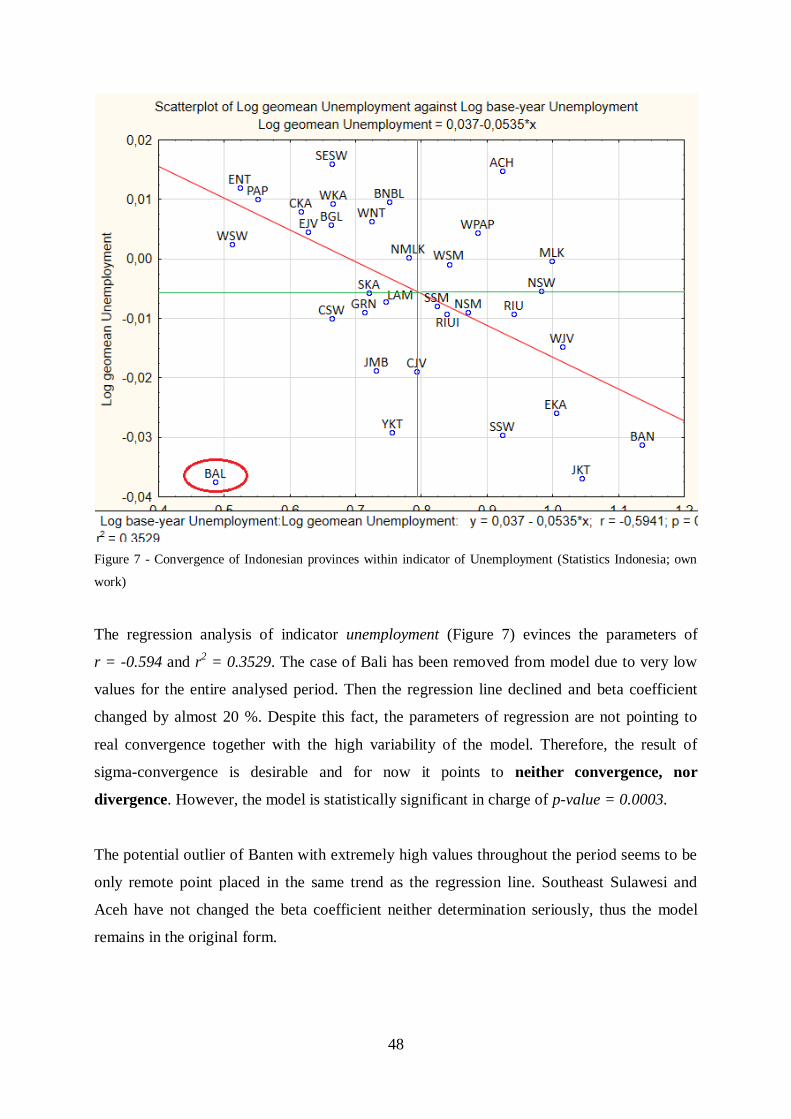
48
Figure 7 - Convergence of Indonesian provinces within indicator of Unemployment (Statistics Indonesia; own
work)
The regression analysis of indicator unemployment (Figure 7) evinces the parameters of
r = -0.594 and r2 = 0.3529. The case of Bali has been removed from model due to very low
values for the entire analysed period. Then the regression line declined and beta coefficient
changed by almost 20 %. Despite this fact, the parameters of regression are not pointing to
real convergence together with the high variability of the model. Therefore, the result of
sigma-convergence is desirable and for now it points to neither convergence, nor
divergence. However, the model is statistically significant in charge of p-value = 0.0003.
The potential outlier of Banten with extremely high values throughout the period seems to be
only remote point placed in the same trend as the regression line. Southeast Sulawesi and
Aceh have not changed the beta coefficient neither determination seriously, thus the model
remains in the original form.
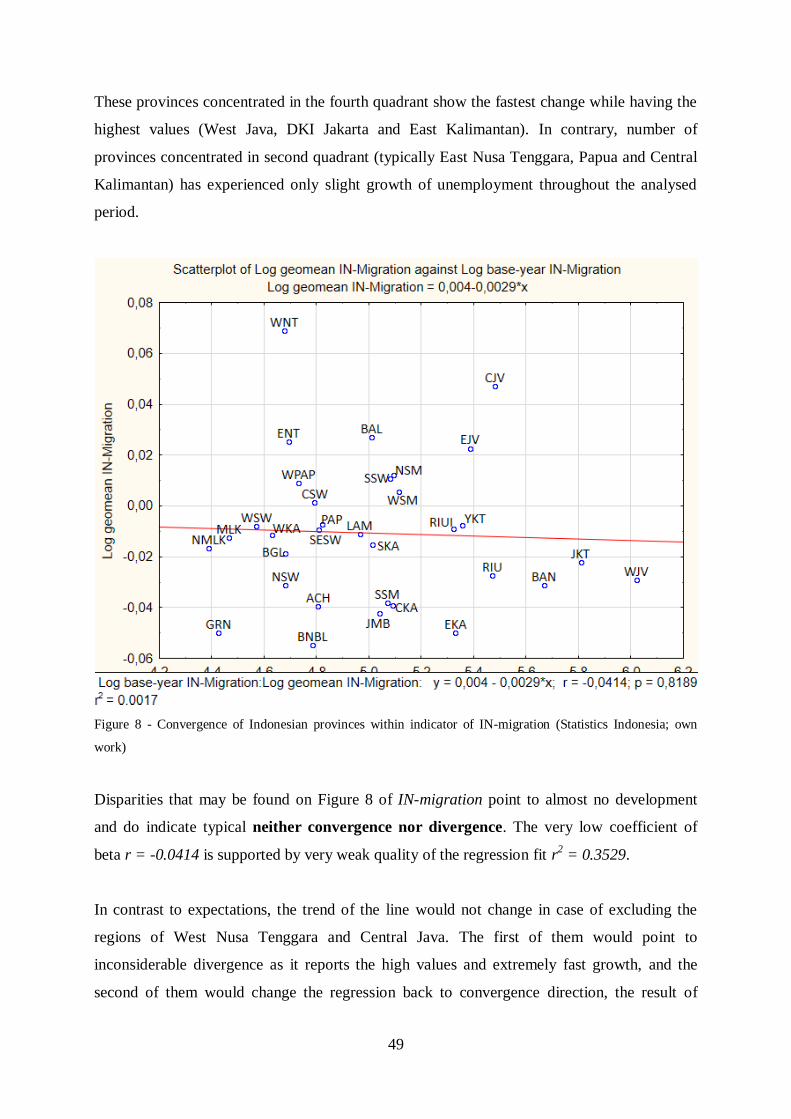
49
These provinces concentrated in the fourth quadrant show the fastest change while having the
highest values (West Java, DKI Jakarta and East Kalimantan). In contrary, number of
provinces concentrated in second quadrant (typically East Nusa Tenggara, Papua and Central
Kalimantan) has experienced only slight growth of unemployment throughout the analysed
period.
Figure 8 - Convergence of Indonesian provinces within indicator of IN-migration (Statistics Indonesia; own
work)
Disparities that may be found on Figure 8 of IN-migration point to almost no development
and do indicate typical neither convergence nor divergence. The very low coefficient of
beta r = -0.0414 is supported by very weak quality of the regression fit r2 = 0.3529.
In contrast to expectations, the trend of the line would not change in case of excluding the
regions of West Nusa Tenggara and Central Java. The first of them would point to
inconsiderable divergence as it reports the high values and extremely fast growth, and the
second of them would change the regression back to convergence direction, the result of
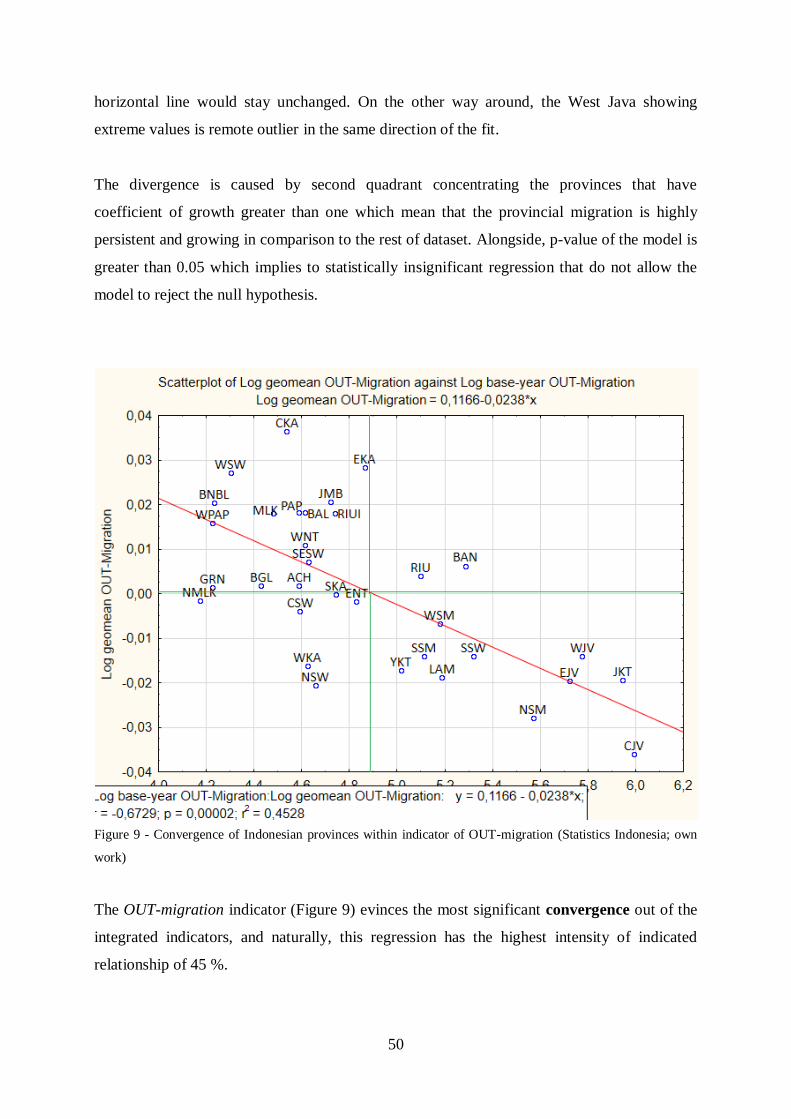
50
horizontal line would stay unchanged. On the other way around, the West Java showing
extreme values is remote outlier in the same direction of the fit.
The divergence is caused by second quadrant concentrating the provinces that have
coefficient of growth greater than one which mean that the provincial migration is highly
persistent and growing in comparison to the rest of dataset. Alongside, p-value of the model is
greater than 0.05 which implies to statistically insignificant regression that do not allow the
model to reject the null hypothesis.
Figure 9 - Convergence of Indonesian provinces within indicator of OUT-migration (Statistics Indonesia; own
work)
The OUT-migration indicator (Figure 9) evinces the most significant convergence out of the
integrated indicators, and naturally, this regression has the highest intensity of indicated
relationship of 45 %.
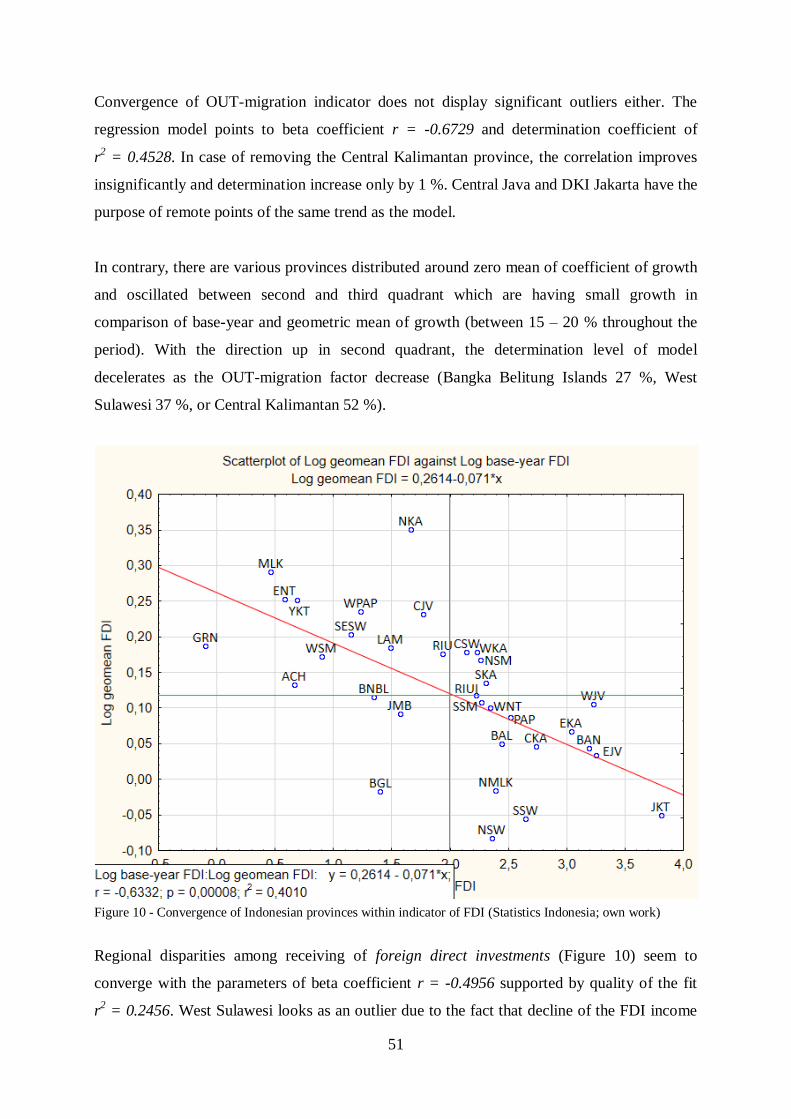
51
Convergence of OUT-migration indicator does not display significant outliers either. The
regression model points to beta coefficient r = -0.6729 and determination coefficient of
r2 = 0.4528. In case of removing the Central Kalimantan province, the correlation improves
insignificantly and determination increase only by 1 %. Central Java and DKI Jakarta have the
purpose of remote points of the same trend as the model.
In contrary, there are various provinces distributed around zero mean of coefficient of growth
and oscillated between second and third quadrant which are having small growth in
comparison of base-year and geometric mean of growth (between 15 – 20 % throughout the
period). With the direction up in second quadrant, the determination level of model
decelerates as the OUT-migration factor decrease (Bangka Belitung Islands 27 %, West
Sulawesi 37 %, or Central Kalimantan 52 %).
Figure 10 - Convergence of Indonesian provinces within indicator of FDI (Statistics Indonesia; own work)
Regional disparities among receiving of foreign direct investments (Figure 10) seem to
converge with the parameters of beta coefficient r = -0.4956 supported by quality of the fit
r2 = 0.2456. West Sulawesi looks as an outlier due to the fact that decline of the FDI income
52
has been -95 % during the given period. Its removing changes the regression rapidly. The new
values report the relation of r = -0.6332 and the determination grows up to 40 %. Thus the
convergence trend may be estimated.
The downward trend follows the leading province in foreign investments income – DKI
Jakarta. Simultaneously, Jakarta (together with East Java, North Maluku, North Sulawesi,
etc.) evinces the fastest decline in receiving of FDI.
North Kalimantan for which the data are known since 2013 and are above-average seems to
be supported more than other same developing regions what is evident in its fast growing
trend. However, the province does not influence the convergence model significantly as the
constriction raise by 4 %. The quadrant where North Kalimantan belongs contains numerous
provinces which are having the steady or growing dynamics.
5.3.4 Sigma-Convergence Analysis
Beta-convergence analysis proved the almost all indicators converge on the base of
coefficient of growth. The standard deviation of variables for each year and its development
in time support or disprove the previous results.
The evaluation of sigma-convergence implies in table 7 and is graphically designed on the
graphs (see Appendix 3: Sigma-convergence Graphs8) where the standard deviation evinces
the progress (shape) in diffracted line. Calculation and graphical outputs comes from the
interface of STATISTICA Software.
8 The multiple line plot of sigma-convergence carries the time coordinates on x-axis and values of standard
deviation as depended variables. The diffraction line does not cover indicators of IN-migration
and OUT-migration as only the base-year and last year data are available.
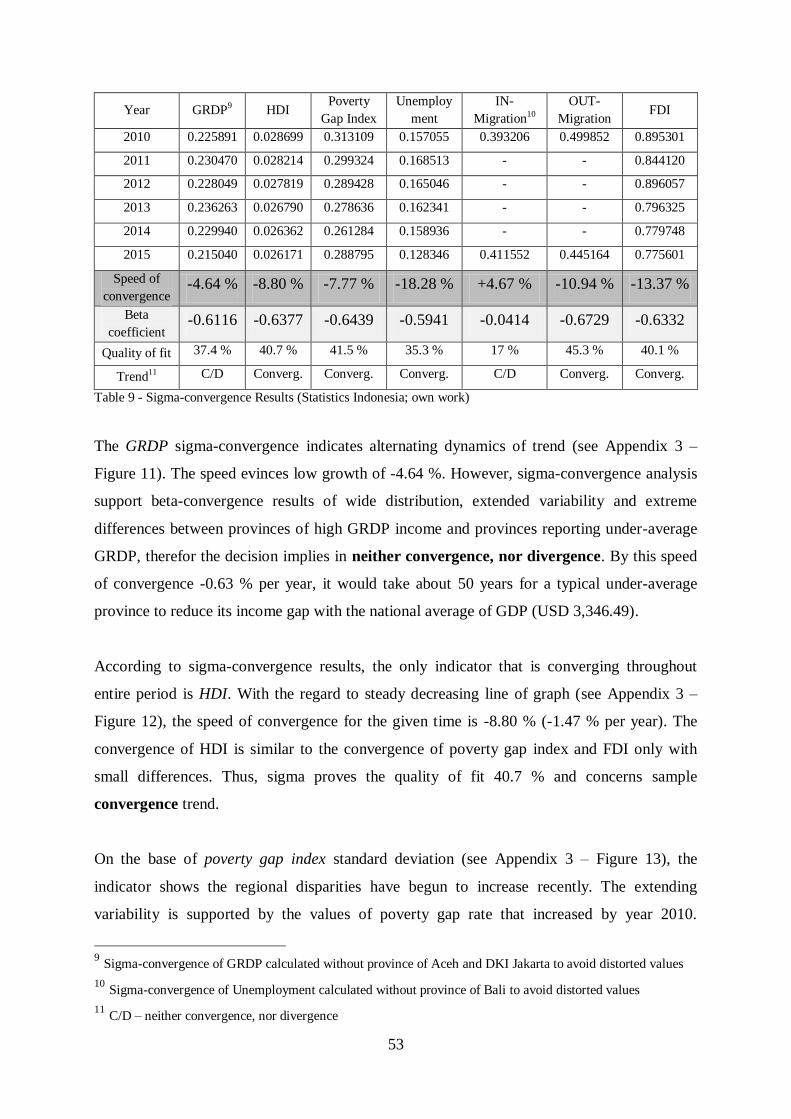
53
Year GRDP9 HDI Poverty
Gap Index
Unemploy
ment
IN-
Migration10
OUT-
Migration FDI
2010 0.225891 0.028699 0.313109 0.157055 0.393206 0.499852 0.895301
2011 0.230470 0.028214 0.299324 0.168513 - - 0.844120
2012 0.228049 0.027819 0.289428 0.165046 - - 0.896057
2013 0.236263 0.026790 0.278636 0.162341 - - 0.796325
2014 0.229940 0.026362 0.261284 0.158936 - - 0.779748
2015 0.215040 0.026171 0.288795 0.128346 0.411552 0.445164 0.775601
Speed of
convergence -4.64 % -8.80 % -7.77 % -18.28 % +4.67 % -10.94 % -13.37 %
Beta
coefficient -0.6116 -0.6377 -0.6439 -0.5941 -0.0414 -0.6729 -0.6332
Quality of fit 37.4 % 40.7 % 41.5 % 35.3 % 17 % 45.3 % 40.1 %
Trend11 C/D Converg. Converg. Converg. C/D Converg. Converg.
Table 9 - Sigma-convergence Results (Statistics Indonesia; own work)
The GRDP sigma-convergence indicates alternating dynamics of trend (see Appendix 3 –
Figure 11). The speed evinces low growth of -4.64 %. However, sigma-convergence analysis
support beta-convergence results of wide distribution, extended variability and extreme
differences between provinces of high GRDP income and provinces reporting under-average
GRDP, therefor the decision implies in neither convergence, nor divergence. By this speed
of convergence -0.63 % per year, it would take about 50 years for a typical under-average
province to reduce its income gap with the national average of GDP (USD 3,346.49).
According to sigma-convergence results, the only indicator that is converging throughout
entire period is HDI. With the regard to steady decreasing line of graph (see Appendix 3 –
Figure 12), the speed of convergence for the given time is -8.80 % (-1.47 % per year). The
convergence of HDI is similar to the convergence of poverty gap index and FDI only with
small differences. Thus, sigma proves the quality of fit 40.7 % and concerns sample
convergence trend.
On the base of poverty gap index standard deviation (see Appendix 3 – Figure 13), the
indicator shows the regional disparities have begun to increase recently. The extending
variability is supported by the values of poverty gap rate that increased by year 2010.
9 Sigma-convergence of GRDP calculated without province of Aceh and DKI Jakarta to avoid distorted values
10 Sigma-convergence of Unemployment calculated without province of Bali to avoid distorted values
11 C/D – neither convergence, nor divergence
54
However, together with beta analysis it points to convergence for now. The FDI sigma-
convergence displays (see Appendix 3 – Figure 15) increasing of disparity within year 2012.
The slope down model had been cough up in following years and final speed of convergence
is calculated as -13.37 % what is equivalent to -2.23 % yearly. This implies in obvious
convergence result.
The unemployment rate has the most satisfying results of sigma-convergence analysis (see
Appendix 3 – Figure 14). Its variability is steady decreasing what is partly supported by beta-
convergence that does not evince the surprising determination. However, if the speed of
sigma-convergence remains unchanged the under-average provinces catch up the mean of rate
6.2 % within 10 years. Over all the variability proves the fastest speed of convergence and
support the regression of -0.59.
Result of sigma-convergence of IN-Migration goes in line with the beta. The convergence has
not been proved and the trend of disparity remains still – model of neither convergence, nor
divergence. Very likely, together with the OUT-Migration results the overall issue of
migration is decreasing on one hand, but Indonesians rather move out from Indonesia than
moving into another province. As the factors of migrations are connected directly to each
other, the development of both would follow the same trend of grow/decrease. This is based
in the sigma speed of +4.67 % (0.78 % per year) of IN-migration indicator and convergence
of -10.94 % (1.82 % per year) for OUT-migration indicator, what is highly supported by
results of beta-convergence.
55
6. PROPOSAL PART
By the analytical part, the convergence of disparities among provinces of Indonesia has been
assessed for indicators of HDI, Poverty Gap Index, Unemployment, OUT-migration and FDI.
The speed of convergence differs, however the development throughout the given period is
noticeable. The indicators of GRDP and IN-migration are classified as neither converging nor
diverging. Subsequently, the discussion how to support continuous elimination of disparities
need to be settled.
For the record, the neutral indicators are not proved to highly correlate or to have any
significant connection to each other. The GRDP partially influence the HDI indicator as there
is a positive correlation. The IN-migration positively correlates with FDI, thus the practical
part encourages FDI and takes IN-migration as continuity. The following part provides
suggestion how to support the convergence process within Indonesian provinces with the look
scientific analysis done in the past and with the approach to GRDP and IN-migration
indicator. (Firdaus & Zulkornain, 2009; Irawan, 2014; Tirtosuharto, 2013; Wihardja, 2014;
Maimun, Hamzar, Syechalad, & Nazamuddin, 2014)
6.1 SUSTAINABLE GROWTH
Although, decentralization is necessary in welfare-enhancing policy and effective in
addressing regional disparities, the continuing of implementation of decentralization is
necessary. First of all, the local development strategies must be worked out together with
local governments of provinces and economic and social subjects as stakeholders as the
development strategies are driven in attracting the economic activities and cooperation with
other (wealthier) provinces must be settled as the source of government financing is limited
however is rising aligned to GDP growth. Provincial development strategies should cover all
needs and shortages of individual provinces including to a view to cultural and geographical
issues and socioeconomic level.
The most important strategy concerning the development of entire country is Master Plan
Acceleration and Expansion of Indonesia Economic Development 2011-2015 which goes in
line with the vision set in the national long-term development plan (2005-2025). Initially the
Master Plan had been targeted to the 8 % growth after year 2013. However the intention
changed into aiming to turn Indonesia to one of the world´s largest economy by 2025.
56
The heart of Master Plan is the Indonesian government´s awareness about potential and
comparativeness of each province. In order to this plan, the country is divided into six
corridors of economic acceleration and expansion.12
With the regard to regional policy, the
improvement of regulations and permits on regional level should be following. Firstly, the
economic potential development through economic corridors is set. Secondly, the
straightening of national connectivity is provided and straightening the national human
resources capability and science and technology need to be executed. At the same time, the
provincial spatial planning must be finalized as it is used as a basis to overcome potential land
use conflict in utilization as forest, plantation, and mining area. There are still challenges in
the security sector. Local governments need to improve safety and security capabilities
through the implementation of strict rules and sanctions for crimes (corruption).
From the mention of the Master Plan follows that Indonesian central government does not
admit any other direction of provinces. The unbalanced development should be established
which means that limited sector should be supported in specific Indonesian province to
achieve the determined direction. For instance, the poorest region of Nusa Tenggara is
classified to be used as a touristic destination and food support. This leads to the lack of
secondary industrial sector as only agriculture and services are expanded. In case of
implementation of food industrial processing, the region would reach the higher IN-migration
and foreign direct investments. Even though West and East Nusa Tenggara experience the
positive development in migration and FDI, they still lag behind the rest of the country.
However, due to Hamada (2013) Indonesia has entry the global production networks recently
so there is a space for change now.
At the same time, building of the sustainable growth means to deliver the exceptional
experience. However, the decentralization of Indonesia had negative impacts that cause the
instable and unreliable environment. Besides a corruption within the local government
structures, the competitive advantage for foreign investors is not fulfilled plus the earlier
12
Sumatra is a centre for production and processing of natural resources and as nation´s energy reserves. Java is
a driver for national industry and service provision. Kalimantan is a centre for production and processing of
national mining and energy reserves. Sulawesi is a production and processing of national agricultural, plantation,
fishery and oil and gas. Bali together with West and East Nusa Tenggara is a gateway for tourism and national
food support. Papua and Maluku Islands is a centre for development of food, fisheries, energy and national
mining.
57
researches (e.g. Lučić, Radišić, Dobromilov, 2016) demonstrate the negative correlation
between corruption and GDP (GRDP) growth.
6.2 PROMOTING OF HUMAN DEVELOPMENT
The Human Development Index in the last six years shows there is still a significant number
of people who have poor nutrition and health status, lack of access to drinking water and
health services (Papua, West Papua, East Nusa Tenggara, West Sulawesi). These indicate that
education, health, nutrition and basic infrastructure are among sectors that should receive
more attention in a poverty reduction strategy, although the poor provinces are peripheral
areas with high shipping costs and limited access to the centre. (Ministry of National
Development Planning, Republic of Indonesia, 2006)
The HDI may be encouraged by GRDP (as a sub-indicator of the overall indicator) growth on
the base of industry and services extension, or may be promoted thanks to centrally-driven
help of government. The mixture of both is an outcome of healthy society and inventive
market. In fact, Indonesia has launched the ambitious project to establish a compulsory
national health insurance system with the aim of making basic care available for everyone by
2019 by state provisions and NGOs support. (Razavi, 2015) At the same time, government
has doubled the budget spending for education since 2000, especially in increasing the access
to education. In order to decentralization, the Government launched a massive program as a
way of injecting funds directly into schools in order to keep children in school and give
schools some flexibility in managing their own funds. (The World Bank, 2014a) According to
the speed of development of HDI, the change should be taken more specifically.
The strategy to promote the health status and education together is a system of assigned
general practitioners and teachers (whose number is actually rising in Indonesia) working in
poor regions divided to gradient areas. These workers managed by central government
together with provincial government would replace stakeholders that gather and evaluate the
monitoring process within the poor regions. With no need to cash transfer, the delivery of
necessary goods and final products to schools and medical centres/doctor offices, the team of
doctor and teachers may evaluate the needs, predominantly in health, education, basic
infrastructure, drinking water and sanitation, food and nutrition.
58
In case of education and health care free for everyone, the human development index should
be rising. The objective is to provide higher accessibility to medical centres and schools in
remote areas by continuous increasing of number of schools. Free drinking water in schools
and medical centres would be provided through the NGOs support and thanks to the water
filter technologies, together with free education schoolbooks, unlimited disinfection agents,
social assistance especially for woman and children, and community empowerment. In the
context of costs for delivery of intention, final products transports, there is always an option
of full-loading system of transportation for all directions familiar from the central-driven
economy and special cooperation of PPP system together with NGOs which assign the
specific tasks to private sector roofed by strictly concluded budget and contractual in change
for advantage tax payment.
Otherwise, the international organizations as the World Bank may be included in foundation
of the program´s technical implementation. As the World Bank works closely with the central
government of Indonesia in its efforts to reduce poverty which covers a broad range of areas,
such as poverty trends, social assistance, social insurance, community-based programs and
generating more and better jobs. (The World Bank, 2014b)
In order of HDI analyses, some the speed of development was found regarding to school
enrolment. Surprisingly, the fastest growing provinces are the poorest (West and East Nusa
Tenggara, West Kalimantan, East Java, Central Sulawesi). The slowest growing are DKI
Jakarta, Riau or North Kalimantan. Nevertheless, the regional disparities are obvious as at
primary school level the net enrolment rate ranges from 94.7% in Bali to 83.1% in West
Papua. For lower secondary school enrolment, the provincial disparity in net enrolment rates
is wider, from 94.7% in the DKI Jakarta to 31.6% in Papua, due to the fact that enrolment in
urban areas is literally higher than in rural which is at the same time connected with high-
quality schools in cities and least skilled teachers and school management in least-well
equipped schools. (OECD/Asian Development Bank, 2015) It asks for improving of social
and economic standard and improvement of school enrolment.
Therefore, every province should be required to design a targeted programme what is
recommended by OECD and ADB (2015) to ensure all schools reach the set minimum service
standards and should work out a plan to reach the minimum number of schools per capita
what may be a standard for whole country. It would provide differentiated support to help
59
provinces reach the establishment of school number and to help schools to achieve the
standards in remote and disadvantaged areas. More preciously, the provinces with high rural
share (Papua, West Papua) should cooperate with NGOs as Global Partnership for Education
in developing quality education sector plans and reduce the schools distance established on
the base of province´s needs.
The quality is different issue. Which is measured and year-by-year improved by higher
budged allocated for quality betterment. Therefore the focus on quality of education, on-spot
industry and education and the management approach to human resources must be in place.
(Benson & Rowley, 2002; the World Bank, 2014a)
At the same time, the poorest provinces of Indonesia carry a big potential for NGOs interested
in power supply support. This may be one of the options how to overcome the geographic
conditions that possibly create the regional inequalities as the Nusa Tenggara and Sulawesi
are islands with improper infrastructure and lack of industry potential but at the same time not
that far from the centre of country. There is a great capacity for wind, sun and sea power
stations producing power for local population as well as power for sale in the power
engineering market. This intention is proved by Singapore investment financing the wind
energy farm in West Sulawesi in the near future. (Ver-Bruggen, 2016)
6.3 PROMOTING OF CAPITAL MOBILITY
According to various analyses (Tirtosuharto, 2013; Dutu, 2015), the decentralisation of
Indonesia had a negative impact on economic growth of GRDP per capita and requirements to
foreign direct investment beside the fact that Indonesia is highly GDP growing country (the
largest of ASEAN). From the economic point of view and from the evidence of right skewed
data of GRDP, the gap between central and the most developed provinces (DKI Jakarta, North
Kalimantan, Riau and Riau Islands) which have the highest income of GRDP, and provinces
that are poor/developing (Maluku, East Nusa Tenggara, North Maluku, etc.) is broaden due to
lack of central economic interventions, unequal distribution of market segments and unequal
bargaining of labour force. Thus, the decentralized Indonesia allowed regions greater political
autonomy and to retain a substantial share of generated income.
In case of central government´s economic interventions of the Master Plan, a cluster analysis
would display the business sector networks to subsequent operation with promoting the
60
collaboration with real and already existing investors to entry the new markets through
branches, licensing, and joint ventures, franchising or building the remote producing
subsidiaries in less developed provinces as there is more capital in the richest regions, and as
there are lower marginal returns to capital and slower economic growth what proves the right
skeweness of unequally distributed data of GRDP and FDI.
Nevertheless, Indonesian investors could be divided into two groups that are distributed
among wealth and poor provinces with no surprise. Firstly, the international holdings or firms
who are able to arrange their own infrastructure and which are oriented to local natural
resources or services and purchase in big cities. Secondly, there are possible national investors
who lack the capital and do not afford the own investment to the infrastructure establishment.
The effort must be supported by state or provinces to grant of entrepreneurship, secondary and
tertiary education and promoting of employment of local population for all positions to
improve and increase the power of purchasing. In this case, the lack of infrastructure may be
compensated by public-private partnership projects of long-term contracts between state or
province and private party to provide a public asset or services.
Also, the infrastructure is connected to export. In several related studies, the development is
straightened by role of exports in economic models. The successful promotion of export is
primarily responsible for rapid industrialization. (Sugiharti, 2014; Fukuda & Toya, 1995) This
unfortunately comes with improper sustainable growth establishment and weak governance
and administration which does not use the development budged aimed to infrastructure fully.
Although the government’s development investment budget is 10% of the whole, the problem
is not the amount but the ability to sufficiently enforce the allocated budget. (Hamada 2013)
In case of well-doing export policy together with improved and efficient usage of budget to
develop infrastructure and in case of successful implementation of PPP project in the sphere
of infrastructure, the FDI may lead to transformation of Indonesian capital into the direct
investment in other countries. This does not need to be connected directly to central
government but the governments of provinces located on the borders invest in external
projects or establish the cross-border partnership (e.g. West Kalimantan in Malaysia, Maluku
in Philippines) and learn the business collaboration from the wealthy regions as Riau and Riau
Islands (cooperating with Singapore).
61
The preferences should be given to the small foreign investors (mainly in private sector) as a
source of economic volume. So then, if the one marginal investor leaves the country, it would
not cause the unemployment problem. Plus, the small investors bring the technology
innovation that is not exaggerated and far more costly and whose knowledge may be devolved
to local firms and producers.
6.4 PROMOTING OF MOBILITY OF LABOUR FORCE
According to the geometric mean of growth of GRDP calculated in order of convergence
analysis, no one of the Indonesian provinces experienced the decrease of GRPD since 2010.
The provinces which range the weakest GDP growth are the above-average provinces (except
Aceh that evinces slow growth and is under-average province) as this phenomenon is in line
to researchers´ expectations and precondition that poorer regions experience the fastest
economic growth. In Aceh, there is a need to establish the regional characteristic industry and
to manage the natural resources by capital investment and to improve the quality of science
and technology oriented to natural resources, e.g. supported by detached departments of
Jakarta institutions and universities.
The Master Plan notices a promoting of touristic destinations in meaning of Bali model,
respectively the Bali´s three times higher GRDP income, minimum unemployment, low rate
of poverty, etc. This would cover the poorest regions of West and East Nusa Tenggara and
would encourage the development. Tourist industry would lead to minimal unemployment,
higher income of GRDP and better social platform in the provinces. The advantage of the
tourism set up is the nearness of Nusa Tenggara to Bali therefore the project may be driven as
volcanoes and virgin nature tourism or lucrative destination for wealthy pensioners.
The poor countries with low productivity tend to grow more rapidly by copying the
technology from the wealthy countries. The same is valid in regional disparities. An ability to
absorb the more advanced technologies is dependent on its social capability. Thus, the quality
of secondary and tertiary education is vital factor in determining the technical competence of
the labour force. As a crucial point, the early childhood education extension may seem as an
opportunity for labour force straightening. In case of widely accessible kindergartens and
early childhood groups in remote areas, the women (especially single mothers) gain an
advantage to entry the job market, reinforce the agriculture and industry sector, achieve more
monetary means to family and approach more suitable social status within population. Again,
62
the early childhood education may be negotiated with private investors, NGOs (Global
Partnership for Education, UNESCO) or may be established from budged overlap of
individual provinces.
The social factors of HDI, poverty gap rate, unemployment net migration are influenced by
the inequality of wage income. According to Wihardja (2014), problem of rising regional
disparities are the real wages that are far more highly for skilled workers while wages for
unskilled workers with primary education or below. Repeatedly, it extends the differences
between wealthy and poor provinces. Indonesia rises its minimum wages every second year,
however the minimum wage does not directly implies the success, and the wage raising
without an accompanying productivity could become a factor decreasing Indonesia´s
international competitiveness. In the case of multi-coloured country as Indonesia is, the
minimum wage should be stated by the local governments with the look to local market and
business situation, province´s capacities, migration and investment mobility as it may reduce
and avoid undesired decreasing of labour and capital quantity.
63
7. CONCLUSION
At the end of 90´s of the 20th
century, Indonesia has implemented new decentralized policy to
facilitate the central apparatus and to encourage and reinforce the power of local provincial
governments. By this step, the country has divided into 33 (that time) almost independent
provinces regarding the socioeconomic development. In order of this change the regional
disparities occurrence may be evident.
Therefore the thesis puts a question: How to Support the Convergence of Socioeconomic
Indicators in Provinces of Indonesia? From the beginning, the thesis studies the
socioeconomic system. Firstly, it focuses on literature review in meaning of the theoretical
framework of regional disparities, its measurement of regional disparities as well as basic
concepts of integrated indicators. For the calculation of convergence of regional disparities,
the indicators as GRDP, HDI, Poverty Gap Index, Unemployment, IN-migration, OUT-
migration and FDI have been selected as they represent the socioeconomic state adequately.
Secondary, the thesis introduces the convergence analysis throughout the analytical part. The
analysis has two fundamental parts – beta-convergence analysis and sigma-convergence
analysis. Both measurements of regional inequality cooperate together and form the final
results about the research. After the calculation of beta-convergence and sigma-convergence,
the results are compared and evaluation comes from as the convergence has occurred in
indicator of HDI, Poverty Gap Index, Unemployment, OUT-migration and FDI. The last two
integrated indicators – GRDP and IN-migration have evinced weak development and slow
growth (GRDP sigma-convergence speed -4.64 % for entire period; IN-migration beta
coefficient -0.0414 and sigma-convergence speed +4.67 %) thus neither convergence nor
divergence is successfully defended.
In order to calculation of convergence analysis, the speed of development of each province for
every integrated indicator has been partially calculated (see Appendix 2: Initial Data – Tables
10 – 16) and the multidimensional character of convergence analysis has been used as well
(basic statistics methods, correlation, quadrant layout within the scatter plot). Therefore, the
speed of individual provincial growth is discovered, the relations among indicators in the
country are overviewed and the specific knowledge brings an appreciated contribution to the
proposal part.

64
The proposal part concerns the primary factors supporting the regional disparities especially
in the sphere of GRDP and IN-migration. Besides, it describes an establishment of sustainable
growth within the socioeconomic indicators that are desired to deliver the expected results
from the view of population. This means to eliminate the marginal problems and issues easy
to solve which affect the significant factors of human development, respectively
encouragement of education and health care, promoting of capital mobility by improvement
of FDI direction and encourage the investments coming directly from Indonesia, finally
promoting of labour force mobility, and empowering the targeted education of population as
well as early childhood education and minimum wage.
The answer to the main thesis´ question “how to support the convergence of socioeconomic
indicators” flow from the partial analyses and leads to promoting the social and economic
systems in poor provinces as the scholastic precondition says that the poorer regions evince
fastest growth. However, the growth of indicators needs to be balanced, and preferably with
no slope down trends.
At the same time, the proposal part serves subjective and specific directions of development
in meaning of supporting the convergence. They may be used as suggestion for wide range of
other consequential works whether the proposals would be fully functioning and applicable
and if the application would bring the expected results. On the other hand, it may serve as
grounding for comparative analysis to work with an alternative model of regional disparity
measurement (Gini coefficient, cluster analysis, factor analysis, etc.).
65
8. LIST OF ACRONYMS
ADB The Asian Development Bank
ASEAN The Association of South East Asian Nations
DKI (Jakarta) The Special Capital Region (of Jakarta)
FDI Foreign direct investment
HDI Human development index
GDP Gross domestic product
GNI Gross national income
GRDP Gross regional domestic product
IMF The International Monetary Fund
NGO Non-governmental organization
OECD The Organization for Economic Co-operation and Development
ppp Purchasing power parity (GDP)
PPP Public-private partnership
UN The United Nations
UNESCO The United Nations Educational, Scientific and Cultural Organization
UNDP The United Nations Development Programme
WB The World Bank
WHO The World Health Organization
66
9. LITERATURE REFERENCES
1. ASEAN. (2009, March 1). Initiative for ASEAN Integration (IAI) Strategic Framework and
IAI Work Plan 2 (2009-2015). 2009 Initiative for ASEAN Integration (IAI) Strategic
Framework and IAI Work Plan 2 . Cha-am: ASEAN.
2. Baumol, W. J. & Blinder, A. S. (2009). Macroeconomics: Principles and Policy. Mason:
South-Western Cengage Learning.
3. Benson, J. & Rowley, C. (2002). Convergence and Divergence in Asian Human Resource
Management. California Management Review, vol. 44, no. 2, pp. 90-109.
4. Blaţek, J. & Uhlíř, J. (2013). Teorie regionálního rozvoje: nástin, kritika, implikace. Praha:
Karolinum.
5. Čadil, J. (2010). Regionální ekonomie: Teorie a aplikace. Praha: C. H. Beck.
6. Department of Economic and Social Affairs, UN. (2015). World Economic Situation and
Prospects 2015. New York: United Nations.
7. Development Programme, UN. (2015). Briefing note for countries on the 2015 Human
Development Report: Indonesia. United Nations.
8. Doessel, D. P. & Gounder, R. (1994). Theory and Measurement of Living Levels: Some
Empirical Results for the Human Dvelopment Index. Journal of International Development:
Vol. 6, No. 4, pp. 415-435.
9. Duce, M. (2003). Definitions of Foreign Direct Investment (FDI): a methodological note.
Madrid: Banco de España.
10. Dufek, J., Minařík, B. & Sojková, Z. (2009, May 11). Konvergenční procesy vybraných
demografických ukazatelů v krajích ČR. ACTA UNIVERSITATIS AGRICULTURAE ET
SILVICULTURAE MENDELIANAE BRUNENSIS, vol. LVIII, pp. 137-143.
11. Dušek, J. (2011). Faktory regionálního růstu a rozvoje (se zaměřením na spolupráci měst
a obcí ve Středočeském kraji). České Budějovice: Vysoká škola evropských a regionálních
studií.
67
12. Dutu, R. (2015, May 28). Making the Most of Natural Resources in Indonesia. OECD
Economics Department Working Papers, no. 1236.
13. Firdaus, M. & Zulkornain, Y. (2009). Dynamic Analysis of Regional Convergence in
Indonesia. International Journal of Economics and Management, vol. 3, pp. 73-86.
14. Fukuda, S. & Toya, H. (1995). Growth, Conditional Convergence in East Asian
Countries: The Role of Exports in Economic. Growth Theories in Light of the East Asian
Experience, vol. 4, pp. 247-265.
15. Gaspár, A. (2012). Convergence analysis: a new approach. Crisis Aftermath: Economic
policy changes in the EU and its Member States (pp. 382-390). Szeged: University of Szeged.
16. Gottheil, F. M. (2013). Principles of Macroeconomics. Cengage Learning: Mason.
17. Hlaváček, P. (2012). Aktéři a mechanismy regionálního rozvoje. Ústí nad Labem:
Univerzita Jana Evangelisty Purkyně v Ústí nad Labem.
18. Hamada, M. (2013). Indonesia: The Surfacing of Structural Problems - the Pressing Issue
of Infrastructure Development. In Japan Center for Economic Research, Asia Research Report
(pp. 61 - 75).
19. Hudec, O. (2009). Región ako systém a jeho rozvoj. In O. Hudec & et al., Podoby
regionálného a miestného rozvoja (pp. 19-52). Košice: Ekonomická fakulta TU Košice.
20. Hughes, J. J. & Perlman, R. (1984). The Economics of Unemployment: A Comparative
Analysis of Britain and the United States. New York: Cambridge University.
21. Irawan, A. (2014). Regional income disparities in Indonesia: Measurements, Convergence
Process, and Decentralization. Urbana: University of Illinois at Urbana-Champaign.
22. Klapka, P. & Tonev, P. (2008). Regiony a regionalizace. In Ekonomická a sociální
geografie (pp. 371-397). Plzeň: Aleš Čeněk.
23. Klufová, R. & Poláková, Z. (2010). Demografické metody a analýzy: demografie české a
slovenské populace. Praha: Wolters Kluwer ČR.
24. Koschin, F. (2005). Demografie: poprvé. Praha: VŠE.
68
25. Krejčí, T. e. (2011). Regionální rozvoj - teorie, aplikace, regionalizace. Brno: Mendlova
Univerzita v Brně.
26. Kutscherauer, A. & et al. (2010). Regional Disparities. Ostrava: VŠB-TU.
27. Kutscherauer, A., Šotkovský, I., Adamovský, J. & Ivan, I. (2013). Socioekonomická
geografie a regionální rozvoj. Regionální analýzy v přístupech socioekonomické geografie k
regionálnímu rozvoji. SAEI, vol. 22. Ostrava: VŠB-TU.
28. Macháček, J. (2011). Koncept místního rozvoje. In R. Wokoun, & et al., Základy
regionálních věd a veřejné správy (pp. 155-162). Plzeň: Aleš Čeněk.
29. Maimun, Hamzar, Syechalad & Nazamuddin. (2014). The Influence of Spatial
Transformation on the Economic Growth of Aceh: A Spatial Econometric Model. Journal of
Economics and Sustainable Development, vol. 5, no. 14, pp. 100-104.
30. Matlovič, R. & Matlovičová, K. (2005). Vývoj regionálnych disparít na Slovensku a
problémy regionálneho rozvoja Prešovského kraja. In Acta Facultatis Studiorum Humanitatis
et Naturae Universitatis Prešoviensis (pp. 66-88). Prešov: Folia Geographica.
31. Minařík, B., Borůvková, J. & Vystčil, M. (2013). Analýzy v regionálním rozvoji. Příbram:
Professional Publishing.
32. Ministry of National Development Planning, Republic of Indonesia. (2006). Poverty
Reduction in Indonesia: A Brief Review of Facts, Efforrts, and Ways Forward. Vientiane:
Ministry of National Development Planning.
33. Ministry of National Development Planning/National Development Planning Agency.
(2011). Masterplan for Acceleration and Expansion of Indonesia Economic Development
2011 - 2025. Jakarta: Coordinating Ministry for Economic Affairs.
34. Mukherjee, S. (2002). Modern Economic Theory. New Delhi: New Age International
Publishers.
35. Muţáková, K. (2010). Demografie. Brno: Vysoká škola Karla Engliše.
69
36. Němečková, T. & Harmáček, J. (2009). Vnější ekonomická diferenciace rozvojových
zemí. In L. Adamcová & T. Němečková et. al, Rozvojová ekonomika (pp. 77-103). Praha:
Oeconomica.
37. O´Higgins, N. (1997). The challenge of youth unemployment. Employment and Training
Papers, vol. 7. Geneva: International Labour Office.
38. OECD. (2008). Benchmark Definition of Foreign Direct Investment. OECD.
39. OECD/Asian Development Bank (2015). Education in Indonesia: Rising to the
Challenge. Paris: OECD Publishing.
40. Poledníková, E. (2014). Regional classification: The case of the Visegrad Four.
Ekonomická Revue - Central European Review of Economic Issues, Vol. 14, pp. 25-37.
41. Postránecký, J. (2011). Regionální politika. In R. Wokoun & et al., Základy regionálních
věd a veřejné správy (pp. 92-105). Plzeň: Aleš Čeněk.
42. Řehoř, P. (2010). Metody hodnocení potenciálu regionů se zaměřením na trh práce. České
Budějovice: Jihočeská univerzita v Českých Budějovicích.
43. Stanton, E. A. (2007). The Human Development Index: A History. Amherst: UMASS.
44. Stejskal, J. & Kovárník, J. (2009). Regionální politika a její nástroje. Praha: Portál.
45. Sugiharti, L. (2014). A Regional Income Convergence Process in East Java (Indonesia):
Do Spatial Dependence and Spatial Regimes Matter? International Proceedings of Economics
Development and Research, vol. 76, pp. 97-107.
46. Susanti, H. & Damayanti, A. (2015, October). Internal Migration in Indonesia: Duration
and Factors. In Working Paper in Economics and Business, Vol. V, no. 5/2015. Depok, West
Java: Department of Economics, Faculty of Economics and Business, University of Indonesia.
47. Svoboda, I. & et al. (2010). Politický extrémismus a terorismus jako ohrožení vnitřní
bezpečnosti státu. Brno: Univerzita obrany.
48. The European Commission. (2006). Portfolio of Overarching Indicators and Streamlined
Social Inclusion, Pensions, and Health Portfolios. Brussel: European Commission.
70
49. The International Labour Organization. (2016). World Employment Social Outlook 2016.
Geneva: ILO.
50. The World Bank. (2003). World Development Indicators. Washington DC: The World
Bank.
51. The World Bank. (2008). World Development Indicators. Washington DC: The World
Bank.
52. Tirtosuharto, D. (2013). Regional Inequality in Indonesia: Did Convergence Occur
Following the 1997 Financial Crisis? Bank Indonesia.
53. Trávníčková, Z. (2010). Vyváţený rozvoj na regionální a globální úrovni. In V. Jeníček &
et al., Vyvážený rozvoj na regionální a globální úrovni (pp. 1-23). Praha: C.H.Beck.
54. Trinugroho, I., Agusman, A., Ariefianto, M. D., Darsono, D. & Tarazi, A. (2015).
Determinants of Cross Regional Disparity in Financial Deepening: Evidence from Indonesian
Provinces. Limoges: Université de Limoges.
55. Turnock, D. (2005). Regional Development with Particular Reference to Cohesion in
Cross-Border Regions. In D. Turnock & et al., Foreign Direct Investment and Regional
Development in East Central Europe and the Former Soviet Union (pp. 141-182). Adlershot:
Ashgate Publishing Limited.
56. Usman, S. (2002). Regional Autonomy in Indonesia: Field Experiences and Emerging
Challenges. SMERU Working Paper. Bali: The SMERU Research Institute.
57. Varadzin, F., Frait, J. & Červenka, M. (2004). Ekonomický rozvoj a růst. Praha:
Professional Publishing.
58. Wihardja, M. M. (2014). Growth, Convergence and Income Distribution: A View from
Indonesia . Growth, Convergence and Income Distribution: The Road from the Brisbane G-20
Summit (pp. 99-106). Washington DC: Brookings.
59. Wokoun, R. (2001). Teorie regionu. In R. Wokoun & et al., Úvod do regionálních věd a
veřejné správy (pp. 39-46). Praha: IFEC.
71
60. Wokoun, R. & Kouřilová, J. (2012). Regionální konkurenceschopnost: teorie, přístupy,
případová studie konkurenceschopnosti regionů cestovního ruchu v ČR. In J. Koutský & P.
Raška, Analýzy regionálního rozvoje - vybrané přístupy a témata (pp. 31-47). Ústí nad
Labem: Univerzita Jana Evangelisty Purkyně.
61. Yamarone, R. (2010). The Trader´s Guide to Key Economic Indicators. Bloomberg Press:
New York.
62. Zemánek, P. (2012). Demografie a populační politika. Olomouc: Univerzita Palackého v
Olomouci.
63. Ţelinský, T. (2009). Regionálné disparity z pohladu chudoby. In O. Hudec & et al.,
Podoby regionálného a miestného rozvoja (pp. 195-243). Košice: Ekonomická fakulta TU
Košice.
64. Ţítek, V. (2002). Regionální Ekonomie a politika I. Brno: Masarykova Univerzita v Brně.
72
10. INTERNET REFERENCES
1. Amnesty International. (2015, August 13). A „lost decade‟ for victims of Indonesia‟s Aceh
conflict. Retrieved November 7, 2016, from Web Amnesty International:
https://www.amnesty.org/en/latest/news/2015/08/a-lost-decade-for-victims-of-indonesias-
aceh-conflict/
2. Asian Development Bank. (2016). Indonesia: Economy. Retrieved October 21, 2016, from
Web Asian Development Bank: https://www.adb.org/countries/indonesia/economy
3. Central Intelligence Agency. (2016, November 3). The World Factbook. Retrieved
November 6, 2016, from Web Central Intelligence Agency:
https://www.cia.gov/library/publications/the-world-factbook/geos/id.html
4. Český statistický úřad. (2016). Regionální hrubý domácí produkt a regionální hrubá
přidaná hodnota (HPH) – v běžných cenách. Retrieved November 6, 2016, from Web Český
statistický úřad: https://www.czso.cz/csu/xc/regionalni-hruby-domaci-produkt-a-regionalni-
hruba-pridana-hodnota-hph-v-beznych-cenach
5. Department for International Development, OECD. (n.d.). Growth: Building jobs and
prosperity in developing countries. Retrieved November 19, 2016, from Web OECD:
http://www.oecd.org/derec/unitedkingdom/40700982.pdf
6. Department of Economic and Social Affairs, UN. (2010, March 17). Gross regional
product (GRP): an introduction. Retrieved November 6, 2016, from Web United Nations:
http://unstats.un.org/unsd/economic_stat/China/background_paper_on_GRP.pdf
7. Development Programme, UN. (2015). Human Development Reports - Indonesia.
Retrieved October 17, 2016, from United Nations Development Programme:
http://hdr.undp.org/en/countries/profiles/IDN
8. Dubois, A. e. (2007, May 4). Regional disparities and Cohesion: What strategies for the
future. Retrieved November 12, 2016, from Web European Parliament:
http://www.europarl.europa.eu/hearings/20070625/regi/study_en.pdf
73
9. Ekonomický deník. (2015, May 5). Indonésie směřuje ke statusu bilionové ekonomiky.
Retrieved October 16, 2016, from Web Ekonomický deník: http://ekonomicky-
denik.cz/indonesie-smeruje-ke-statusu-bilionove-ekonomiky/
10. Eurostat. (2014, December 15). Implementing the new international standards for foreign
direct investment (FDI) statistics . Retrieved November 19, 2016, from Web Eurostat:
http://ec.europa.eu/eurostat/statistics-
explained/index.php?title=Implementing_the_new_international_standards_for_foreign_direc
t_investment_(FDI)_statistics&oldid=189651
11. Eurostat. (2015, November 11). Glossary: Migration. Retrieved November 12, 2016, from
Web Eurostat: http://ec.europa.eu/eurostat/statistics-explained/index.php/Glossary:Migration
12. Eurostat. (2016). Glossary: Unemployment. Retrieved November 19, 2016, from Web
Eurostat: http://ec.europa.eu/eurostat/statistics-explained/index.php/Glossary:Unemployment
13. Human Rights Watch. (2016). World Report 2013: Indonesia . Retrieved October 18,
2016, from Web Human Rights Watch: https://www.hrw.org/world-report/2013/country-
chapters/indonesia
14. Husna, R. (2016, May 8). Indonesia GDP Growth Rate: Trading Economics. Retrieved
October 16, 2016, from Web Trading Economics:
http://www.tradingeconomics.com/indonesia/gdp-growth
15. Indonesia Investments. (2016a, February). Unemployment in Indonesia. Retrieved
December 2, 2016, from Indonesia Investments: http://www.indonesia-
investments.com/finance/macroeconomic-indicators/unemployment/item255?
16. Indonesia Investments. (2016b). Ethnic and Religious Violence in Indonesia. Retrieved
November 7, 2016, from Web Indonesia Investments: http://www.indonesia-
investments.com/business/risks/ethnic-religious-violence/item244
17. Khan, M. (2014, August 20). Three Approaches of Calculating GDP. Retrieved
November 20, 2016, from Web Econtutorials: http://econtutorials.com/blog/three-approaches-
calculating-gdp/
74
18. Kutscherauer, A., & eds. (2008, January). Teoretická východiska regionálních disparit.
Regionální disparity v územním rozvoji ČR - jejich vznik, identifikace a eliminace. Retrieved
November 17, 2016, from Web Regionální disparity:
http://disparity.vsb.cz/vysledky/01_rocni_zprava_2007.pdf
19. Lučić, D., Radišić, M. & Dobromirov, D. (2016, May 13): Causality between corruption
and the level of GDP. In Economic Research, vol. 29 (pp. 360-379). Retrieved December 22,
2016, from Web Taylor & Francis Online:
http://www.tandfonline.com/doi/full/10.1080/1331677X.2016.1169701
20. McCall, T. (2015). What do we mean by Regional Development? Retrieved November 15,
2016, from Web University of Tasmania:
http://www.utas.edu.au/__data/assets/pdf_file/0006/61935/McCall,T.-2010,-What-is-
Regional-Development.pdf
21. Ministerstvo pro místní rozvoj ČR. (2013, April). Strategie regionalniho rozvoje ČR
2014-2020. Retrieved October 31, 2016, from Web Ministerstvo pro místní rozvoj ČR:
http://www.mmr.cz/getmedia/08e2e8d8-4c18-4e15-a7e2-0fa481336016/SRR-2014-
2020.pdf?ext=.pdf
22. Ministerstvo zahraničních věcí České republiky. (n.d.). Indonésie. Retrieved October 16,
2016, from Web Ministerstvo zahraničních věcí České republiky:
http://www.mzv.cz/jnp/cz/encyklopedie_statu/asie/indonesie/
23. OECD. (2016). Regional Development Policy. Retrieved November 15, 2016, from Web
OECD: http://www.oecd.org/gov/regional-policy/regionaldevelopment.htm
24. Orbion. (2014). Indonésie - průvodce. Retrieved October 16, 2016, from Web Orbion:
http://indonesie.orbion.cz/stat/pruvodce/geografie-obyvatelstvo-nabozenstvi-2466/
25. Piesse, M. (2015, August 27). Social and Demographic Issues in Indonesia. Retrieved
November 6, 2016, from Web Future Directions International:
http://futuredirections.org.au/wp-
content/uploads/2015/08/Social_and_Demographic_Issues_in_Indonesia_-_Final.pdf
26. Razavi, L. (2015, May 15). Indonesia´s universal health scheme: one year on, what´s the
verdict? Retrieved December 19, 2016, from the Guardian:
75
https://www.theguardian.com/global-development-professionals-
network/2015/may/15/indonesias-universal-healthcare-insurance-verdict
27. Rural Poverty Portal. (n.d.). Rural Poverty in Indonesia. Retrieved October 17, 2016, from
Rural Poverty Portal: http://www.ruralpovertyportal.org/country/home/tags/indonesia
28. Sibarani, F. (2016, January 1). Foreign Direct Investment into Indonesia Grows 19.2% in
2015. Retrieved December 2, 2016, from Web Indonesia Investments: http://www.indonesia-
investments.com/news/todays-headlines/foreign-direct-investment-into-indonesia-grows-
19.2-in-2015/item6408?
29. The World Bank (2014a, September 1). World Bank and Education in Indonesia.
Retrieved December 19, 2016, from The World Bank:
http://www.worldbank.org/en/country/indonesia/brief/world-bank-and-education-in-indonesia
30. The World Bank. (2014b, October 22). Reducing extreme poverty in Indonesia. Retrieved
December 17, 2016, from The World Bank:
http://www.worldbank.org/en/country/indonesia/brief/reducing-extreme-poverty-in-indonesia
31. The World Bank. (2016). Indonesia. Retrieved November 26, 2016, from The World
Bank: http://data.worldbank.org/country/indonesia
32. The World Bank Institute. (2005, August). Introduction to Poverty Analysis. Retrieved
November 19, 2016, from Web World Bank:
http://siteresources.worldbank.org/PGLP/Resources/PovertyManual.pdf
33. UNESCO. (2016). Poverty. Retrieved October 15, 2016, from Web UNESCO:
http://www.unesco.org/new/en/social-and-human-sciences/themes/international-
migration/glossary/poverty/
34. United Nations. (2015). World Population Prospects: Key findings & Advanced Tables.
Retrieved October 16, 2016, from Web UN:
https://esa.un.org/unpd/wpp/Publications/Files/Key_Findings_WPP_2015.pdf
35. Ver-Bruggen, S. (2016, September 20). Vestas to supply Indonesia's first wind projects.
Retrieved December 18, 2016, from Wind Power Monthly:

76
http://www.windpowermonthly.com/article/1409408/vestas-supply-indonesias-first-wind-
projects
36. WHO (2016). Health topics: Poverty. Retrieved November 10, 2016, from Web WHO:
http://www.who.int/topics/poverty/en/
37. Worldometers. (2016). Indonesian Population. Retrieved November 7, 2016, from Web
Worldometers: http://www.worldometers.info/world-population/indonesia-population/
77
11. LIST OF FIGURES
Figure 1 - Hierarchical Diagram of Region Classification (Source: Klapka & Tonev, 2008;
own work) ..............................................................................................................................8
Figure 2 - Indonesian Map of Provinces (Source: World Press, 2014) ................................... 36
Figure 3 - Correlation graph of integrated indicators for each province (Statistics Indonesia;
own work) ............................................................................................................................ 37
Figure 4 - Convergence of Indonesian provinces within indicator of GRDP (Statistics
Indonesia; own work) ........................................................................................................... 44
Figure 5 - Convergence of Indonesian provinces within indicator of HDI (Statistics Indonesia;
own work) ............................................................................................................................ 45
Figure 6 - Convergence of Indonesian provinces within indicator of Poverty Gap Index
(Statistics Indonesia; own work) ........................................................................................... 46
Figure 7 - Convergence of Indonesian provinces within indicator of Unemployment (Statistics
Indonesia; own work) ........................................................................................................... 48
Figure 8 - Convergence of Indonesian provinces within indicator of IN-migration (Statistics
Indonesia; own work) ........................................................................................................... 49
Figure 9 - Convergence of Indonesian provinces within indicator of OUT-migration (Statistics
Indonesia; own work) ........................................................................................................... 50
Figure 10 - Convergence of Indonesian provinces within indicator of FDI (Statistics
Indonesia; own work) ........................................................................................................... 51
Figure 11 - Sigma-convergence plot - GRDP (Source: Statistics Indonesia; own work) ........ 85
Figure 12 - Sigma-convergence plot - HDI (Source: Statistics Indonesia; own work) ............ 86
Figure 13 - Sigma-convergence plot - Poverty Gap Index (Source: Statistics Indonesia; own
work) .................................................................................................................................... 87
Figure 14 - Sigma-convergence plot - Unemployment (Source: Statistics Indonesia; own
work) .................................................................................................................................... 88
Figure 15 - Sigma-convergence plot - FDI (Source: Statistics Indonesia; own work) ............ 89
78
12. LIST OF TABLES
Table 1 - Convergence/Divergence Theories of Regional Development (Source: Blaţek &
Uhlíř, 2013; own work) ........................................................................................................ 11
Table 2 - Primary Factors causing regional disparity (Source: Kutscherauer, 2010; Ţítek,
2002; own work) .................................................................................................................. 13
Table 3 - Secondary factors causing regional disparity (Source: Dušek, 2011; Kutscherauer,
2010; Ţítek, 2002; own work) ............................................................................................... 13
Table 4 - Overall the most recent data of Indonesian Economy (Source: Asian Development
Bank, 2015; The World Bank, 2015; own work) ................................................................... 32
Table 5 - Overall the most recent data about Indonesian population (Source: United Nation,
2015; United Nations Development Programme, 2015; Worldometers, 2016; The World
Bank, 2016; own work) ........................................................................................................ 34
Table 6 - Assessment of possible outliers (Source: Statistics Indonesia; own work) .............. 39
Table 7- Basic statistics of integrated indicators (Source: Statistics Indonesia; own work) .... 41
Table 8 Correlation Matrix for Variables (Source: Statistics Indonesia; own work) ............... 42
Table 9 - Sigma-convergence Results (Statistics Indonesia; own work) ................................ 53
Table 10 - Initial Data - GRDP (Source: Statistics Indonesia; own work) .............................. 81
Table 11 - Initial Data - HDI (Source: Statistics Indonesia; own work) ................................. 81
Table 12 - Initial Data - Poverty Gap Index (Source: Statistics Indonesia; own work) ........... 82
Table 13 - Initial Data - Unemployment (Source: Statistics Indonesia; own work) ................ 82
Table 14 - Initial Data - IN-migration (Source: Statistics Indonesia; own work) .................... 83
Table 15 - Initial Data - OUT-migration (Source: Statistics Indonesia; own work) ................ 83
Table 16 - Initial Data - FDI (Source: Statistics Indonesia; own work) .................................. 84
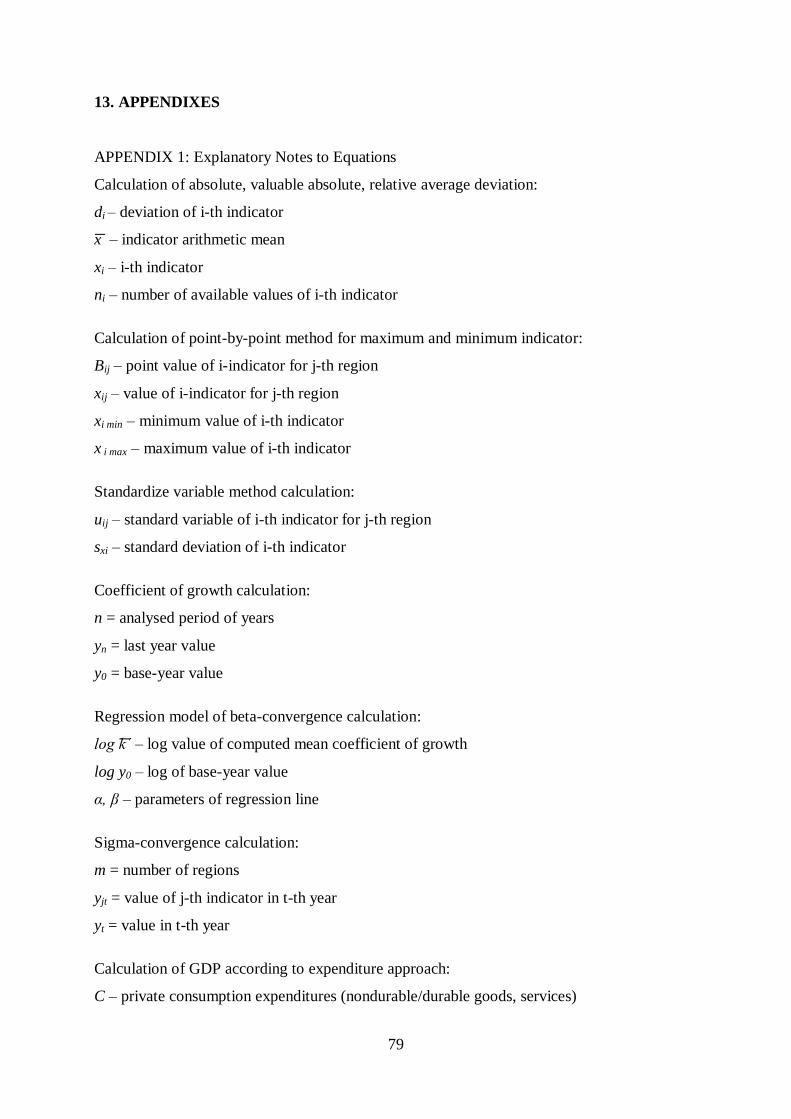
79
13. APPENDIXES
APPENDIX 1: Explanatory Notes to Equations
Calculation of absolute, valuable absolute, relative average deviation:
di – deviation of i-th indicator
x – indicator arithmetic mean
xi – i-th indicator
ni – number of available values of i-th indicator
Calculation of point-by-point method for maximum and minimum indicator:
Bij – point value of i-indicator for j-th region
xij – value of i-indicator for j-th region
xi min – minimum value of i-th indicator
x i max – maximum value of i-th indicator
Standardize variable method calculation:
uij – standard variable of i-th indicator for j-th region
sxi – standard deviation of i-th indicator
Coefficient of growth calculation:
n = analysed period of years
yn = last year value
y0 = base-year value
Regression model of beta-convergence calculation:
log k´ – log value of computed mean coefficient of growth
log y0 – log of base-year value
α, β – parameters of regression line
Sigma-convergence calculation:
m = number of regions
yjt = value of j-th indicator in t-th year
yt = value in t-th year
Calculation of GDP according to expenditure approach:
C – private consumption expenditures (nondurable/durable goods, services)
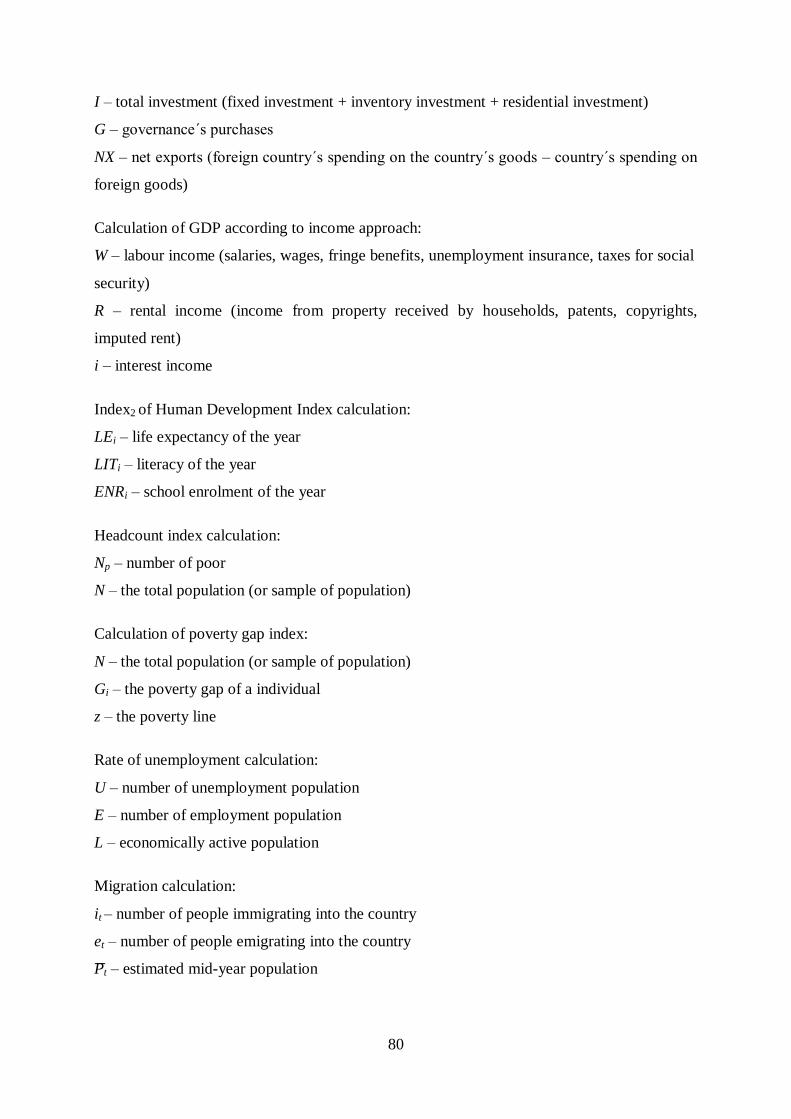
80
I – total investment (fixed investment + inventory investment + residential investment)
G – governance´s purchases
NX – net exports (foreign country´s spending on the country´s goods – country´s spending on
foreign goods)
Calculation of GDP according to income approach:
W – labour income (salaries, wages, fringe benefits, unemployment insurance, taxes for social
security)
R – rental income (income from property received by households, patents, copyrights,
imputed rent)
i – interest income
Index2 of Human Development Index calculation:
LEi – life expectancy of the year
LITi – literacy of the year
ENRi – school enrolment of the year
Headcount index calculation:
Np – number of poor
N – the total population (or sample of population)
Calculation of poverty gap index:
N – the total population (or sample of population)
Gi – the poverty gap of a individual
z – the poverty line
Rate of unemployment calculation:
U – number of unemployment population
E – number of employment population
L – economically active population
Migration calculation:
it – number of people immigrating into the country
et – number of people emigrating into the country
Pt – estimated mid-year population
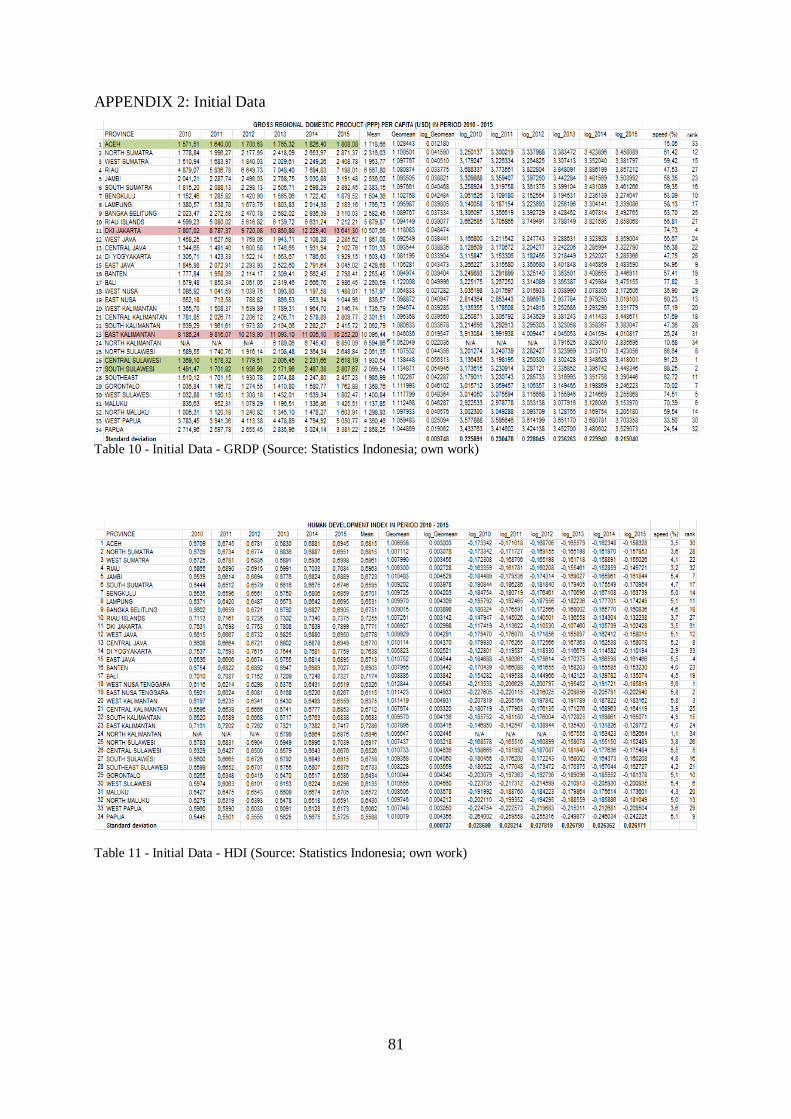
81
APPENDIX 2: Initial Data
Table 10 - Initial Data - GRDP (Source: Statistics Indonesia; own work)
Table 11 - Initial Data - HDI (Source: Statistics Indonesia; own work)
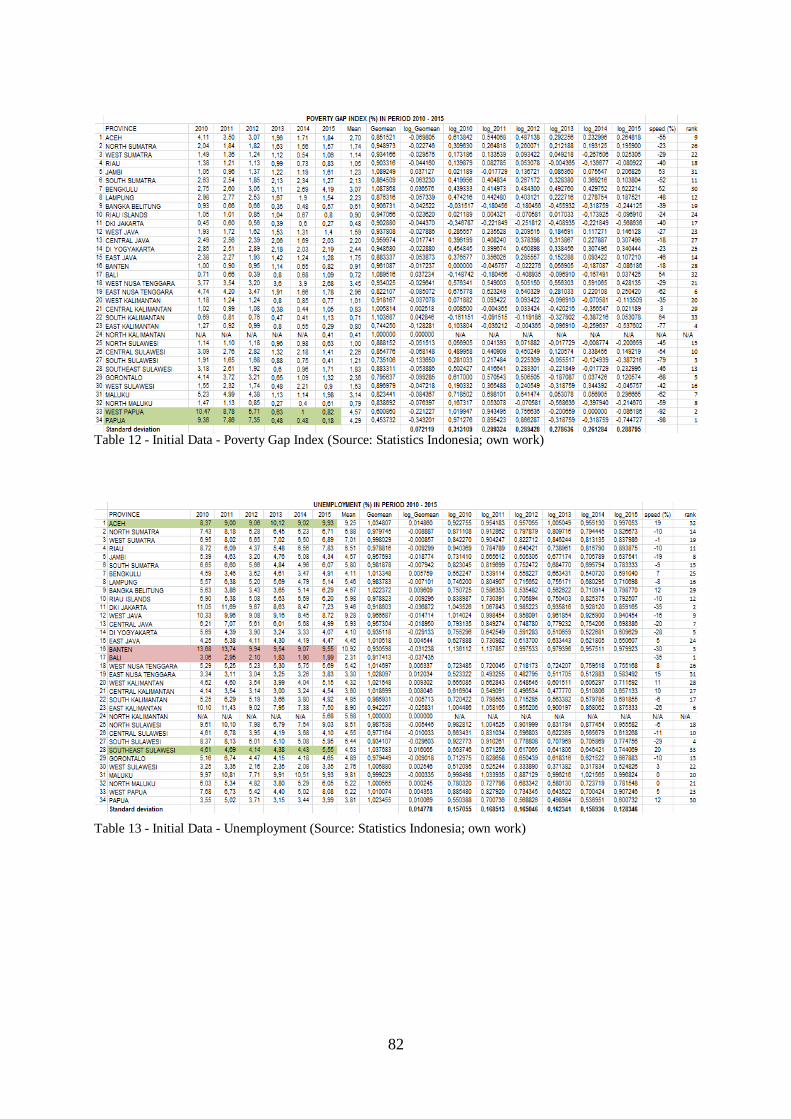
82
Table 12 - Initial Data - Poverty Gap Index (Source: Statistics Indonesia; own work)
Table 13 - Initial Data - Unemployment (Source: Statistics Indonesia; own work)
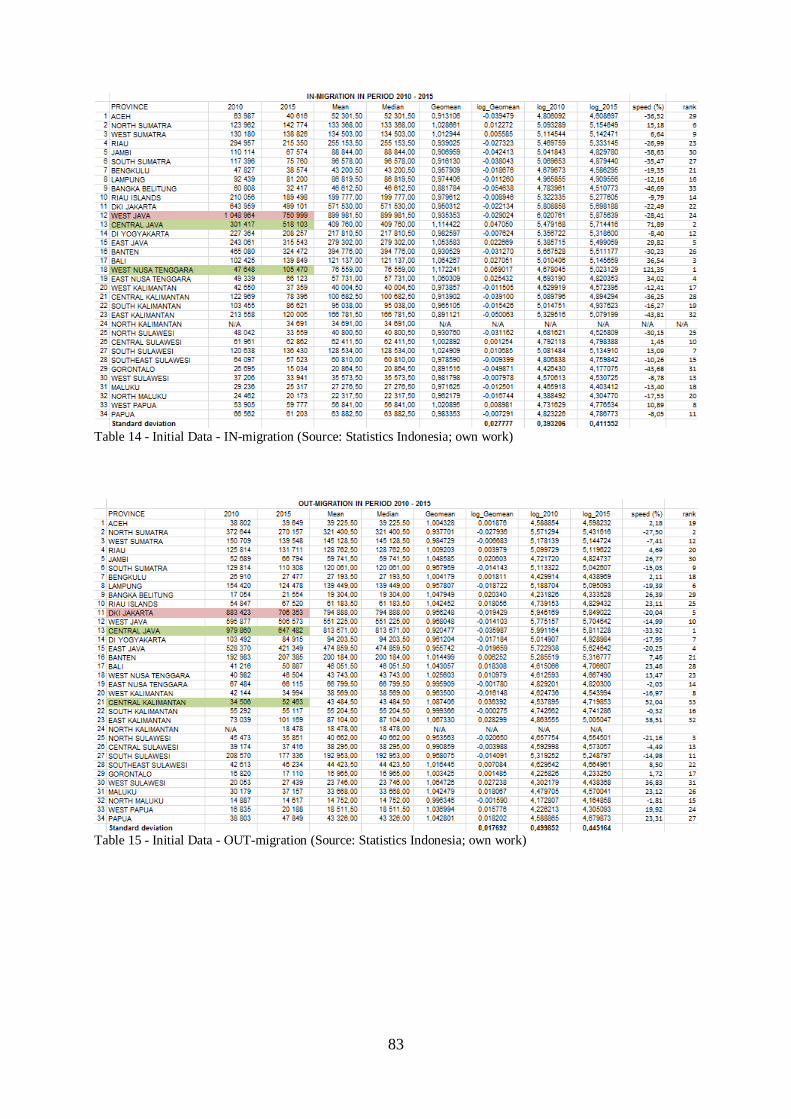
83
Table 14 - Initial Data - IN-migration (Source: Statistics Indonesia; own work)
Table 15 - Initial Data - OUT-migration (Source: Statistics Indonesia; own work)
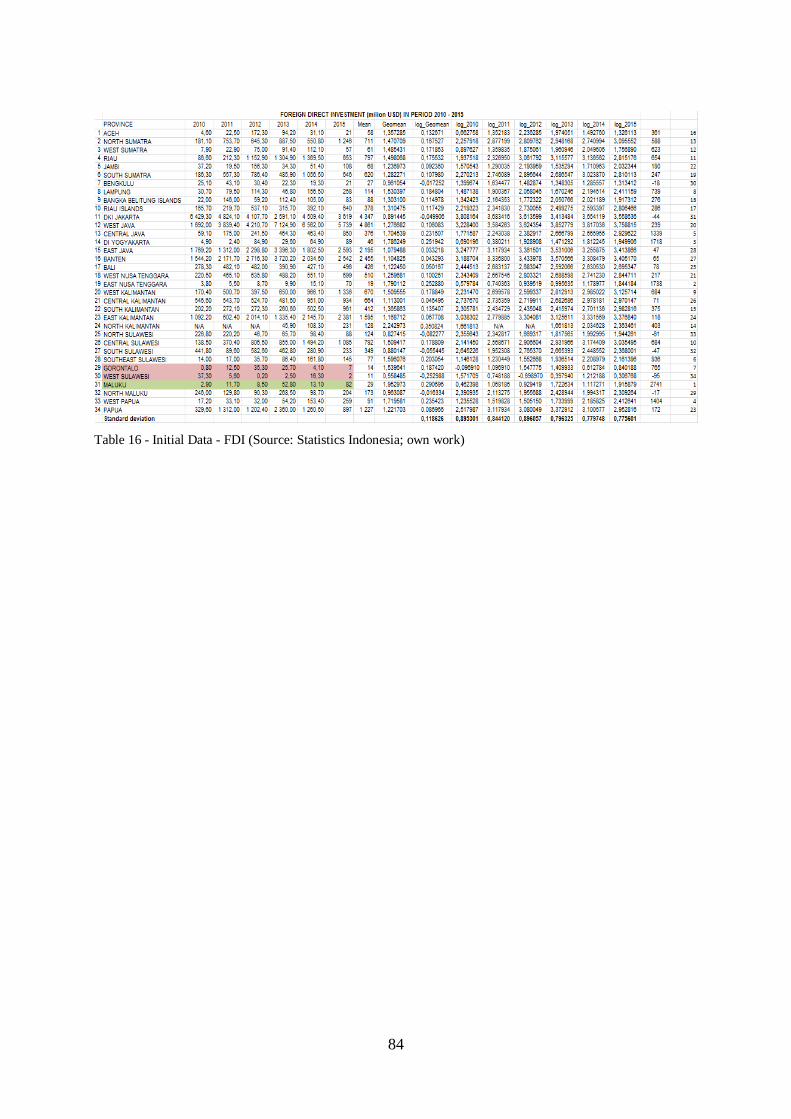
84
Table 16 - Initial Data - FDI (Source: Statistics Indonesia; own work)
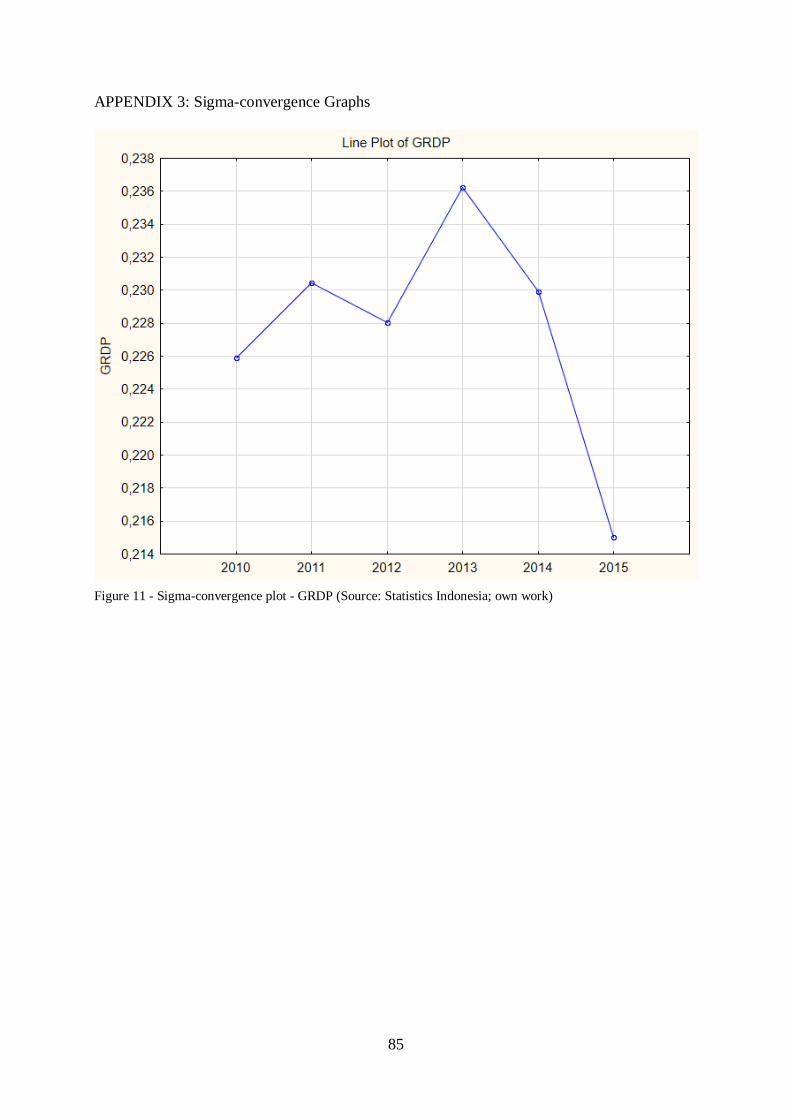
85
APPENDIX 3: Sigma-convergence Graphs
Figure 11 - Sigma-convergence plot - GRDP (Source: Statistics Indonesia; own work)
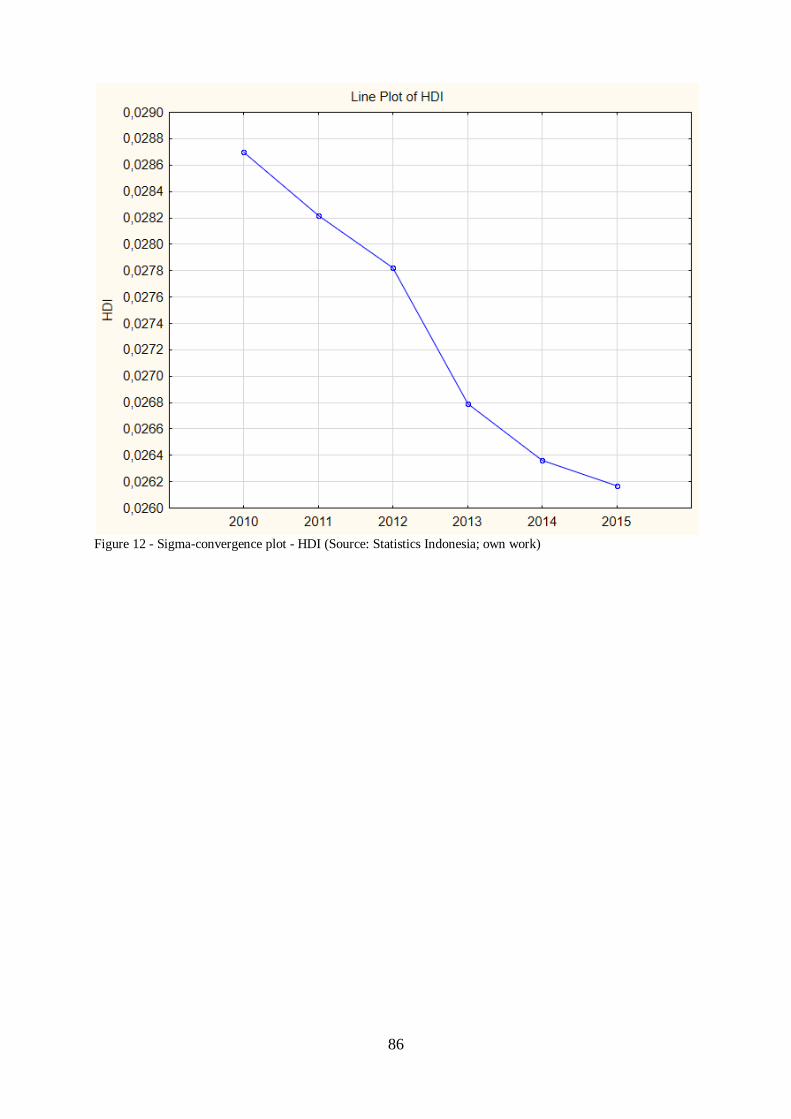
86
Figure 12 - Sigma-convergence plot - HDI (Source: Statistics Indonesia; own work)
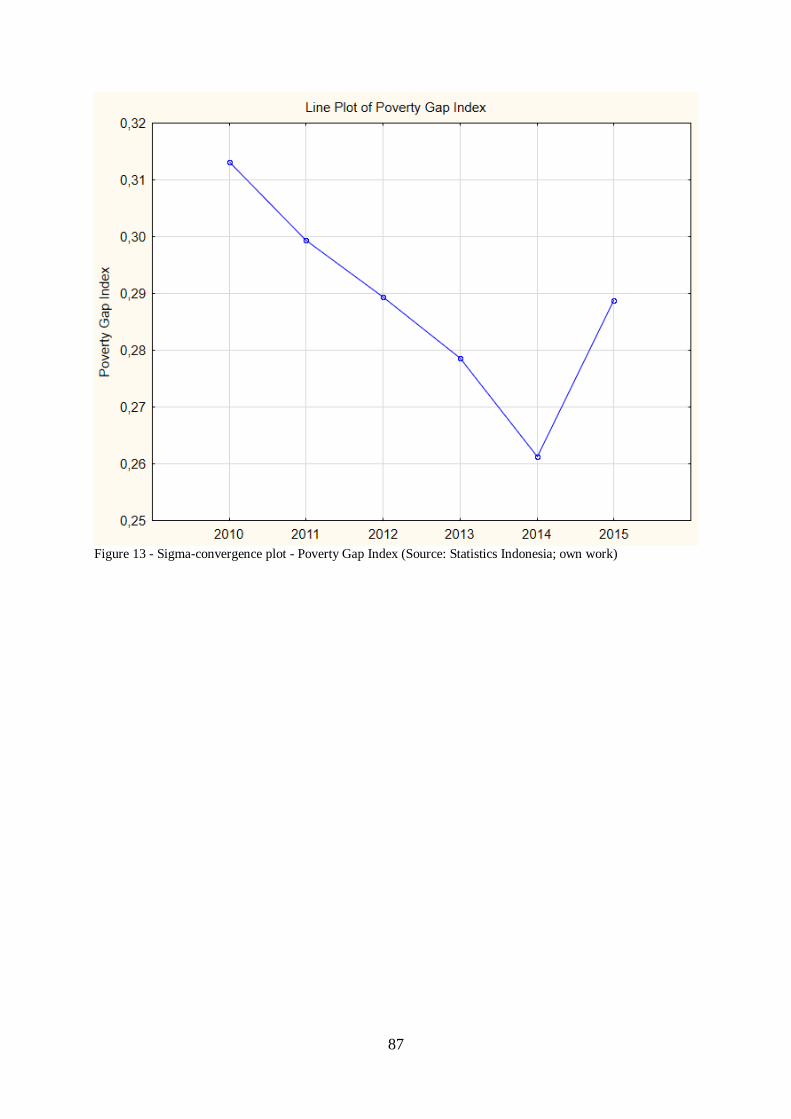
87
Figure 13 - Sigma-convergence plot - Poverty Gap Index (Source: Statistics Indonesia; own work)
88
Figure 14 - Sigma-convergence plot - Unemployment (Source: Statistics Indonesia; own work)
89
Figure 15 - Sigma-convergence plot - FDI (Source: Statistics Indonesia; own work)


![The scaling of human interactions with city sizesenseable.mit.edu/urbanvillages/img/manuscript.pdf · that of most urban socioeconomic indicators [11] and with theoretical predictions](https://img.pdfslide.us/doc/110x75/60ca85f9fd0be8419462597c/the-scaling-of-human-interactions-with-city-that-of-most-urban-socioeconomic-indicators.jpg)