Embed Size (px)
Citation preview
How to share and publish your data using HIS
David G Tarboton
Jeff Horsburgh
Ilya Zaslavsky
Tom Whitenack
David Valentine
SupportEAR 0622374http://his.cuahsi.org
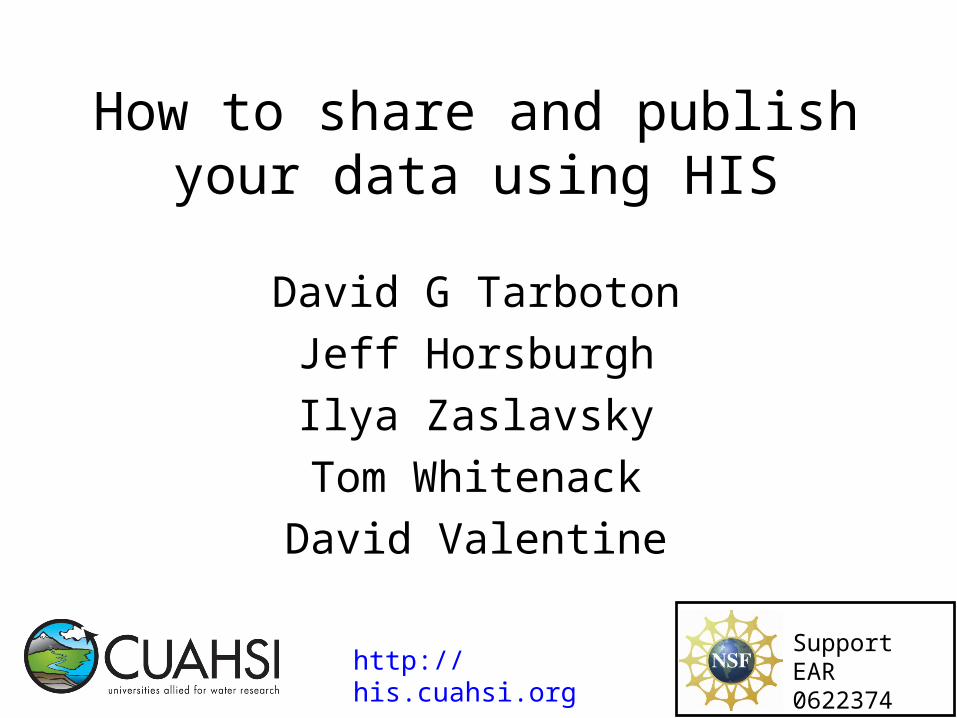
Outline• CUAHSI HIS data publication system• Observations data Model (ODM)• Using ODM
• SQL Management Studio• ODM Tools• ODM Data Loader• Streaming Data Loader• Controlled vocabulary editing• SSIS for data loading
• HIS Central • Data Publication Workflow• WaterML and configuring WaterML
web services over ODM• Registration of your data service in
HIS central
TarbotonTarbotonHorsburgh
Tarboton
ZaslavskyValentine
Whitenack
5 min20 min40 min
10 min
10 min15 min
20 min
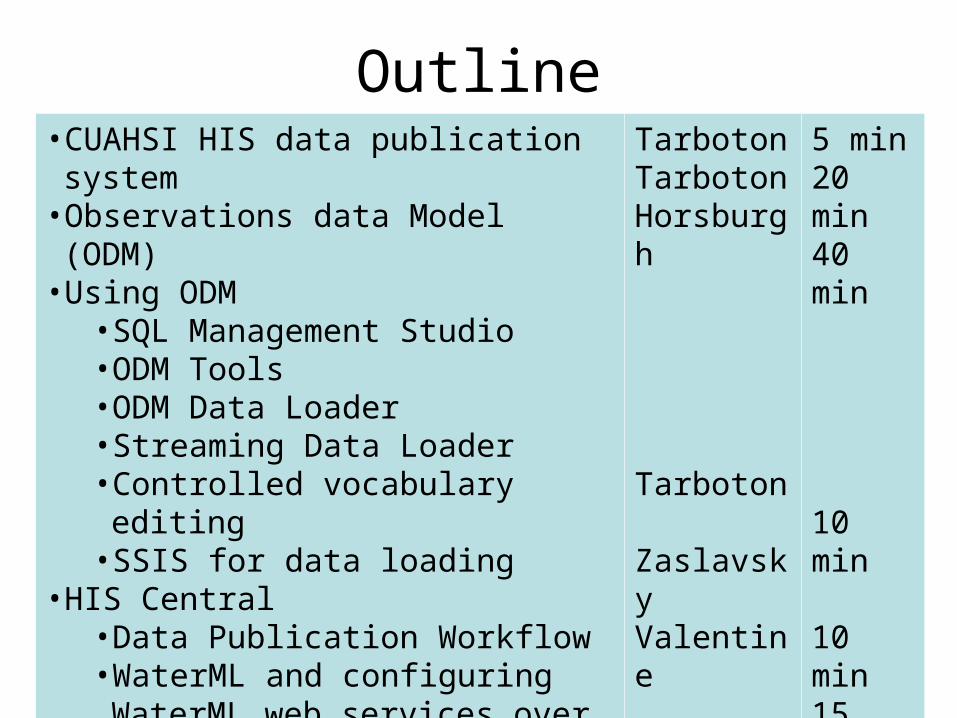
Base StationComputer(s)
Telemetry Network
Sensors
HIS Data Publication SystemQuery, Visualize, and Edit
data using ODM Tools
Excel Text
ODMDatabase
ODM Data
Loader
Streaming Data
Loader
GetSitesGetSiteInfoGetVariableInfoGetValues
WaterOneFlowWeb Service
WaterML
DiscoveryHydroseek
AccessAnalysis
GISMatlabSplus
RIDL
JavaC++VB
Water Metadata Catalog
Harvester
Service Registry Hydrotagger
HIS Central
HydroExcelHydroGetHydroLink
HydroObjects
ODM
ODM
Contribute your ODM
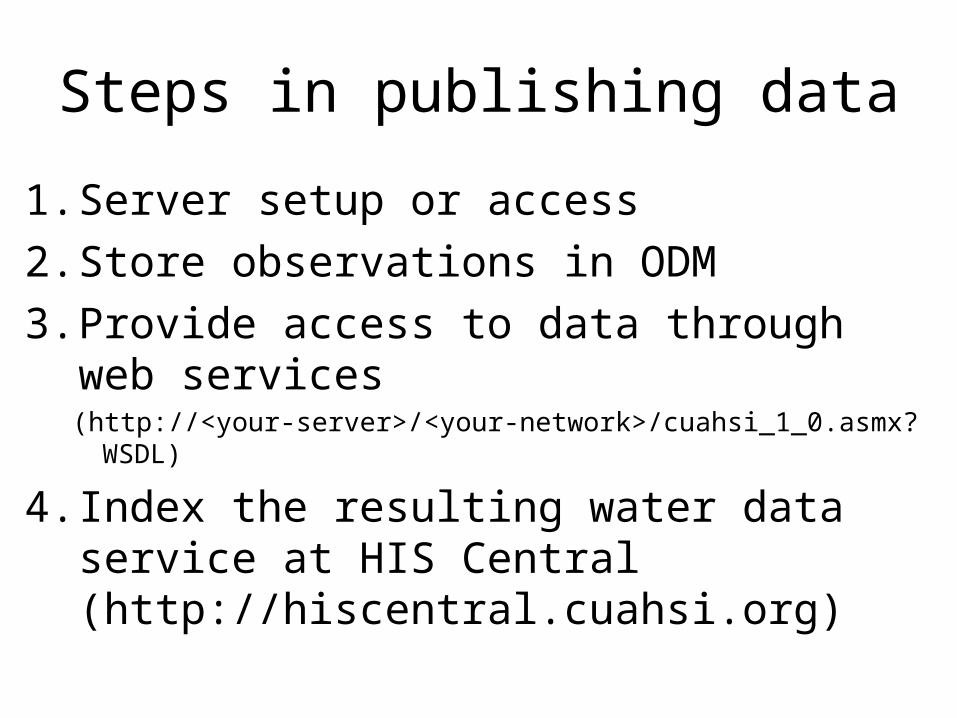
Steps in publishing data
1. Server setup or access
2. Store observations in ODM
3. Provide access to data through web services (http://<your-server>/<your-network>/cuahsi_1_0.asmx?WSDL)
4. Index the resulting water data service at HIS Central (http://hiscentral.cuahsi.org)
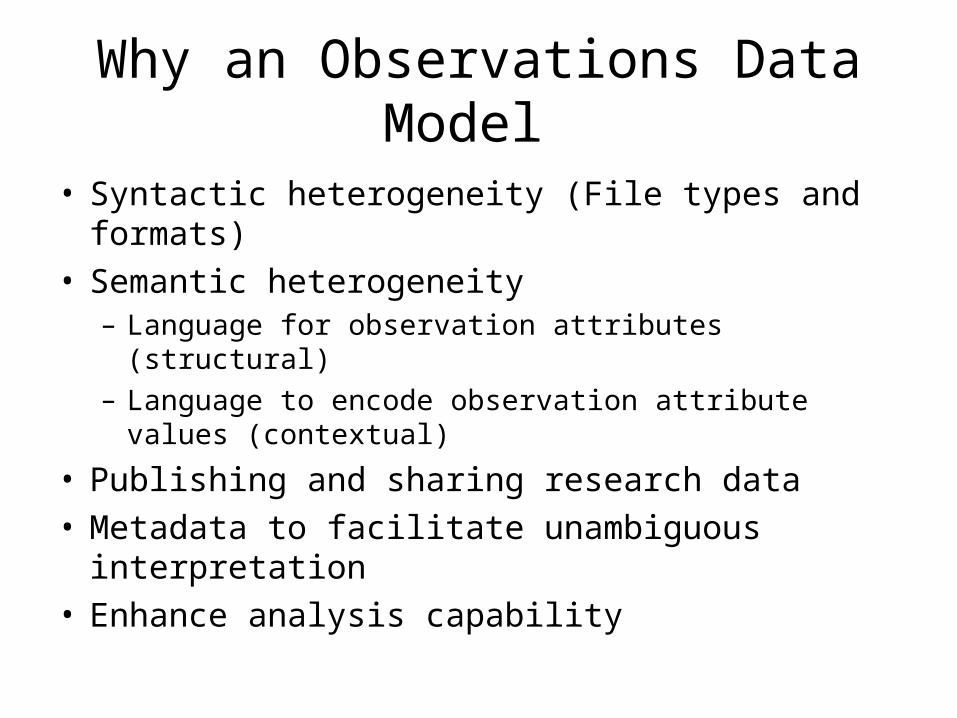
Why an Observations Data Model
• Syntactic heterogeneity (File types and formats)• Semantic heterogeneity
– Language for observation attributes (structural)– Language to encode observation attribute values
(contextual)
• Publishing and sharing research data • Metadata to facilitate unambiguous
interpretation• Enhance analysis capability
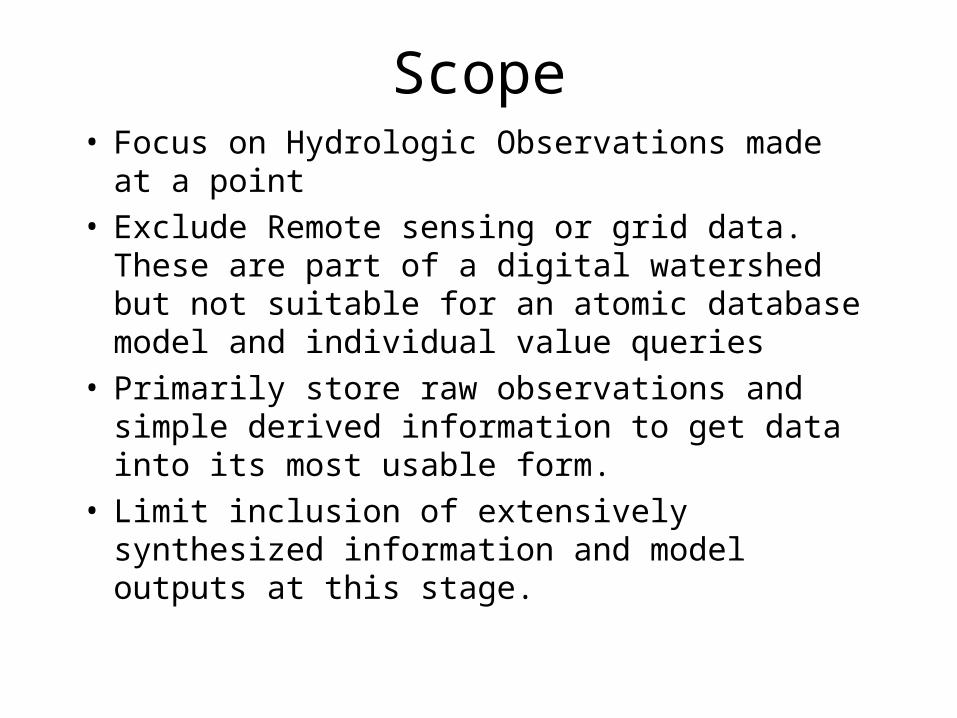
Scope• Focus on Hydrologic Observations made at a
point• Exclude Remote sensing or grid data. These
are part of a digital watershed but not suitable for an atomic database model and individual value queries
• Primarily store raw observations and simple derived information to get data into its most usable form.
• Limit inclusion of extensively synthesized information and model outputs at this stage.
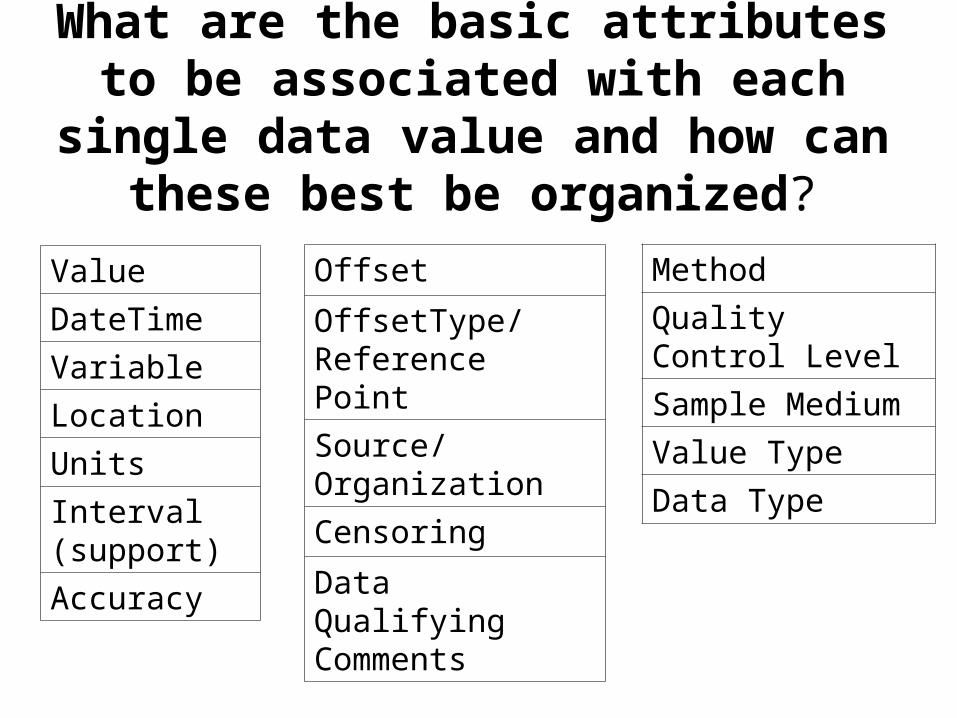
What are the basic attributes to be associated with each single data value and
how can these best be organized?
Value
DateTime
Variable
Location
Units
Interval (support)
Accuracy
Offset
OffsetType/ Reference Point
Source/Organization
Censoring
Data Qualifying Comments
Method
Quality Control Level
Sample Medium
Value Type
Data Type
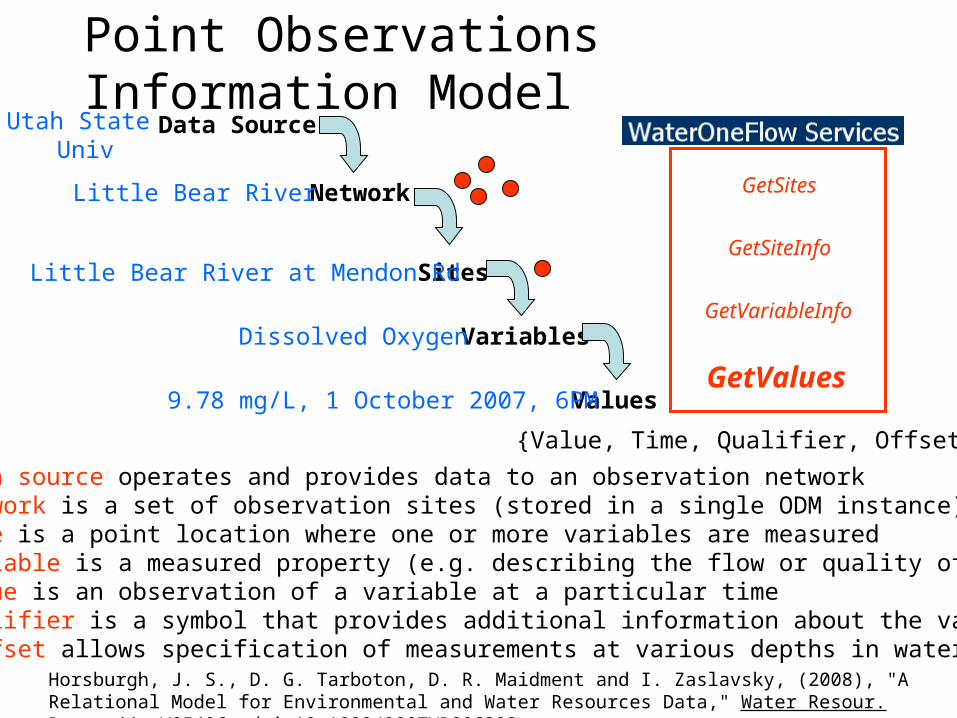
Data Source
Network
Sites
Variables
Values
{Value, Time, Qualifier, Offset}
Utah State Univ
Little Bear River
Little Bear River at Mendon Rd
Dissolved Oxygen
9.78 mg/L, 1 October 2007, 6PM
• A data source operates and provides data to an observation network• A network is a set of observation sites (stored in a single ODM instance)• A site is a point location where one or more variables are measured• A variable is a measured property (e.g. describing the flow or quality of water)• A value is an observation of a variable at a particular time• A qualifier is a symbol that provides additional information about the value• An offset allows specification of measurements at various depths in water
GetSites
GetSiteInfo
GetVariableInfo
GetValues
Horsburgh, J. S., D. G. Tarboton, D. R. Maidment and I. Zaslavsky, (2008), "A Relational Model for Environmental and Water Resources Data," Water Resour. Res., 44: W05406, doi:10.1029/2007WR006392.
Point Observations Information Model
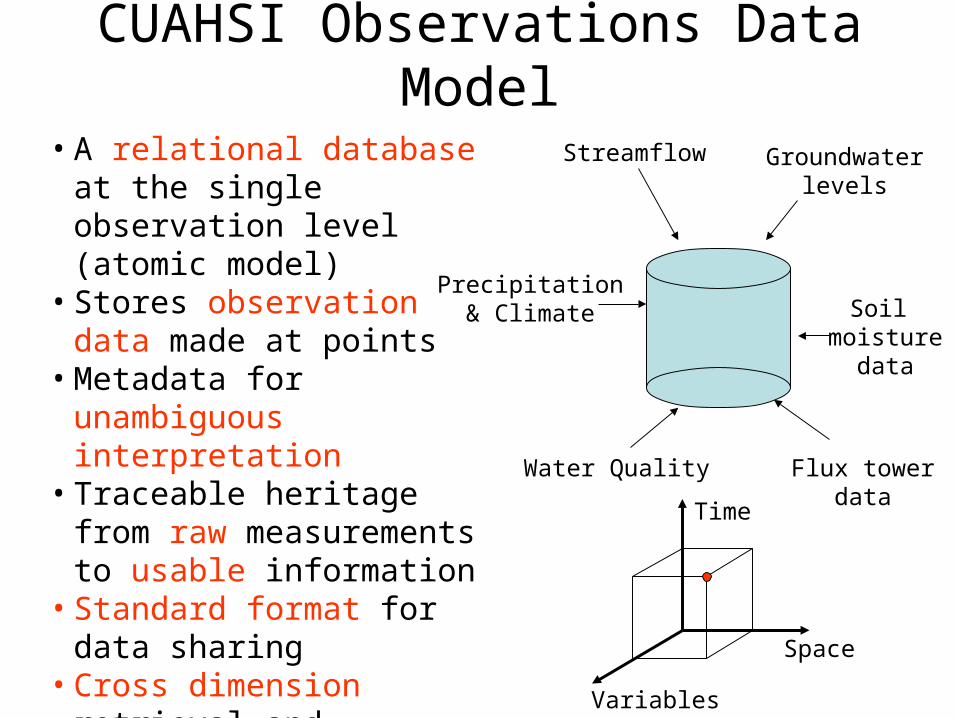
CUAHSI Observations Data Model
Streamflow
Flux towerdata
Precipitation& Climate
Groundwaterlevels
Water Quality
Soil moisture
data
Variables
Space
Time
• A relational database at the single observation level (atomic model)
• Stores observation data made at points
• Metadata for unambiguous interpretation
• Traceable heritage from raw measurements to usable information
• Standard format for data sharing
• Cross dimension retrieval and analysis
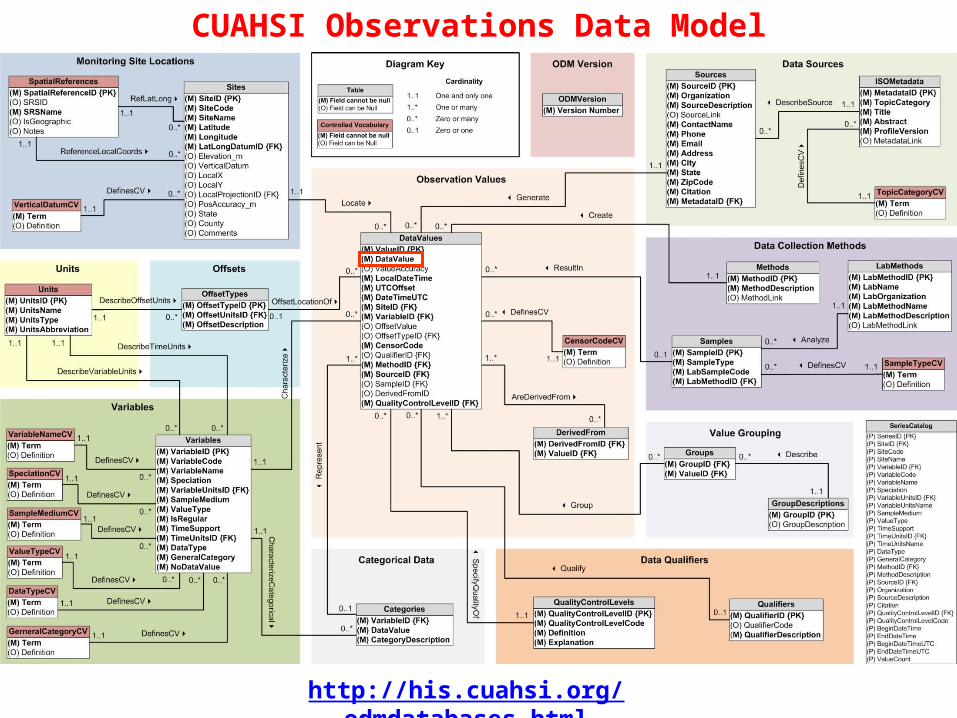
http://his.cuahsi.org/odmdatabases.html
CUAHSI Observations Data Model
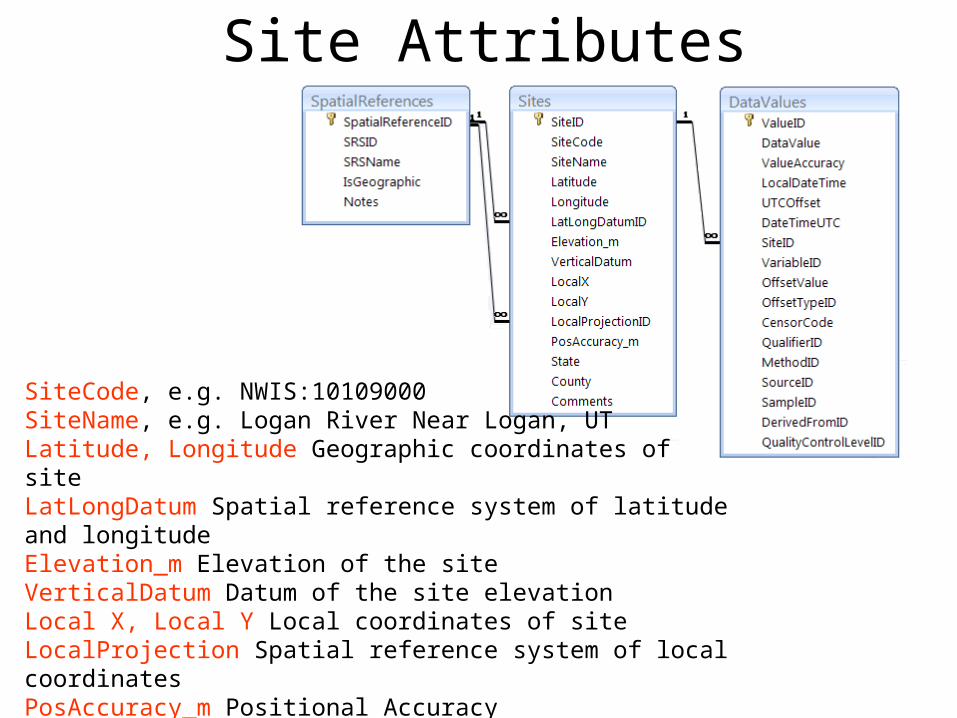
Site Attributes
SiteCode, e.g. NWIS:10109000SiteName, e.g. Logan River Near Logan, UTLatitude, Longitude Geographic coordinates of siteLatLongDatum Spatial reference system of latitude and longitudeElevation_m Elevation of the siteVerticalDatum Datum of the site elevationLocal X, Local Y Local coordinates of siteLocalProjection Spatial reference system of local coordinatesPosAccuracy_m Positional AccuracyState, e.g. UtahCounty, e.g. Cache
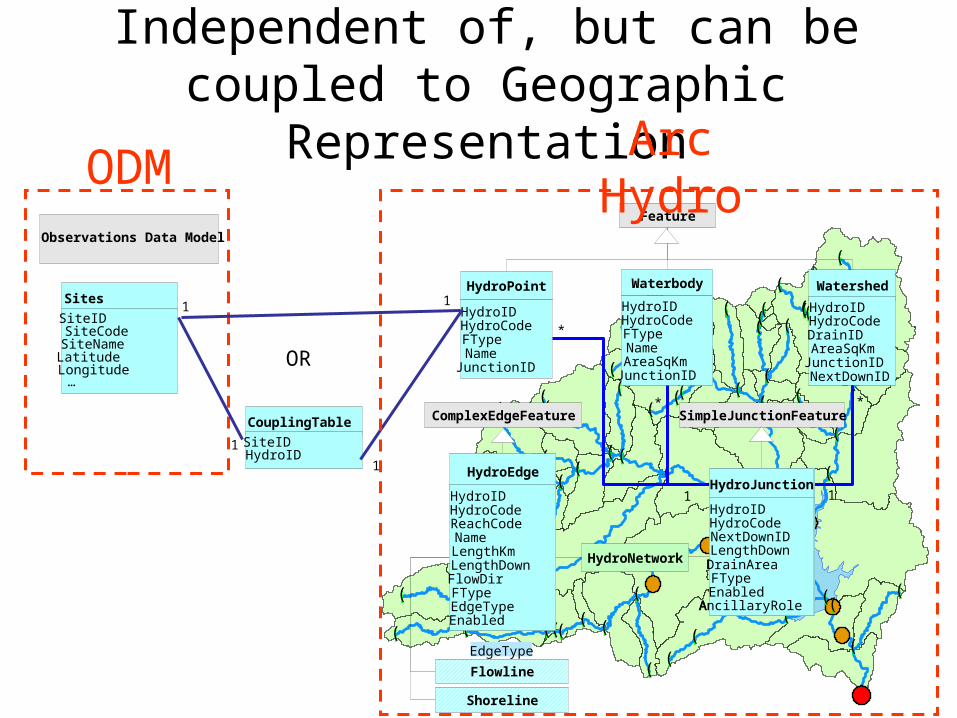
Feature
Waterbody
HydroIDHydroCodeFTypeNameAreaSqKmJunctionID
HydroPoint
HydroIDHydroCodeFTypeNameJunctionID
Watershed
HydroIDHydroCodeDrainIDAreaSqKmJunctionIDNextDownID
ComplexEdgeFeature
EdgeType
Flowline
Shoreline
HydroEdge
HydroIDHydroCodeReachCodeNameLengthKmLengthDownFlowDirFTypeEdgeTypeEnabled
SimpleJunctionFeature
1HydroJunction
HydroIDHydroCodeNextDownIDLengthDownDrainAreaFTypeEnabledAncillaryRole
*
1
*
HydroNetwork
*
HydroJunction
HydroIDHydroCodeNextDownIDLengthDownDrainAreaFTypeEnabledAncillaryRole
HydroJunction
HydroIDHydroCodeNextDownIDLengthDownDrainAreaFTypeEnabledAncillaryRole
1
1
CouplingTable
SiteIDHydroID
Sites
SiteIDSiteCode
SiteNameLatitudeLongitude…
Observations Data Model
1
1
OR
Independent of, but can be coupled to Geographic Representation
ODM Arc Hydro
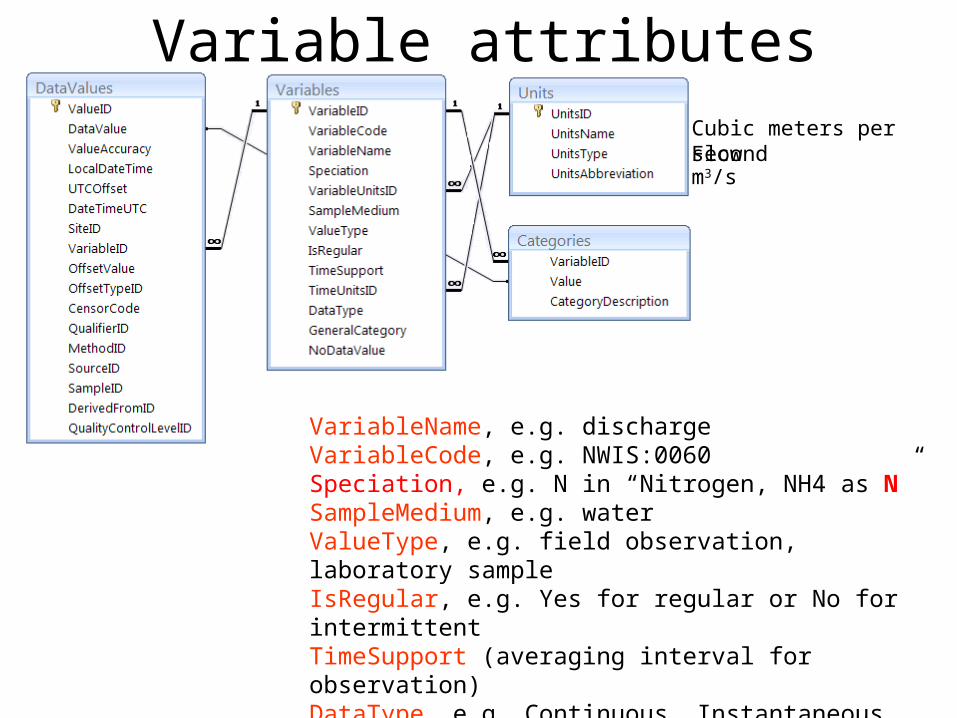
Variable attributes
VariableName, e.g. dischargeVariableCode, e.g. NWIS:0060Speciation, e.g. N in “Nitrogen, NH4 as N”SampleMedium, e.g. waterValueType, e.g. field observation, laboratory sampleIsRegular, e.g. Yes for regular or No for intermittentTimeSupport (averaging interval for observation)DataType, e.g. Continuous, Instantaneous, CategoricalGeneralCategory, e.g. Climate, Water QualityNoDataValue, e.g. -9999
m3/sFlowCubic meters per second
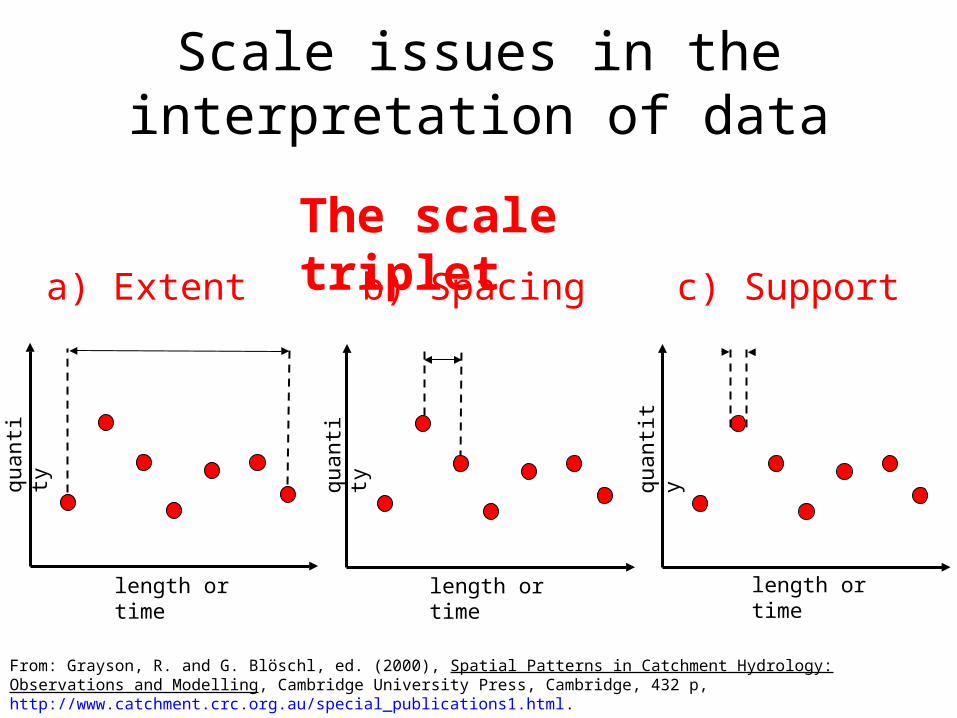
Scale issues in the interpretation of data
The scale triplet
From: Grayson, R. and G. Blöschl, ed. (2000), Spatial Patterns in Catchment Hydrology: Observations and Modelling, Cambridge University Press, Cambridge, 432 p, http://www.catchment.crc.org.au/special_publications1.html.
a) Extent b) Spacing c) Support
length or time
quan
tity
length or time
quan
tity
length or time
quan
tity
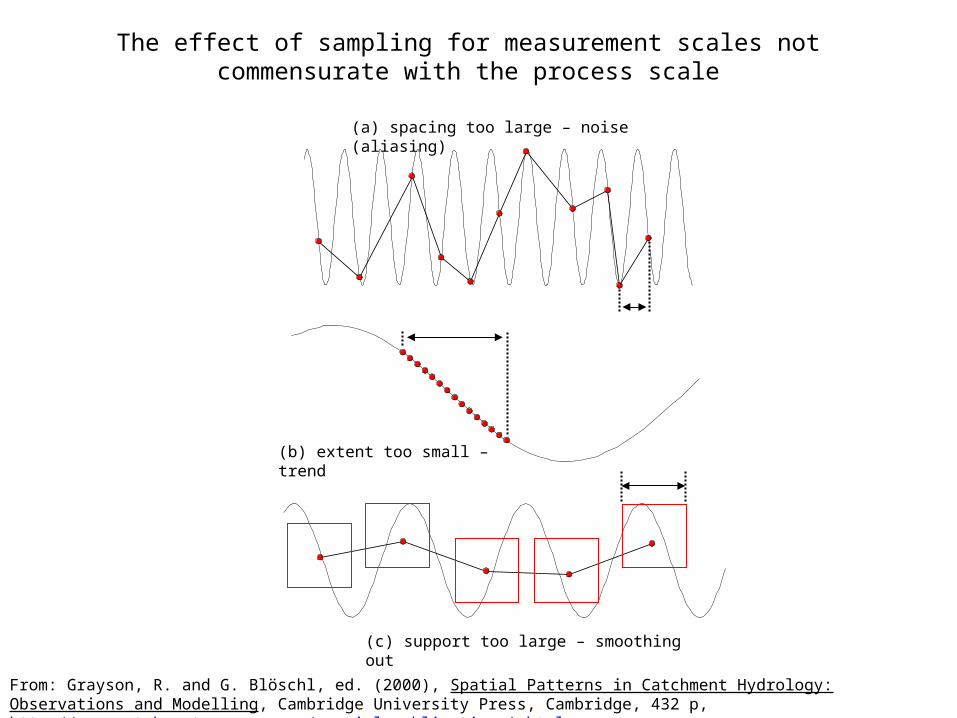
The effect of sampling for measurement scales not commensurate with the process scale
-1.5
-1
-0.5
0
0.5
1
1.5-1.25
-0.75
-0.25
0.25
0.75
1.25
(b) extent too small – trend
(c) support too large – smoothing out
-1.25
-0.75
-0.25
0.25
0.75
1.25 (a) spacing too large – noise (aliasing)
From: Grayson, R. and G. Blöschl, ed. (2000), Spatial Patterns in Catchment Hydrology: Observations and Modelling, Cambridge University Press, Cambridge, 432 p, http://www.catchment.crc.org.au/special_publications1.html.
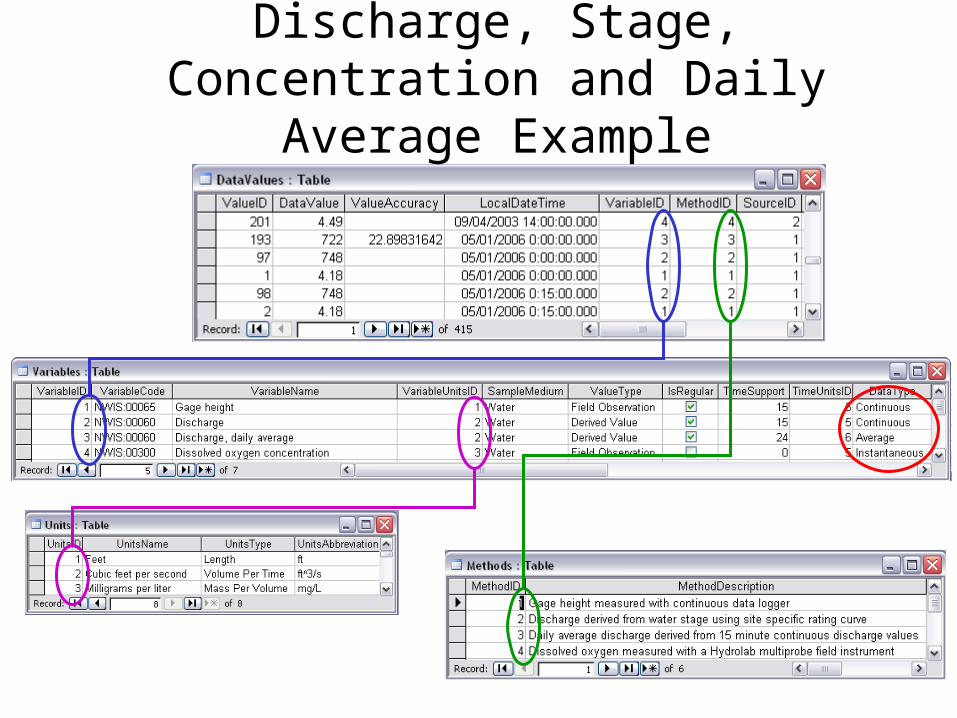
Discharge, Stage, Concentration and Daily Average Example
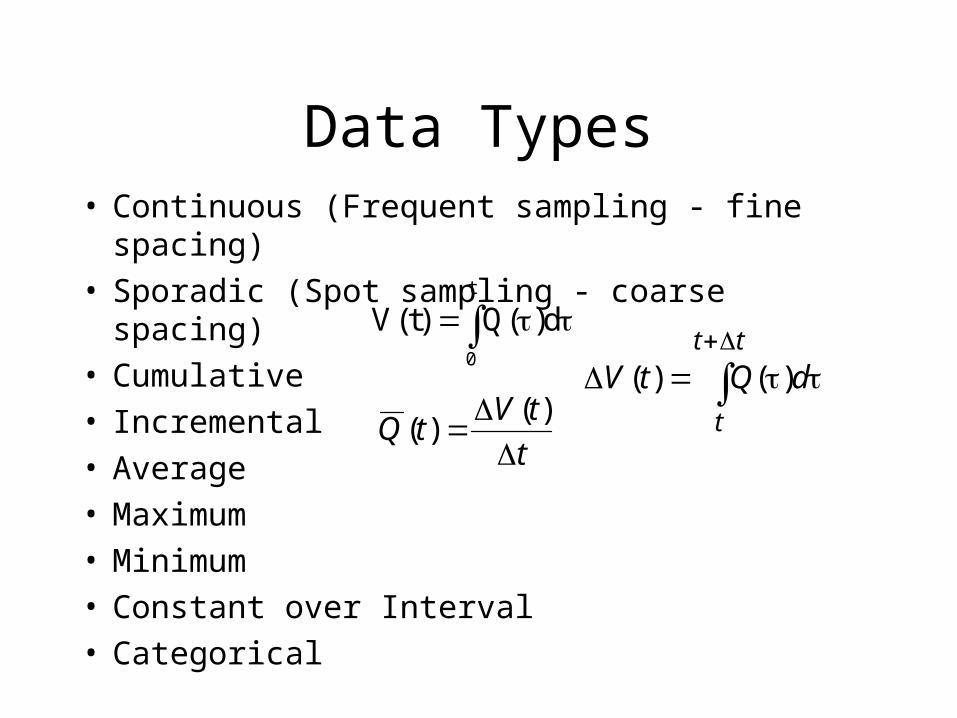
Data Types• Continuous (Frequent sampling - fine spacing)• Sporadic (Spot sampling - coarse spacing)• Cumulative• Incremental• Average• Maximum• Minimum• Constant over Interval• Categorical
t
0
d)(Q)t(V
tt
t
dQtV )()(
t
tVtQ
)(
)(
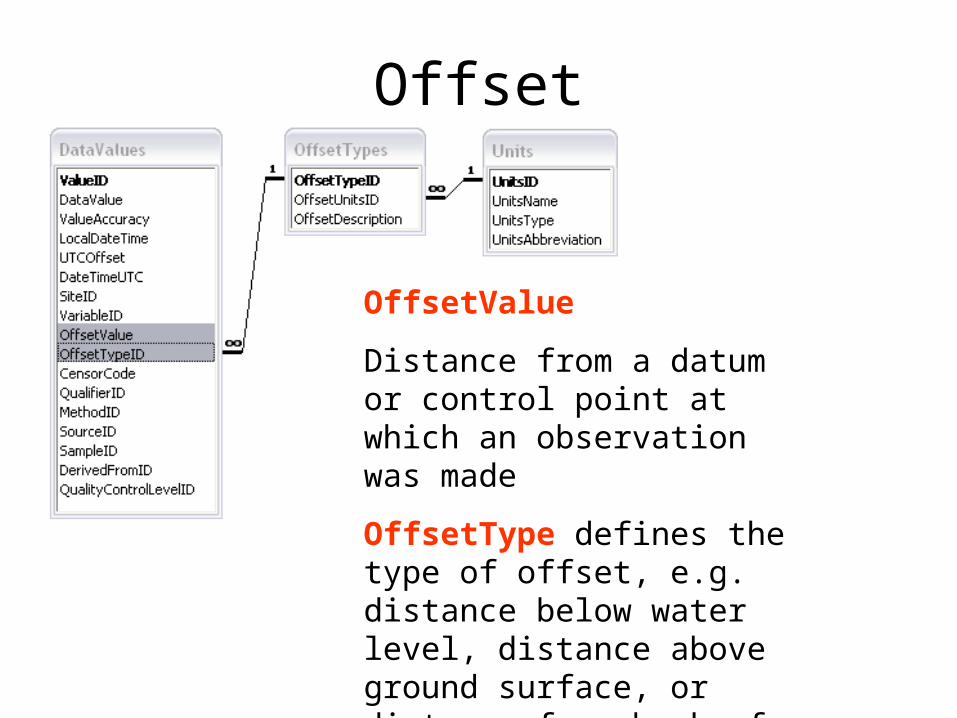
Offset
OffsetValue
Distance from a datum or control point at which an observation was made
OffsetType defines the type of offset, e.g. distance below water level, distance above ground surface, or distance from bank of river
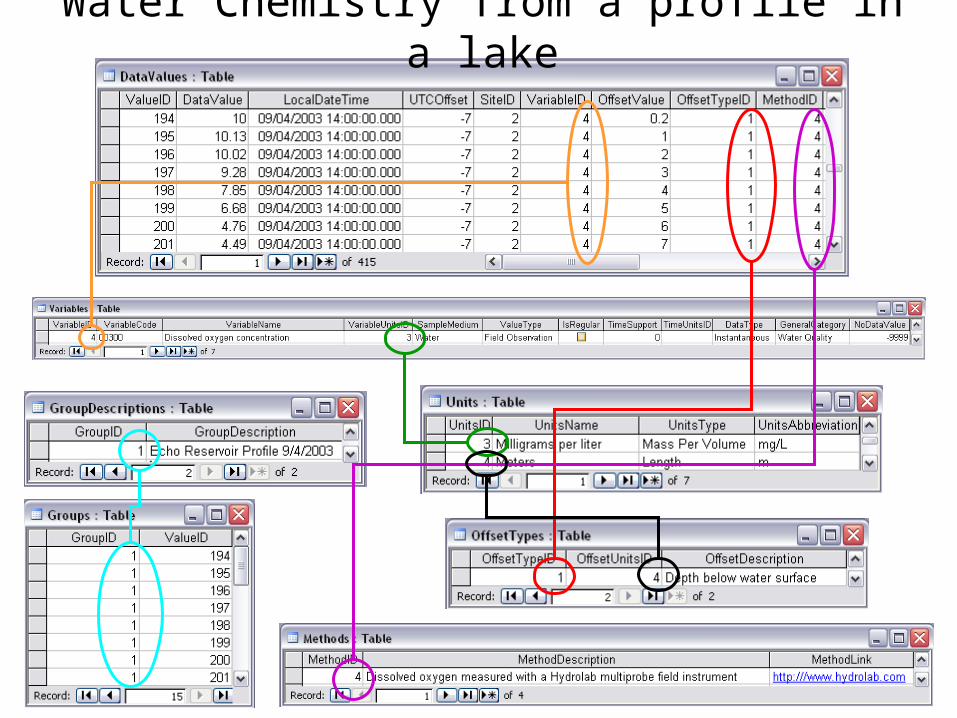
Water Chemistry from a profile in a lake
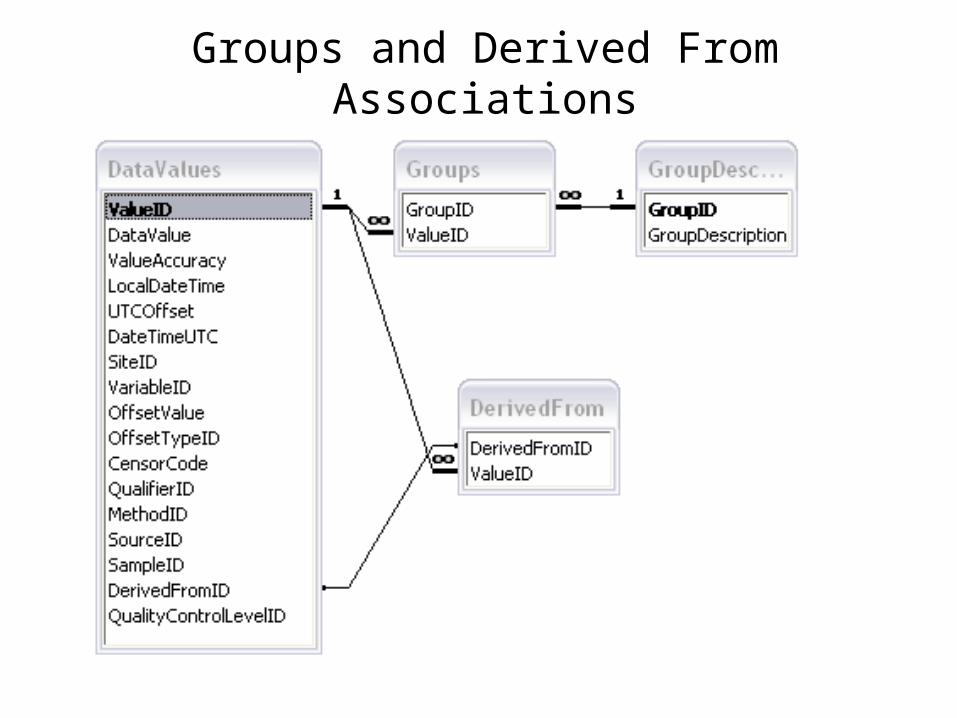
Groups and Derived From Associations
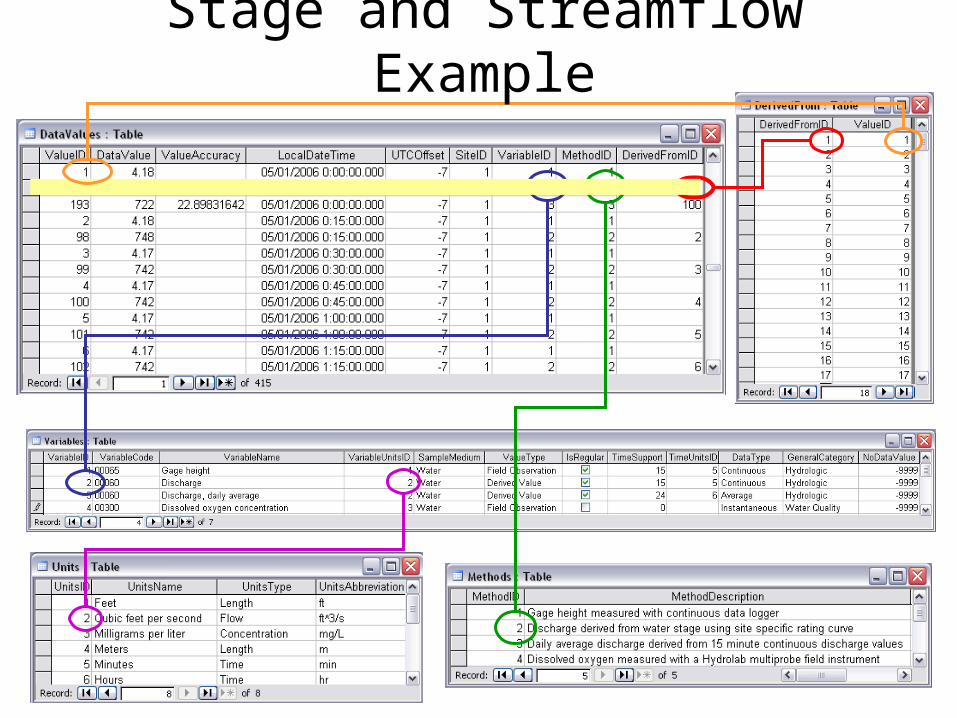
Stage and Streamflow Example
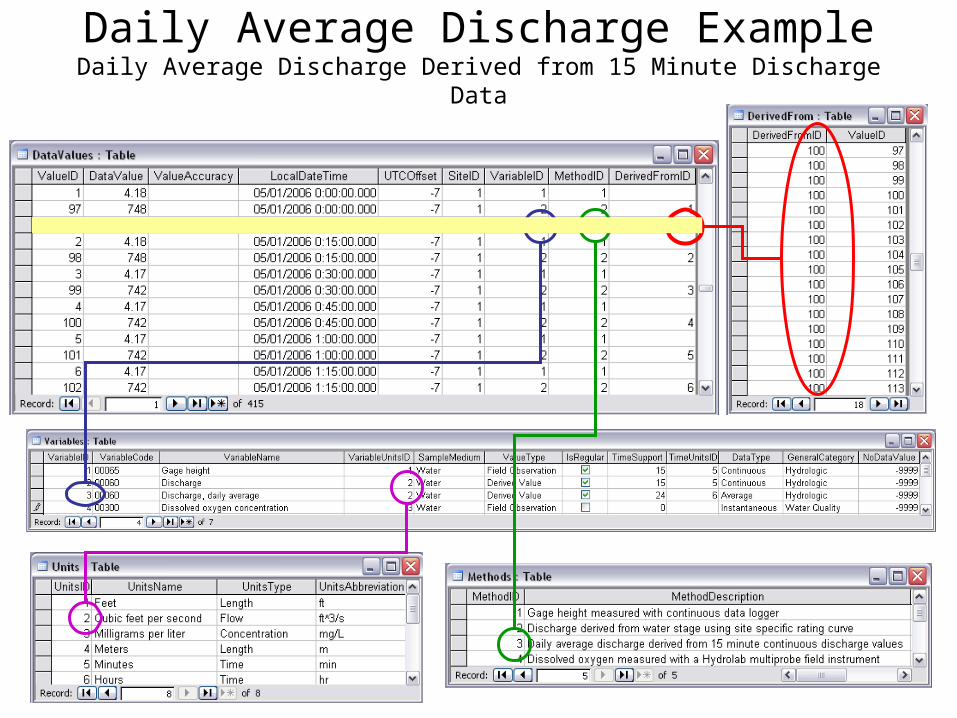
Daily Average Discharge ExampleDaily Average Discharge Derived from 15 Minute Discharge Data
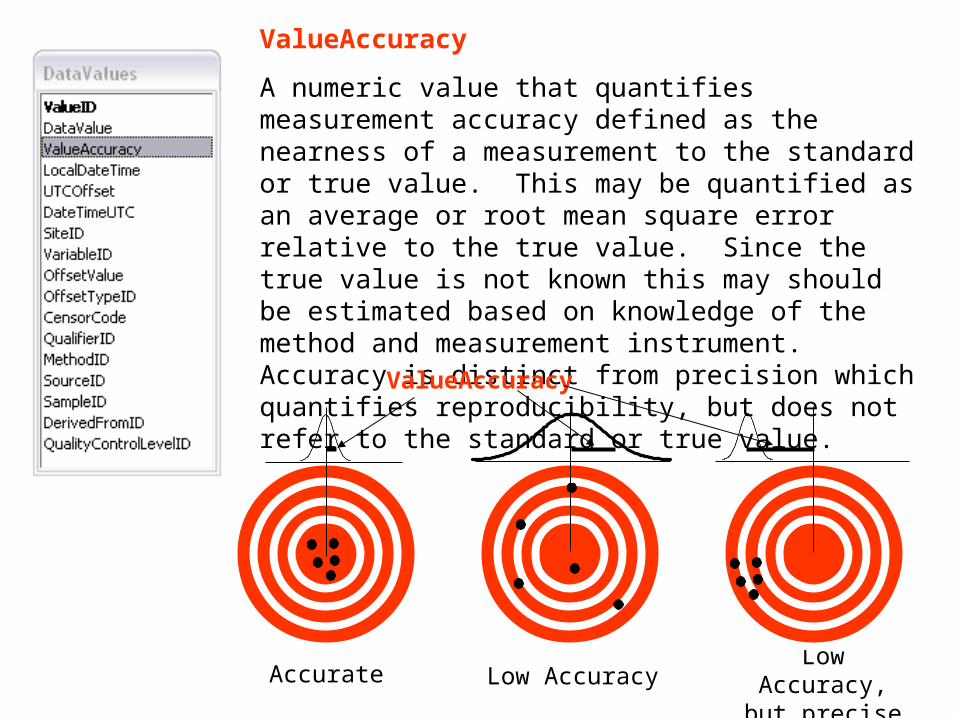
ValueAccuracy
A numeric value that quantifies measurement accuracy defined as the nearness of a measurement to the standard or true value. This may be quantified as an average or root mean square error relative to the true value. Since the true value is not known this may should be estimated based on knowledge of the method and measurement instrument. Accuracy is distinct from precision which quantifies reproducibility, but does not refer to the standard or true value.
Accurate Low Accuracy, but precise
Low Accuracy
ValueAccuracy
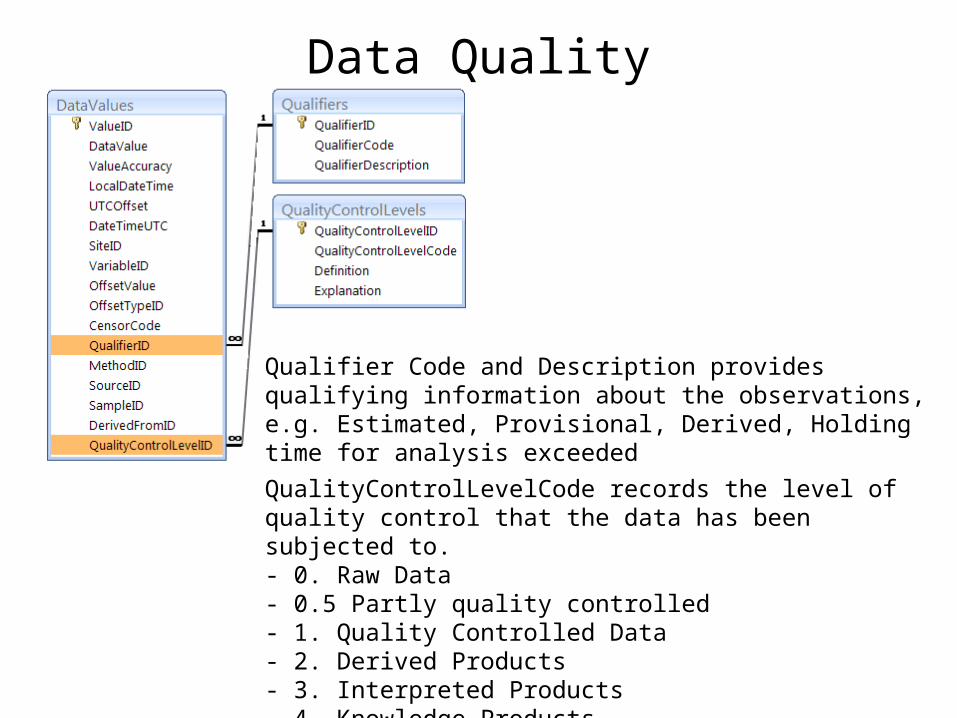
Data Quality
Qualifier Code and Description provides qualifying information about the observations, e.g. Estimated, Provisional, Derived, Holding time for analysis exceeded
QualityControlLevelCode records the level of quality control that the data has been subjected to.- 0. Raw Data - 0.5 Partly quality controlled- 1. Quality Controlled Data - 2. Derived Products - 3. Interpreted Products - 4. Knowledge Products
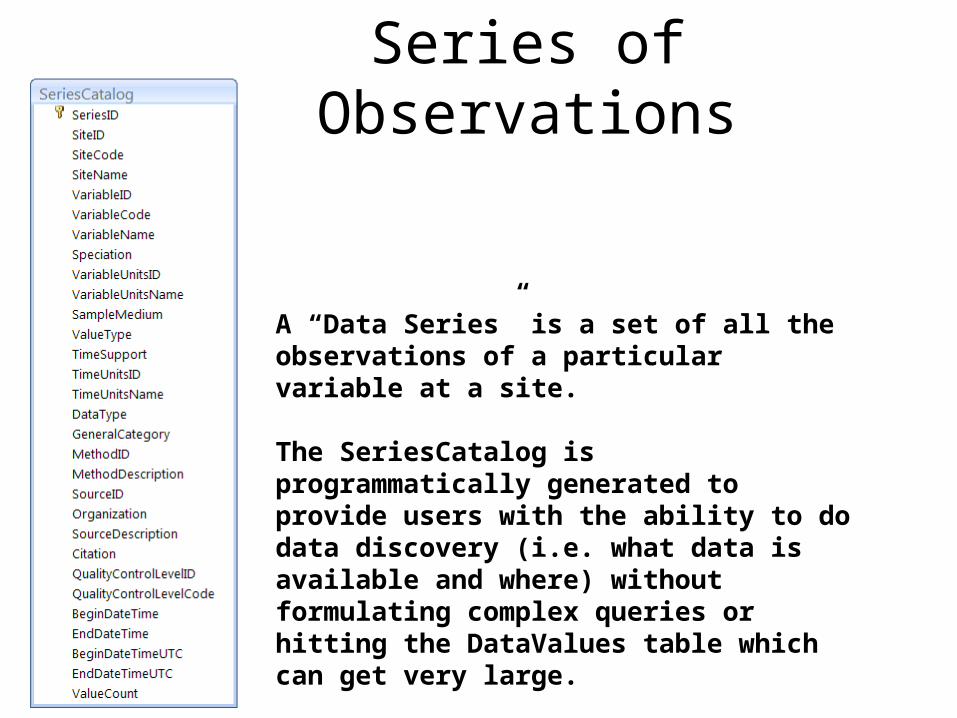
Series of Observations
A “Data Series” is a set of all the observations of a particular variable at a site.
The SeriesCatalog is programmatically generated to provide users with the ability to do data discovery (i.e. what data is available and where) without formulating complex queries or hitting the DataValues table which can get very large.
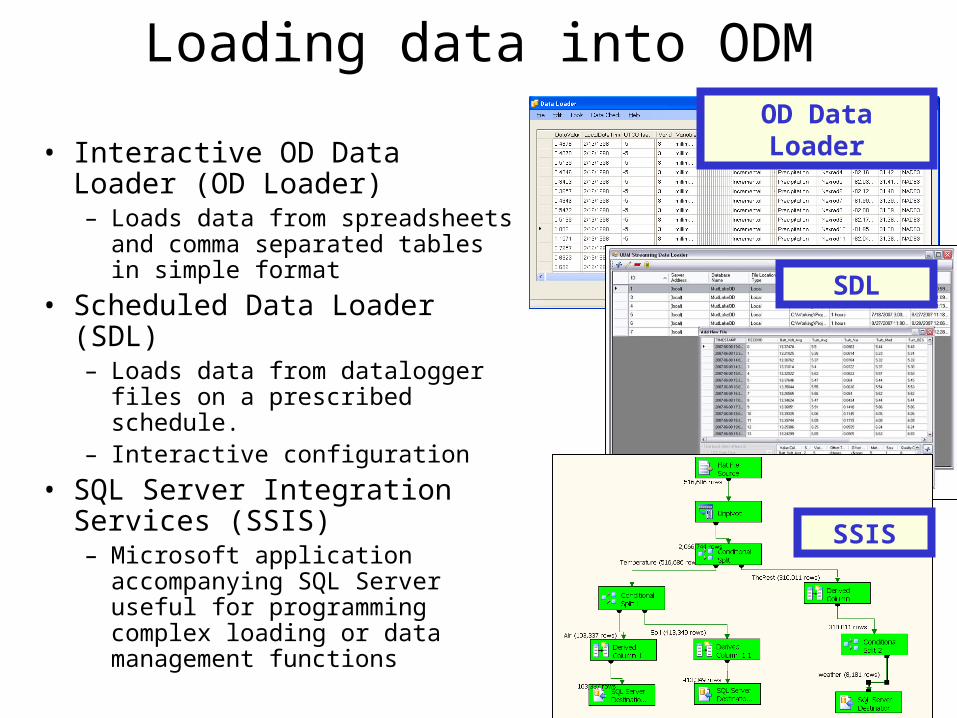
Loading data into ODM
• Interactive OD Data Loader (OD Loader)– Loads data from spreadsheets and
comma separated tables in simple format
• Scheduled Data Loader (SDL)– Loads data from datalogger files on a
prescribed schedule.– Interactive configuration
• SQL Server Integration Services (SSIS)– Microsoft application accompanying
SQL Server useful for programming complex loading or data management functions
OD Data Loader
SDL
SSIS