Embed Size (px)
Citation preview
How to measure the logistics capability in supply chain: calculation model of circulation quantity and response time
Xiaoqun Liu, Shihua Ma*
School of Management, Huazhong University of Science and technology 1037# Luoyu Street, Wuhan 430074, P.R.China
http://www.logistics-chain.com
Abstract: - A model is established to quantify and measure the capacity performance in the process of the supply chain. For most logistics capability based on quantity and time, the supply chains is regarded as complete distribution balance network to analysis and deduct the maximum circulation quantity, integrate circulation quantity and response time, through which the quantization formula for index measuring is determined. Via analysis of the formula, the ways to improve circulation and shorten the response time of the supply chain is studied on the circulation capacity and processing time of the nodes, the quantity of circulation between different nodes, route length between nodes as well as the transportation speed and the time cost on the route. Key-Words: - supply chain management, logistics capability, circulation quantity, response time
* Corresponding author
1 Introduction Most companies have been in an environment of fierce global competition, short product cycle, highly decentralized operation and management driven by demand. Facing the ever-changing and unforeseeable buyer's market, enterprises gradually focus their attention in LOGISTICS, the Third Source of Profit after lower material consumption and higher working efficiency, expecting to lower operation cost with improved customer service.
However, competition between modern enterprises is not restricted in enterprises themselves, but in supply chains as well. Any single node enterprise, even with best operation, can not ensure the supply chain is optimized in a whole, especially in logistics operations. For example, small batches and multiple orders in the lower stream usually result in disequilibrium deficiency in scale economy in upper stream enterprises, thus it is necessary to re-integrate the physical distribution of the supply chain in geographical distribution and channel management [1].
Therefore, logistics, as one of the most important parts of supply chain, is extensively and closed focused because the logistics capability is believed to have definitive influence on the competitiveness of the whole supply chain. On the basis of globalization and lean production, David Pollitt took a comprehensive retrospect, conclusion and prospect on performance improvement, info-tech application, strategy integration and demand response of supply chain in the new century [2]. Investing 111 excellent enterprises in 17 different countries in Northern
American and Europe, the Global Logistics Research Team of Michigan State University identified 32 capabilities which have influence on supply chain performance, in which 17 are determined as general capabilities, classified in four categories: positioning, integration, agility and measurement [3].
In various logistics capability, Quantity and Time are most usually used for analysis, from which derived some relative capabilities, such as delivery punctuality, delivery credibility, turnaround time consistency, duration of response time, flexibility of time compression. In a study on the influence of logistics capability on competitive advantage and enterprise cost, Morash et.al draw out the first three capabilities of the four most influential factors to business performance: delivery reliability, responsiveness to target market(s) and delivery speed [4]. In a interview made by Daugherty in 1998 to the customers enjoying delivery service in the consumption industry, what most usually mentioned by the interviewee are accuracy of goods, order processing rate, turnaround time consistency, duration of turnaround time, delivery punctuality, delivery frequency and so on [5], all of which are closely related with Quantity and Time. It is conformed with an investigation to delivering and distribution experts carried out by US Quest for Quality.
Daughtery and Pittman studies logistics on Time, and holds that Delivery Flexibility is one of the most significant distribution capabilities [6]. Studying US businessmen’s plants in Mexico, Fawcett (et.al) analyzed the logistics capability that improves international operation performance of the business,
Proceedings of the 5th WSEAS Int. Conf. on Signal Processing, Robotics and Automation, Madrid, Spain, February 15-17, 2006 (pp370-375)
and one of the most important factor is Time-based logistics capability, including delivery capability, quality capability, flexibility capability and so on [7] . In an investigation and study on member firms of National Council of Logistics Management in 2001, Zhao and other scholars pointed out that an important factor influential to business performance is customer attention featured with Time-based Responsiveness and Flexibility [8].
However, the study on the above mentioned logistics capability focuses generally on individual firms, and mostly just the case study with description and conclusion. Therefore, it is very necessary to quantify logistics capability to further the study on the basis of supply chain and the analysis model so as to establish foundation of study on influence of logistics capability to the competitiveness of the supply chain. Via an analysis to logistics features, Professor Wang Zhongxi found that it is possible to depict logistic feature via vector analysis method and he established the concepts of logistics momentum and logistics circulation quantity. Via quantization and calculation on logistics momentum and logistics flux, he studied logistics momentum—the basic law of supply chain logistics under the ideal condition of “even delivery and uniform velocity” [9]. Nevertheless, the structure of supply chain defined in the paper is relatively simply, and no special study is carried on the Time factor in logistics. In reference of Equilibrium model of network economics, Nagurney regard the supply chain as special network structure, and in the hypothesis of “homogeneity”, he analyzed node behavior in separate decision-making condition and deduced the balance condition of the whole supply chain [10].The network balance model of supply chain, quite rational, consists of one of the basic methods for supply chain balance [11], but it is mainly applies for decision of each node in supply chain, not in quantization of logistics capability.
As most logistics capability is based on Quantity and Time, via the basic quantifying calculation of logistics momentum and logistics flux via vector analysis, this paper takes supply chain as a whole of circulation balance network, and quantifies logistics capability from logistics flux (including max. logistics flux and whole circulation quantity in supply chain) and response time, through index of which instructions are made for improvement in logistics capability. 2 Model description, assumptions and
notation In a supply chain, logistics system consists of multiple logistic nodes and jobs of supply, production
and distribution subsystems. Thus, logistics capability in supply chain should be an integration of capabilities of these subsystems, nodes and jobs, but meanwhile, it is not simply sum of these capabilities of the subsystems.
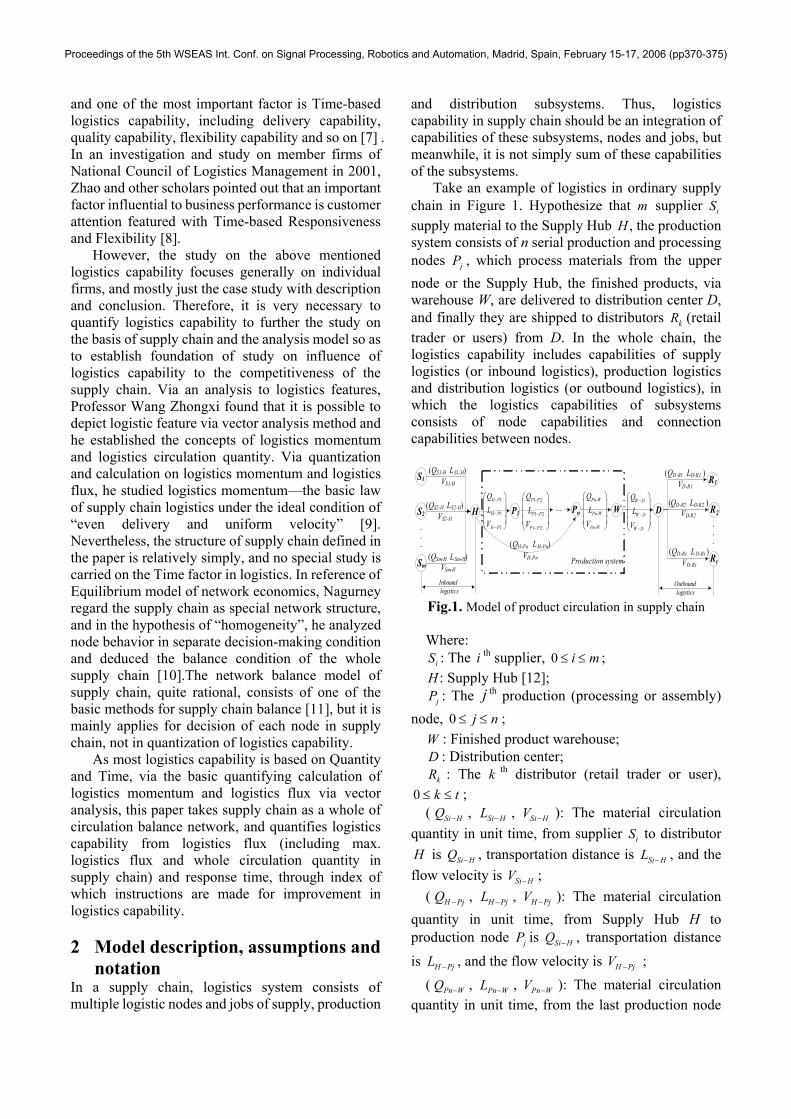
Take an example of logistics in ordinary supply chain in Figure 1. Hypothesize that m supplier iS supply material to the Supply Hub H , the production system consists of n serial production and processing nodes jP , which process materials from the upper node or the Supply Hub, the finished products, via warehouse W, are delivered to distribution center D, and finally they are shipped to distributors kR (retail trader or users) from D. In the whole chain, the logistics capability includes capabilities of supply logistics (or inbound logistics), production logistics and distribution logistics (or outbound logistics), in which the logistics capabilities of subsystems consists of node capabilities and connection capabilities between nodes.
S1
S2
Sm
H
(QS1-H LS1-H)VS1-H
P1 Pn W D
R1
R2
Rt
(QS2-H LS2-H)VS2-H
(QSm-H LSm-H)VSm-H
(QD-R1 LD-R1 )VD-R1
(QD-R2 LD-R2 )VD-R2
(QD-Rt LD-Rt )VD-Rt
...
.
.
. (QH-Pn LH-Pn)VH-Pn
- 1
1
1
H P
H P
H P
QLV
−
−
⎛ ⎞⎜ ⎟⎜ ⎟⎜ ⎟⎝ ⎠
1- 2
1 2
1 2
P P
P P
P P
QL
V−
−
⎛ ⎞⎜ ⎟⎜ ⎟⎜ ⎟⎝ ⎠
-
-
-
Pn W
Pn W
Pn W
QL
V
⎛ ⎞⎜ ⎟⎜ ⎟⎜ ⎟⎝ ⎠
W D
W D
W D
QL
V
−
−
−
⎛ ⎞⎜ ⎟⎜ ⎟⎜ ⎟⎝ ⎠ .
.
.
Inbound logistics
Outbound logistics
Production system
Fig.1. Model of product circulation in supply chain
Where: iS : The i th supplier, 0 i m≤ ≤ ;
H : Supply Hub [12]; jP : The j th production (processing or assembly)
node, 0 j n≤ ≤ ; W : Finished product warehouse; D : Distribution center;
kR : The k th distributor (retail trader or user), 0 k t≤ ≤ ;
( Si HQ − , Si HL − , Si HV − ): The material circulation quantity in unit time, from supplier iS to distributor H is Si HQ − , transportation distance is Si HL − , and the flow velocity is Si HV − ;
( H PjQ − , H PjL − , H PjV − ): The material circulation quantity in unit time, from Supply Hub H to production node jP is Si HQ − , transportation distance is H PjL − , and the flow velocity is H PjV − ;
( Pn WQ − , Pn WL − , Pn WV − ): The material circulation quantity in unit time, from the last production node
Proceedings of the 5th WSEAS Int. Conf. on Signal Processing, Robotics and Automation, Madrid, Spain, February 15-17, 2006 (pp370-375)
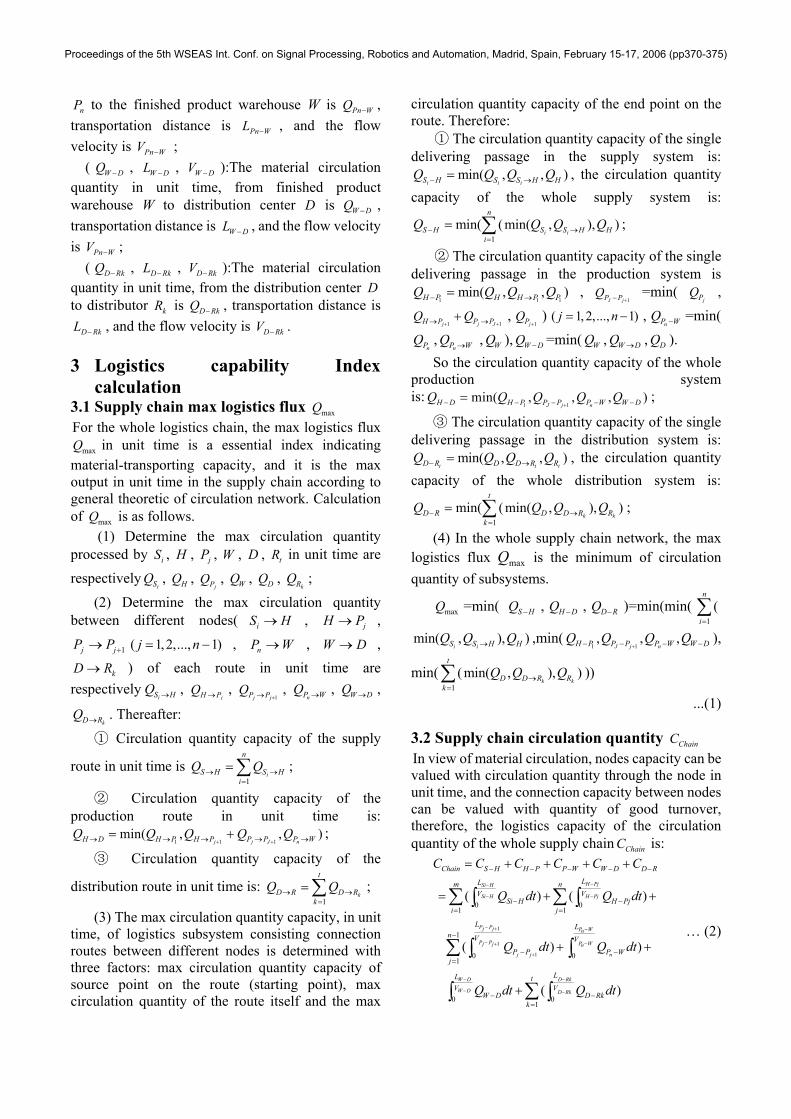
nP to the finished product warehouse W is Pn WQ − , transportation distance is Pn WL − , and the flow velocity is Pn WV − ;
( W DQ − , W DL − , W DV − ):The material circulation quantity in unit time, from finished product warehouse W to distribution center D is W DQ − , transportation distance is W DL − , and the flow velocity is Pn WV − ;
( D RkQ − , D RkL − , D RkV − ):The material circulation quantity in unit time, from the distribution center D to distributor kR is D RkQ − , transportation distance is
D RkL − , and the flow velocity is D RkV − .
3 Logistics capability Index calculation
3.1 Supply chain max logistics flux maxQ For the whole logistics chain, the max logistics flux
maxQ in unit time is a essential index indicating material-transporting capacity, and it is the max output in unit time in the supply chain according to general theoretic of circulation network. Calculation of maxQ is as follows.
(1) Determine the max circulation quantity processed by iS , H , jP , W , D , tR in unit time are respectively
iSQ , HQ , jPQ , WQ , DQ ,
kRQ ;
(2) Determine the max circulation quantity between different nodes( iS H→ , jH P→ ,
1 ( 1,2,..., 1)j jP P j n+→ = − , nP W→ , W D→ ,
kD R→ ) of each route in unit time are respectively
iS HQ → , jH PQ → ,
1j jP PQ+→ ,
nP WQ → , W DQ → ,
kD RQ → . Thereafter:
① Circulation quantity capacity of the supply
route in unit time is 1
i
n
S H S Hi
Q Q→ →=
=∑ ;
② Circulation quantity capacity of the production route in unit time is:
1 1 1min( , , )
j j J nH D H P H P P P P WQ Q Q Q Q+ +→ → → → →= + ;
③ Circulation quantity capacity of the
distribution route in unit time is: 1
k
t
D R D Rk
Q Q→ →=
= ∑ ;
(3) The max circulation quantity capacity, in unit time, of logistics subsystem consisting connection routes between different nodes is determined with three factors: max circulation quantity capacity of source point on the route (starting point), max circulation quantity of the route itself and the max
circulation quantity capacity of the end point on the route. Therefore:
① The circulation quantity capacity of the single delivering passage in the supply system is:
min( , , )i i iS H S S H HQ Q Q Q− →= , the circulation quantity
capacity of the whole supply system is:
1min( (min( , ), )
i i
n
S H S S H Hi
Q Q Q Q− →=
= ∑ ;
② The circulation quantity capacity of the single delivering passage in the production system is
1 1 1min( , , )H P H H P PQ Q Q Q− →= ,
1J jP PQ+− =min(
jPQ ,
1 1j j JH P P PQ Q+ +→ →+ ,
1jPQ+
) ( 1, 2,..., 1)j n= − ,nP WQ − =min(
nPQ ,nP WQ → , WQ ), W DQ − =min( WQ , W DQ → , DQ ).
So the circulation quantity capacity of the whole production system is:
1 1min( , , , )
J j nH D H P P P P W W DQ Q Q Q Q+− − − − −= ;
③ The circulation quantity capacity of the single delivering passage in the distribution system is:
min( , , )t t tD R D D R RQ Q Q Q− →= , the circulation quantity
capacity of the whole distribution system is:
1min( ( min( , ), )
k k
t
D R D D R Rk
Q Q Q Q− →=
= ∑ ;
(4) In the whole supply chain network, the max logistics flux maxQ is the minimum of circulation quantity of subsystems.
maxQ =min( S HQ − , H DQ − , D RQ − )=min(min(1
(n
i=∑
min( , ), )i iS S H HQ Q Q→ ,min(
1 1, , ,
J j nH P P P P W W DQ Q Q Q+− − − − ),
min(1
(min( , ), )k k
t
D D R Rk
Q Q Q→=∑ ))
...(1)
3.2 Supply chain circulation quantity ChainC In view of material circulation, nodes capacity can be valued with circulation quantity through the node in unit time, and the connection capacity between nodes can be valued with quantity of good turnover, therefore, the logistics capacity of the circulation quantity of the whole supply chain ChainC is:
1
1
1
0 01 1
1
0 01
0 01
( ) ( )
( ) )
( )
H PjSi H
Si H H Pj
P Pj j P Wn
P P P Wj j n
j j n
W D D Rk
W D D Rk
Chain S H H P P W W D D RLLm n
V VSi H H Pj
i j
L Ln V V
P P P Wj
LL tV V
W D D Rkk
C C C C C C
Q dt Q dt
Q dt Q dt
Q dt Q dt
−−
− −
− + −
− −+
+
− −
− −
− − − − −
− −= =
−
− −=
− −=
= + + + +
= + +
+ +
+
∑ ∑∫ ∫
∑ ∫ ∫
∑∫ ∫
… (2)
Proceedings of the 5th WSEAS Int. Conf. on Signal Processing, Robotics and Automation, Madrid, Spain, February 15-17, 2006 (pp370-375)
Where, Circulation quantity of the supply
logistics system 0
1( )
Si H
Si H
LmV
S H Si Hi
C Q dt−
−− −
=
=∑ ∫ ;
Circulation quantity of the production
system H P P WC C− −+ =0
1( )
H Pj
H Pj
LnV
H Pjj
Q dt−
−−
=∑ ∫ +
1
1
1
1
01( )
P Pj j
P Pj j
j j
Ln V
P Pj
Q dt
− +
− +
+
−
−=∑ ∫ +
0;
P Wn
P Wn
n
L
VP WQ dt
−
−
−∫ Circulation
quantity of the distribution system W D D RC C− −+ =
0
W D
W D
LV
W DQ dt−
−−∫ +
01
( )D Rk
D Rk
LtV
D Rkk
Q dt−
− −=∑ ∫ .
In view of circulation, circulation quantity of the supply chain ChainC represents the covering capacity of the whole logistics chain, which is a comprehensive indication of circulation quantity, delivering distance and delivering speed of each logistics node. In view of warehouse, the circulation quantity of the supply chain ChainC represents in-delivering warehouse capacity of the whole logistics chain. Generally speaking, the more capacity the in-delivering warehouse holds, it is more safe to ensure supply, production and distribution of the supply chain, however, with more capital.
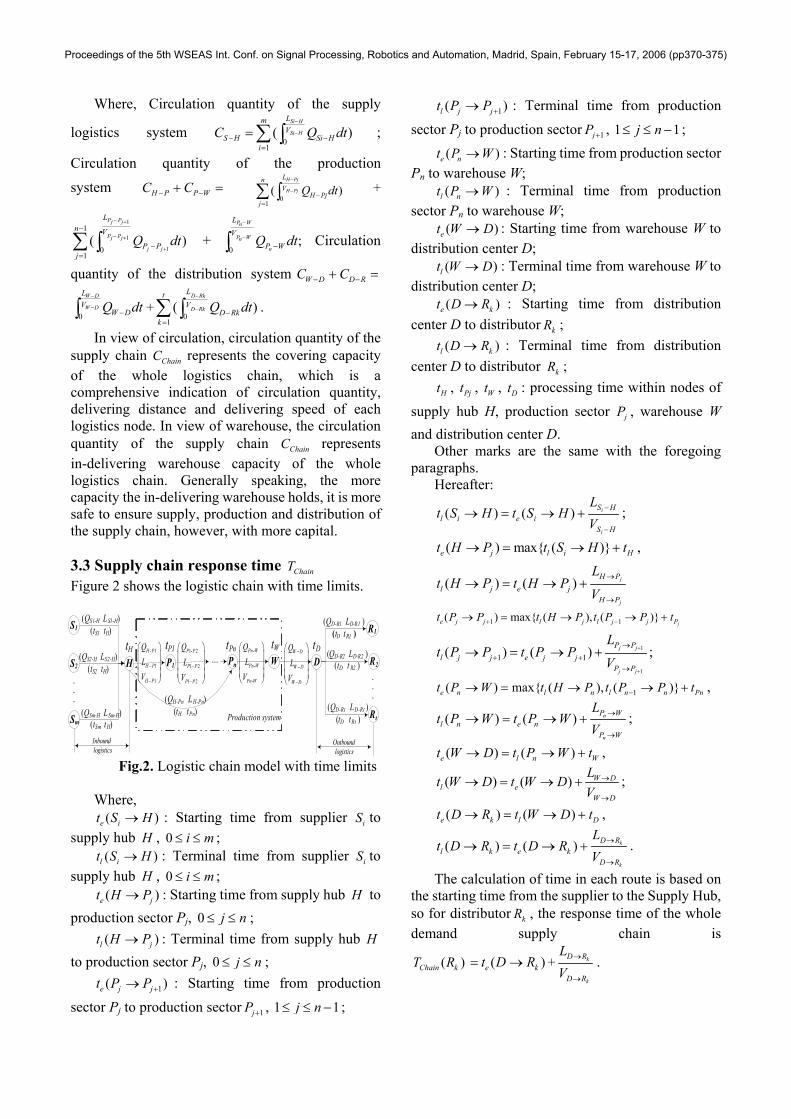
3.3 Supply chain response time ChainT Figure 2 shows the logistic chain with time limits. S1
S2
Sm
H
(QS1-H LS1-H)(tS1 tH)
P1 Pn W D
R1
R2
Rt
(QS2-H LS2-H)(tS2 tH)
(QSm-H LSm-H)(tSm tH)
(QD-R1 LD-R1 )(tD tR1 )
(QD-R2 LD-R2 )(tD t R2 )
(QD-Rt LD-Rt )(tD tRt )
...
.
.
. (QH-Pn LH-Pn)(tH tPn)
- 1
1
1
H P
H P
H P
QLV
−
−
⎛ ⎞⎜ ⎟⎜ ⎟⎜ ⎟⎝ ⎠
1- 2
1 2
1 2
P P
P P
P P
QL
V−
−
⎛ ⎞⎜ ⎟⎜ ⎟⎜ ⎟⎝ ⎠
-
-
-
Pn W
Pn W
Pn W
QL
V
⎛ ⎞⎜ ⎟⎜ ⎟⎜ ⎟⎝ ⎠
W D
W D
W D
QL
V
−
−
−
⎛ ⎞⎜ ⎟⎜ ⎟⎜ ⎟⎝ ⎠ .
.
.
Inbound logistics
Outbound logistics
Production system
tH tP1 tPn tW tD
Fig.2. Logistic chain model with time limits
Where, ( )e it S H→ : Starting time from supplier iS to
supply hub H , 0 i m≤ ≤ ; ( )l it S H→ : Terminal time from supplier iS to
supply hub H , 0 i m≤ ≤ ; ( )e jt H P→ : Starting time from supply hub H to
production sector Pj, 0 j n≤ ≤ ; ( )l jt H P→ : Terminal time from supply hub H
to production sector Pj, 0 j n≤ ≤ ;
1( )e j jt P P +→ : Starting time from production sector Pj to production sector 1jP + , 1 1j n≤ ≤ − ;
1( )l j jt P P +→ : Terminal time from production sector Pj to production sector 1jP + , 1 1j n≤ ≤ − ;
( )e nt P W→ : Starting time from production sector Pn to warehouse W;
( )l nt P W→ : Terminal time from production sector Pn to warehouse W;
( )et W D→ : Starting time from warehouse W to distribution center D;
( )lt W D→ : Terminal time from warehouse W to distribution center D;
( )e kt D R→ : Starting time from distribution center D to distributor kR ;
( )l kt D R→ : Terminal time from distribution center D to distributor kR ;
Ht , Pjt , Wt , Dt : processing time within nodes of supply hub H, production sector jP , warehouse W and distribution center D.
Other marks are the same with the foregoing paragraphs.
Hereafter:
( ) ( ) i
i
S Hl i e i
S H
Lt S H t S H
V−
−
→ = → + ;
( ) max{ ( )}e j l i Ht H P t S H t→ = → + ,
( ) ( ) j
j
H Pl j e j
H P
Lt H P t H P
V→
→
→ = → +
1 1( ) max{ ( ), ( )}je j j l j l j j Pt P P t H P t P P t+ −→ = → → +
1
1
1 1( ) ( ) j j
j j
P Pl j j e j j
P P
Lt P P t P P
V+
+
→
+ +→
→ = → + ;
1( ) max{ ( ), ( )}e n l n l n n Pnt P W t H P t P P t−→ = → → + ,
( ) ( ) n
n
P Wl n e n
P W
Lt P W t P W
V→
→
→ = → + ;
( ) ( )e l n Wt W D t P W t→ = → + ,
( ) ( ) W Dl e
W D
Lt W D t W D
V→
→
→ = → + ;
( ) ( )e k l Dt D R t W D t→ = → + ,
( ) ( ) k
k
D Rl k e k
D R
Lt D R t D R
V→
→
→ = → + .
The calculation of time in each route is based on the starting time from the supplier to the Supply Hub, so for distributor kR , the response time of the whole demand supply chain is
( )Chain kT R ( )e kt D R= → + k
k
D R
D R
LV
→
→
.
Proceedings of the 5th WSEAS Int. Conf. on Signal Processing, Robotics and Automation, Madrid, Spain, February 15-17, 2006 (pp370-375)
In deduction of ( )Chain kT R , starting time of the processing section 2,3,..., 1)jP j n= −( of production system to 1jP + is the bigger one of (1) the terminal time from above section 1jP − to this section and (2) the terminal time from the Supply Hub H. To time
( )l jt H P→ , i.e., 1( )e j jt P P +→ , max= { ( )l jt H P→ ,
1( )}l j jt P P− →jPt+ ( 2,3,..., 1)j n= − .
For 1P , 1( )lt H P→ max= { ( )}l it S H→ Ht+ +
1
1
H P
H P
LV
→
→
.
For a processing section JP ( 3 1J n≤ ≤ − ),
1( )( )e j jt P P j J+→ = , 1( )e J Jt P P +→ =max{ ( )l it S H→ }
+ Ht +max{ 1
1
H P
H P
LV
→
→
+ 1
1
12
( )j j
j
j j
JP P
Pj P P
Lt
V−
−
−
→
= →
+∑ , 2
2
H P
H P
LV
→
→
+
1
1
13
( )j j
j
j j
JP P
Pj P P
Lt
V−
−
−
→
= →
+∑ ,..., J
J
H P
H P
LV
→
→
}+Jpt .
The response time of the whole supply chain is ( )Chain kT R .
( )Chain kT R = max{ ( )l it S H→ }+ Ht +max{ 1
1
H P
H P
LV
→
→
+
1
1
12
( )j j
j
j j
nP P
Pj P P
Lt
V−
−
−
→
= →
+∑ , 2
2
H P
H P
LV
→
→
+ 1
1
13
( )j j
j
j j
nP P
Pj P P
Lt
V−
−
−
→
= →
+∑ ,...,
n
n
H P
H P
LV
→
→
}+nPt + n
n
P W
P W
LV
→
→
+ Wt + W D
W D
LV
→
→
+ Dt + k
k
D R
D R
LV
→
→
.
… (3) In ChainT , according to different stage, time of
supply logistics is ( ) max{ ( )}Chain i l iT S H t S H− = →
Ht+ , time of production logistics is
( )chainT H D− =max{ 1
1
1
1
21
( )j j
j
j j
nP PH P
PjH P P P
LLt
V V−
−
−
→→
=→ →
+ +∑ ,
2
2
H P
H P
LV
→
→
+ 1
1
13
( )j j
j
j j
nP P
Pj P P
Lt
V−
−
−
→
= →
+∑ ,..., n
n
H P
H P
LV
→
→
}+nPt + n
n
P W
P W
LV
→
→
+
Wt + W D
W D
LV
→
→
, time of distribution logistics is
( ) W Dchain k D
W D
LT D R t
V→
→
− = + . Accordingly, in ChainT ,
time ratio used in supply logistics is ( )
( ) Chain ii
Chain
T S HR S H
T−
− = , in production logistics
is ( )( ) Chain
Chain
T H DR H D
T−
− = , in distribution logistics
is ( )( ) chain k
kchain
T D RR D R
T−
− = . Time ration of
subsystems represents distributing status of the response time of the whole supply chain ChainT in different stage.
In ChainT , according to different time features, the delivery time is
( ) max{ ( )}chain l iT T t S H= → +max{ 1
1
H P
H P
LV
→
→
+
1
12
( )j j
j j
nP P
j P P
L
V−
−
→
= →∑ , 2
2
H P
H P
LV
→
→
+ 1
13
( )j j
j j
nP P
j P P
L
V−
−
→
= →∑ ,…, n
n
H P
H P
LV
→
→
}+
n
n
P W
P W
LV
→
→
+ W D
W D
LV
→
→
+ k
k
D R
D R
LV
→
→
, while the node processing
time is1
2( ) ( )
j n
n
chain H P P W Dj
T P t t t t t−
=
= + + + +∑ . In ChainT ,
time ration used in delivery is ( )( ) chain
Chain
T TR T
T= , and
time ration used in node processing
is ( )( ) Chain
Chain
T PR P
T= . The time and ration taken by
delivery and node represents distributing status via function in the response time of the whole supply chain.
4 Discussion According to formula (1), (2) and (3), measures to improve circulation quantity and response time of the supply can be taken from the following five aspects. 4.1 Processing capability of nodes Logistics nodes refer to the source points and end in a logistics system, including suppliers, supply hub, manufacturers, wholesalers, distributors, warehouse, and distribution center and so on. Nodes are one of the two most fundamental factors of logistic network, the processing capability of which includes:
One is the node circulation capability. In formula (1), max circulation quantity of route nodes (source points and end points) is one of the two influential factors of the max logistics flux maxQ . Therefore, improvement in circulation quantity of the nodes is helpful for the max logistics flux of the supply chain.
Another is the node processing time. According to formula (3), the node processing time is one of the components of response time of the whole supply chain ChainT , and its ratio in it represents time ratio taken by storing or processing in the supply chain.
4.2 Circulation quantity in routes between nodes
Proceedings of the 5th WSEAS Int. Conf. on Signal Processing, Robotics and Automation, Madrid, Spain, February 15-17, 2006 (pp370-375)
Circulations quantity refers to the presented quantity of the connection route with a certain time. Circulation quantity of a connection route is determined with the carrier of the goods on it, mainly including carry capacity, delivering frequency and efficiency and so on, and it is under effect of processing capacity of the nodes of the two sections.
4.3 Length of route between nodes A route is the connection between a source point to the end, which is another fundamental factor of logistics network. The length of a route is flow, which means the quantity of good paths in a certain time on the route. According to formula (2), the longer route usually indicates the more circulation quantity holding on the route, and the ChainC is bigger. 4.4 Flow velocity of goods on route between nodes Flow velocity refers to the speed of goods on a certain path (flow) of the route, which is also an influential factor of the response time of the whole supply chain ChainT . 4.5 Time cost in route between nodes Time cost in route between nodes equals to the ration of length of route to moving velocity of logistics. According to formula (3), in a given length of route, a higher velocity means shorter logistic time, quicker response time to demand At a given flow velocity, the longer the distance between nodes is, the more time it is taken in the route and the longer the time responses in the whole supply chain. 5 Conclusion In view of the important impact of logistics to supply chain performance, it is extremely significant to study the whole flow of logistics in supply chain according to its capability. However, the present studies logistic capability are mainly case study without quantization and calculation for specific indexes. As most logistics capability are based on Quantity and Time, this paper, taking supply chain network as complete goods circulation balance network, deduces the three indexes of supply chain: the max circulation quantity, the whole circulation quantity and the response time, on which the formula for index calculation is determined. With the formula, a brief analysis is made on how to improve circulation quantity and response time in supply chain from circulation quantity and processing time of nodes, goods flow of router between nodes, length of route between nodes, moving velocity on the route and time cost in the route.
Acknowledgements This work was supported by the National Natural Science Foundation of China (NO. 70332001). References: [1] Stock G.N., Greis N.P., Kasarda J.D., Enterprise logistics and supply chain structure: the role of fit, Journal of Operations Management, Vol.18, No.5, 2000, pp.531-547. [2] Pollitt D., Logistics management at the threshold of the new millennium, International Journal of Physical Distribution &Logistics Management, Vol.28, No.3, 1998, pp.167-226. [3] Cho J.-K., Firm Performance In the E-commerce Market: the Role of Logistics Capabilities and Logistics Outsourcing, Arkansas: University of Arkansas, 2001. [4] Morash E., DrÖge C., Vickery S., Strategic logistics capabilities for competitive advantage and firm success, Journal of Business Logistics, Vol.17, No.1, 1996, pp.1-22. [5] Daugherty P., Stank T., Ellinger A., Leveraging logistics/distribution capabilities: the effect of logistics service on marketshare, Journal of Business Logistics,Vol.19, No.2, 1998, pp.35-51. [6] Daughery P.J., Pittman P.H., Utilization of time-based strategies: creating distribution flexibility/responsiveness, International. Journal of Operations & Production Management, Vol.15, No.2, 1995, pp.54-60. [7] Fawcett S., Stanley L., Smith S.. Developing logistics capability to improve the performance of international operations, Journal of Business Logistics, Vol.18, No.2, 1997, pp.16-23. [8] Zhao M., DrÖge C., Stank T., The effect of logistics capabilities on firm performance: customer-focused versus information-focused capabilities, Journal of Business Logistics, Vol.22, No.2, 2001, pp.91-103. [9] Wang Z.-X., YU Z.-S., GONG W.F., A brief discussion of logistics vector analysis, Logistics technology, No.9, 2004, pp.1-3. (in Chinese) [10] Nagurney A., Dong J., Zhang D.A., supply chain network equilibrium model, Transportation Research Part E: Logistics and Transportation Review, Vol.38, No.5, 2002, pp.281-303. [11] García, R., Marín A.: Network equilibrium with combined modes: models and solution algorithms. Transportation Research Part B: Methodological, Vol.39, No.3, 2005, pp.223-254. [12] Chopra S., Meindl P. Supply Chain Management: Strategy, Planning, and Operation, Prentice-Hall, 2001.
Proceedings of the 5th WSEAS Int. Conf. on Signal Processing, Robotics and Automation, Madrid, Spain, February 15-17, 2006 (pp370-375)