Embed Size (px)
Citation preview
Financial Stability Report | December 2014 45
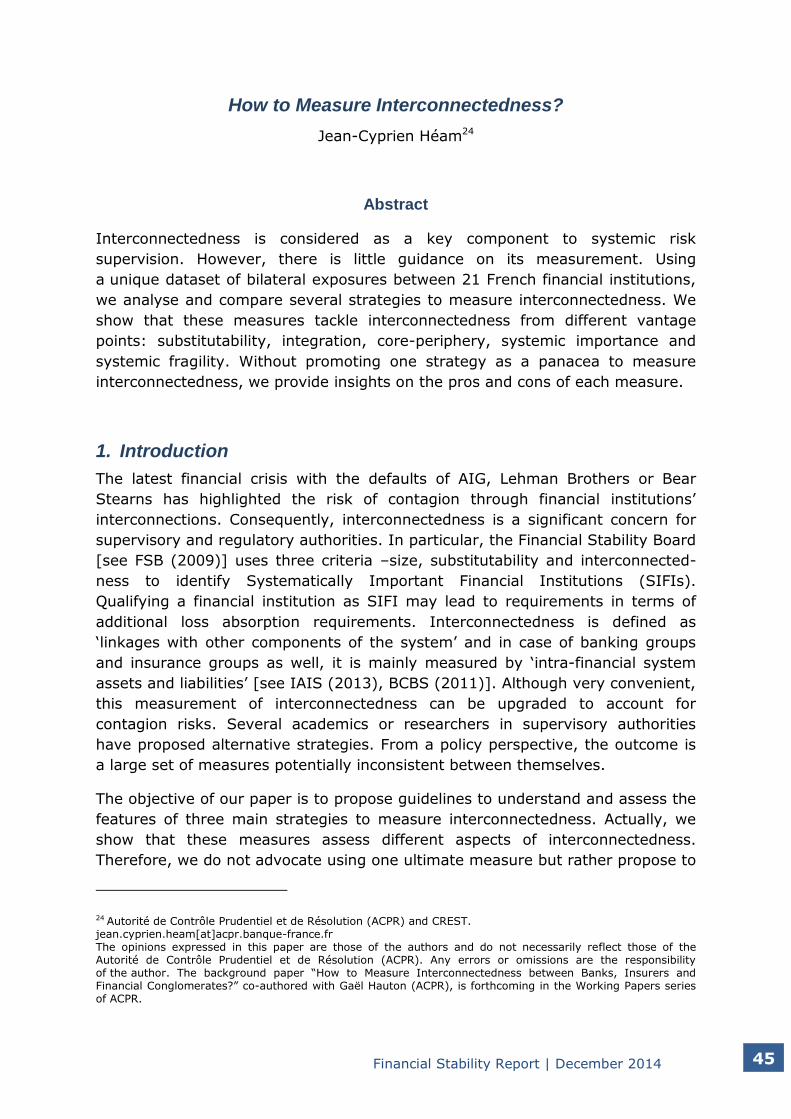
How to Measure Interconnectedness?
Jean-Cyprien Héam24
Abstract
Interconnectedness is considered as a key component to systemic risk
supervision. However, there is little guidance on its measurement. Using
a unique dataset of bilateral exposures between 21 French financial institutions,
we analyse and compare several strategies to measure interconnectedness. We
show that these measures tackle interconnectedness from different vantage
points: substitutability, integration, core-periphery, systemic importance and
systemic fragility. Without promoting one strategy as a panacea to measure
interconnectedness, we provide insights on the pros and cons of each measure.
1. Introduction
The latest financial crisis with the defaults of AIG, Lehman Brothers or Bear
Stearns has highlighted the risk of contagion through financial institutions’
interconnections. Consequently, interconnectedness is a significant concern for
supervisory and regulatory authorities. In particular, the Financial Stability Board
[see FSB (2009)] uses three criteria –size, substitutability and interconnected-
ness to identify Systematically Important Financial Institutions (SIFIs).
Qualifying a financial institution as SIFI may lead to requirements in terms of
additional loss absorption requirements. Interconnectedness is defined as
‘linkages with other components of the system’ and in case of banking groups
and insurance groups as well, it is mainly measured by ‘intra-financial system
assets and liabilities’ [see IAIS (2013), BCBS (2011)]. Although very convenient,
this measurement of interconnectedness can be upgraded to account for
contagion risks. Several academics or researchers in supervisory authorities
have proposed alternative strategies. From a policy perspective, the outcome is
a large set of measures potentially inconsistent between themselves.
The objective of our paper is to propose guidelines to understand and assess the
features of three main strategies to measure interconnectedness. Actually, we
show that these measures assess different aspects of interconnectedness.
Therefore, we do not advocate using one ultimate measure but rather propose to
24 Autorité de Contrôle Prudentiel et de Résolution (ACPR) and CREST. jean.cyprien.heam[at]acpr.banque-france.fr The opinions expressed in this paper are those of the authors and do not necessarily reflect those of the Autorité de Contrôle Prudentiel et de Résolution (ACPR). Any errors or omissions are the responsibility of the author. The background paper “How to Measure Interconnectedness between Banks, Insurers and Financial Conglomerates?” co-authored with Gaël Hauton (ACPR), is forthcoming in the Working Papers series of ACPR.
Financial Stability Report | December 2014 46
pick up measures according to policy concerns. To illustrate the different
measures, we use a unique dataset of bilateral exposures between 21 French
financial institutions.
The remainder of the paper is organized as follows. Section 2 presents briefly
the data set. In Section 3 we analyse risk indicators. Section 4 proposes a way
to compare interconnectedness of two financial institutions. In Section 5 we
discuss the results of identifying a core-periphery structure, as well as
topological indicators. In Section 6 we derive interconnectedness measure from
outcome of contagion stress-test. Section 7 concludes by providing general
guidelines on interconnectedness measure from a supervisory perspective.
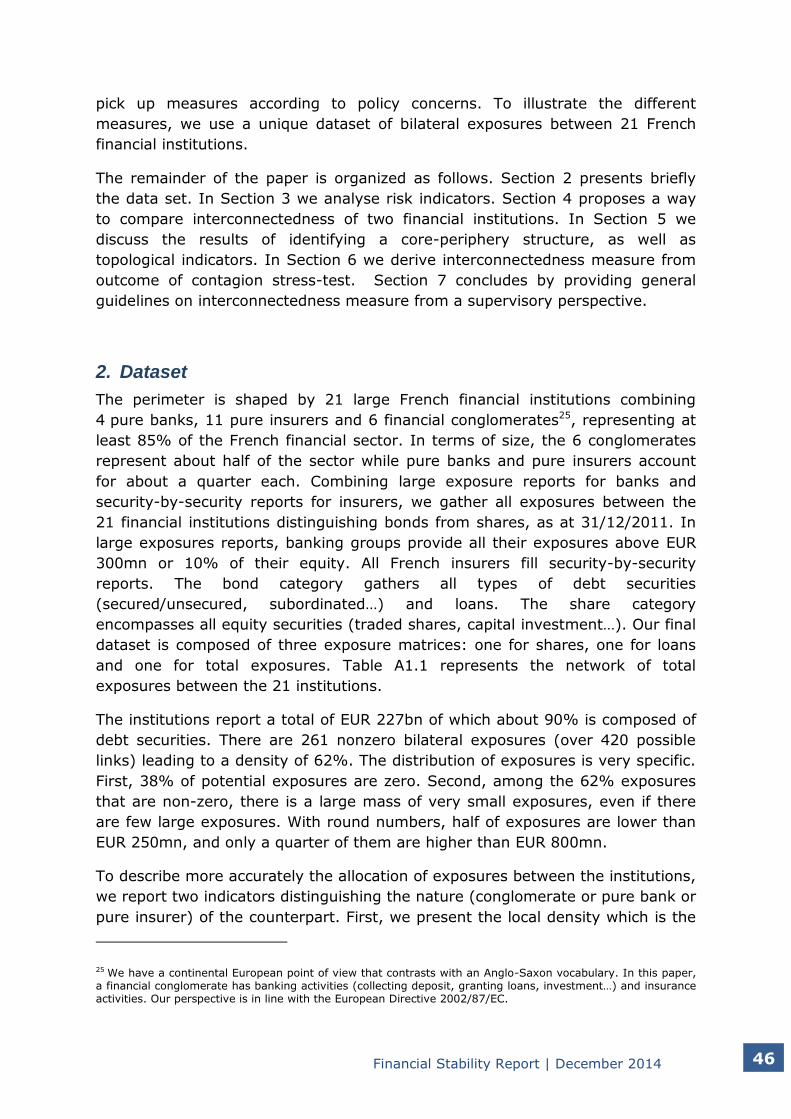
2. Dataset
The perimeter is shaped by 21 large French financial institutions combining
4 pure banks, 11 pure insurers and 6 financial conglomerates25, representing at
least 85% of the French financial sector. In terms of size, the 6 conglomerates
represent about half of the sector while pure banks and pure insurers account
for about a quarter each. Combining large exposure reports for banks and
security-by-security reports for insurers, we gather all exposures between the
21 financial institutions distinguishing bonds from shares, as at 31/12/2011. In
large exposures reports, banking groups provide all their exposures above EUR
300mn or 10% of their equity. All French insurers fill security-by-security
reports. The bond category gathers all types of debt securities
(secured/unsecured, subordinated…) and loans. The share category
encompasses all equity securities (traded shares, capital investment…). Our final
dataset is composed of three exposure matrices: one for shares, one for loans
and one for total exposures. Table A1.1 represents the network of total
exposures between the 21 institutions.
The institutions report a total of EUR 227bn of which about 90% is composed of
debt securities. There are 261 nonzero bilateral exposures (over 420 possible
links) leading to a density of 62%. The distribution of exposures is very specific.
First, 38% of potential exposures are zero. Second, among the 62% exposures
that are non-zero, there is a large mass of very small exposures, even if there
are few large exposures. With round numbers, half of exposures are lower than
EUR 250mn, and only a quarter of them are higher than EUR 800mn.
To describe more accurately the allocation of exposures between the institutions,
we report two indicators distinguishing the nature (conglomerate or pure bank or
pure insurer) of the counterpart. First, we present the local density which is the
25 We have a continental European point of view that contrasts with an Anglo-Saxon vocabulary. In this paper, a financial conglomerate has banking activities (collecting deposit, granting loans, investment…) and insurance activities. Our perspective is in line with the European Directive 2002/87/EC.

Financial Stability Report | December 2014 47
fraction of non-zero bilateral exposure between specific types of institutions. At
one extreme, conglomerates form an almost complete network with 97% of
potential links. On the contrary, pure banks report almost no exposures to pure
insurers. Pure insurers seem to have a funding role in the network since they are
exposed to almost all conglomerates and pure banks whereas few pure banks or
conglomerates are exposed to them. This feature can be explained by the nature
of insurance activity with respect to the banking activity as well as
a diversification motive.
Table A1.1: Local density (proportion of non-zero exposures) according to institution
type
Exposures
on
Conglomerates Pure Banks
Pure Insurance
from
Conglomerates 97% 92% 51%
Pure Banks 70% 33% 7%
Pure
Insurance
91% 80% 52%
Example: the ratio of non-zero bilateral exposures between conglomerates over all
potential exposures between conglomerates is 97%. The ratio of non-zero bilateral
exposure of conglomerate to pure bank is 92%.
Second, we adopt a quantitative perspective and report the proportion of
exposures between groups of institutions (over the total of EUR 227bn) in Table
A1.2. First, about half of the exposures are between conglomerates. Second,
exposures of pure insurers to conglomerates account for about 20%. Then,
exposures of conglomerates to pure banks and to pure insurers represent about
10% each of the total volume.
Table A1.2: Breakdown of volume exposures according to institution type
Exposures
on
Conglomerates Pure
Banks
Pure
Insurances
from
Conglomerates 47.7% 9.8% 8.2%
Pure Banks 4.7% 0.4% 0.1%
Pure
Insurance
20.8% 6.0% 2.3%
Example: 47.7% of the total volume of exposures concern exposures between
conglomerates. 20.8% of the total volume of exposures are reported by insurers on
conglomerates.
These first summary statistics draw four stylized facts. First, the exposures are
modest: about one third of potential exposure are zeros and on the two last
third most exposures are small. However, large exposures are not absent.
Second, the conglomerates appear to be the most important players in terms of
number of links and in terms of volume. Third, pure insurers are mostly net fund
providers to other institutions, in particular of conglomerates. This behaviour is

Financial Stability Report | December 2014 48
in line with basic economic arguments. Fourth, debt instruments are the most
common instruments of exposures.
3. Summary risk statistics
Representing exposure in volume, i.e. in bn Euros, may be misleading since size
effect may blur the picture. Actually, an exposure represents a credit risk for the
owner and a funding risk for the issuer. Since the sizes of the owner and of the
issuer can differ, we need to derive two risk metrics that take control for their
respective sizes. For simplicity, we build a credit risk matrix by dividing
exposures by the equity of the owner and we build a funding risk matrix by
dividing exposures by the equity of the issuer. Considering basic descriptive
statistics of the lines of these matrices provide us with interconnectedness
measures. We call them summary risk statistics.
Figure A1.1: Network of French financial institution (all instruments)
Note: Node colour indicates legal status (red for conglomerates, blue for pure insurers
and yellow for pure banks). Edge width is proportional to exposure.

Financial Stability Report | December 2014 49
Table A1.3 provides the summary statistics of these indicators over the whole population. With round numbers, half exposures represent less than one percent
of the equity of the owner and less than one percent of the equity of the borrower. The tail of credit risk is fatter than the tail of funding risk. A quarter of
exposures represent more than 7.5% of the equity of the owner while a quarter of exposures represent more than 2.46% of the equity of the borrower. In other words, funding sources seem to be more diversified than investment targets.
Summary risk statistics are easy to compute. They disentangle credit risk from
funding risk controlling size effects. However, they lack robustness. For instance,
two institutions may have the same summary risk statistics but may be exposed
to counterparties that differ widely with respect to their fragilities. Therefore,
such risk statistics should be seen as additional summary statistics with clear
interpretation and limits.
Table A1.3: Summary risk statistics
Credit Risk Funding Risk
1st quartile 0.48% 0.22%
Median 1.34% 0.80%
4th quartile 7.50% 2.46%
Example: Half of the exposures represent less than 1.34% of the equity of the lender.
4. Substitutability and integration
Facing the interconnectedness concern, one strategy may be to not measure –
give a figure—for each institution but only to compare them. In that respect, we
propose to analyse two dimensions of interconnectedness: substitutability and
integration. We state that two financial institutions are close with respect to
integration (to the network) if their exposures are similar regardless of the
counterparts. We state that they are close with respect to substitutability (in the
network) if they have similar exposure and exposure to the same counterparts.
Note that the substitutability criterion is stronger than the integration criterion: if
two institutions are close in terms of substitutability, they are necessary close in
terms of integration. These definitions correspond to usual statistical tests to
compare two random distributions. Substitutability analysis and integration
analysis can be computed on volume matrix, and also on credit risk matrix and
funding risk matrix to control for size. Based on the closeness between every
couple of institutions, we can build a group of institutions with similar integration
and similar substitutability.
Applied to our dataset, we conclude that conglomerates form a clear group with
respect to integration on volume while we cannot distinguish pure banks from
pure insurers. However for integration on funding risk, conglomerates do not
shape a specific group and there is no group mixing pure banks and pure
insurers. In other words, even if the type of institutions explains partially
volumes allocation, they lose their power when a risk perspective is adopted.

Financial Stability Report | December 2014 50
Integration and substitutability are pair-wise measures of interconnectedness:
they cannot be used to provide an interconnectedness score to each institution
of the network. Nevertheless, they can unveil unexpected (di)-similarity of the
investment profile and of the funding profile between financial institutions.
5. Core – peripheral institutions and topological indicators
Although interconnectedness matter is relatively new in supervision, economists,
sociologist or IT scientists have already investigated the topic. Some researchers
propose a technological transfer. In particular, economists in game theory show
that some stylized structure of networks characterized the setup of cost-benefit
balance to link formation (see Figure A1.2 for few examples). Empirical papers
on banking network usually conclude that the banking system adopts a core-
periphery structure [see Anand et al. (2014)]. In this framework, banks fall into
two groups. The few banks of the core are completely interconnected between
themselves. The banks of the periphery are connected to only one bank of the
core. In Figure A1.2, the star network can be interpreted as an extreme core-
periphery structure with a core composed of a single institution.
Figure A1.2: Example of stylized network structures
The methodology relies on two elements. First, the exposure matrix, which
contains continuous information, has to be converted into an adjacency matrix
which is composed of 0 (absence of link) and 1 (presence of link). In order to
eliminate noise, we recommend introducing a free threshold. Second, a distance
between the observed adjacency matrix and a theoretical one is to be defined.
In Craig and von Peter (2014), the distance is linked to the number of
discrepancies between the observed adjacency matrix and the theoretical
adjacency matrix. Building on these two steps, an algorithm selects the
Financial Stability Report | December 2014 51
allocation of the institution of the system between the core and the periphery
that minimizes the distance between the observed adjacency matrix and the
theoretical adjacency matrix.26 This optimal partition provides the set of core
institutions and peripheral institutions.
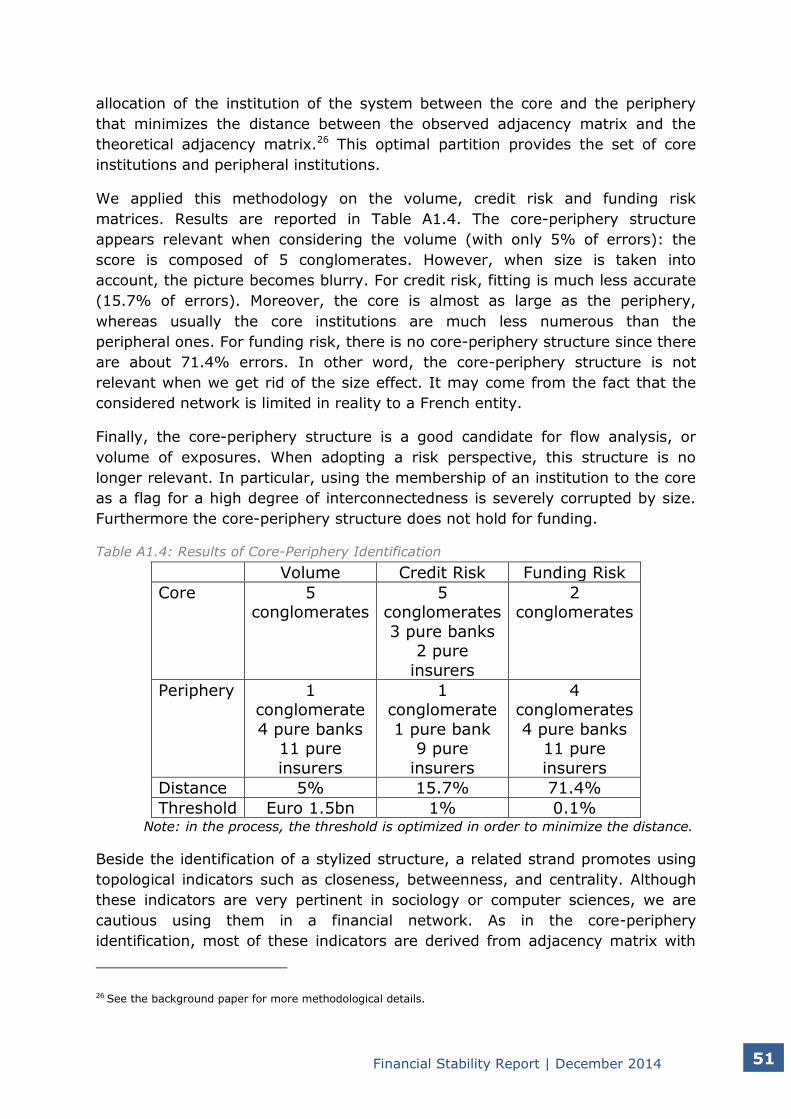
We applied this methodology on the volume, credit risk and funding risk
matrices. Results are reported in Table A1.4. The core-periphery structure
appears relevant when considering the volume (with only 5% of errors): the
score is composed of 5 conglomerates. However, when size is taken into
account, the picture becomes blurry. For credit risk, fitting is much less accurate
(15.7% of errors). Moreover, the core is almost as large as the periphery,
whereas usually the core institutions are much less numerous than the
peripheral ones. For funding risk, there is no core-periphery structure since there
are about 71.4% errors. In other word, the core-periphery structure is not
relevant when we get rid of the size effect. It may come from the fact that the
considered network is limited in reality to a French entity.
Finally, the core-periphery structure is a good candidate for flow analysis, or
volume of exposures. When adopting a risk perspective, this structure is no
longer relevant. In particular, using the membership of an institution to the core
as a flag for a high degree of interconnectedness is severely corrupted by size.
Furthermore the core-periphery structure does not hold for funding.
Table A1.4: Results of Core-Periphery Identification
Volume Credit Risk Funding Risk
Core 5 conglomerates
5 conglomerates
3 pure banks 2 pure
insurers
2 conglomerates
Periphery 1 conglomerate
4 pure banks 11 pure
insurers
1 conglomerate
1 pure bank 9 pure
insurers
4 conglomerates
4 pure banks 11 pure
insurers
Distance 5% 15.7% 71.4%
Threshold Euro 1.5bn 1% 0.1% Note: in the process, the threshold is optimized in order to minimize the distance.
Beside the identification of a stylized structure, a related strand promotes using
topological indicators such as closeness, betweenness, and centrality. Although
these indicators are very pertinent in sociology or computer sciences, we are
cautious using them in a financial network. As in the core-periphery
identification, most of these indicators are derived from adjacency matrix with
26 See the background paper for more methodological details.

Financial Stability Report | December 2014 52
no consideration of size or noise-filtration. This does not hamper results when
relationships concepts are qualitative (friendship, neighbour, alumni…).
Moreover, the interpretations are often assuming some kind of independence on
the exposures: this assumption is very strong in a financial framework. For
instance, having a new friend on an on-line social network is almost costless
whereas providing a new loan means to fail providing it to another potential
partner and implies to engage a counterparty risk analysis. We take the view
that these indicators can be transposed only with reliably adapted guidelines to
finance.

Financial Stability Report | December 2014 53
6. Systemic importance and systemic fragility
As mentioned in the introduction, interconnectedness is considered as
a characteristic of systemic institutions for contagion risk concerns. Over the last
decade, contagion models have been developed to analyse how an external
shock is propagated through a financial system. These contagion models are
widely used to run network stress-tests. We use the model developed in
Gourieroux et al. (2012). The authors propose a model for solvency contagion
distinguishing shares and debt securities. This model is relevant to analyse long-
term positions but includes no liquidity features (such as fire-sale or debt rolling-
over).
Following Alves et al. (2013), we derive two metrics of interconnectedness.
Systemic importance is the impact of one institution on the other institutions
(the direction is ‘firm-to-system’), whereas systemic fragility is the sensitivity of
one institution to the defaults of the other institutions (the direction is ‘system-
to-firm’). We run 21 stress-test scenarios where one institution is assumed to be
initially in default. For each scenario, we analyse the loss of all other institutions.
We measure systemic importance of one institution as the number of institutions
who lose more than 10% of their equity. Symmetrically, we measure systemic
fragility of one specific institution as the number of institutions which default
generates a loss higher than 10% of the specific institution’s equity. The
threshold of 10% is arbitrary. Note that using another threshold (5% for
instance) would change the systemic importance score and the systemic fragility
score of all institutions. Therefore, we do not interpret the exact figures but the
overall relative scores of institutions.
Figure A1.3 provides the systemic fragility and importance for the French
financial institutions. Three groups are visually identified: financial institutions
that are only systemically fragile, financial institutions that are only systemically
important, and financial institutions that are neither systematically fragile nor
systemically important. Generally speaking, important institutions are
conglomerates, which are also the largest institution in the system. Most
insurers fall in the group ‘neither’. Since there is no institution jointly
systematically fragile and systemically important, we deduce that a long chain of
contagion – the so-called ‘domino effect’ – is unlikely. Policy implication could be
to provide incentives to fragile institutions to diversify further their exposures to
rely less on systemically important institutions.
Measuring contagion risk through stress-test exercises is often more costly in
terms of operational resources than using measurement of interconnectedness
based on statistical tools (such as descriptive statistics or the closeness analysis
previously presented). Therefore, it is tempting to assess the correlation
between the results of the various methods in order to predict the results of
contagion risk. Such a strategy needs a clear assessment of the ‘predictive
power’ of the statistical measures.

Financial Stability Report | December 2014 54
To do so, we compare our results based on descriptive and statistical methods
for the three groups identified according to systemic importance and systemic
fragility. Statistical theory helps us to formalize the match between groups. We
find that systemic importance can be linked to statistical measures of
interconnectedness. However, we fail to uncover any clear association between
these statistical measures and systemic fragility. Consequently, running
contagion models on a regular basis is a paramount tool to assess contagion risk
and measure interconnectedness from a supervisory perspective. Results should
be read with respect to the limits of the underlying contagion model.
7. Policy perspective
We presented several strategies to measure interconnectedness. We do not
think that there is only one way to measure interconnectedness.
Interconnectedness is in all likelihood a multi-faceted concept that requires
therefore several measures to be accounted for. Ultimately, the choice of
measure is to be driven by the accurate objectives of the policy makers: the
right tool for the job.

Financial Stability Report | December 2014 55
Figure A1.3: systemic importance and systemic fragility of French financial institutions
Note: Systemic fragility and systemic importance are defined using a threshold equal to
10% of equity.
First at all, we recommend picking interconnectedness measures with parsimony
to avoid unnecessary complexity. Provided a volume exposure matrix, we
recommend deriving a credit risk matrix and a funding risk matrix. The
descriptive risk statistics are very informative to have the broad picture of the
interconnection in a risk analysis perspective.
Comparing pair-wise institutions along substitutability and integration is useful
to assess similarities between institutions or to detect outliers. However, this
strategy does not provide individual scores of interconnectedness.
Identifying core-periphery structure is to be handled with care. Our results
suggest that this method is mainly driven by a size effect. A formal identification
of the core of a network helps see where volumes dwell but does not necessarily
pinpoint riskiness. Moreover, note that the results are binary ratings of
interconnectedness – either in the core or in the periphery – and give no score of
interconnectedness.

Financial Stability Report | December 2014 56
Contagion models provide two clear measures of interconnectedness: systemic
importance representing the contagion risk generated by the institution and
systemic fragility catching the exposure to contagion risk. These last measures
provide scores and robustness can easily be carried out. Nevertheless, these
measures depends on the model used, in particular the contagion channels that
are included. Therefore, score should be read keeping in mind the limits of the
underlying model.
The general characteristics of each strategy are summarized in Table A1.5.
Table A1.5: Summary of the potential strategy
Strategy
In
terco
nn
ecte
dn
es
s d
esig
n
In
terco
nn
ecte
dn
es
s m
easu
re
Im
ple
men
tati
on
Id
en
tifi
ed
po
ten
tial
bia
s
Po
licy C
on
cern
Descriptive
risk statistics
continuous
individual quantitative easy
usual
monitoring
Integration &
substitutability
continuous
pair-wise none easy
cross-market
comparison
Core-Periphery
identification
binary
system-
wide
qualitative complex size effect SIFIs
identification
Systemic
importance
and fragility
continuous
system-
wide
quantitative complex model
dependence
SIFIs
identification
8. Concluding remarks
Taking into account interconnectedness of financial institutions is mandatory to
supervisory authorities to prevent contagion risks. If the general objective is
clear, there is no consensus on the best way to measure interconnectedness.
Using a unique dataset of bilateral exposures between 21 French financial
institutions –6 financial conglomerates, 4 pure banks and 11 pure insurers– we
describe and analyse several strategies to measure interconnectedness. Without
promoting one strategy as a panacea to measure interconnectedness, we
provide insights on the pros and cons of each measure.

Financial Stability Report | December 2014 57
References
Anand, K., Craig, B., and von Peter, G. (2014): Fill in in the blanks: Network
structure and interbank contagion, Bank of Canada Working Paper, No 2014-26.
Alves, I., Ferrari, S., Franchini, P., Héam, J.C., Jurca, P., Langfield, S., Liedorp,
F., Sanchez, A., Tavolaro, S., and Vuillemey, G. (2013): The Structure and Resilience of the European Interbank Market, European Systemic Risk Board
(ESRB) Occasional Paper, No. 3.
Basel Committee on Banking Supervision (BCBS) (2011): Global systemically
important banks: assessment methodology and the additional loss absorbency requirement Rules text November 2011.
Craig, B., and von Peter, G. (2014): Interbank Tiering and Money Center Banks,
Journal of Financial Intermediation, 23, 3, 322-347.
Financial Stability Board (FSB) (2009): Guidance to Assess the Systemic
Importance of Financial Institutions, Markets and Instruments: Initial Considerations, October 2009.
Gouriéroux, C., Héam, J.C., and Monfort, A. (2012): Bilateral Exposures and
Systemic Solvency Risk, Canadian Journal of Economics, 45, 1273-1309.
Hauton, G., and Héam, J.C. (2014): How to Measure Interconnectedness
between Banks, Insurers and Financial Conglomerates?, forthcoming in ACPR Working Paper.
International Association of Insurance Supervisors (IAIS) (2013): Global
Systematically Important Insurers: Initial Assessment Methodology, July 2013.