Embed Size (px)
Citation preview
IB Math Studies Internal Assessment:
Correlation between production cost of movies and sale revenue
SESSION DATE
FULL SCHOOL NAME
TEACHER NAME
IB Math Studies
Word Count: 1,570 (excluding equations)
FULL NAME
1
Table of Contents:
Introduction Page 3
Statement Task Page 4
Plan of Investigation Page 4
Raw Data Page 5-11
Data Analysis Page 12-16
I. Mean of x and y II. Scatter Plots
III. Pearson’s Correlation Coefficient
Limitations Page 17
Validity/Conclusion Page 17
Appendices Page 18-21
Bibliography Page 22
2
Introduction:
Correlation between production cost of movies and sale revenue
Movies are produced globally, and enjoyed by many. In this investigation I will undertake research to determine whether the production cost of movies correlates to their worldwide gross. The cost of movies is the x value, and the worldwide gross is the y value. Research indicates that movies that allocate more money in movie production do not necessarily generate greater worldwide gross. Through in this project I will analyze on how dependent or independent production worldwide gross are to their production costs. 150 movies will be analyzed to make a concrete conclusion.
Some of the factors that have an affect on the worldwide gross are the date of release of a movie, where movie is made, amount of publicity, etc. The top 150 movies are ranked by the amount invested in the production cost of making the film. The main reason that I have chosen to undertake this research is because of my passion for movies, and the movie industry in general. I find the research interesting for the above-mentioned reasons but also because it is not a well researched topic.
This data will be obtained from external research, from online website such as: http://www.the-numbers.com1. From the website I will be looking at the top 150 movies with their production cost and sale revenues. This website includes where information was taken from, and also has copyright notices to show the first publication of work and when the website was last updated.
Mathematical measures and models such as Interquartile range, mean, standard deviation, Pearson’s correlation coefficient (r-value) will be used to draw a conclusion with my findings to the answers of my investigation. The mean shows us the average of a particular set of data. The r-value will be used to determine the strength of the correlation between the two variables, and if this value is high then line of regression will be made.
One would assume that the greater the production cost, then the greater the worldwide gross
1 http://www.the-numbers.com/movie/budgets/all
3
Statement of Task:
In this project my aim and main purpose is to investigate the correlation of the cost of movies in relation to their worldwide gross. This data will be collected through the website of http://www.the-numbers.com , as there was not alternative website. Through this project I will analyze on how dependent or independent production costs of movies are to worldwide gross. 150 movies will be analyzed to make a concrete conclusion.
Plan of Investigation:In this internal assessment I am investigating the relationship cost of movies in
relation to their worldwide gross. I have collected my data through an online source. With my collection of data, I will use mathematical measures and models such as scatter plot , Interquartile range, mean, standard deviation, Pearson’s correlation coefficient (r-value), will be used to draw a conclusion with my findings to the answers of my investigation. If needed I will be doing a X2 test on the data collected in order to show independent or dependent the cost of movies in relation to their worldwide gross.
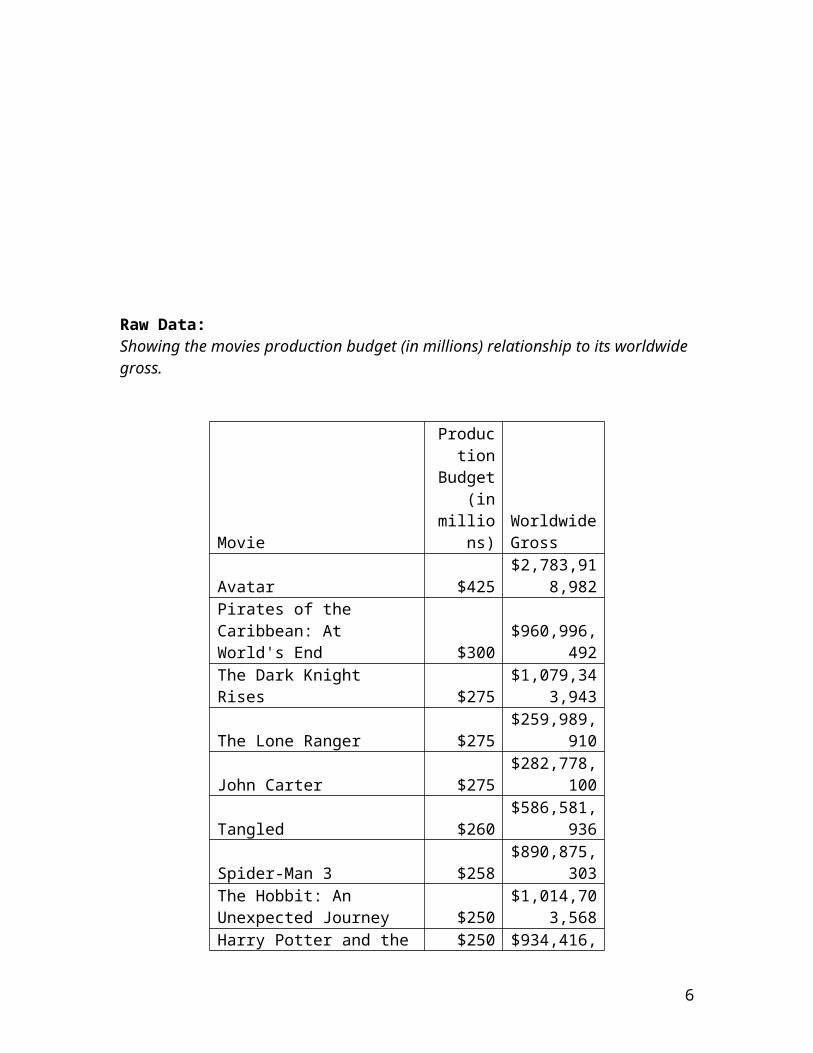
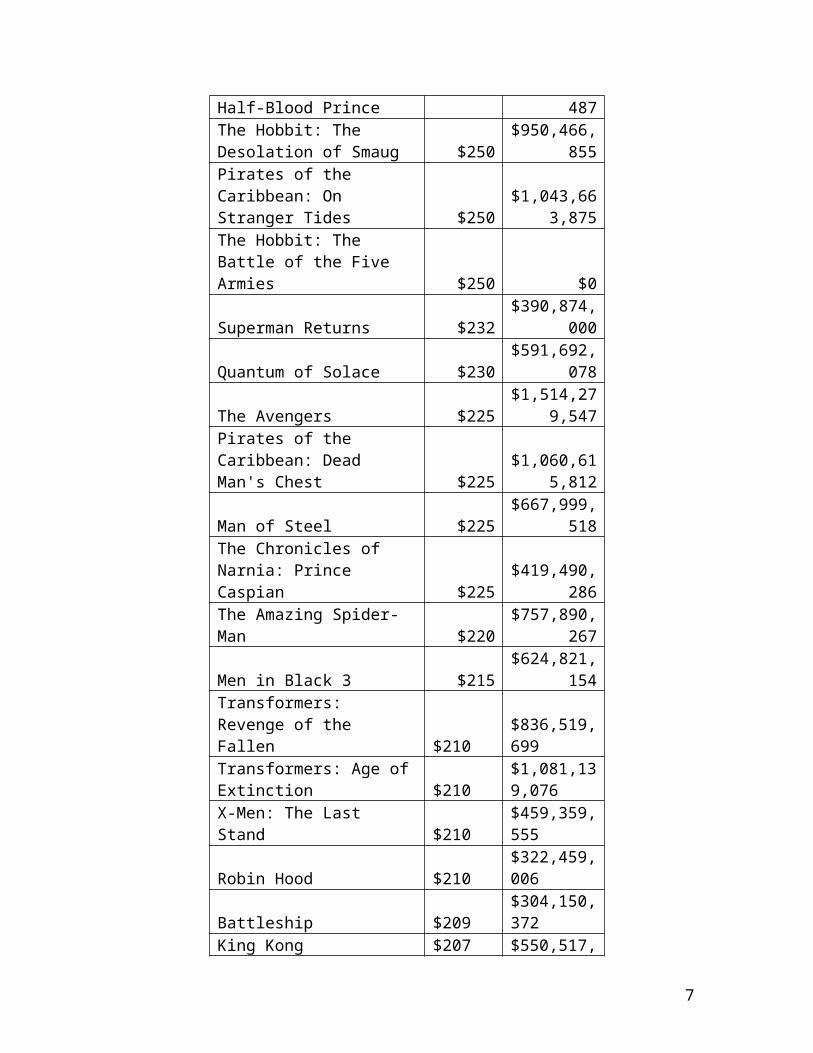
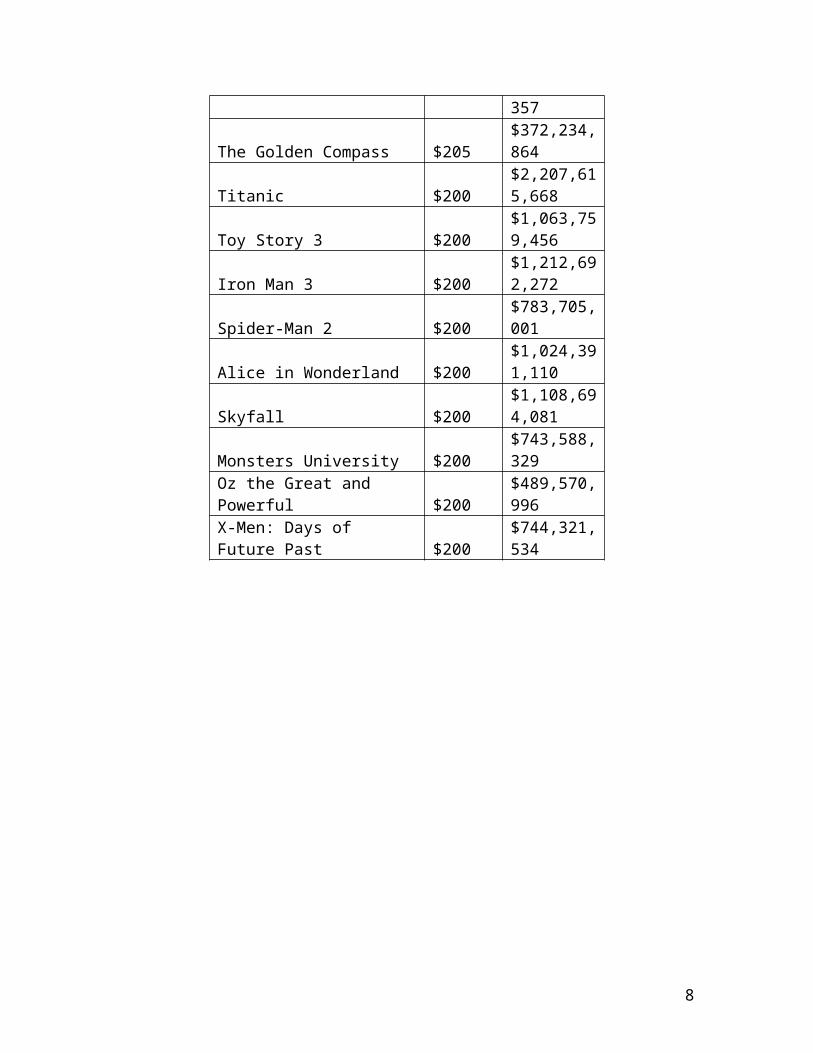
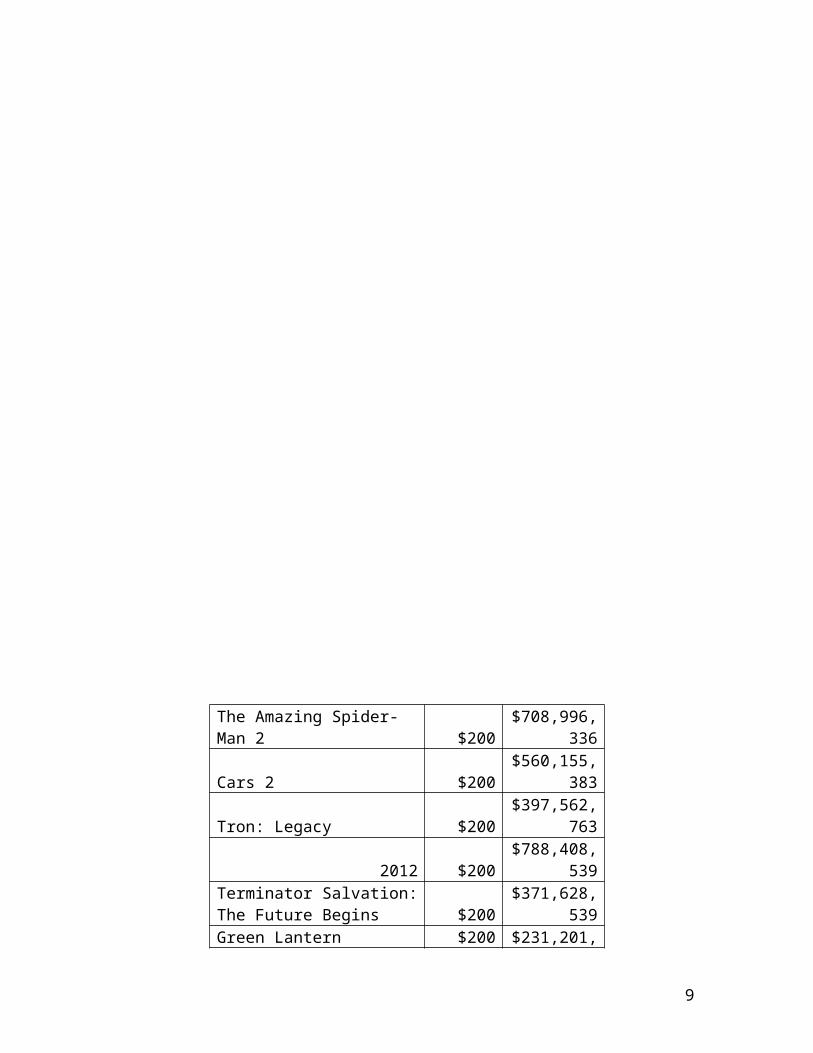
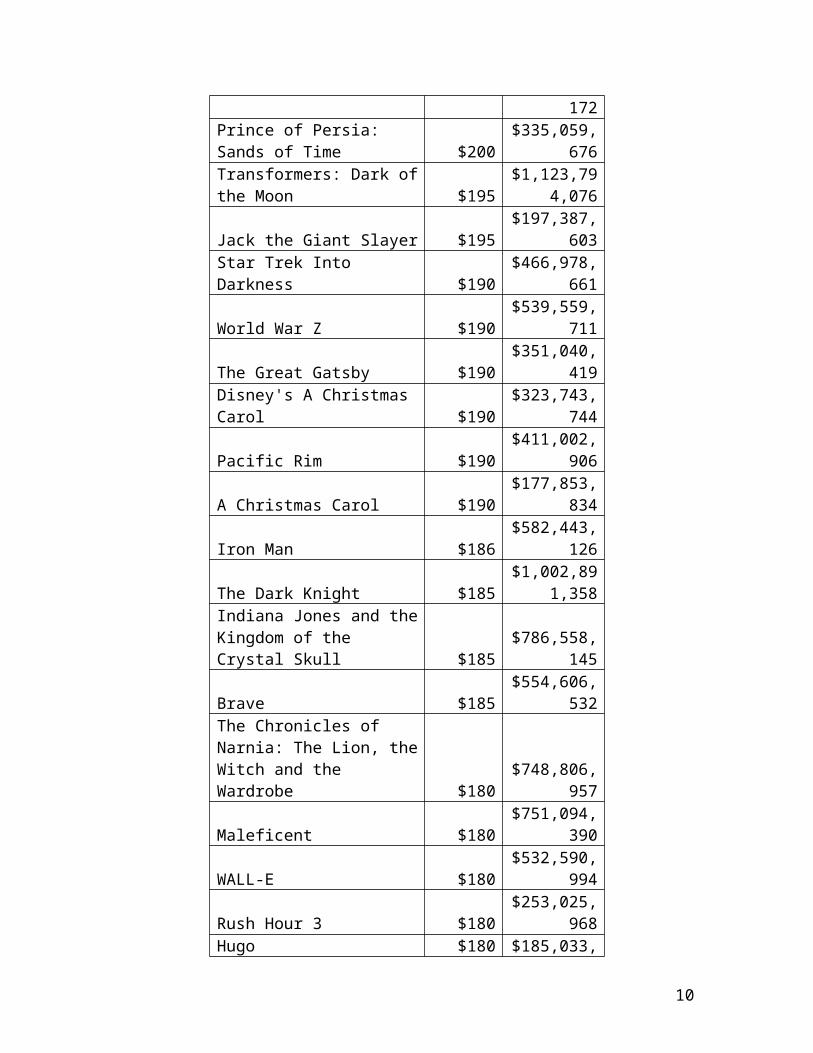
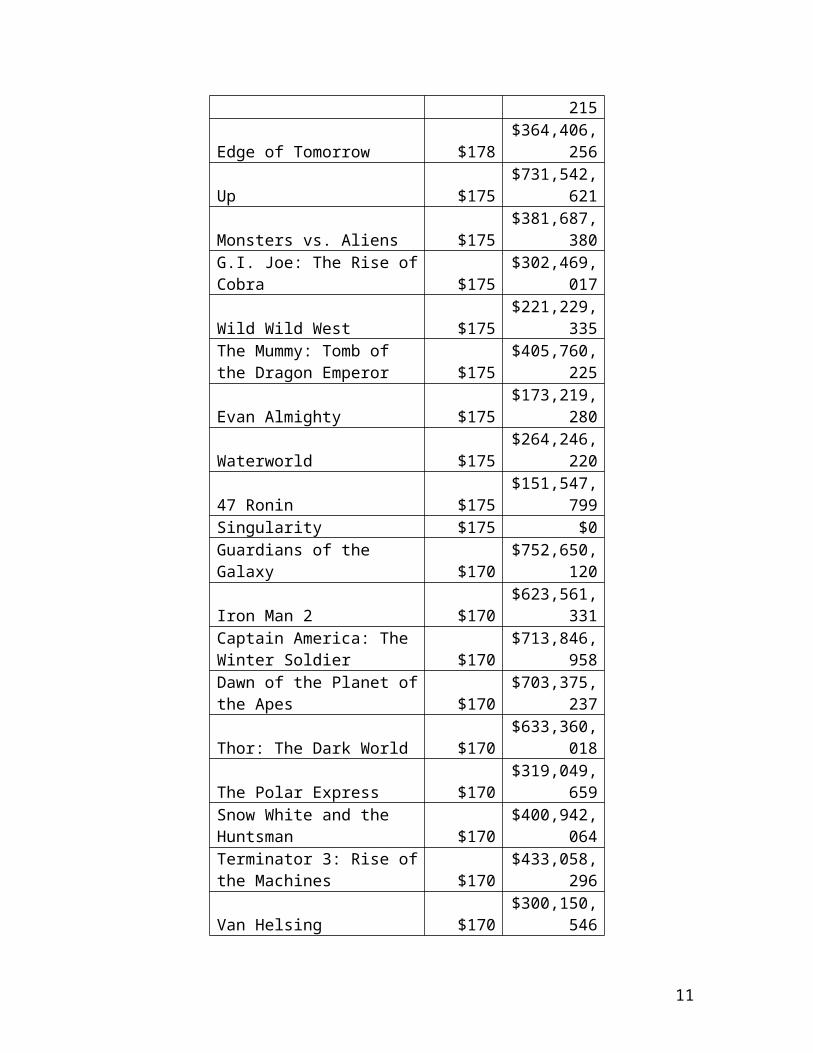
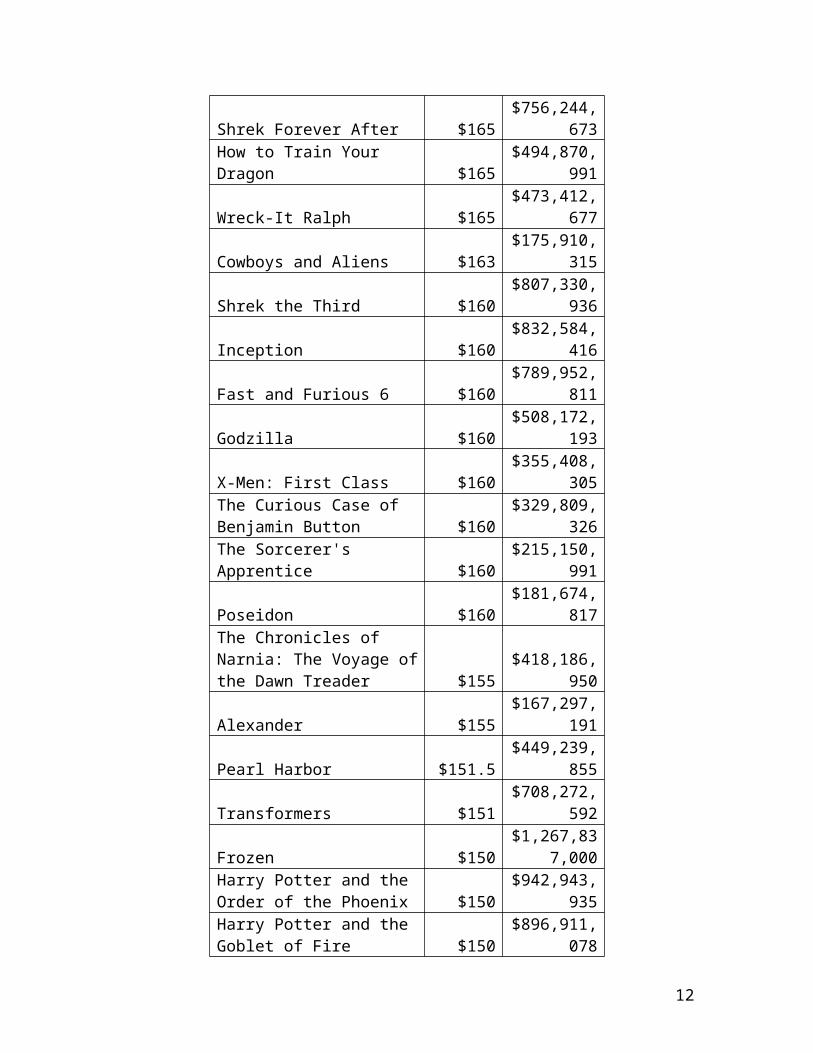
Raw Data:
4
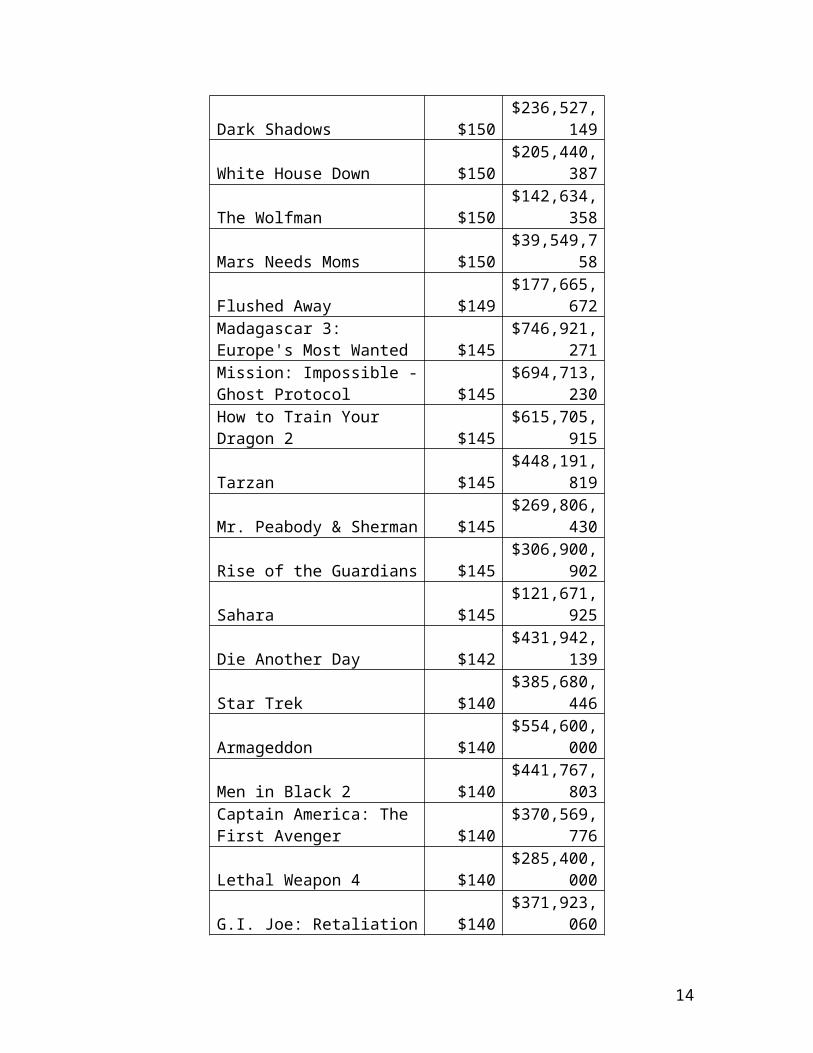
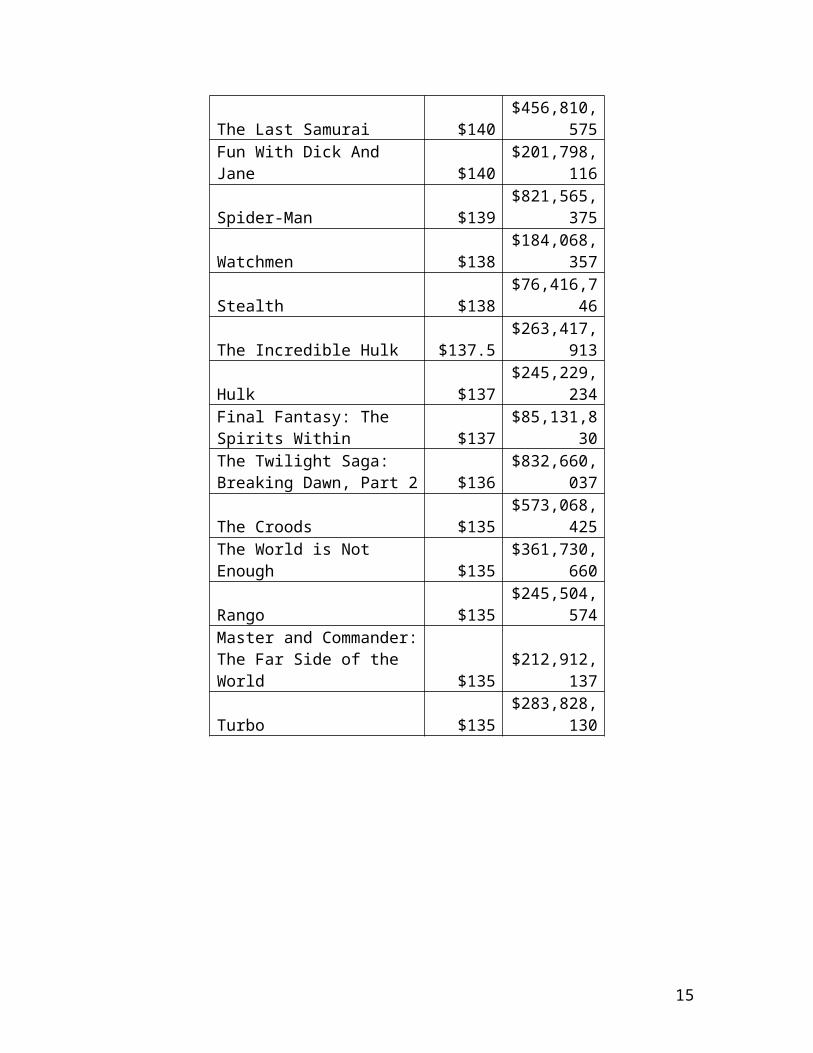
Showing the movies production budget (in millions) relationship to its worldwide gross.
Movie
Production Budget
(in millions)
Worldwide Gross
Avatar $425$2,783,918,9
82Pirates of the Caribbean: At World's End $300
$960,996,492
The Dark Knight Rises $275$1,079,343,9
43
The Lone Ranger $275$259,989,91
0
John Carter $275$282,778,10
0
Tangled $260$586,581,93
6
Spider-Man 3 $258$890,875,30
3The Hobbit: An Unexpected Journey $250
$1,014,703,568
Harry Potter and the Half-Blood Prince $250
$934,416,487
The Hobbit: The Desolation of Smaug $250
$950,466,855
Pirates of the Caribbean: On Stranger Tides $250
$1,043,663,875
The Hobbit: The Battle of the Five Armies $250 $0
Superman Returns $232$390,874,00
0
Quantum of Solace $230$591,692,07
8
The Avengers $225$1,514,279,5
47Pirates of the Caribbean: Dead Man's Chest $225
$1,060,615,812
Man of Steel $225$667,999,51
8The Chronicles of Narnia: Prince Caspian $225
$419,490,286
The Amazing Spider-Man $220$757,890,26
7Men in Black 3 $215 $624,821,15
5
4Transformers: Revenge of the Fallen $210
$836,519,699
Transformers: Age of Extinction $210
$1,081,139,076
X-Men: The Last Stand $210$459,359,555
Robin Hood $210$322,459,006
Battleship $209$304,150,372
King Kong $207$550,517,357
The Golden Compass $205$372,234,864
Titanic $200$2,207,615,668
Toy Story 3 $200$1,063,759,456
Iron Man 3 $200$1,212,692,272
Spider-Man 2 $200$783,705,001
Alice in Wonderland $200$1,024,391,110
Skyfall $200$1,108,694,081
Monsters University $200$743,588,329
Oz the Great and Powerful $200$489,570,996
X-Men: Days of Future Past $200$744,321,534
6
The Amazing Spider-Man 2 $200$708,996,33
6
Cars 2 $200$560,155,38
3
Tron: Legacy $200$397,562,76
3
2012 $200$788,408,53
9Terminator Salvation: The Future Begins $200
$371,628,539
Green Lantern $200$231,201,17
2Prince of Persia: Sands of $200 $335,059,67
7
Time 6Transformers: Dark of the Moon $195
$1,123,794,076
Jack the Giant Slayer $195$197,387,60
3
Star Trek Into Darkness $190$466,978,66
1
World War Z $190$539,559,71
1
The Great Gatsby $190$351,040,41
9
Disney's A Christmas Carol $190$323,743,74
4
Pacific Rim $190$411,002,90
6
A Christmas Carol $190$177,853,83
4
Iron Man $186$582,443,12
6
The Dark Knight $185$1,002,891,3
58Indiana Jones and the Kingdom of the Crystal Skull $185
$786,558,145
Brave $185$554,606,53
2The Chronicles of Narnia: The Lion, the Witch and the Wardrobe $180
$748,806,957
Maleficent $180$751,094,39
0
WALL-E $180$532,590,99
4
Rush Hour 3 $180$253,025,96
8
Hugo $180$185,033,21
5
Edge of Tomorrow $178$364,406,25
6
Up $175$731,542,62
1
Monsters vs. Aliens $175$381,687,38
0
G.I. Joe: The Rise of Cobra $175$302,469,01
7
Wild Wild West $175$221,229,33
5
8
The Mummy: Tomb of the Dragon Emperor $175
$405,760,225
Evan Almighty $175$173,219,28
0
Waterworld $175$264,246,22
0
47 Ronin $175$151,547,79
9Singularity $175 $0
Guardians of the Galaxy $170$752,650,12
0
Iron Man 2 $170$623,561,33
1Captain America: The Winter Soldier $170
$713,846,958
Dawn of the Planet of the Apes $170$703,375,23
7
Thor: The Dark World $170$633,360,01
8
The Polar Express $170$319,049,65
9
Snow White and the Huntsman $170$400,942,06
4Terminator 3: Rise of the Machines $170
$433,058,296
Van Helsing $170$300,150,54
6
Shrek Forever After $165$756,244,67
3
How to Train Your Dragon $165$494,870,99
1
Wreck-It Ralph $165$473,412,67
7
Cowboys and Aliens $163$175,910,31
5
Shrek the Third $160$807,330,93
6
Inception $160$832,584,41
6
Fast and Furious 6 $160$789,952,81
1
Godzilla $160$508,172,19
3
X-Men: First Class $160$355,408,30
5The Curious Case of Benjamin $160 $329,809,32
9
Button 6
The Sorcerer's Apprentice $160$215,150,99
1
Poseidon $160$181,674,81
7The Chronicles of Narnia: The Voyage of the Dawn Treader $155
$418,186,950
Alexander $155$167,297,19
1
Pearl Harbor $151.5$449,239,85
5
Transformers $151$708,272,59
2
Frozen $150$1,267,837,0
00Harry Potter and the Order of the Phoenix $150
$942,943,935
Harry Potter and the Goblet of Fire $150
$896,911,078
I am Legend $150$585,410,05
2
Hancock $150$624,346,27
4Charlie and the Chocolate Factory $150
$474,459,076
Ratatouille $150$626,549,69
5
Batman Begins $150$373,298,77
4
Thor $150$449,326,61
8
Madagascar: Escape 2 Africa $150$599,516,84
4
X-Men Origins: Wolverine $150$374,825,76
0Night at the Museum: Battle of the Smithsonian $150
$413,054,631
Kung Fu Panda 2 $150$664,837,54
7
Mission: Impossible III $150$397,501,34
8
Angels & Demons $150$490,875,84
6
Troy $150$484,161,26
5The Last Airbender $150 $319,713,88
10
1
Bee Movie $150$287,594,57
7
G-Force $150$287,389,68
5
Bolt $150$313,953,75
9
Wrath of the Titans $150$301,970,08
3
Beowulf $150$194,995,21
5
Dark Shadows $150$236,527,14
9
White House Down $150$205,440,38
7
The Wolfman $150$142,634,35
8Mars Needs Moms $150 $39,549,758
Flushed Away $149$177,665,67
2Madagascar 3: Europe's Most Wanted $145
$746,921,271
Mission: Impossible - Ghost Protocol $145
$694,713,230
How to Train Your Dragon 2 $145$615,705,91
5
Tarzan $145$448,191,81
9
Mr. Peabody & Sherman $145$269,806,43
0
Rise of the Guardians $145$306,900,90
2
Sahara $145$121,671,92
5
Die Another Day $142$431,942,13
9
Star Trek $140$385,680,44
6
Armageddon $140$554,600,00
0
Men in Black 2 $140$441,767,80
3Captain America: The First Avenger $140
$370,569,776
Lethal Weapon 4 $140$285,400,00
0
11
G.I. Joe: Retaliation $140$371,923,06
0
The Last Samurai $140$456,810,57
5
Fun With Dick And Jane $140$201,798,11
6
Spider-Man $139$821,565,37
5
Watchmen $138$184,068,35
7Stealth $138 $76,416,746
The Incredible Hulk $137.5$263,417,91
3
Hulk $137$245,229,23
4Final Fantasy: The Spirits Within $137 $85,131,830The Twilight Saga: Breaking Dawn, Part 2 $136
$832,660,037
The Croods $135$573,068,42
5
The World is Not Enough $135$361,730,66
0
Rango $135$245,504,57
4Master and Commander: The Far Side of the World $135
$212,912,137
Turbo $135$283,828,13
0
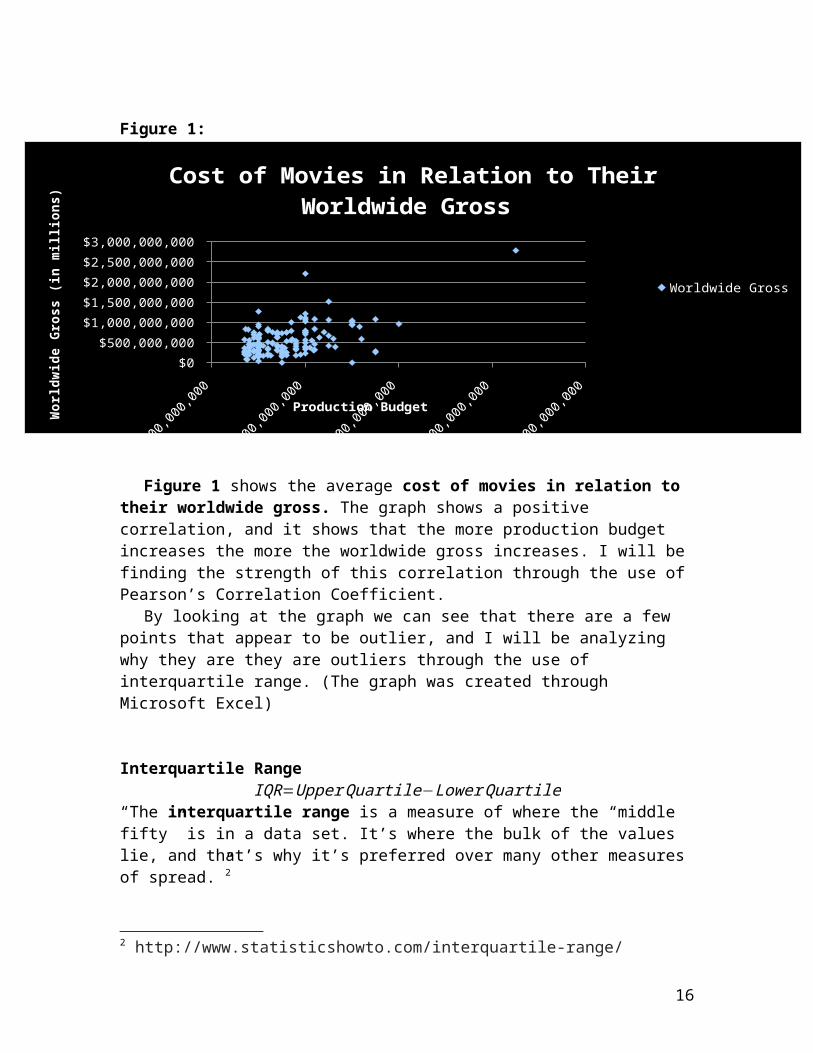
Figure 1:
12
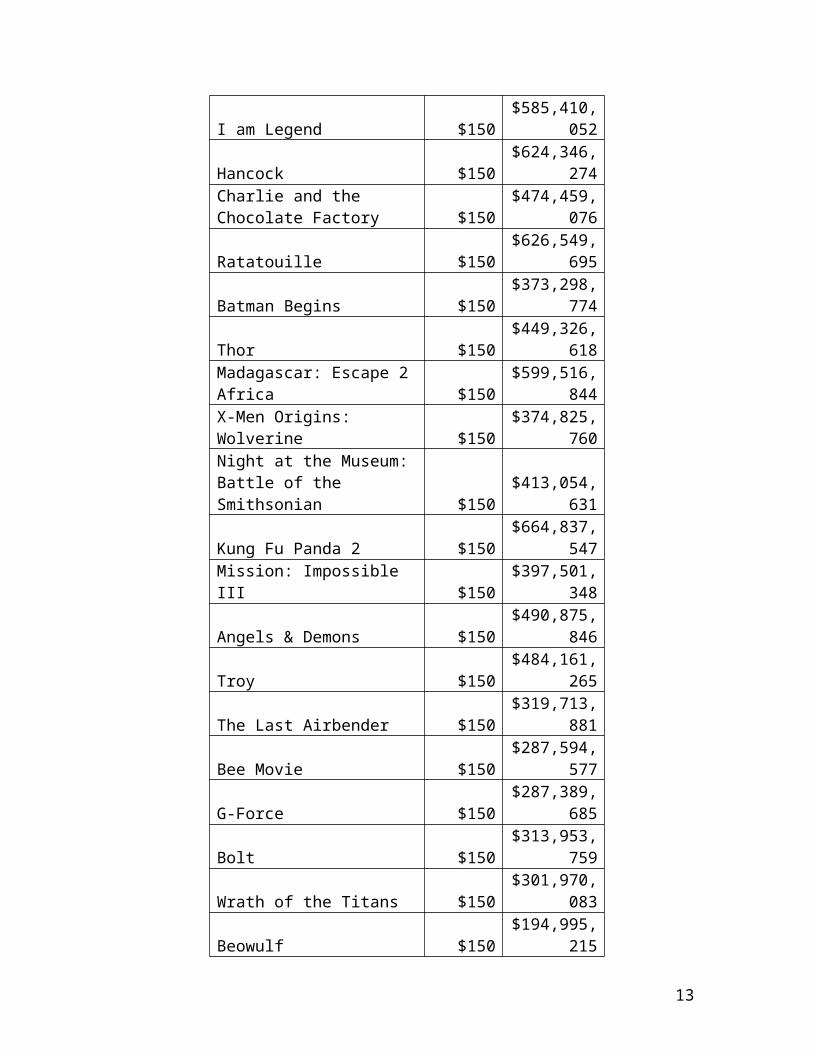
Figure 1 shows the average cost of movies in relation to their worldwide gross. The graph shows a positive correlation, and it shows that the more production budget increases the more the worldwide gross increases. I will be finding the strength of this correlation through the use of Pearson’s Correlation Coefficient.
By looking at the graph we can see that there are a few points that appear to be outlier, and I will be analyzing why they are they are outliers through the use of interquartile range. (The graph was created through Microsoft Excel)
Interquartile RangeIQR=Upper Quartile−Lower Quartile
“The interquartile range is a measure of where the “middle fifty” is in a data set. It’s where the bulk of the values lie, and that’s why it’s preferred over many other measures of spread.”2
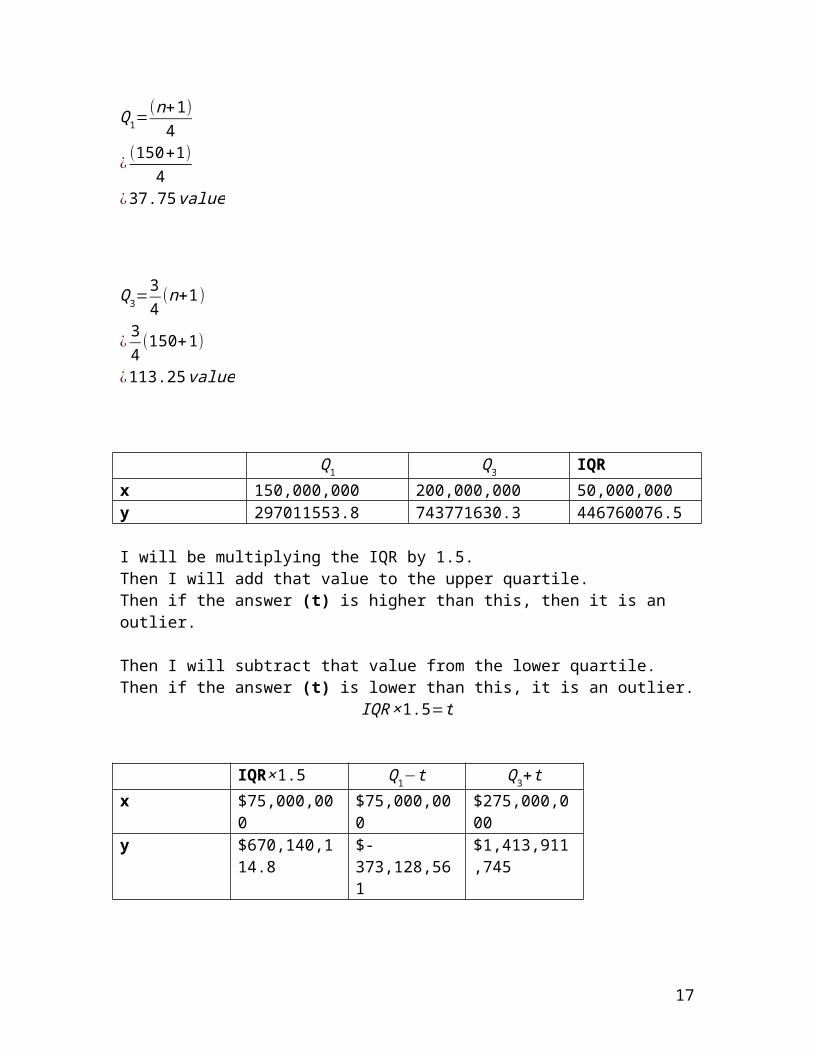
Q1=(n+1)
4
¿ (150+1)4
¿37.75 value
Q3=34
(n+1)
¿ 34(150+1)
2 http://www.statisticshowto.com/interquartile-range/
$100,000,000 $200,000,000 $300,000,000 $400,000,000 $500,000,000 $0
$500,000,000
$1,000,000,000
$1,500,000,000
$2,000,000,000
$2,500,000,000
$3,000,000,000
Cost of Movies in Relation to Their Worldwide Gross
Worldwide Gross
Production Budget
Wor
ldw
ide
Gro
ss (
in m
illi
ons)
13
¿113.25 value
Q1 Q3 IQRx 150,000,000 200,000,000 50,000,000y 297011553.8 743771630.3 446760076.5
I will be multiplying the IQR by 1.5.Then I will add that value to the upper quartile. Then if the answer (t) is higher than this, then it is an outlier.
Then I will subtract that value from the lower quartile.Then if the answer (t) is lower than this, it is an outlier.
IQR ×1.5=t
IQR×1.5 Q1−t Q3+tx $75,000,000 $75,000,000 $275,000,000y $670,140,114.8 $-373,128,561 $1,413,911,745
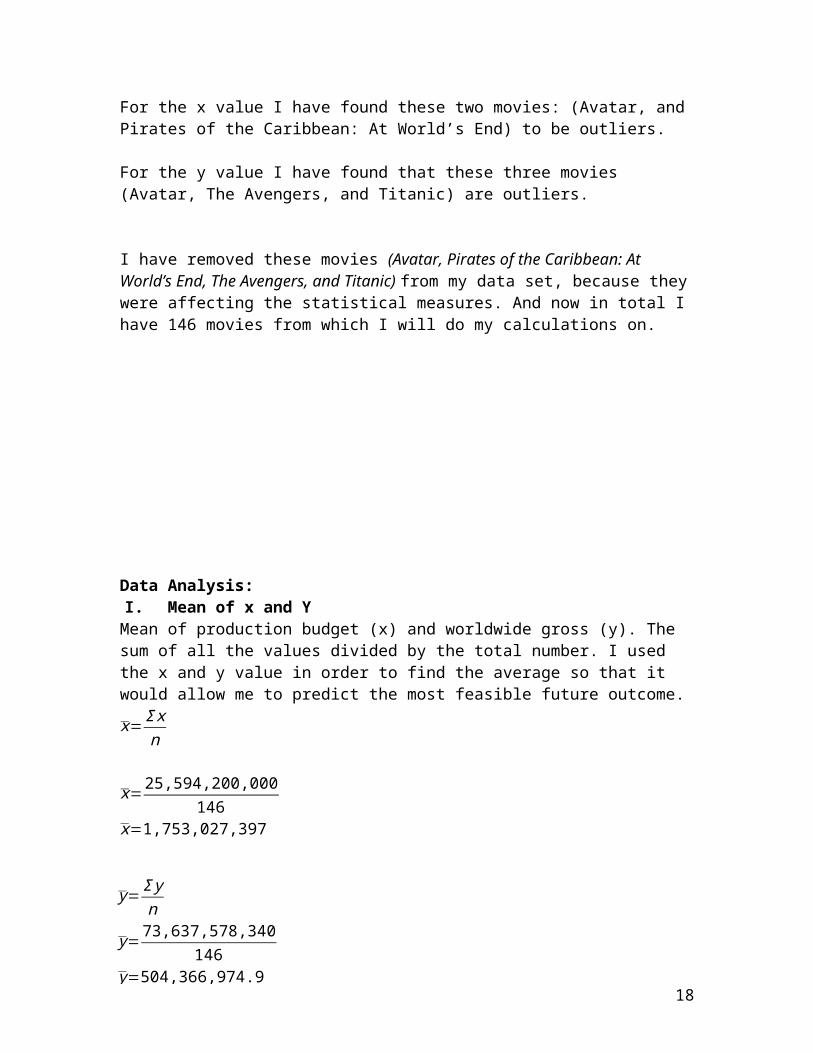
For the x value I have found these two movies: (Avatar, and Pirates of the Caribbean: At World’s End) to be outliers.
For the y value I have found that these three movies (Avatar, The Avengers, and Titanic) are outliers.
I have removed these movies (Avatar, Pirates of the Caribbean: At World’s End, The Avengers, and Titanic) from my data set, because they were affecting the statistical measures. And now in total I have 146 movies from which I will do my calculations on.
Data Analysis:I. Mean of x and Y
14
Mean of production budget (x) and worldwide gross (y). The sum of all the values divided by the total number. I used the x and y value in order to find the average so that it would allow me to predict the most feasible future outcome.
x= Σ xn
x=25,594,200,000146
x=1,753,027,397
The mean of the cost of producing a movie x was greater than the mean of the worldwide gross y. Thus showing that the correlation of the mean of production budget producing a movie x was greater than the mean of the worldwide gross y.
I. Pearson’s Correlation Coefficient
y= Σ yn
y=73,637,578,340146
y=504,366,974.9
15
Pearson’s Correlation Coefficient is “used to find a numerical value that can be used to determine the strength of linear correlation between the two sets of data.”3
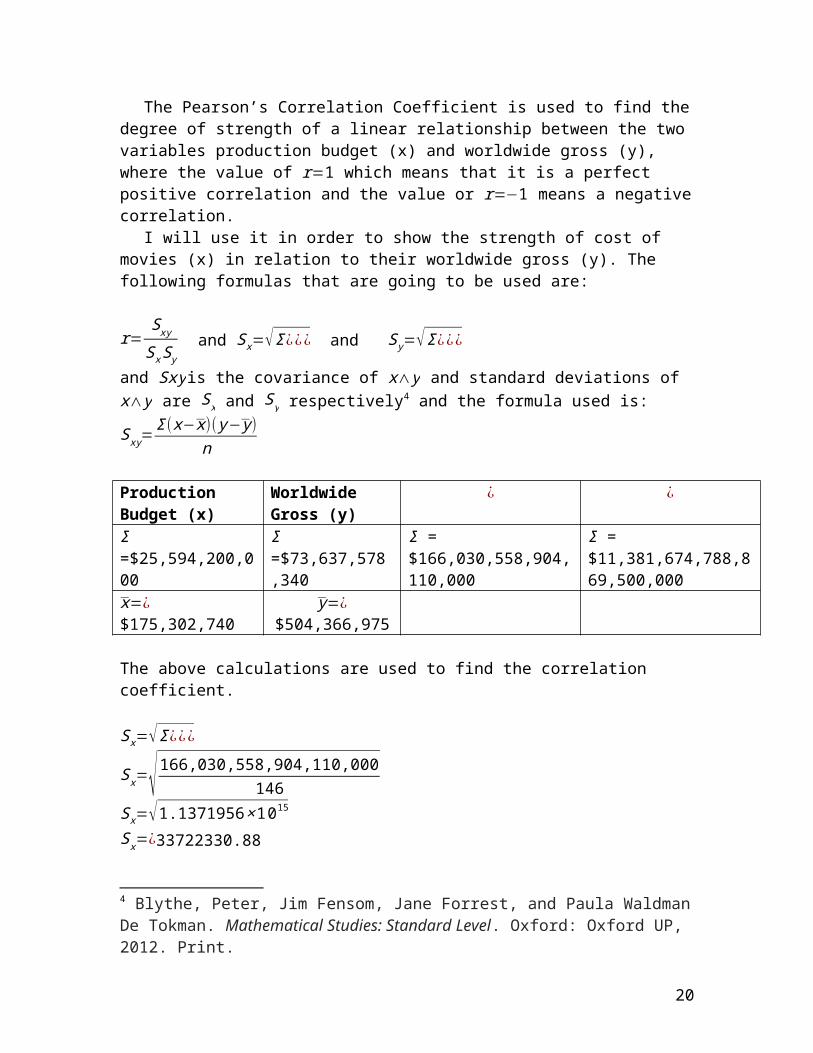
The Pearson’s Correlation Coefficient is used to find the degree of strength of a linear relationship between the two variables production budget (x) and worldwide gross (y), where the value of r=1 which means that it is a perfect positive correlation and the value or r=−1 means a negative correlation.
I will use it in order to show the strength of cost of movies (x) in relation to their worldwide gross (y). The following formulas that are going to be used are:
r=Sxy
Sx S y and Sx=√Σ ¿¿¿ and Sy=√Σ ¿¿¿
and Sxyis the covariance of x∧ y and standard deviations of x∧ y are Sx and Sy
respectively4 and the formula used is: Sxy=Σ(x−x)( y− y )
n
Production Budget (x)
Worldwide Gross (y)
¿ ¿
Σ =$25,594,200,000 Σ =$73,637,578,340
Σ = $166,030,558,904,110,000
Σ = $11,381,674,788,869,500,000
x=¿$175,302,740 y=¿$504,366,975
The above calculations are used to find the correlation coefficient.
Sx=√Σ ¿¿¿
Sx=√ 166,030,558,904,110,000146
Sx=√1.1371956× 10¹⁵
Sx=¿33722330.88
Sy=√Σ ¿¿¿
Sy=√ 11,381,674,788,869,500,000146
Sy=√7.7956677 ×1 016
Sy=279207229.5
Sxy=√ Σ(x−x)( y− y)n
3 Blythe, Peter, Jim Fensom, Jane Forrest, and Paula Waldman De Tokman. Mathematical Studies: Standard Level. Oxford: Oxford UP, 2012. Print.4 Blythe, Peter, Jim Fensom, Jane Forrest, and Paula Waldman De Tokman. Mathematical Studies: Standard Level. Oxford: Oxford UP, 2012. Print.
16
¿√ (33722330.88)(279207229.5)146
¿√6.448985327 ×10¹³
¿8030557.469
r=Sxy
Sx S y
¿ 8030557.469(33722330.88)(279207229.5)
¿ 8030557.4699.415518577 ×1015
¿8.5290655 ×10⁻¹⁰
¿0.0000000000085290655
The calculation above of r2 shows the strength of the relationship between the two values, cost of movies (x) in relation to their worldwide gross (y). This shows that the data has a very weak (lies between 0and 0.25) correlation because the r-value is 0.0000000000085290655 ,which lies between −1≤r ≤ 1.5 The regression line was not calculated as the correlation from the findings above indicated that the correlation was very weak. So therefore predictions cannot be made.
LimitationsWhile working on this investigation of the relationship of the Cost of Movies in
relation to their worldwide gross, there were many limitations, which affected the conclusion of my results.
Firstly the top 150 movies may actually not be the reflective of the actual list due to companies not disclosing information, rather keeping it private.5 Blythe, Peter, Jim Fensom, Jane Forrest, and Paula Waldman De Tokman. Mathematical Studies: Standard Level. Oxford: Oxford UP, 2012. Print.
17
One of my limitations was that the data that I collected was from an online website, and even though it seemed reliable, I feel that some of the information that was given on the website was not correct as the numbers seemed unrealistic. Furthermore there was also no alternative website to gather information from.
Another possible limitation is production companies not releasing the correct information about their movies, and just release skewed or estimated costs. In such a case, my conclusion of whether or not the cost of movies is dependent on the worldwide gross would be affected.
Reputable companies may not want to disclose their information regarding the failure of the movie, which could affect the image of the company for future movies.
In certain cases some of the variables taken into the consideration of making a movie cannot be quantified therefore altering the actual results.
International markets such as Bollywood (India) and Nollywood (Nigeria) could rival with movies produced by Hollywood (USA) however they are not taken into consideration in the list.
Lastly other factors that have not been listed above could have affected my conclusion in which I was considering the correlation of cost of movies in relation to their worldwide gross.
Conclusion/Validity
After undertaking thorough research I found that the correlation between the cost of movies (x) and their worldwide gross (y) was very weak.
The r-value was crucial because it limited the project because the correlation was very thus being the reason the regression line and predictions not being made. That is because the calculation of r2 showed that the data had a very weak (lies between 0and 0.25) correlation because the r-value was 0.0000000000085290655 ,which lied between −1≤r ≤ 1.6
The main source of information was from the website http://www.the-numbers.com7. 150 movies were analyzed to make a concrete conclusion. Mathematical measures and models such as mean, scatter plot, r-value. were used to draw this conclusion.
Appendices
Figure 1:*Screenshots from the website http://www.the-numbers.com/movie/budgets/all
6 Blythe, Peter, Jim Fensom, Jane Forrest, and Paula Waldman De Tokman. Mathematical Studies: Standard Level. Oxford: Oxford UP, 2012. Print.7 http://www.the-numbers.com/movie/budgets/all
18
19
20
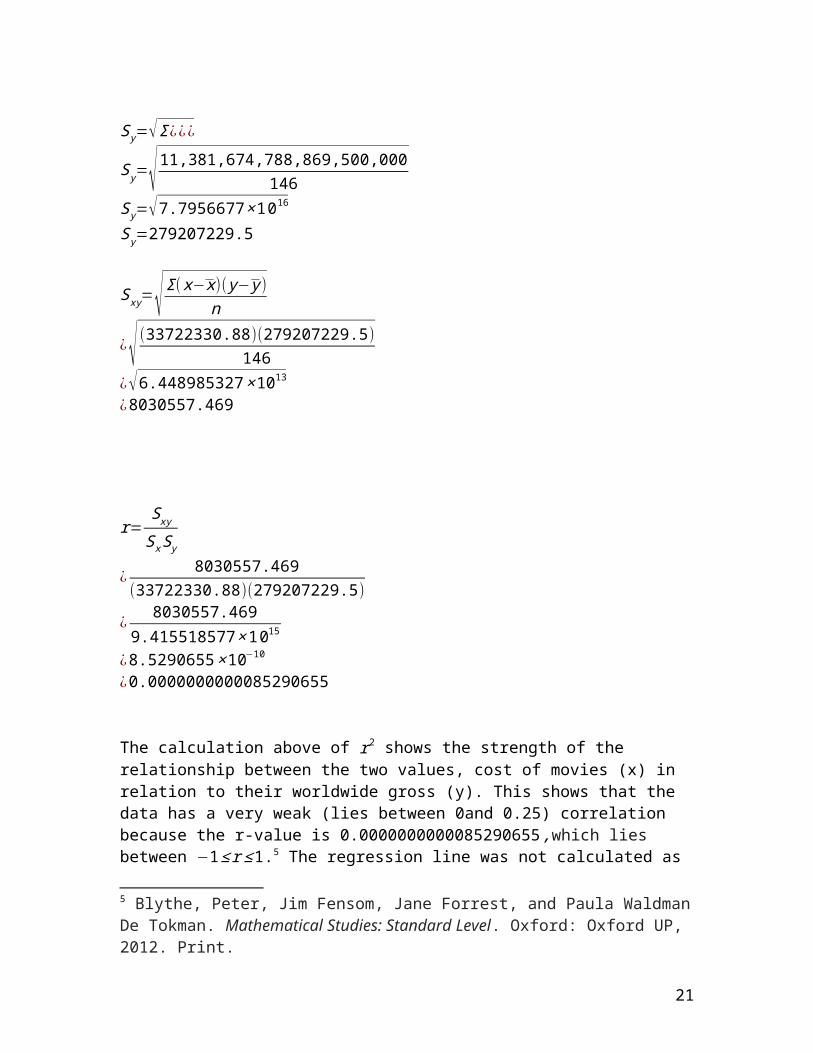
Figure 2:*Screenshot from my excel document
21
22
Bibiliography
Online Sources:
"Weekend Domestic Chart for February 20th, 2015." The Numbers. N.p., n.d. Web. 23 Feb. 2015. <http://www.the-numbers.com/>.
"Interquartile Range in Statistics: What It Is and How to Find It." Statistics How To. N.p., n.d. Web. 28 Feb. 2015. <http://www.statisticshowto.com/interquartile-range/>.
Books:
Blythe, Peter, Jim Fensom, Jane Forrest, and Paula Waldman De Tokman. Mathematical Studies: Standard Level. Oxford: Oxford UP, 2012. Print.
23