Embed Size (px)
Citation preview
How to do the Survey
Photograph © Indigo Pacific
Karakia• Ko Rangi• Ko Papa• Ka Puta ko Rongo• Ko Tanemahuta• Ko Tāwhirimātea• Ko Tangaroa• Ko Haumietiketike• Ko Tumatauenga• Ko te Rangi ki runga• Ko te Papa ki raro• Ka Puta te ira tangata• Ki te whaiao, ki te ao marama• Tīhei mauri ora
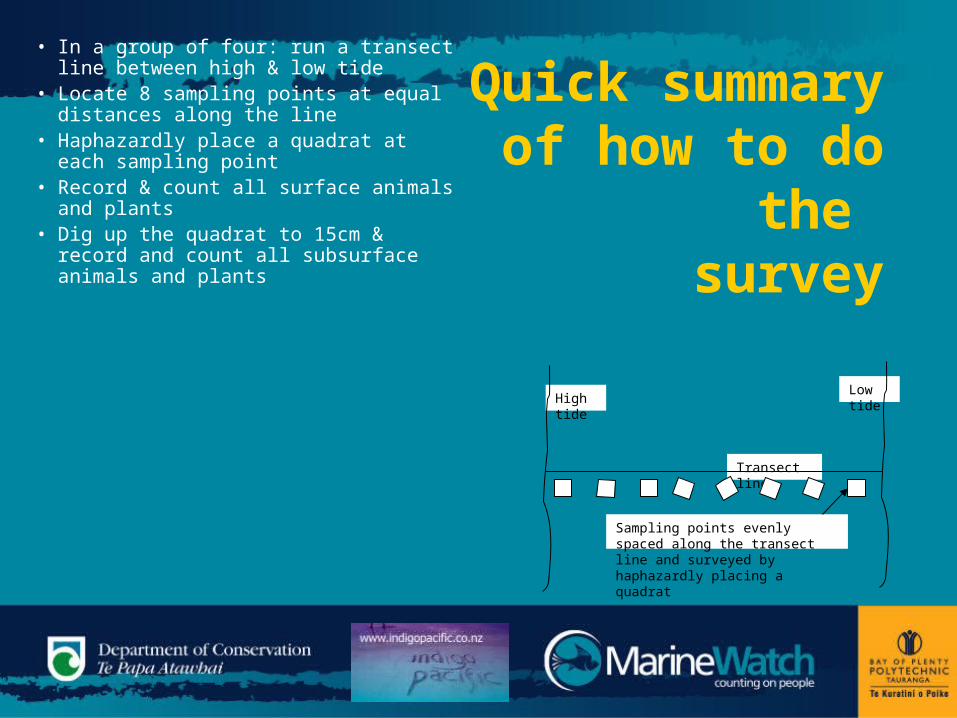
Quick summary of
how to do the
survey
• In a group of four: run a transect line between high & low tide
• Locate 8 sampling points at equal distances along the line
• Haphazardly place a quadrat at each sampling point
• Record & count all surface animals and plants
• Dig up the quadrat to 15cm & record and count all subsurface animals and plants
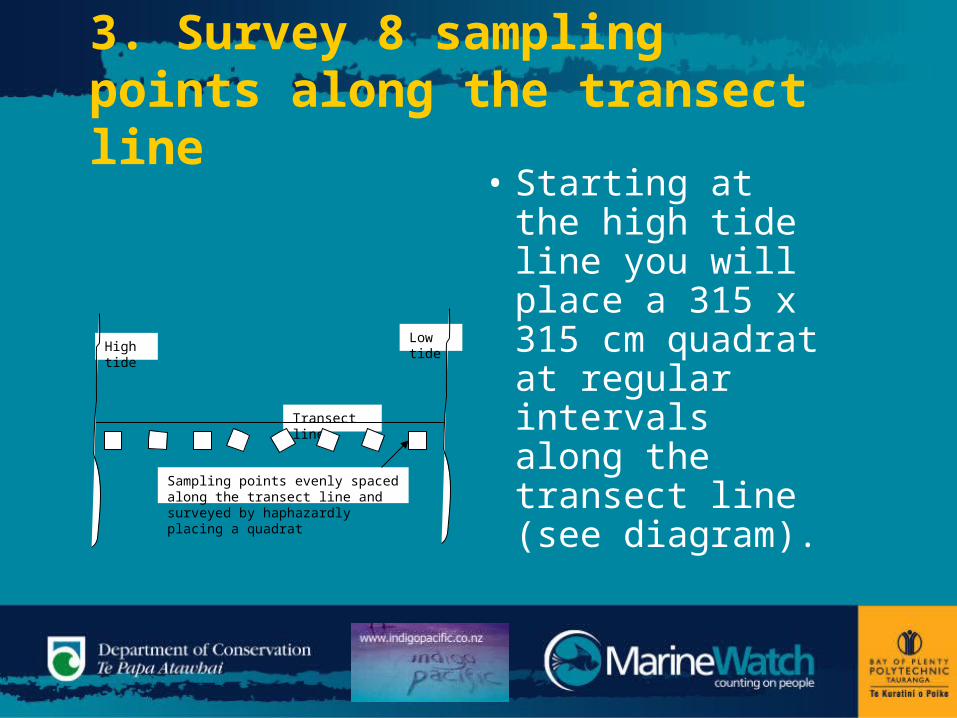
Transect line
Low tide
Sampling points evenly spaced along the transect line and surveyed by haphazardly placing a quadrat
High tide
Step by step guide to doing the survey• The following is a step by step
guide to doing the survey• Read through these slides then
practice laying out the equipment and working out who will do what in a ‘dry’ run of the survey on your playing field or school gymnasium
1. Get into groups
• The first thing you will need to do is get into groups. Give your group a name!
• Each group should have three or four students in it.
• Each group can draw a map of the survey area. Note down on the map any key landmarks and changes in habitat between the high and low tide.
2. Lay transect lines
• Run a transect line between the high and low tide line. (Your teacher will allocate how many groups per transect line)
• We will be surveying marine life along these lines. (The transect line needs to be drawn onto your map.)
3. Survey 8 sampling points along the transect line
• Starting at the high tide line you will place a 315 x 315 cm quadrat at regular intervals along the transect line (see diagram).
Transect line
Low tide
Sampling points evenly spaced along the transect line and surveyed by haphazardly placing a quadrat
High tide
3. Survey 8 sampling points along the transect line
• It is recommended you use 8 sample points equally distanced along the transect line
• If your beach measures 100m between high and low tide how far apart will your sampling points be?
• Quadrats are placed hahazardly within 2m of each sample point.
• Within each quadrat count and record all surface plants and animals on the estuarine plant and animals survey data sheet.
4. Dig out the quadrat
• Once you have completed the surface count for each quadrat, hold onto the quadrat while you dig up the entire quadrat area to a depth of at least 15 cm (approximately blade depth on your spade)
• Sieve this material through a 5mm sieve. • Record and count all animals left in the
sieve and list these on the right hand column of your estuarine plant and animal survey data sheet (see next slide).
MarineWatch data
• Information collected in a scientific survey like this one is known as data.
• Data is recorded using pencil on data sheets that are attached to clipboards. Rubber bands are useful to stop the paper from blowing away.
• Transect and site data are recorded on a sheet like the one on the following slide:
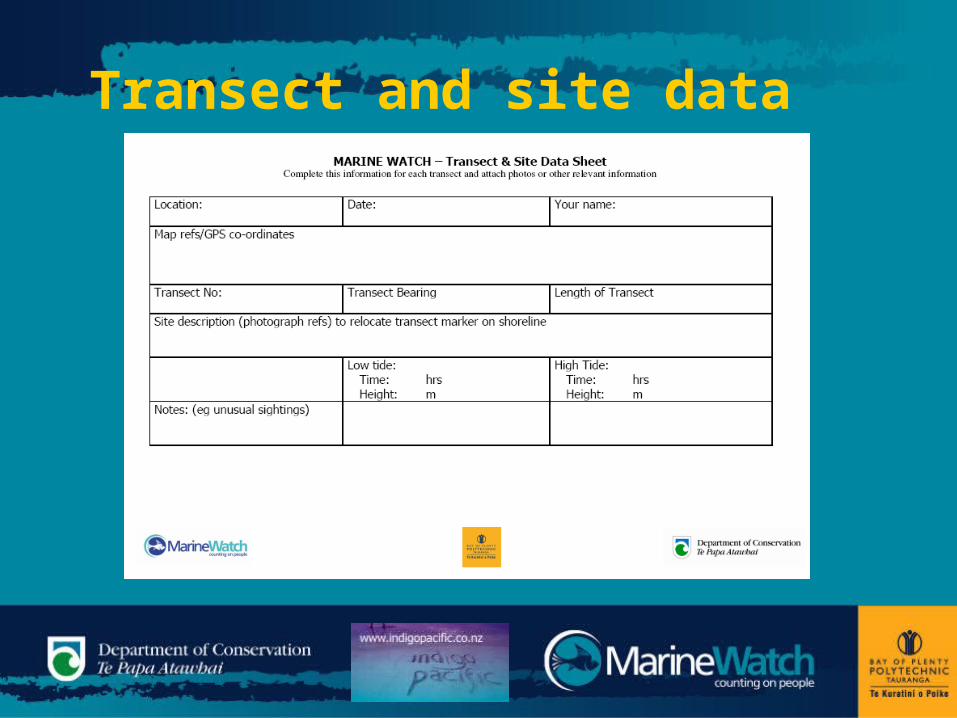
Transect and site data
MarineWatch data
• Information collected during the survey is entered onto a data sheet like the one on the following slide:
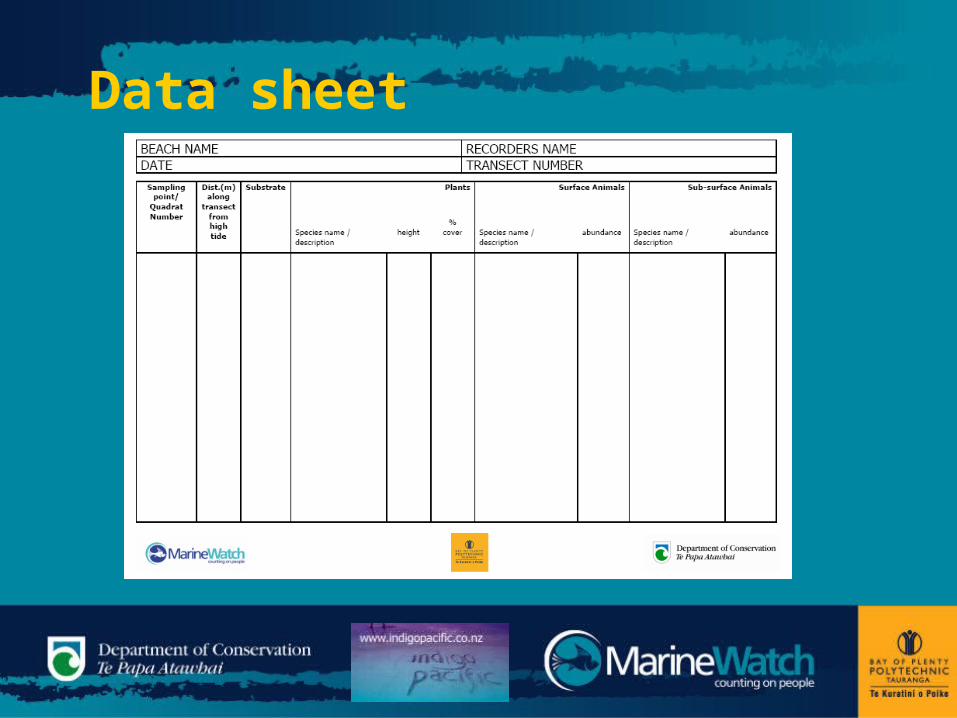
Data sheet
Data
• Data is taken from your slate and entered onto a ’spreadsheet’ or computerised table.
• From this graphs can be made. • Graphs make pictures out of
numbers – data is easier to understand when it’s made into pictures or graphs!
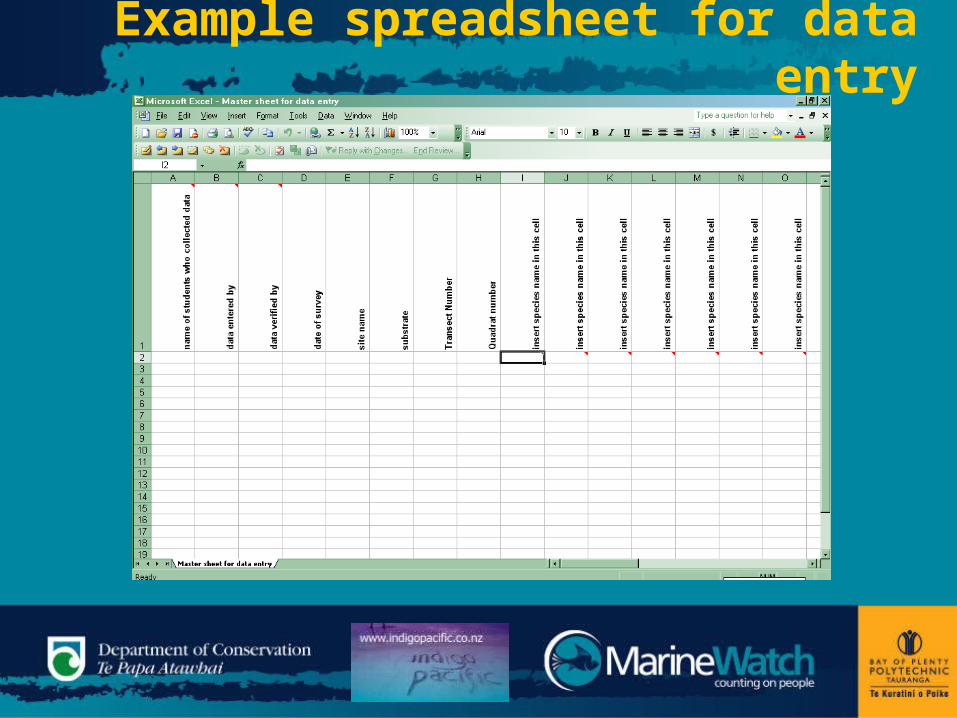
Example spreadsheet for data entry
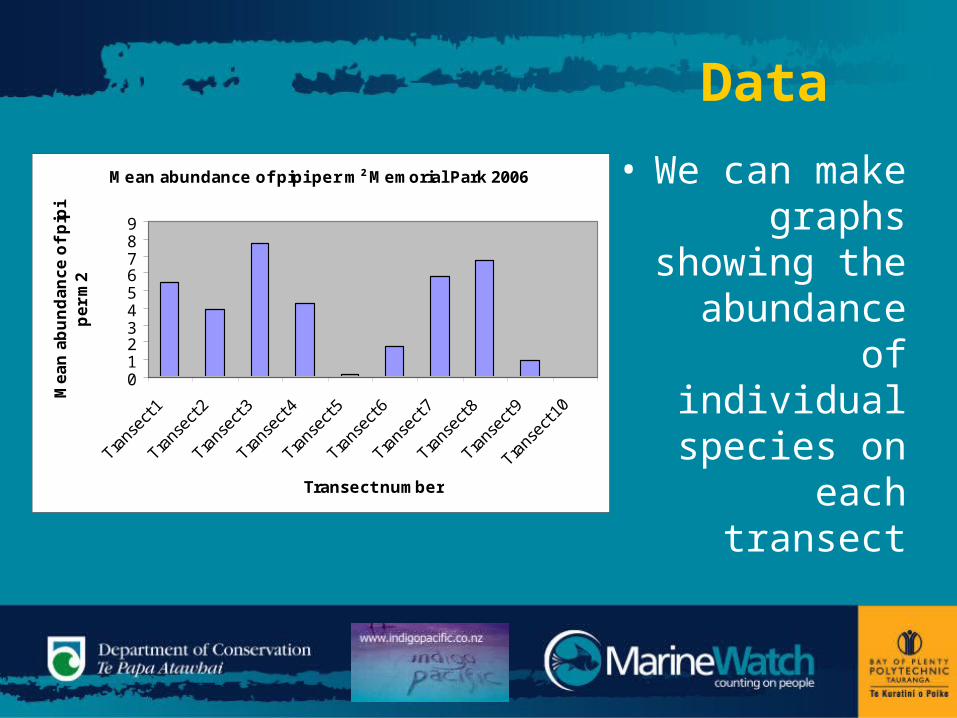
Data
• We can make
graphs showing the abundance
of individual species on
each transect
Mean abundance of pipi per m² Memorial Park 2006
0123456789
Trans
ect 1
Trans
ect 2
Trans
ect 3
Trans
ect 4
Trans
ect 5
Trans
ect 6
Trans
ect 7
Trans
ect 8
Trans
ect 9
Trans
ect 1
0
Transect number
Me
an
ab
un
da
nc
e o
f p
ipi
pe
r m
2
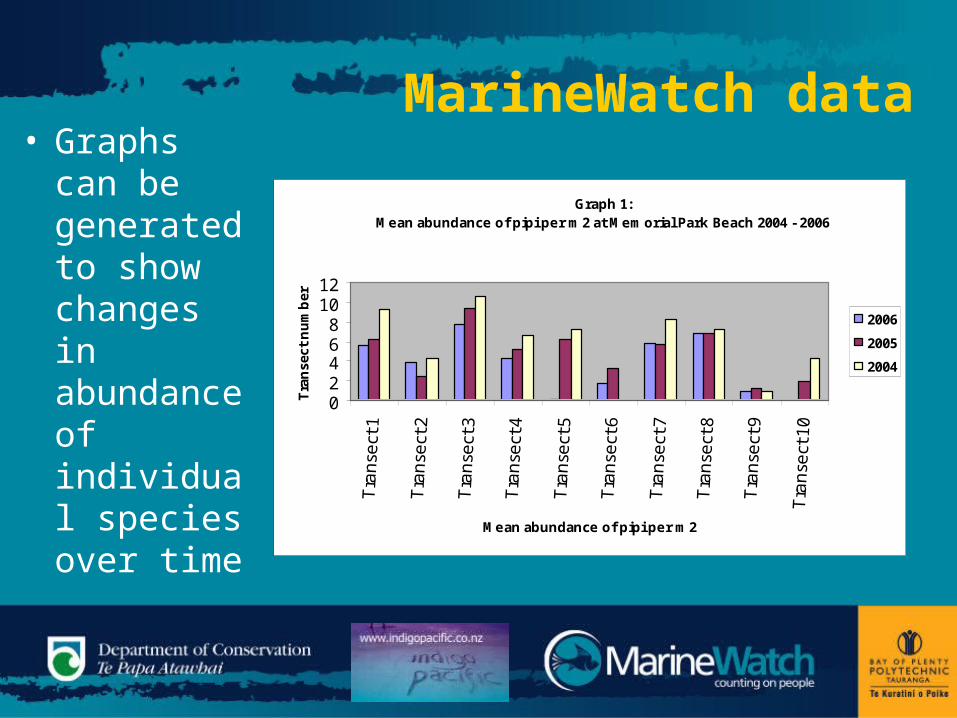
MarineWatch data• Graphs
can be generated to show changes in abundance of individual species over time
Graph 1: Mean abundance of pipi per m2 at Memorial Park Beach 2004 - 2006
02468
1012
Tra
nse
ct 1
Tra
nse
ct 2
Tra
nse
ct 3
Tra
nse
ct 4
Tra
nse
ct 5
Tra
nse
ct 6
Tra
nse
ct 7
Tra
nse
ct 8
Tra
nse
ct 9
Tra
nse
ct 1
0
Mean abundance of pipi per m2
Tra
nse
ct n
um
ber
2006
2005
2004
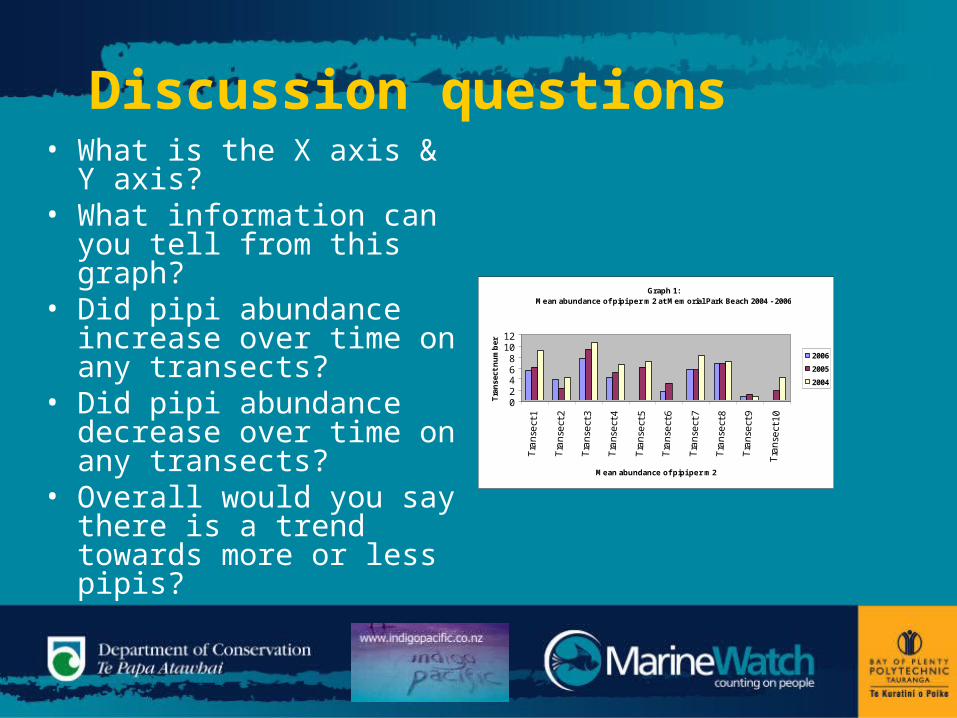
Discussion questions• What is the X axis & Y
axis? • What information can
you tell from this graph?
• Did pipi abundance increase over time on any transects?
• Did pipi abundance decrease over time on any transects?
• Overall would you say there is a trend towards more or less pipis?
Graph 1: Mean abundance of pipi per m2 at Memorial Park Beach 2004 - 2006
02468
1012
Tra
nse
ct 1
Tra
nse
ct 2
Tra
nse
ct 3
Tra
nse
ct 4
Tra
nse
ct 5
Tra
nse
ct 6
Tra
nse
ct 7
Tra
nse
ct 8
Tra
nse
ct 9
Tra
nse
ct 1
0
Mean abundance of pipi per m2
Tra
nse
ct n
um
ber
2006
2005
2004
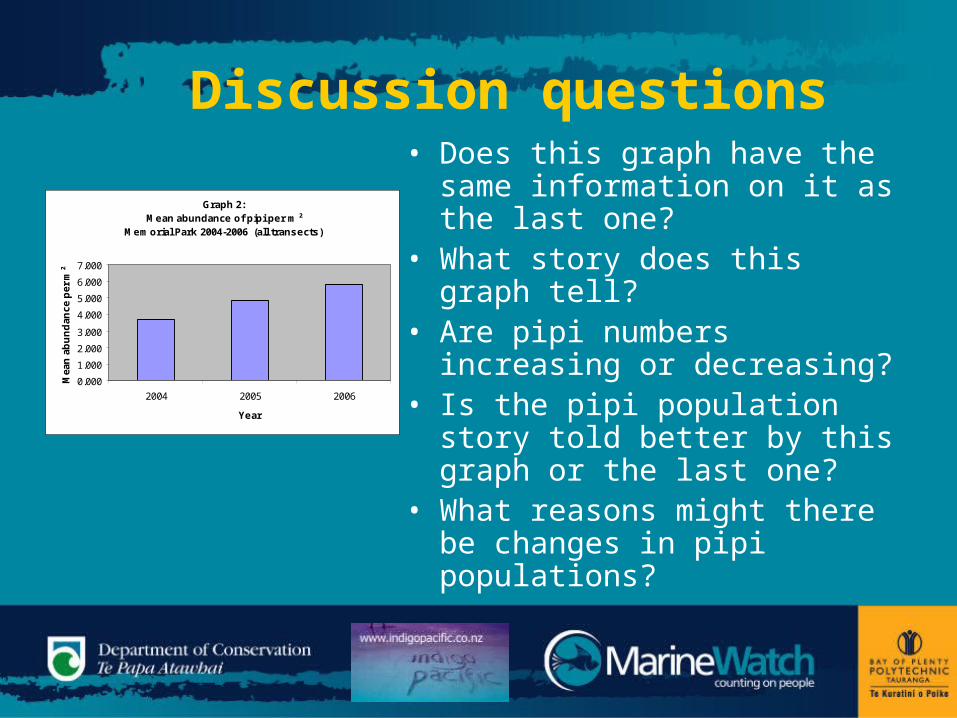
Discussion questions• Does this graph have the
same information on it as the last one?
• What story does this graph tell?
• Are pipi numbers increasing or decreasing?
• Is the pipi population story told better by this graph or the last one?
• What reasons might there be changes in pipi populations?
Graph 2:Mean abundance of pipi per m²
Memorial Park 2004-2006 (all transects)
0.000
1.000
2.000
3.000
4.000
5.000
6.000
7.000
2004 2005 2006
Year
Mea
n a
bu
nd
ance
per
m²
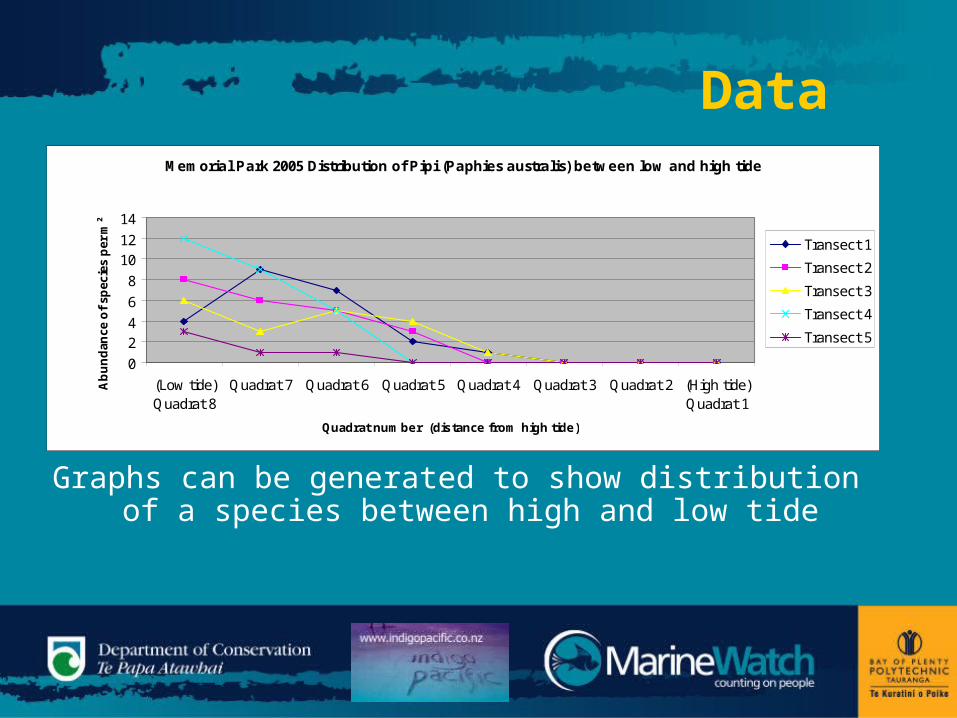
DataMemorial Park 2005 Distribution of Pipi (Paphies australis) between low and high tide
0
24
6
8
1012
14
(Low tide)Quadrat 8
Quadrat 7 Quadrat 6 Quadrat 5 Quadrat 4 Quadrat 3 Quadrat 2 (High tide)Quadrat 1
Quadrat number (distance from high tide)
Ab
un
dan
ce o
f sp
ecie
s p
er m
²
Transect 1
Transect 2
Transect 3
Transect 4
Transect 5
Graphs can be generated to show distribution of a species between high and low tide
Species identification
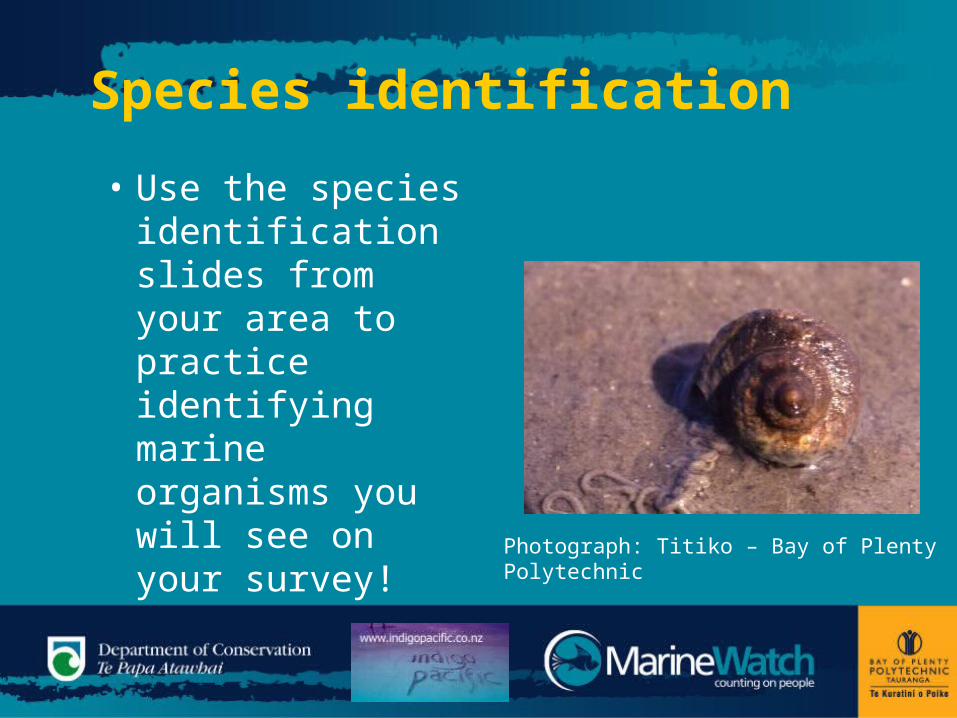
• Use the species identification slides from your area to practice identifying marine organisms you will see on your survey!
Photograph: Titiko – Bay of Plenty Polytechnic