Embed Size (px)
Citation preview
3/22/2015
1
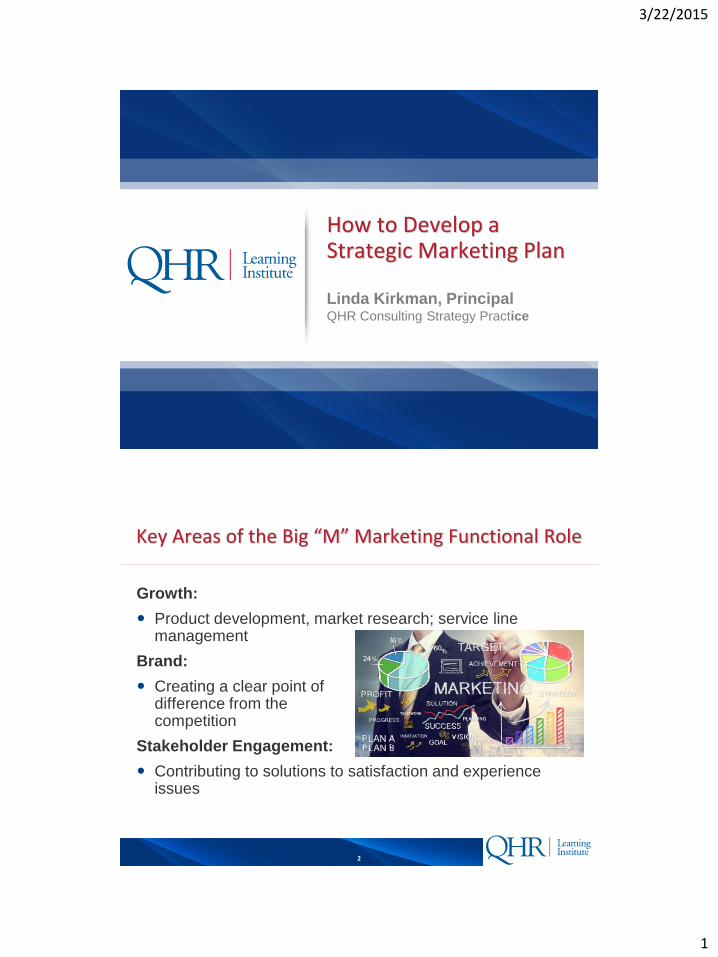
How to Develop a Strategic Marketing Plan
Linda Kirkman, PrincipalQHR Consulting Strategy Practice
2
Key Areas of the Big “M” Marketing Functional Role
Growth:
Product development, market research; service line management
Brand:
Creating a clear point of difference from the competition
Stakeholder Engagement:
Contributing to solutions to satisfaction and experience issues
3/22/2015
2
3
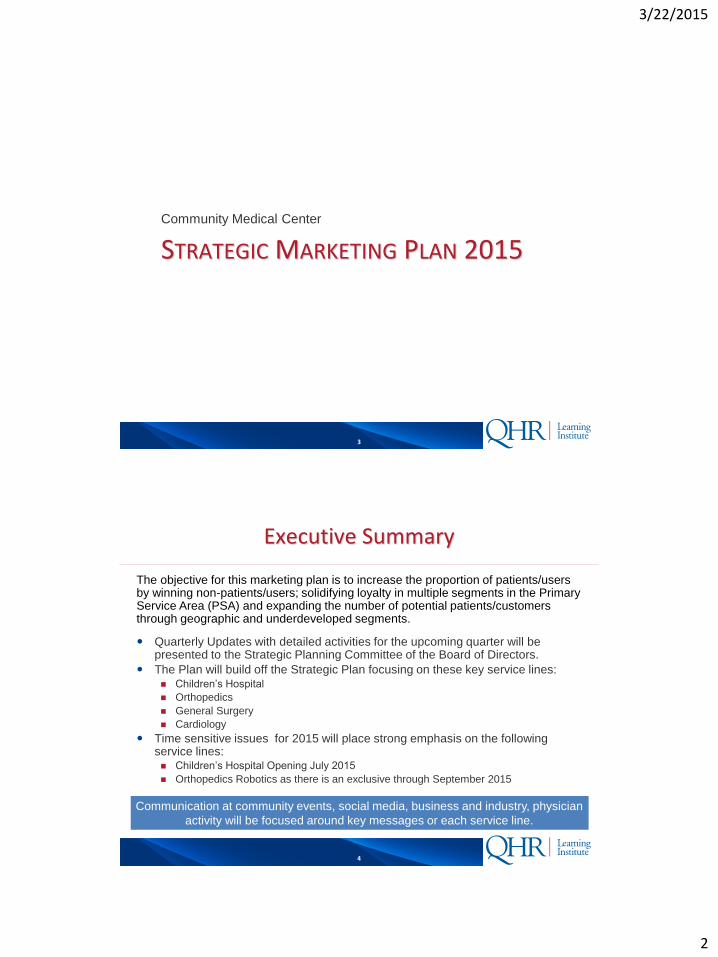
STRATEGIC MARKETING PLAN 2015Community Medical Center
4
Executive Summary
Quarterly Updates with detailed activities for the upcoming quarter will be presented to the Strategic Planning Committee of the Board of Directors.
The Plan will build off the Strategic Plan focusing on these key service lines: Children’s Hospital
Orthopedics
General Surgery
Cardiology
Time sensitive issues for 2015 will place strong emphasis on the following service lines: Children’s Hospital Opening July 2015
Orthopedics Robotics as there is an exclusive through September 2015
The objective for this marketing plan is to increase the proportion of patients/users by winning non-patients/users; solidifying loyalty in multiple segments in the Primary Service Area (PSA) and expanding the number of potential patients/customers through geographic and underdeveloped segments.
Communication at community events, social media, business and industry, physician
activity will be focused around key messages or each service line.
3/22/2015
3
5
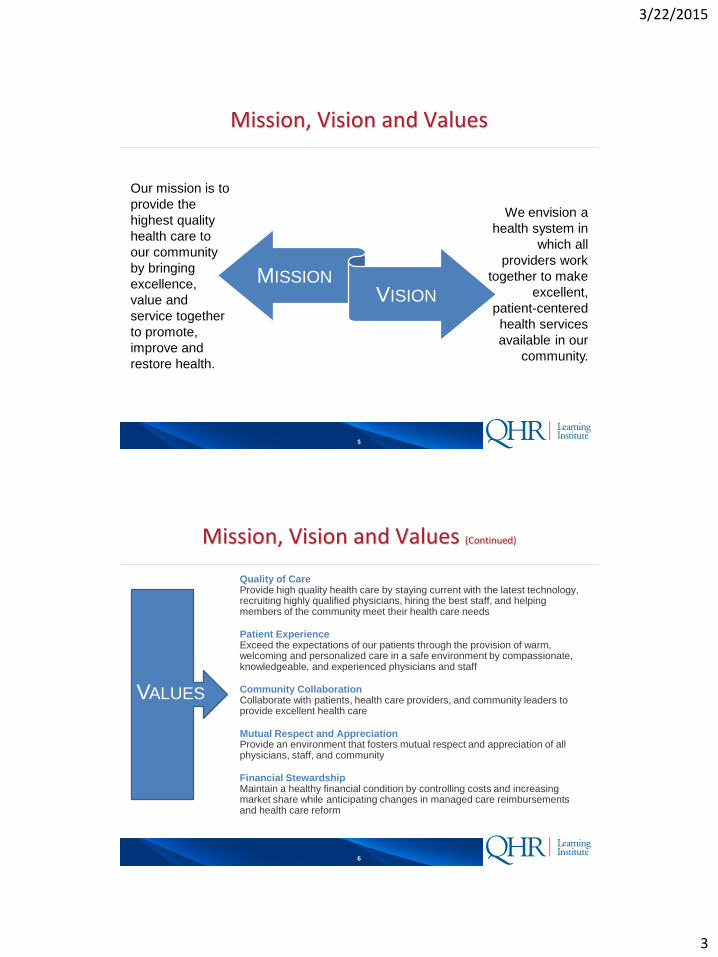
Mission, Vision and Values
MISSION
Our mission is to
provide the
highest quality
health care to
our community
by bringing
excellence,
value and
service together
to promote,
improve and
restore health.
VISION
We envision a
health system in
which all
providers work
together to make
excellent,
patient-centered
health services
available in our
community.
6
Mission, Vision and Values (Continued)
Quality of CareProvide high quality health care by staying current with the latest technology, recruiting highly qualified physicians, hiring the best staff, and helping members of the community meet their health care needs
Patient ExperienceExceed the expectations of our patients through the provision of warm, welcoming and personalized care in a safe environment by compassionate, knowledgeable, and experienced physicians and staff
Community CollaborationCollaborate with patients, health care providers, and community leaders to provide excellent health care
Mutual Respect and AppreciationProvide an environment that fosters mutual respect and appreciation of all physicians, staff, and community
Financial StewardshipMaintain a healthy financial condition by controlling costs and increasing market share while anticipating changes in managed care reimbursements and health care reform
VALUES
3/22/2015
4
7
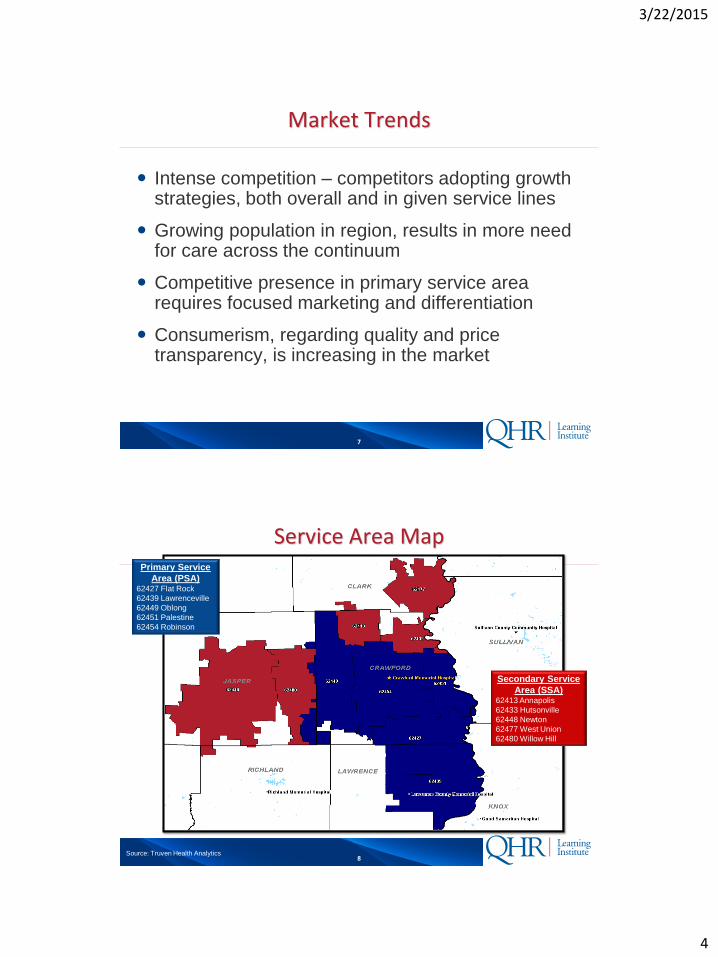
Market Trends
Intense competition – competitors adopting growth strategies, both overall and in given service lines
Growing population in region, results in more need for care across the continuum
Competitive presence in primary service area requires focused marketing and differentiation
Consumerism, regarding quality and price transparency, is increasing in the market
8
Service Area Map
Secondary Service
Area (SSA)62413 Annapolis
62433 Hutsonville
62448 Newton
62477 West Union
62480 Willow Hill
Primary Service
Area (PSA)62427 Flat Rock
62439 Lawrenceville
62449 Oblong
62451 Palestine
62454 Robinson
Source: Truven Health Analytics
3/22/2015
5
9
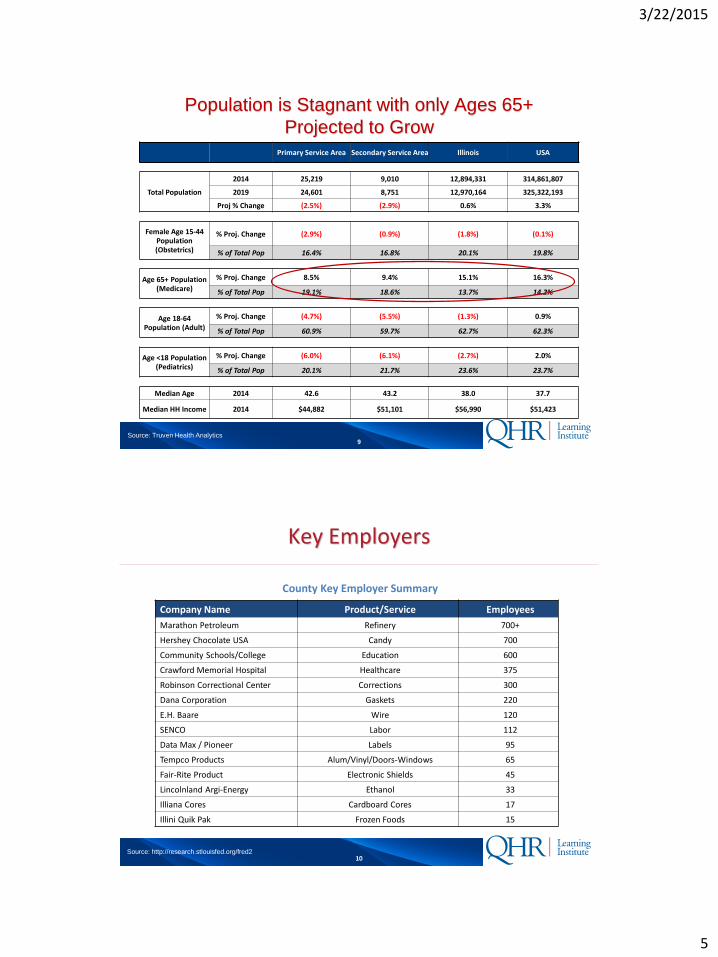
Population is Stagnant with only Ages 65+
Projected to GrowPrimary Service Area Secondary Service Area Illinois USA
Total Population
2014 25,219 9,010 12,894,331 314,861,807
2019 24,601 8,751 12,970,164 325,322,193
Proj % Change (2.5%) (2.9%) 0.6% 3.3%
Female Age 15-44 Population (Obstetrics)
% Proj. Change (2.9%) (0.9%) (1.8%) (0.1%)
% of Total Pop 16.4% 16.8% 20.1% 19.8%
Age 65+ Population (Medicare)
% Proj. Change 8.5% 9.4% 15.1% 16.3%
% of Total Pop 19.1% 18.6% 13.7% 14.2%
Age 18-64 Population (Adult)
% Proj. Change (4.7%) (5.5%) (1.3%) 0.9%
% of Total Pop 60.9% 59.7% 62.7% 62.3%
Age <18 Population (Pediatrics)
% Proj. Change (6.0%) (6.1%) (2.7%) 2.0%
% of Total Pop 20.1% 21.7% 23.6% 23.7%
Median Age 2014 42.6 43.2 38.0 37.7
Median HH Income 2014 $44,882 $51,101 $56,990 $51,423
Source: Truven Health Analytics
10
Key Employers
County Key Employer Summary
Company Name Product/Service Employees
Marathon Petroleum Refinery 700+
Hershey Chocolate USA Candy 700
Community Schools/College Education 600
Crawford Memorial Hospital Healthcare 375
Robinson Correctional Center Corrections 300
Dana Corporation Gaskets 220
E.H. Baare Wire 120
SENCO Labor 112
Data Max / Pioneer Labels 95
Tempco Products Alum/Vinyl/Doors-Windows 65
Fair-Rite Product Electronic Shields 45
Lincolnland Argi-Energy Ethanol 33
Illiana Cores Cardboard Cores 17
Illini Quik Pak Frozen Foods 15
Source: http://research.stlouisfed.org/fred2

3/22/2015
6
11
Service Area Commercially-Insured Residents Provide Opportunity for New Pricing Platforms
20%15%
23%17%
20%
18%
14%
15%
52%60% 54%
55%
2% 2%2%
2%
7% 5% 8% 11%
0%
10%
20%
30%
40%
50%
60%
70%
80%
90%
100%
Primary Service Area Secondary Service Area Illinois National
2014 Population-Based Health Insurance Coverage Estimates
Uninsured
Private - Exchange
Private/Commercial
Medicare*
Medicaid
Source: Truven Health Analytics
* Includes Medicare Dual Eligible
12
Situation Analysis
Community Hospital has a gradual declining overall inpatient market share in the primary service area, while Competitor 1 and Competitor 2 have gained in overall market share
Community Hospital has also lost market share to various competitors in several key service lines
Community Hospital has expanded it’s OR and rehabilitation capacity giving opportunity for expansion in general surgery, orthopedics and cardiology services
Community Hospital will open a Children’s Hospital summer of 2015
3/22/2015
7
13
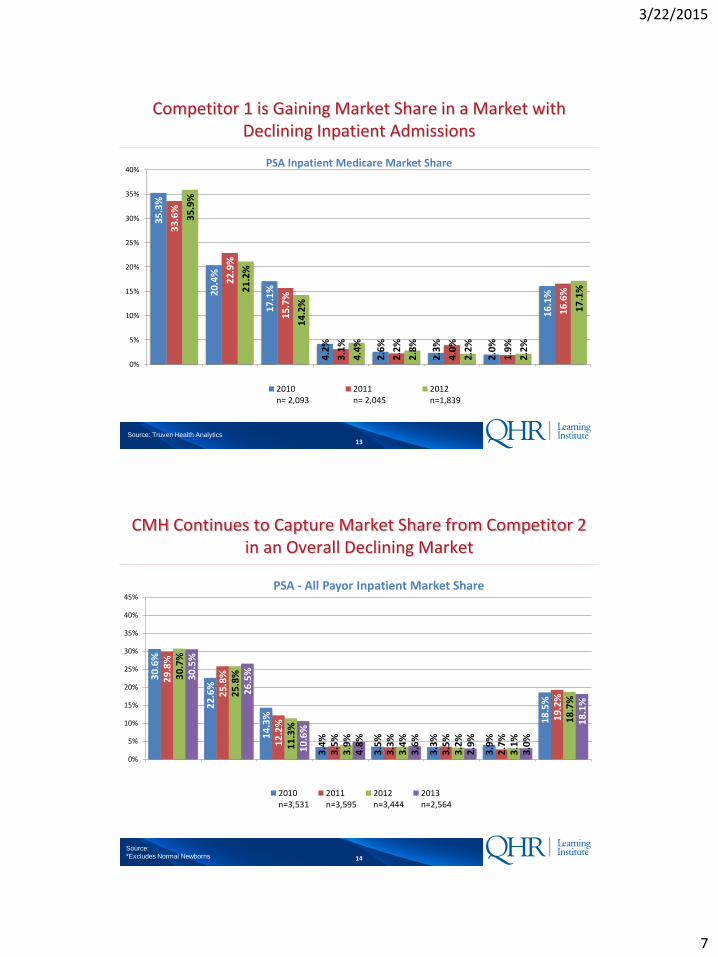
Competitor 1 is Gaining Market Share in a Market with Declining Inpatient Admissions
35
.3%
20
.4%
17
.1%
4.2
%
2.6
%
2.3
%
2.0
%
16
.1%
33
.6%
22
.9%
15
.7%
3.1
%
2.2
%
4.0
%
1.9
%
16
.6%
35
.9%
21
.2%
14
.2%
4.4
%
2.8
%
2.2
%
2.2
%
17
.1%
0%
5%
10%
15%
20%
25%
30%
35%
40%
Good SamaritanHosp
Crawford MemHosp
Lawrence CoMem Hosp
Union HospitalInc
DeaconessHospital Inc
IndianaUniversity
Health
CarleFoundation Hosp
All Others
PSA Inpatient Medicare Market Share
2010n= 2,093
2011n= 2,045
2012n=1,839
Source: Truven Health Analytics
14
CMH Continues to Capture Market Share from Competitor 2 in an Overall Declining Market
Source:
*Excludes Normal Newborns
30
.6%
22
.6%
14
.3%
3.4
%
3.5
%
3.3
%
3.9
%
18
.5%
29
.8%
25
.8%
12
.2%
3.5
%
3.3
%
3.5
%
2.7
%
19
.2%
30
.7%
25
.8%
11
.3%
3.9
%
3.4
%
3.2
%
3.1
%
18
.7%
30
.5%
26
.5%
10
.6%
4.8
%
3.6
%
2.9
%
3.0
%
18
.1%
0%
5%
10%
15%
20%
25%
30%
35%
40%
45%
GOODSAMARITAN
HOSPITAL
CRAWFORDMEMORIALHOSPITAL
LAWRENCECOUNTY
MEMORIALHOSPITAL
CARLEFOUNDATION
HOSPITAL
UNIONHOSPITAL, INC
DEACONESSHOSPITAL, INC
RICHLANDMEMORIALHOSPITAL
All Others
PSA - All Payor Inpatient Market Share
2010n=3,531
2011n=3,595
2012n=3,444
2013n=2,564
3/22/2015
8
15
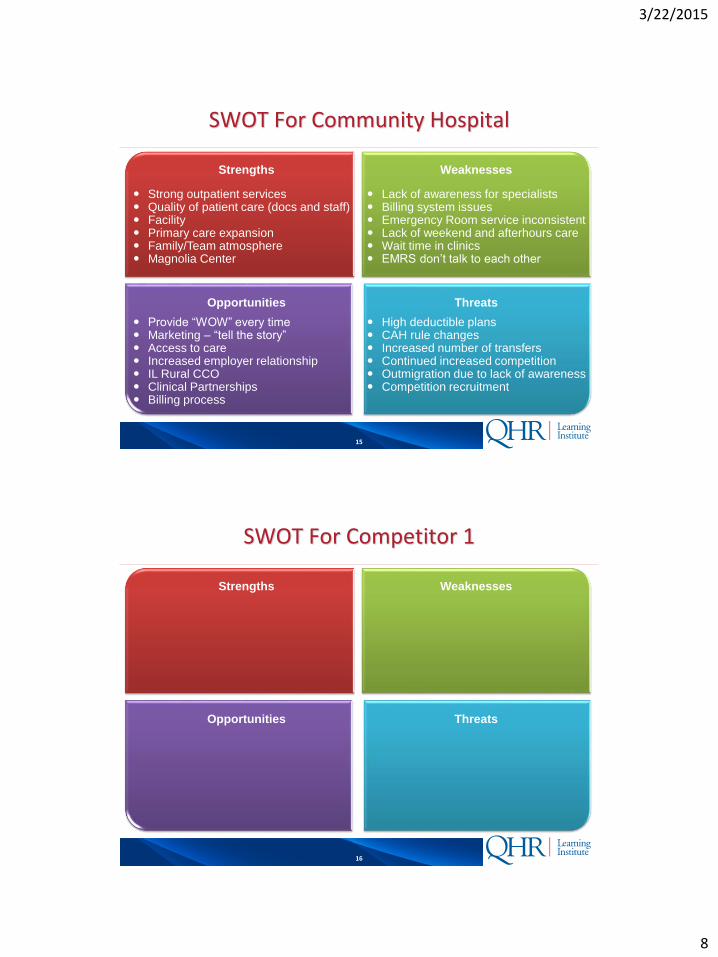
SWOT For Community Hospital
Strong outpatient services Quality of patient care (docs and staff) Facility Primary care expansion Family/Team atmosphere Magnolia Center
Strengths
Lack of awareness for specialists Billing system issues Emergency Room service inconsistent Lack of weekend and afterhours care Wait time in clinics EMRS don’t talk to each other
Weaknesses
Provide “WOW” every time Marketing – “tell the story” Access to care Increased employer relationship IL Rural CCO Clinical Partnerships Billing process
Opportunities
High deductible plans CAH rule changes Increased number of transfers Continued increased competition Outmigration due to lack of awareness Competition recruitment
Threats
16
SWOT For Competitor 1
Strengths Weaknesses
Opportunities Threats
3/22/2015
9
17
SWOT For Competitor 2
Strengths Weaknesses
Opportunities Threats
18
NOW WE HAVE THE
BASELINE DATA –LET’S START TO
BUILD THE PLAN
3/22/2015
10
19
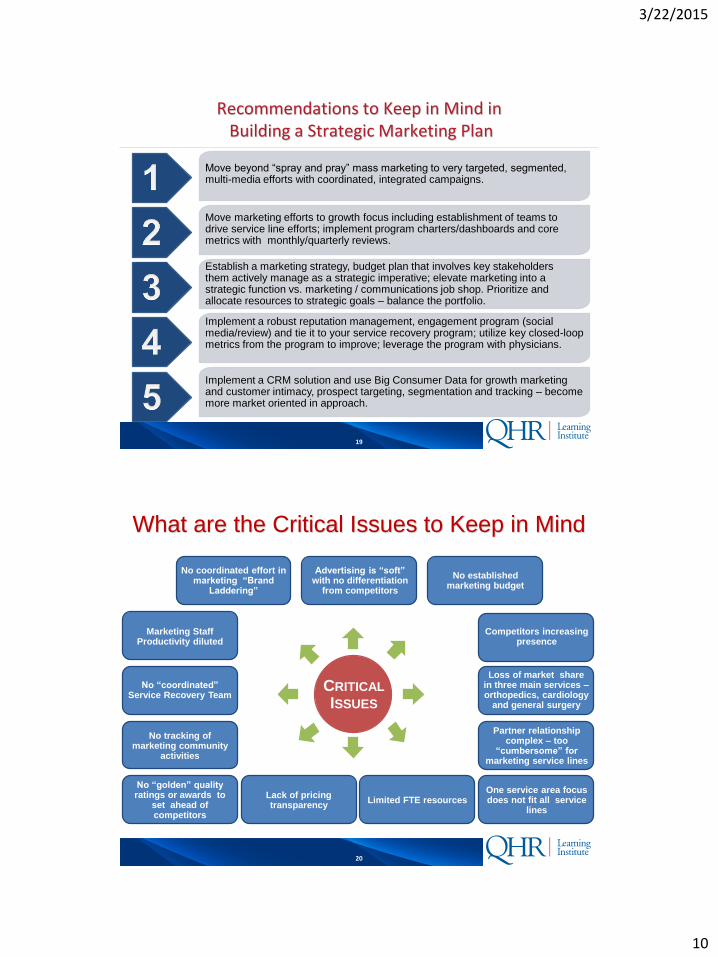
Recommendations to Keep in Mind inBuilding a Strategic Marketing Plan
Move beyond “spray and pray” mass marketing to very targeted, segmented, multi-media efforts with coordinated, integrated campaigns.
Establish a marketing strategy, budget plan that involves key stakeholders them actively manage as a strategic imperative; elevate marketing into a strategic function vs. marketing / communications job shop. Prioritize and allocate resources to strategic goals – balance the portfolio.
Move marketing efforts to growth focus including establishment of teams to drive service line efforts; implement program charters/dashboards and core metrics with monthly/quarterly reviews.
Implement a robust reputation management, engagement program (social media/review) and tie it to your service recovery program; utilize key closed-loop metrics from the program to improve; leverage the program with physicians.
Implement a CRM solution and use Big Consumer Data for growth marketing and customer intimacy, prospect targeting, segmentation and tracking – become more market oriented in approach.
20
What are the Critical Issues to Keep in Mind
Loss of market share in three main services –orthopedics, cardiology
and general surgery
Partner relationship complex – too
“cumbersome” for marketing service lines
One service area focus does not fit all service
linesLimited FTE resources
Lack of pricing transparency
No “golden” quality ratings or awards to
set ahead of competitors
No tracking of marketing community
activities
No “coordinated” Service Recovery Team
Marketing Staff Productivity diluted
No coordinated effort in marketing “Brand
Laddering”
Advertising is “soft” with no differentiation
from competitors
No established marketing budget
Competitors increasing presence
CRITICAL
ISSUES
3/22/2015
11
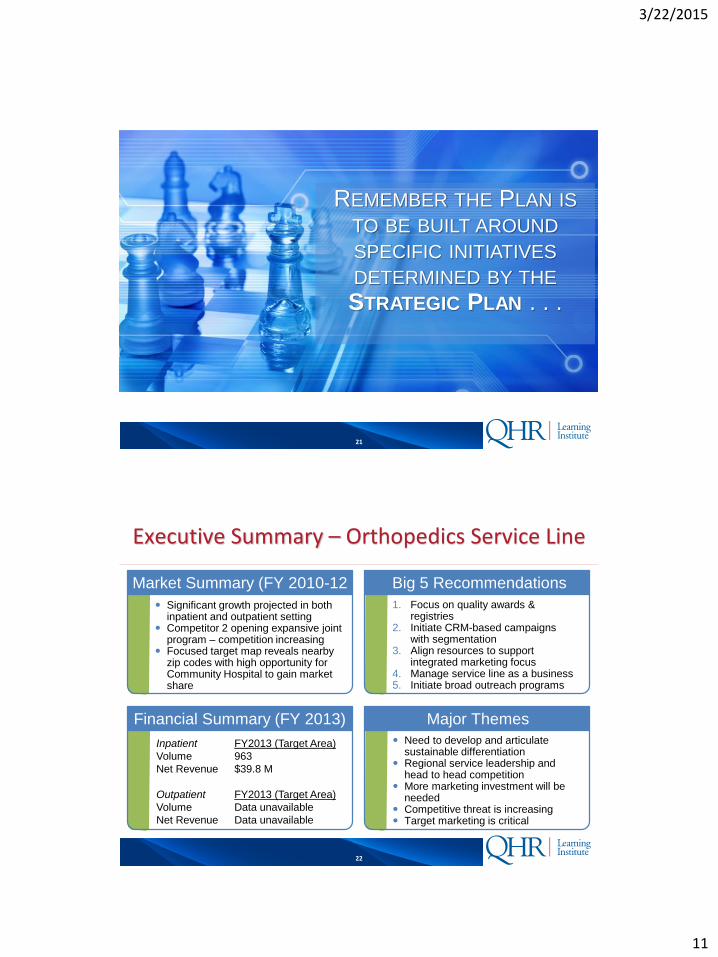
21
REMEMBER THE PLAN IS
TO BE BUILT AROUND
SPECIFIC INITIATIVES
DETERMINED BY THE
STRATEGIC PLAN . . .
22
Major Themes
Big 5 RecommendationsMarket Summary (FY 2010-12
Financial Summary (FY 2013)
Executive Summary – Orthopedics Service Line
Need to develop and articulate sustainable differentiation
Regional service leadership and head to head competition
More marketing investment will be needed
Competitive threat is increasing Target marketing is critical
1. Focus on quality awards & registries
2. Initiate CRM-based campaigns with segmentation
3. Align resources to support integrated marketing focus
4. Manage service line as a business5. Initiate broad outreach programs
Significant growth projected in both inpatient and outpatient setting
Competitor 2 opening expansive joint program – competition increasing
Focused target map reveals nearby zip codes with high opportunity for Community Hospital to gain market share
Inpatient FY2013 (Target Area)
Volume 963
Net Revenue $39.8 M
Outpatient FY2013 (Target Area)
Volume Data unavailable
Net Revenue Data unavailable
3/22/2015
12
23
ORTHOPEDIC
SERVICE LINE
MARKETING
STRATEGY & PLAN –
SITUATION ANALYSIS
FINANCIAL & MARKET
ASSESSMENT
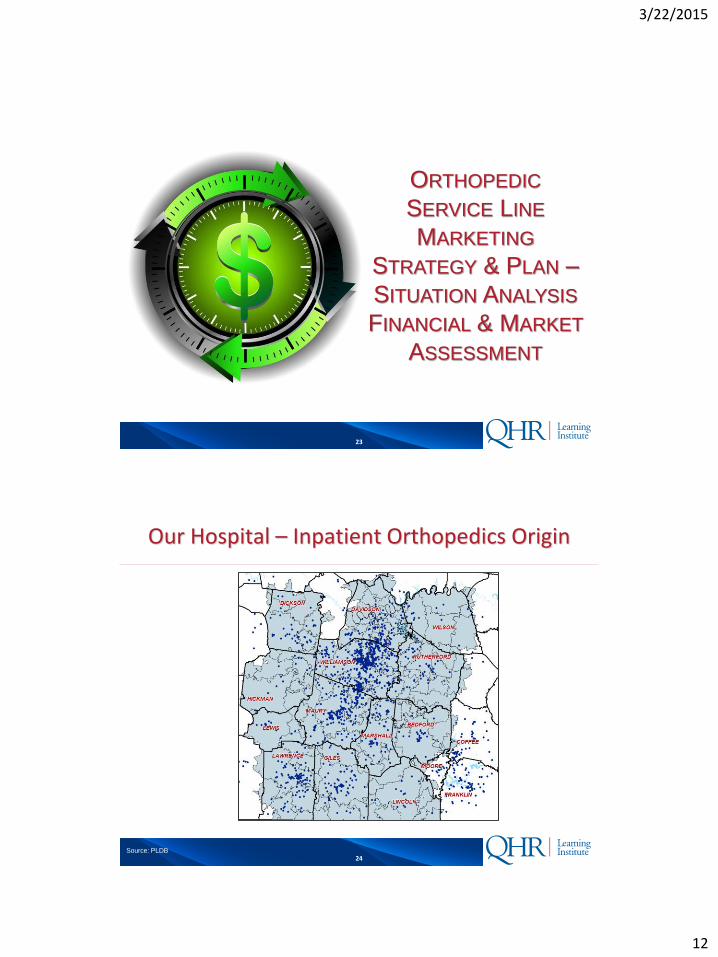
24
Our Hospital – Inpatient Orthopedics Origin
Source: PLDB
3/22/2015
13
25
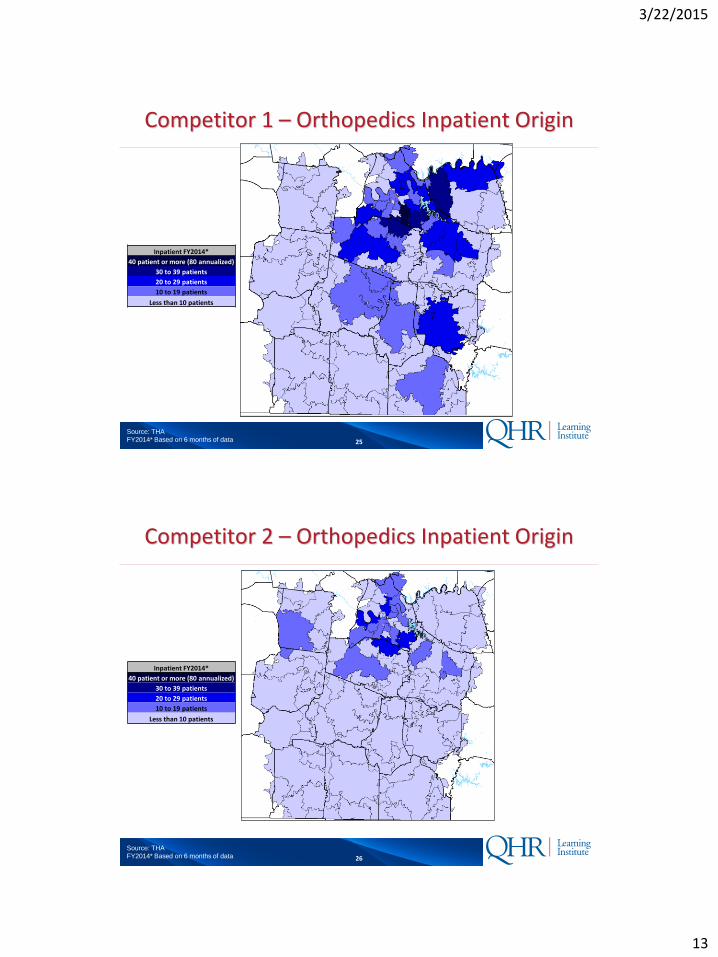
Competitor 1 – Orthopedics Inpatient Origin
Source: THA
FY2014* Based on 6 months of data
Inpatient FY2014*
40 patient or more (80 annualized)
30 to 39 patients
20 to 29 patients
10 to 19 patients
Less than 10 patients
26
Competitor 2 – Orthopedics Inpatient Origin
Source: THA
FY2014* Based on 6 months of data
Inpatient FY2014*
40 patient or more (80 annualized)
30 to 39 patients
20 to 29 patients
10 to 19 patients
Less than 10 patients
3/22/2015
14
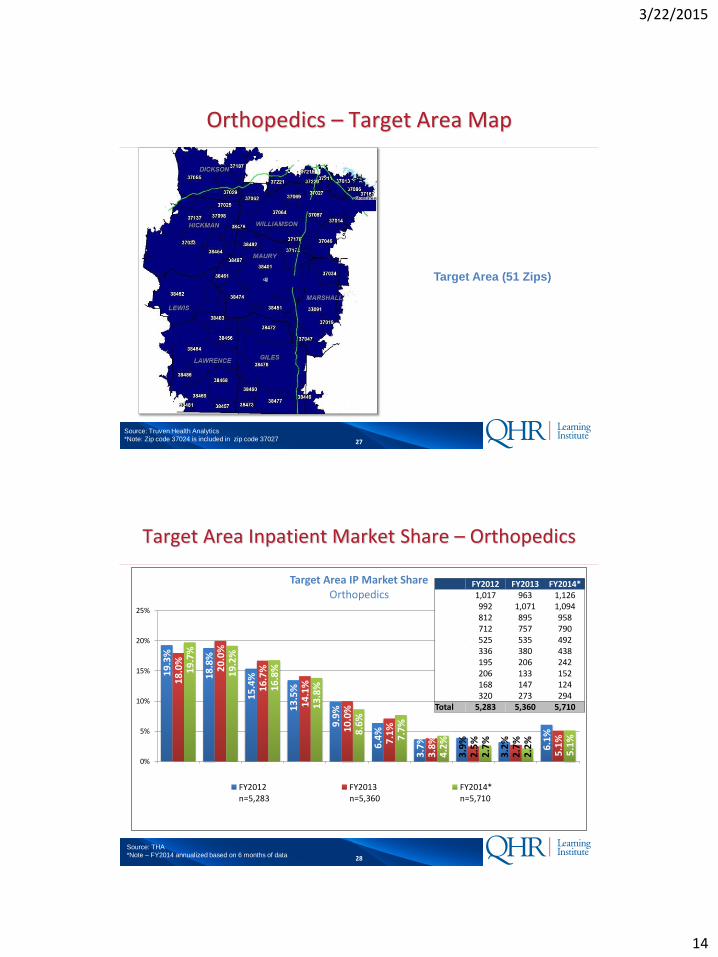
27
Orthopedics – Target Area Map
Source: Truven Health Analytics
*Note: Zip code 37024 is included in zip code 37027
Target Area (51 Zips)
28
Target Area Inpatient Market Share – Orthopedics
19
.3%
18
.8%
15
.4%
13
.5%
9.9
%
6.4
%
3.7
%
3.9
%
3.2
%
6.1
%
18
.0%
20
.0%
16
.7%
14
.1%
10
.0%
7.1
%
3.8
%
2.5
%
2.7
%
5.1
%
19
.7%
19
.2%
16
.8%
13
.8%
8.6
%
7.7
%
4.2
%
2.7
%
2.2
%
5.1
%
0%
5%
10%
15%
20%
25%
WilliamsonMedicalCenter
MauryRegional
St. ThomasWest
VanderbiltUniversityHospital
St. ThomasMidtown
Centennial SouthernHills
Horizon StoneCrest All Others
Target Area IP Market ShareOrthopedics
FY2012n=5,283
FY2013n=5,360
FY2014*n=5,710
FY2012 FY2013 FY2014*1,017 963 1,126992 1,071 1,094812 895 958712 757 790525 535 492336 380 438195 206 242206 133 152168 147 124320 273 294
Total 5,283 5,360 5,710
Source: THA
*Note – FY2014 annualized based on 6 months of data
3/22/2015
15
29
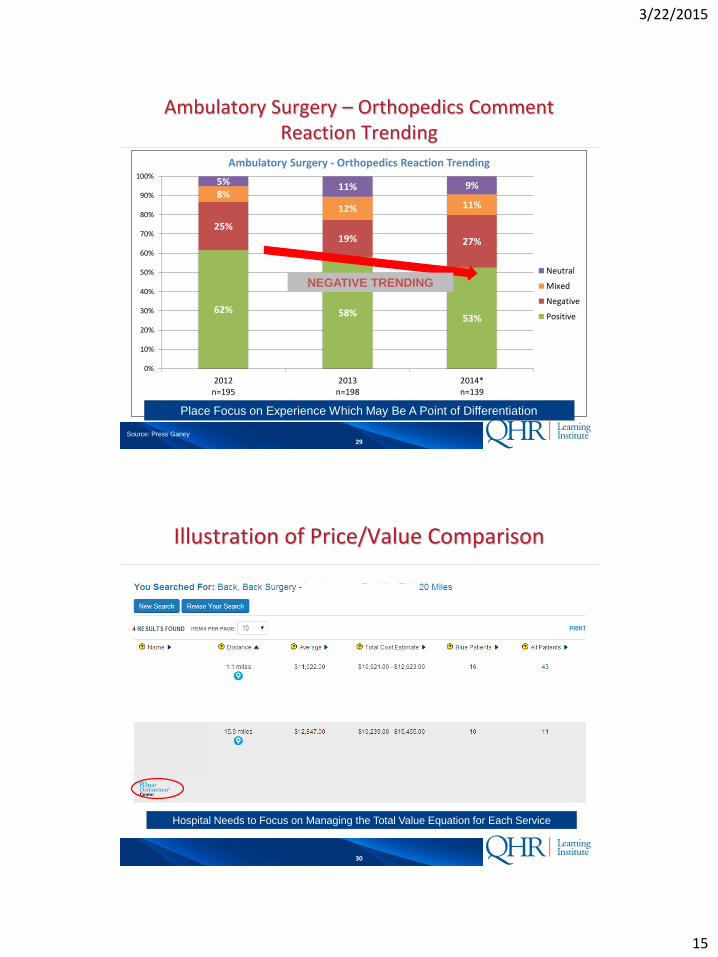
Ambulatory Surgery – Orthopedics Comment Reaction Trending
Source: Press Ganey
62% 58%53%
25%19% 27%
8%
12% 11%
5% 11% 9%
0%
10%
20%
30%
40%
50%
60%
70%
80%
90%
100%
2012n=195
2013n=198
2014*n=139
Ambulatory Surgery - Orthopedics Reaction Trending
Neutral
Mixed
Negative
Positive
NEGATIVE TRENDING
Place Focus on Experience Which May Be A Point of Differentiation
30
Illustration of Price/Value Comparison
Hospital Needs to Focus on Managing the Total Value Equation for Each Service
3/22/2015
16
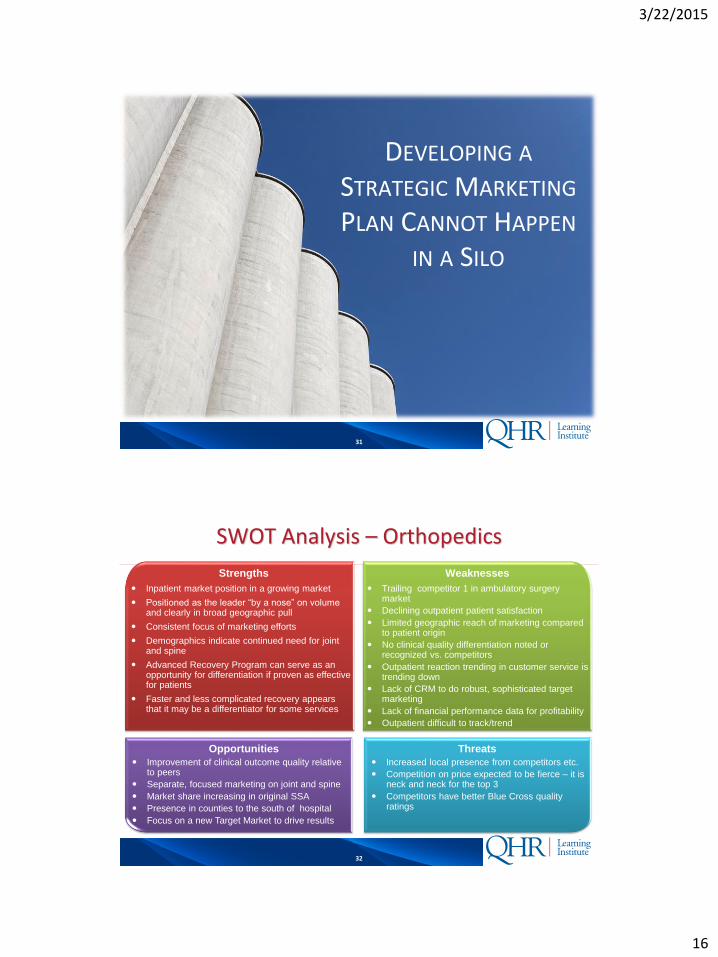
31
DEVELOPING A
STRATEGIC MARKETING
PLAN CANNOT HAPPEN
IN A SILO
32
SWOT Analysis – Orthopedics
Strengths Weaknesses
Opportunities Threats
Inpatient market position in a growing market
Positioned as the leader “by a nose” on volume and clearly in broad geographic pull
Consistent focus of marketing efforts
Demographics indicate continued need for joint and spine
Advanced Recovery Program can serve as an opportunity for differentiation if proven as effective for patients
Faster and less complicated recovery appears that it may be a differentiator for some services
Trailing competitor 1 in ambulatory surgery market
Declining outpatient patient satisfaction
Limited geographic reach of marketing compared to patient origin
No clinical quality differentiation noted or recognized vs. competitors
Outpatient reaction trending in customer service is trending down
Lack of CRM to do robust, sophisticated target marketing
Lack of financial performance data for profitability
Outpatient difficult to track/trend
Improvement of clinical outcome quality relative to peers
Separate, focused marketing on joint and spine
Market share increasing in original SSA
Presence in counties to the south of hospital
Focus on a new Target Market to drive results
Increased local presence from competitors etc.
Competition on price expected to be fierce – it is neck and neck for the top 3
Competitors have better Blue Cross quality ratings
3/22/2015
17
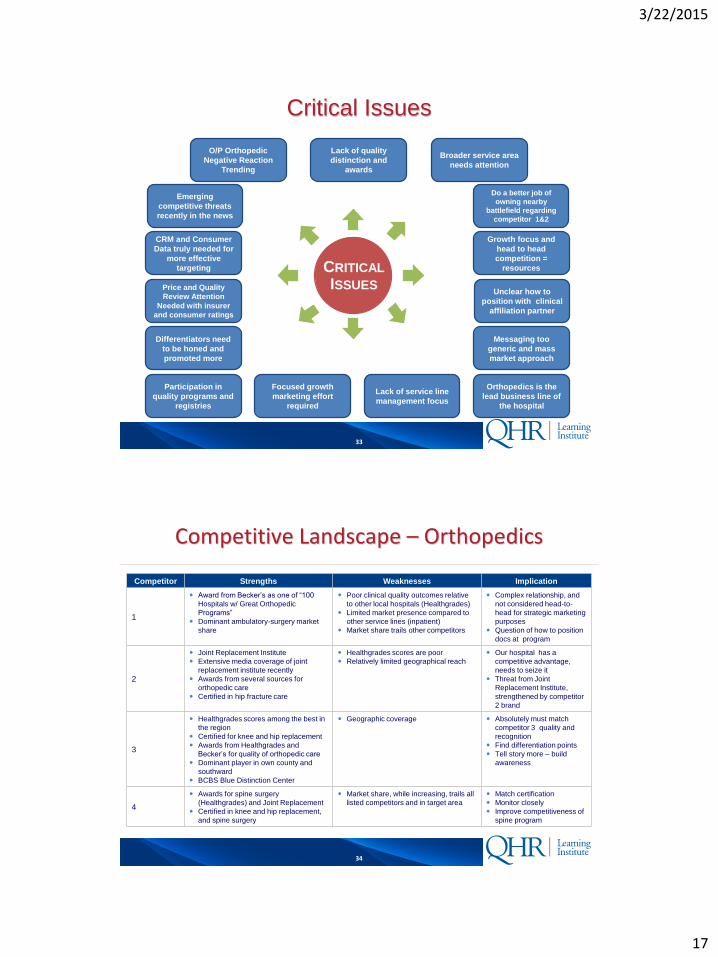
33
Critical Issues
CRM and Consumer
Data truly needed for
more effective
targeting
Price and Quality
Review Attention
Needed with insurer
and consumer ratings
Differentiators need
to be honed and
promoted more
Lack of quality
distinction and
awards
Lack of service line
management focus
Focused growth
marketing effort
required
O/P Orthopedic
Negative Reaction
Trending
Participation in
quality programs and
registries
Unclear how to
position with clinical
affiliation partner
Growth focus and
head to head
competition =
resources
Orthopedics is the
lead business line of
the hospital
Broader service area
needs attention
Messaging too
generic and mass
market approach
Emerging
competitive threats
recently in the news
Do a better job of
owning nearby
battlefield regarding
competitor 1&2
CRITICAL
ISSUES
34
Competitive Landscape – Orthopedics
Competitor Strengths Weaknesses Implication
1
Award from Becker’s as one of “100
Hospitals w/ Great Orthopedic
Programs”
Dominant ambulatory-surgery market
share
Poor clinical quality outcomes relative
to other local hospitals (Healthgrades)
Limited market presence compared to
other service lines (inpatient)
Market share trails other competitors
Complex relationship, and
not considered head-to-
head for strategic marketing
purposes
Question of how to position
docs at program
2
Joint Replacement Institute
Extensive media coverage of joint
replacement institute recently
Awards from several sources for
orthopedic care
Certified in hip fracture care
Healthgrades scores are poor
Relatively limited geographical reach
Our hospital has a
competitive advantage,
needs to seize it
Threat from Joint
Replacement Institute,
strengthened by competitor
2 brand
3
Healthgrades scores among the best in
the region
Certified for knee and hip replacement
Awards from Healthgrades and
Becker’s for quality of orthopedic care
Dominant player in own county and
southward
BCBS Blue Distinction Center
Geographic coverage Absolutely must match
competitor 3 quality and
recognition
Find differentiation points
Tell story more – build
awareness
4
Awards for spine surgery
(Healthgrades) and Joint Replacement
Certified in knee and hip replacement,
and spine surgery
Market share, while increasing, trails all
listed competitors and in target area
Match certification
Monitor closely
Improve competitiveness of
spine program
3/22/2015
18
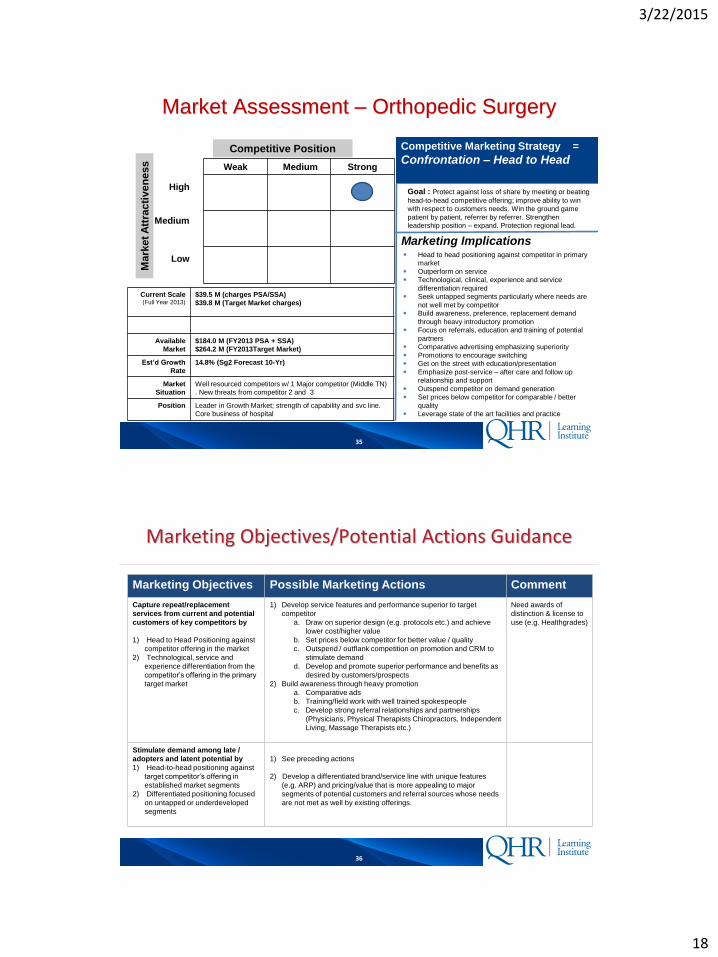
35
Market Assessment – Orthopedic Surgery
Goal : Protect against loss of share by meeting or beating
head-to-head competitive offering; improve ability to win
with respect to customers needs. Win the ground game
patient by patient, referrer by referrer. Strengthen
leadership position – expand. Protection regional lead.
Competitive Marketing Strategy =
Confrontation – Head to Head
High
Medium
Low
Mark
et A
ttra
cti
ven
ess
Competitive Position
Weak Medium Strong
Current Scale(Full Year 2013)
$39.5 M (charges PSA/SSA)
$39.8 M (Target Market charges)
Available
Market
$184.0 M (FY2013 PSA + SSA)
$264.2 M (FY2013Target Market)
Est’d Growth
Rate
14.8% (Sg2 Forecast 10-Yr)
Market
Situation
Well resourced competitors w/ 1 Major competitor (Middle TN)
. New threats from competitor 2 and 3
Position Leader in Growth Market; strength of capability and svc line.
Core business of hospital
Marketing Implications Head to head positioning against competitor in primary
market
Outperform on service
Technological, clinical, experience and service
differentiation required
Seek untapped segments particularly where needs are
not well met by competitor
Build awareness, preference, replacement demand
through heavy introductory promotion
Focus on referrals, education and training of potential
partners
Comparative advertising emphasizing superiority
Promotions to encourage switching
Get on the street with education/presentation
Emphasize post-service – after care and follow up
relationship and support
Outspend competitor on demand generation
Set prices below competitor for comparable / better
quality
Leverage state of the art facilities and practice
36
Marketing Objectives/Potential Actions Guidance
Marketing Objectives Possible Marketing Actions Comment
Capture repeat/replacement
services from current and potential
customers of key competitors by
1) Head to Head Positioning against
competitor offering in the market
2) Technological, service and
experience differentiation from the
competitor’s offering in the primary
target market
1) Develop service features and performance superior to target
competitor
a. Draw on superior design (e.g. protocols etc.) and achieve
lower cost/higher value
b. Set prices below competitor for better value / quality
c. Outspend / outflank competition on promotion and CRM to
stimulate demand
d. Develop and promote superior performance and benefits as
desired by customers/prospects
2) Build awareness through heavy promotion
a. Comparative ads
b. Training/field work with well trained spokespeople
c. Develop strong referral relationships and partnerships
(Physicians, Physical Therapists Chiropractors, Independent
Living, Massage Therapists etc.)
Need awards of
distinction & license to
use (e.g. Healthgrades)
Stimulate demand among late /
adopters and latent potential by
1) Head-to-head positioning against
target competitor’s offering in
established market segments
2) Differentiated positioning focused
on untapped or underdeveloped
segments
1) See preceding actions
2) Develop a differentiated brand/service line with unique features
(e.g. ARP) and pricing/value that is more appealing to major
segments of potential customers and referral sources whose needs
are not met as well by existing offerings.
3/22/2015
19
37
Key Communications Themes
The highest number of orthopedic patients in the community chose care without compromise at our hospital. You should too.
Patients know the reputation for Orthopedic Excellence. They come to our hospital from the broader geographic area more than to any other provider. The reason is simple: Trust, Results and Value. We are your Orthopedics Surgery specialists.
Why chose a Orthopedic hospital in a comfortable, quiet suburban setting, excellent surgeons, the friendliest of care with the very best facilities and fast recovery times? You deserve the very best.
Bigger isn’t always better. We delivers leading orthopedic surgery and services beyond the level of experience and outcome you might expect in a larger hospital. The difference? Specialization. Focus. Passion. People and Values and Technology come together deliver care without compromise. We are your Orthopedics Surgery specialists.
High-tech; new surgery suites
Rio Robotic arm for Orthopedics
An Advanced Recovery Program is leading edge and FIRST of its kind
Lower complications and faster recovery
Easy access, less stress
Bone and joint problems aren’t just painful. They can keep you from leading a full, active life.
Easier, comfortable environment to put your focus where it needs to be… healing.
The best orthopedic injury or illness is one that never happens. For this reason, Hospital Orthopedics provides education and screenings for all ages and interests to help keep your bones, muscles and joints healthy.
Care without Compromise. The Leading Orthopedics Hospital.
38
ORTHOPEDIC SERVICE
LINE MARKETING
STRATEGY & PLAN –FINANCIALS
3/22/2015
20
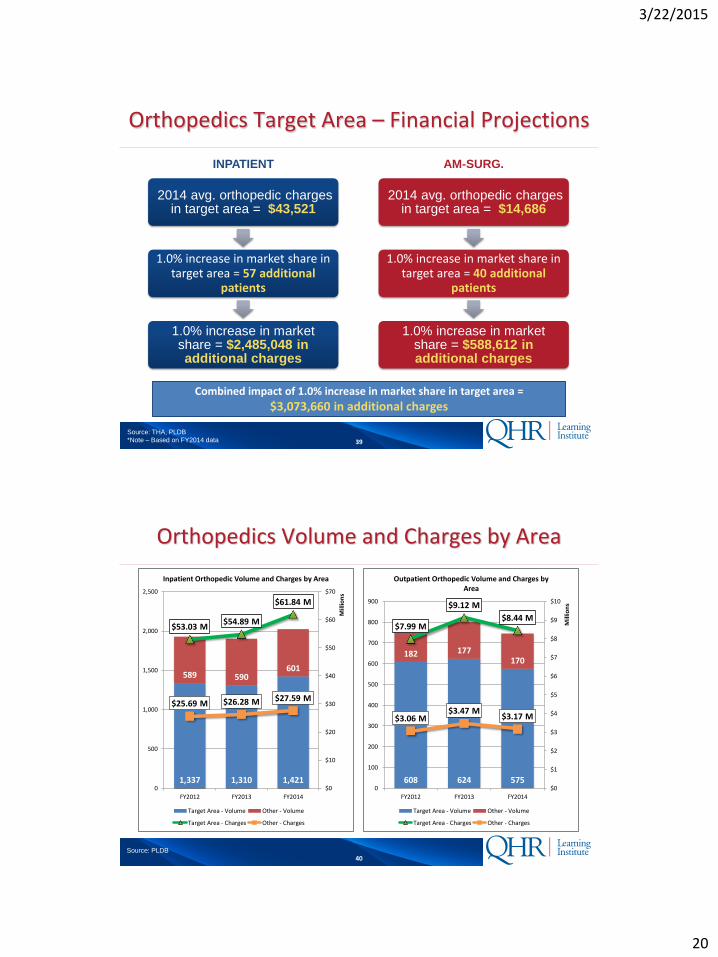
39
Orthopedics Target Area – Financial Projections
Source: THA, PLDB
*Note – Based on FY2014 data
2014 avg. orthopedic charges in target area = $43,521
1.0% increase in market share in target area = 57 additional
patients
1.0% increase in market share = $2,485,048 in additional charges
INPATIENT
2014 avg. orthopedic charges in target area = $14,686
1.0% increase in market share in target area = 40 additional
patients
1.0% increase in market share = $588,612 in additional charges
AM-SURG.
Combined impact of 1.0% increase in market share in target area =
$3,073,660 in additional charges
40
Orthopedics Volume and Charges by Area
Source: PLDB
1,337 1,310 1,421
589 590601
$53.03 M$54.89 M
$61.84 M
$25.69 M $26.28 M $27.59 M
$0
$10
$20
$30
$40
$50
$60
$70
0
500
1,000
1,500
2,000
2,500
FY2012 FY2013 FY2014
Mill
ion
s
Inpatient Orthopedic Volume and Charges by Area
Target Area - Volume Other - Volume
Target Area - Charges Other - Charges
608 624 575
182 177170
$7.99 M
$9.12 M
$8.44 M
$3.06 M$3.47 M
$3.17 M
$0
$1
$2
$3
$4
$5
$6
$7
$8
$9
$10
0
100
200
300
400
500
600
700
800
900
FY2012 FY2013 FY2014
Mill
ion
s
Outpatient Orthopedic Volume and Charges by Area
Target Area - Volume Other - Volume
Target Area - Charges Other - Charges
3/22/2015
21
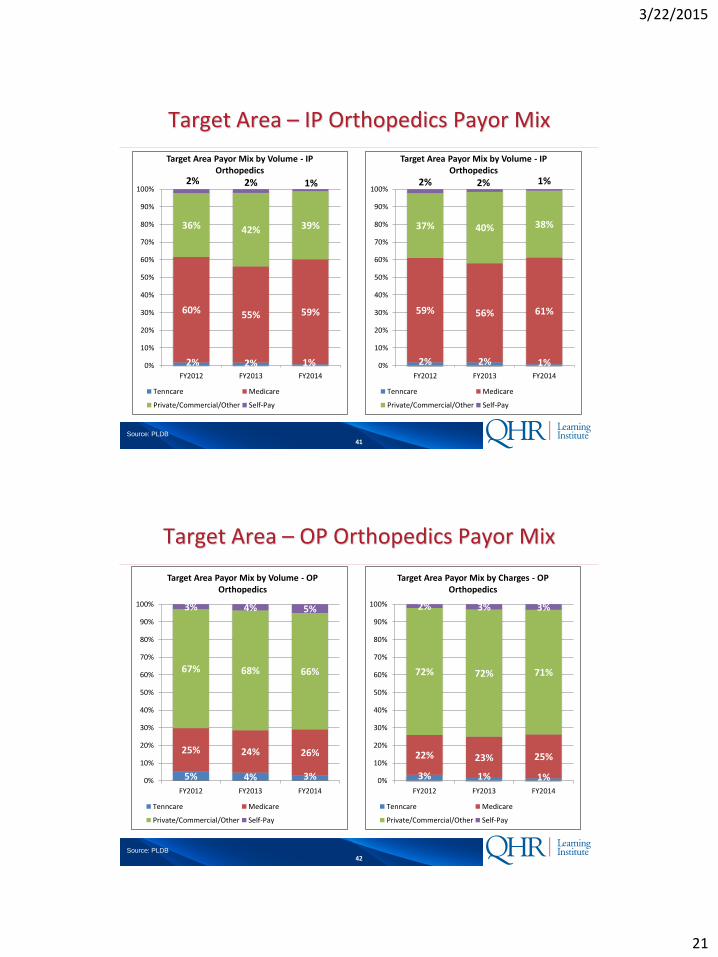
41
Target Area – IP Orthopedics Payor Mix
Source: PLDB
2% 2% 1%
60% 55% 59%
36% 42% 39%
2% 2% 1%
0%
10%
20%
30%
40%
50%
60%
70%
80%
90%
100%
FY2012 FY2013 FY2014
Target Area Payor Mix by Volume - IP Orthopedics
Tenncare Medicare
Private/Commercial/Other Self-Pay
2% 2% 1%
59% 56% 61%
37% 40% 38%
2% 2% 1%
0%
10%
20%
30%
40%
50%
60%
70%
80%
90%
100%
FY2012 FY2013 FY2014
Target Area Payor Mix by Volume - IP Orthopedics
Tenncare Medicare
Private/Commercial/Other Self-Pay
42
Target Area – OP Orthopedics Payor Mix
Source: PLDB
5% 4% 3%
25% 24% 26%
67% 68% 66%
3% 4% 5%
0%
10%
20%
30%
40%
50%
60%
70%
80%
90%
100%
FY2012 FY2013 FY2014
Target Area Payor Mix by Volume - OP Orthopedics
Tenncare Medicare
Private/Commercial/Other Self-Pay
3% 1% 1%
22% 23% 25%
72% 72% 71%
2% 3% 3%
0%
10%
20%
30%
40%
50%
60%
70%
80%
90%
100%
FY2012 FY2013 FY2014
Target Area Payor Mix by Charges - OP Orthopedics
Tenncare Medicare
Private/Commercial/Other Self-Pay
3/22/2015
22
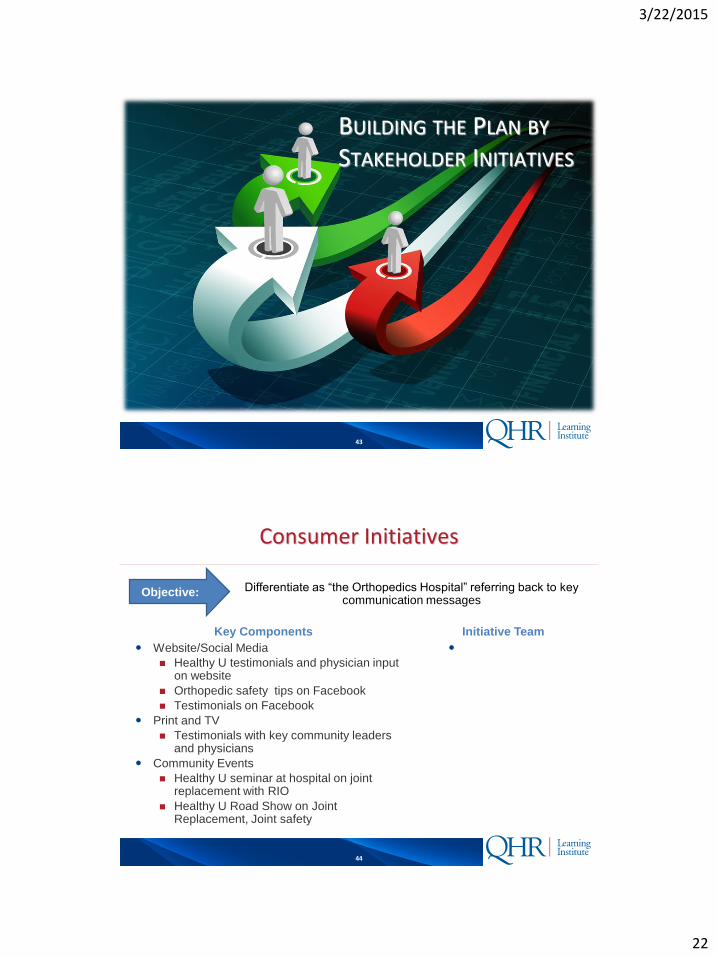
43
BUILDING THE PLAN BY
STAKEHOLDER INITIATIVES
44
Website/Social Media
Healthy U testimonials and physician input on website
Orthopedic safety tips on Facebook
Testimonials on Facebook
Print and TV
Testimonials with key community leaders and physicians
Community Events
Healthy U seminar at hospital on joint replacement with RIO
Healthy U Road Show on Joint Replacement, Joint safety
Consumer Initiatives
Objective:
Key Components
Differentiate as “the Orthopedics Hospital” referring back to key communication messages
Initiative Team
3/22/2015
23
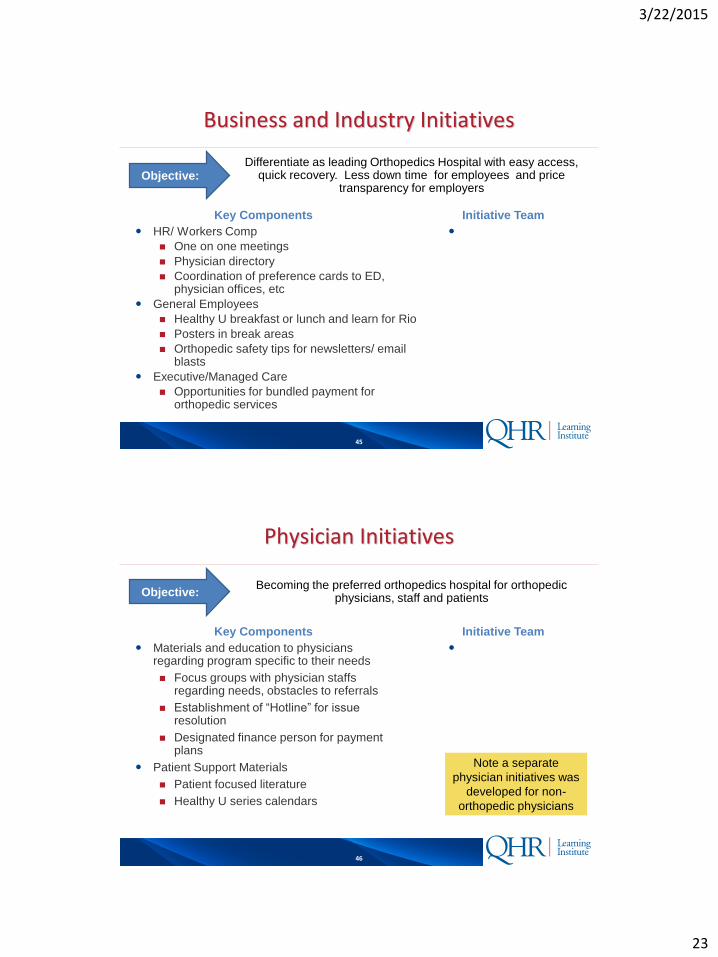
45
HR/ Workers Comp
One on one meetings
Physician directory
Coordination of preference cards to ED, physician offices, etc
General Employees
Healthy U breakfast or lunch and learn for Rio
Posters in break areas
Orthopedic safety tips for newsletters/ email blasts
Executive/Managed Care
Opportunities for bundled payment for orthopedic services
Business and Industry Initiatives
Objective:
Key Components
Differentiate as leading Orthopedics Hospital with easy access, quick recovery. Less down time for employees and price
transparency for employers
Initiative Team
46
Materials and education to physicians regarding program specific to their needs
Focus groups with physician staffs regarding needs, obstacles to referrals
Establishment of “Hotline” for issue resolution
Designated finance person for payment plans
Patient Support Materials
Patient focused literature
Healthy U series calendars
Physician Initiatives
Objective:
Key Components
Becoming the preferred orthopedics hospital for orthopedic physicians, staff and patients
Initiative Team
Note a separate
physician initiatives was
developed for non-
orthopedic physicians
3/22/2015
24
47
NOW FOR THE METRICS… TRACKING RESULTS
48
Measurements & Dashboard
Metrics & Dashboards
Metrics for the overall marketing effort and for service lines should be established
Setting and tracking measures is a journey. Starting with some core measures will be key. These should be developed collaboratively and in coordination with stakeholders and the CFO
Key metrics to consider the influence and accountability aspect of the marketing effort (function, not just department) are suggested. These are based off of 2014 research that has been conducted jointly with the HFMA and considers the CFO point of view
Dashboards should be developed. Dashboards can be done in a program charter template style or other styles.
Additional metrics will be needed for programs and campaigns. CRM and Reputation management solutions will also provide canned metrics that will be very valuable to close-loop results tracking
3/22/2015
25
49
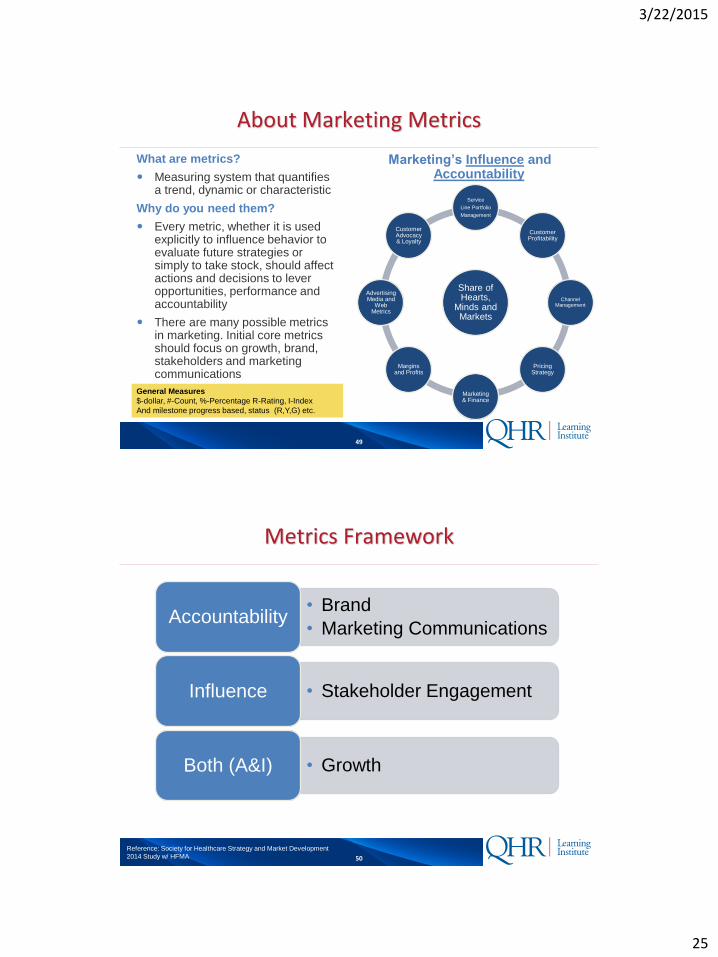
About Marketing Metrics
What are metrics?
Measuring system that quantifies a trend, dynamic or characteristic
Why do you need them?
Every metric, whether it is used explicitly to influence behavior to evaluate future strategies or simply to take stock, should affect actions and decisions to lever opportunities, performance and accountability
There are many possible metrics in marketing. Initial core metrics should focus on growth, brand, stakeholders and marketing communications
Marketing’s Influence and Accountability
Share of Hearts,
Minds and Markets
Service
Line Portfolio
Management
Customer Profitability
Channel Management
Pricing Strategy
Marketing & Finance
Margins and Profits
Advertising Media and
Web Metrics
Customer Advocacy & Loyalty
General Measures
$-dollar, #-Count, %-Percentage R-Rating, I-Index
And milestone progress based, status (R,Y,G) etc.
50
Metrics Framework
• Brand
• Marketing CommunicationsAccountability
• Stakeholder EngagementInfluence
• GrowthBoth (A&I)
Reference: Society for Healthcare Strategy and Market Development
2014 Study w/ HFMA
3/22/2015
26
51
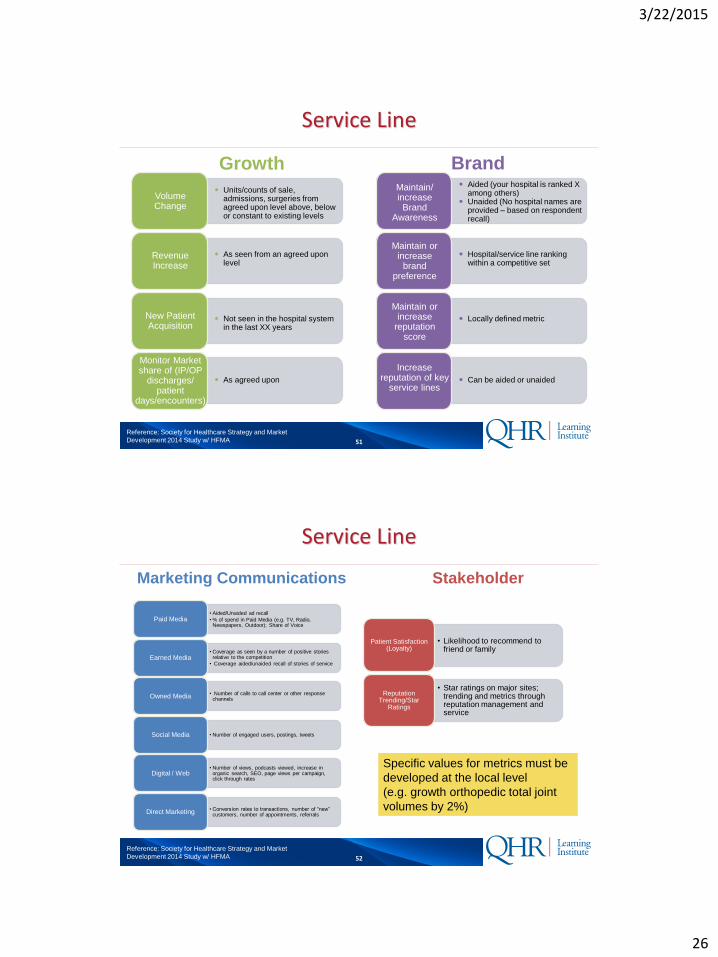
Service Line
Growth Brand
Reference: Society for Healthcare Strategy and Market
Development 2014 Study w/ HFMA
Units/counts of sale, admissions, surgeries from agreed upon level above, below or constant to existing levels
As seen from an agreed upon level
Not seen in the hospital system in the last XX years
As agreed upon
Monitor Market share of (IP/OP
discharges/ patient
days/encounters)
New Patient Acquisition
Revenue Increase
Volume Change
Aided (your hospital is ranked X among others)
Unaided (No hospital names are provided – based on respondent recall)
Hospital/service line ranking within a competitive set
Locally defined metric
Can be aided or unaided
Increase reputation of key
service lines
Maintain or increase
reputation score
Maintain or increase
brand preference
Maintain/ increase Brand
Awareness
52
Service Line
Marketing Communications Stakeholder
Reference: Society for Healthcare Strategy and Market
Development 2014 Study w/ HFMA
• Aided/Unaided ad recall
• % of spend in Paid Media (e.g. TV, Radio, Newspapers, Outdoor); Share of Voice
Paid Media
• Coverage as seen by a number of positive stories relative to the competition
• Coverage aided/unaided recall of stories of serviceEarned Media
• Number of calls to call center or other response channelsOwned Media
• Number of engaged users, postings, tweets Social Media
• Number of views, podcasts viewed, increase in organic search, SEO, page views per campaign, click through rates
Digital / Web
• Conversion rates to transactions, number of “new” customers, number of appointments, referralsDirect Marketing
• Likelihood to recommend to friend or family
Patient Satisfaction (Loyalty)
• Star ratings on major sites; trending and metrics through reputation management and service
Reputation Trending/Star
Ratings
Specific values for metrics must be
developed at the local level
(e.g. growth orthopedic total joint
volumes by 2%)
3/22/2015
27
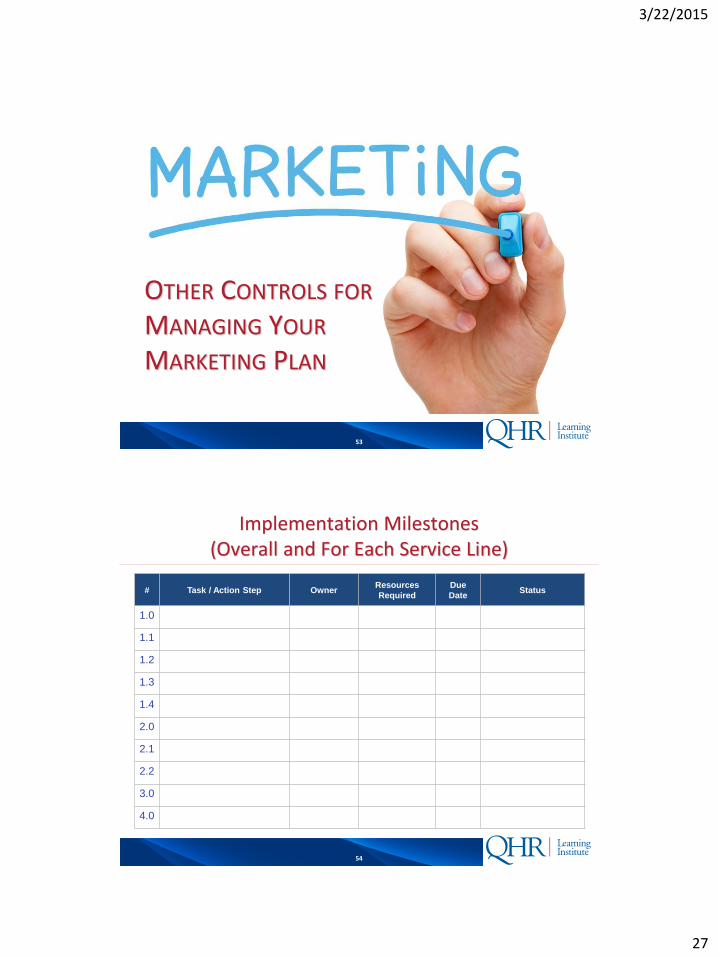
53
OTHER CONTROLS FOR
MANAGING YOUR
MARKETING PLAN
54
Implementation Milestones (Overall and For Each Service Line)
# Task / Action Step OwnerResources
Required
Due
DateStatus
1.0
1.1
1.2
1.3
1.4
2.0
2.1
2.2
3.0
4.0
3/22/2015
28
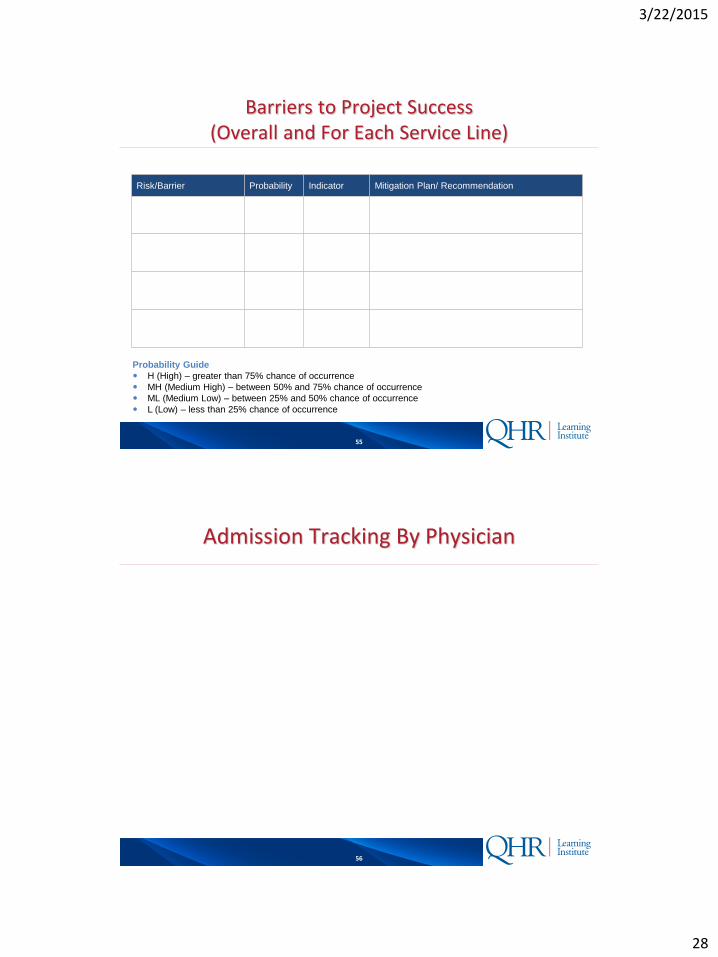
55
Barriers to Project Success (Overall and For Each Service Line)
Risk/Barrier Probability Indicator Mitigation Plan/ Recommendation
Probability Guide
H (High) – greater than 75% chance of occurrence
MH (Medium High) – between 50% and 75% chance of occurrence
ML (Medium Low) – between 25% and 50% chance of occurrence
L (Low) – less than 25% chance of occurrence
56
Admission Tracking By Physician
3/22/2015
29
57
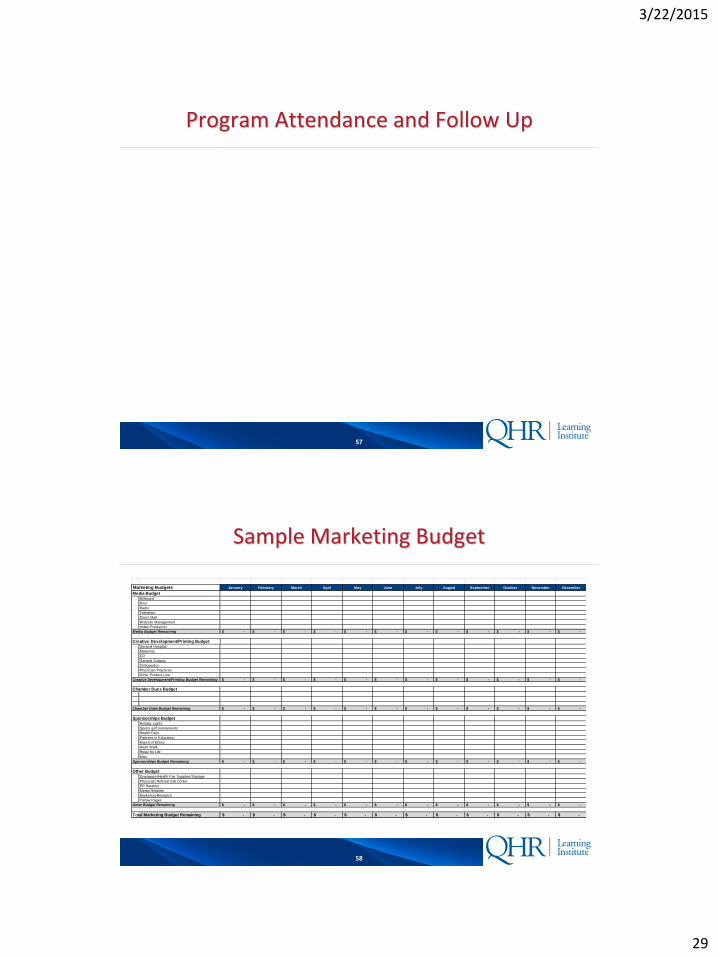
Program Attendance and Follow Up
58
Sample Marketing Budget
Marketing Budgets January February March April May June July August September October November December
Media Budget
Billboard
Radio
Television
Direct Mail
Website Management
Video Producton
Media Budget Remaining -$ -$ -$ -$ -$ -$ -$ -$ -$ -$ -$ -$
Creative Development/Printing Budget
General Hospital
Maternity
ER
General Surgery
Orthopedics
Physician Practices
Other Product Line
Creative Development/Printing Budget Remaining -$ -$ -$ -$ -$ -$ -$ -$ -$ -$ -$ -$
Chamber Dues Budget
Chamber Dues Budget Remaining -$ -$ -$ -$ -$ -$ -$ -$ -$ -$ -$ -$
Sponsorships Budget
Holiday Lights
Sports golf tournaments
Health Fairs
Partners in Education
March of Dimes
Heart Walk
Relay for Life
Misc
Sponsorships Budget Remaining -$ -$ -$ -$ -$ -$ -$ -$ -$ -$ -$ -$
Other Budget
Giveaways/Health Fair Supplies/Signage
Physician Referral Call Center
PR Retainer
Media Retainer
Marketing Research
Yellow Pages
Other Budget Remaining -$ -$ -$ -$ -$ -$ -$ -$ -$ -$ -$ -$
Total Marketing Budget Remaining -$ -$ -$ -$ -$ -$ -$ -$ -$ -$ -$ -$