Embed Size (px)
Citation preview

Tutorial
MDM Policy & Practice1–7� The Author(s) 2020Article reuse guidelines:sagepub.com/journals-permissionsDOI: 10.1177/2381468320963068journals.sagepub.com/home/mdm
How to Determine When SARS-CoV-2
Antibody Testing Is or Is Not Useful forPopulation Screening: A Tutorial
Niklas Keller , and Mirjam A. Jenny
Abstract
Extensive testing lies at the heart of any strategy to effectively combat the SARS-COV-2 pandemic. In recentmonths, the use of enzyme-linked immunosorbent assay–based antibody tests has gained a lot of attention. Thesetests can potentially be used to assess SARS-COV-2 immunity status in individuals (e.g., essential health care per-sonnel). They can also be used as a screening tool to identify people that had COVID-19 asymptomatically, thusgetting a better estimate of the true spread of the disease, gain important insights on disease severity, and to betterevaluate the effectiveness of policy measures implemented to combat the pandemic. But the usefulness of thesetests depends not only on the quality of the test but also, critically, on how far disease has already spread in thepopulation. For example, when only very few people in a population are infected, a positive test result has a highchance of being a false positive. As a consequence, the spread of the disease in a population as well as individuals’immunity status may be systematically misinterpreted. SARS-COV-2 infection rates vary greatly across both timeand space. In many places, the infection rates are very low but can quickly skyrocket when the virus spreadsunchecked. Here, we present two tools, natural frequency trees and positive and negative predictive value graphs,that allow one to assess the usefulness of antibody testing for a specific context at a glance. These tools should beused to support individual doctor-patient consultation for assessing individual immunity status as well as toinform policy discussions on testing initiatives.
Keywords
diagnostic test interpretation, natural frequency trees, PPV/NPV graphs, SARS-CoV-2 antibody testing
Date received: May 26, 2020; accepted: August 25, 2020
ELISA-Based Antibody Tests Are Increasingly
Administered
Extensive testing lies at the heart of any strategy to effec-tively combat the severe acute respiratory syndrome cor-onavirus 2 (SARS-CoV-2) pandemic. While the test foracute infection by use of polymerase chain reaction(PCR) has been at the forefront in the initial phases ofthe pandemic, in recent months, the use of enzyme-linkedimmunosorbent assay (ELISA)-based antibody tests hasgained a lot of attention with two primary goals in mind:to identify persons who may be immune to the disease,particularly those working in critical areas of infrastructure
(e.g., essential healthcare personnel),* and to assess thenumber of people that have been infected in a particularpopulation including all those who have perhaps gonethrough the infection with no or only mild symptoms.
This Creative Commons Non Commercial CC BY-NC: This article is distributed under the terms of the Creative Commons
Attribution-NonCommercial 4.0 License (http://creativecommons.org/licenses/by-nc/4.0/) which permits non-commercial use,
reproduction and distribution of the work without further permission provided the original work is attributed as specified on the SAGE and
Open Access pages (https://us.sagepub.com/en-us/nam/open-access-at-sage).
*Note that we currently do not know whether people who have recov-
ered from COVID-19 and have antibodies are protected from a second
infection and, if so, for how long.
Corresponding Author
Niklas Keller, Simply Rational—The Decision Institute, Eberhard-
Roters-Platz 7a, Berlin DE 10965, Germany;
Telephone: +49 176 2041 8755 ([email protected]).
Knowing this would provide valuable insights on hospi-talization and mortality rates, which is critical for esti-mating the burden of the pandemic on the health caresystem as well as assessing the effectiveness of policymeasures designed to curb the spread of the virus.Subsequently, while PCR testing to identify acute infec-tions and disrupt transmission chains remains central,many nations and institutions are in the process of roll-ing out antibody testing initiatives (e.g., China, theUnited States, Spain, Switzerland).1-5
The Interpretation of These Test Results
Depends on the Specific Context
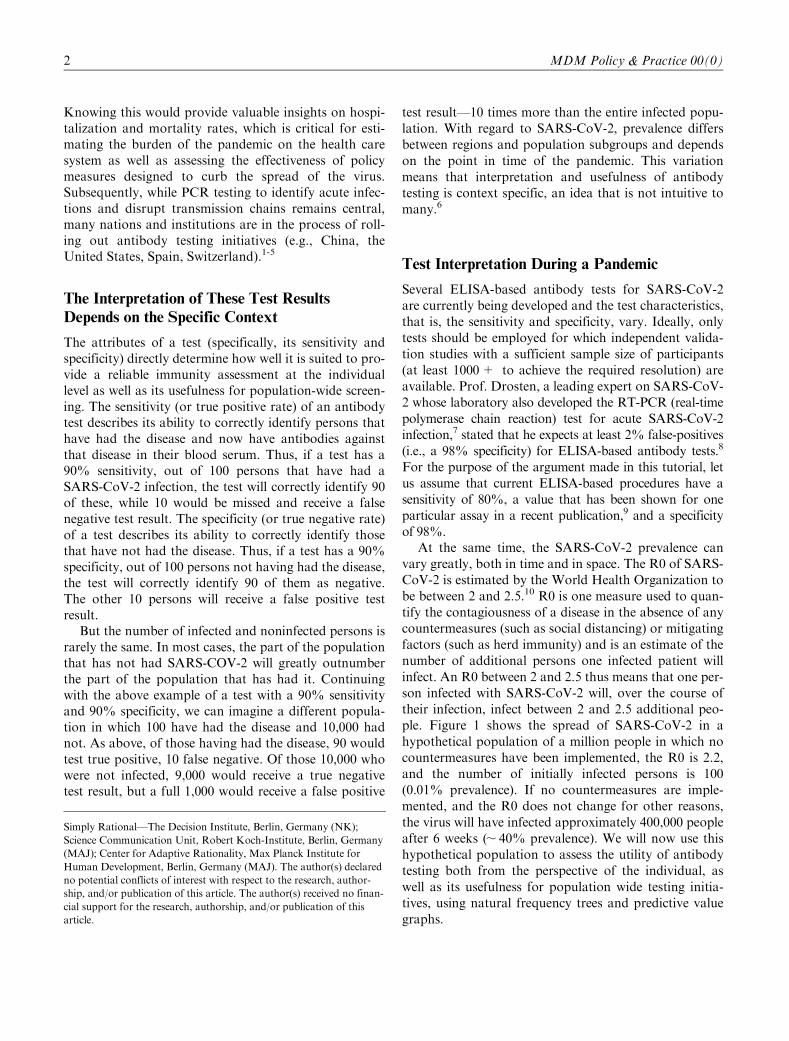
The attributes of a test (specifically, its sensitivity andspecificity) directly determine how well it is suited to pro-vide a reliable immunity assessment at the individuallevel as well as its usefulness for population-wide screen-ing. The sensitivity (or true positive rate) of an antibodytest describes its ability to correctly identify persons thathave had the disease and now have antibodies againstthat disease in their blood serum. Thus, if a test has a90% sensitivity, out of 100 persons that have had aSARS-CoV-2 infection, the test will correctly identify 90of these, while 10 would be missed and receive a falsenegative test result. The specificity (or true negative rate)of a test describes its ability to correctly identify thosethat have not had the disease. Thus, if a test has a 90%specificity, out of 100 persons not having had the disease,the test will correctly identify 90 of them as negative.The other 10 persons will receive a false positive testresult.
But the number of infected and noninfected persons israrely the same. In most cases, the part of the populationthat has not had SARS-COV-2 will greatly outnumberthe part of the population that has had it. Continuingwith the above example of a test with a 90% sensitivityand 90% specificity, we can imagine a different popula-tion in which 100 have had the disease and 10,000 hadnot. As above, of those having had the disease, 90 wouldtest true positive, 10 false negative. Of those 10,000 whowere not infected, 9,000 would receive a true negativetest result, but a full 1,000 would receive a false positive
test result—10 times more than the entire infected popu-lation. With regard to SARS-CoV-2, prevalence differsbetween regions and population subgroups and dependson the point in time of the pandemic. This variationmeans that interpretation and usefulness of antibodytesting is context specific, an idea that is not intuitive tomany.6
Test Interpretation During a Pandemic
Several ELISA-based antibody tests for SARS-CoV-2are currently being developed and the test characteristics,that is, the sensitivity and specificity, vary. Ideally, onlytests should be employed for which independent valida-tion studies with a sufficient sample size of participants(at least 1000+ to achieve the required resolution) areavailable. Prof. Drosten, a leading expert on SARS-CoV-2 whose laboratory also developed the RT-PCR (real-timepolymerase chain reaction) test for acute SARS-CoV-2infection,7 stated that he expects at least 2% false-positives(i.e., a 98% specificity) for ELISA-based antibody tests.8
For the purpose of the argument made in this tutorial, letus assume that current ELISA-based procedures have asensitivity of 80%, a value that has been shown for oneparticular assay in a recent publication,9 and a specificityof 98%.
At the same time, the SARS-CoV-2 prevalence canvary greatly, both in time and in space. The R0 of SARS-CoV-2 is estimated by the World Health Organization tobe between 2 and 2.5.10 R0 is one measure used to quan-tify the contagiousness of a disease in the absence of anycountermeasures (such as social distancing) or mitigatingfactors (such as herd immunity) and is an estimate of thenumber of additional persons one infected patient willinfect. An R0 between 2 and 2.5 thus means that one per-son infected with SARS-CoV-2 will, over the course oftheir infection, infect between 2 and 2.5 additional peo-ple. Figure 1 shows the spread of SARS-CoV-2 in ahypothetical population of a million people in which nocountermeasures have been implemented, the R0 is 2.2,and the number of initially infected persons is 100(0.01% prevalence). If no countermeasures are imple-mented, and the R0 does not change for other reasons,the virus will have infected approximately 400,000 peopleafter 6 weeks (; 40% prevalence). We will now use thishypothetical population to assess the utility of antibodytesting both from the perspective of the individual, aswell as its usefulness for population wide testing initia-tives, using natural frequency trees and predictive valuegraphs.
Simply Rational—The Decision Institute, Berlin, Germany (NK);
Science Communication Unit, Robert Koch-Institute, Berlin, Germany
(MAJ); Center for Adaptive Rationality, Max Planck Institute for
Human Development, Berlin, Germany (MAJ). The author(s) declared
no potential conflicts of interest with respect to the research, author-
ship, and/or publication of this article. The author(s) received no finan-
cial support for the research, authorship, and/or publication of this
article.
2 MDM Policy & Practice 00(0)

Using Natural Frequency Trees to Assess the
Usefulness of Antibody Testing for Individual
Immunity Assessment: What Does a Positive
Antibody Test Result Mean for the Person
Tested?
Let us assume a person enters a clinic without havinghad any symptoms or other known risk factors increasingtheir likelihood of having had the disease and wishes tobe tested for SARS-CoV-2 ‘‘immunity’’ via antibody test-ing at the beginning of the pandemic when the prevalenceis 0.01%. Another person wishes to be tested 6 weekslater when the prevalence is ; 40% (see red arrows inFigure 1). Both individuals test positive for SARS-CoV-2antibodies. How certain can we be, that these individualshad the disease? That is, given a positive test result, whatis the probability that the person really had the infection?This probability is what is called a ‘‘positive predictivevalue’’ and is calculated as the ratio of true positive testresults to all positive test results, both true and false.Calculating such a ‘‘conditional probability’’ (i.e., theprobability of having the disease given a positive testresult) is difficult for doctors, patients, and policy makersalike.11,12 But we can make the calculation more intuitiveusing Natural Frequency Trees (see Figure 2).13
Natural frequency trees (NFTs) graphically representhow a population (e.g., a million individuals) is sequen-tially divided into subpopulations (e.g., individuals affectedor not affected by a disease). By using NFTs, one can
quickly and intuitively assess the ratio of true positive testresults to all (true and false) positive test results (red boxesin Figure 2), that is, the positive predictive value (PPV) ofa diagnostic procedure. In the same fashion, the negativepredictive value (NPV) can be arrived at by assessing theratio of true negatives to all (true and false) negative testresults (green boxes in Figure 2). The NPV is the value weare looking for when we wish to answer the question:‘‘Given a negative test result, how likely is it, that that per-son really has not undergone a SARS-CoV-2 infection?’’
Figure 2 shows that at the beginning of the pandemic,the vast majority of positively tested cases will be falsepositives. Only about 1 in 250 individuals tested positivein this phase will have tested positive due to an actualprior SARS-CoV-2 infection. The situation is very differ-ent for the second person being tested 6 weeks later (seeFigure 3).
Six weeks later, the vast majority of positively testedcases will be true positives. In this phase, roughly 24 outof 25 positive test results will be due to a prior SARS-CoV-2 infection.
When Should Antibody Testing Be Used
for Population-Based Screening?
NFTs present a simple and intuitive graphical format,which can be used to explain a test’s predictive values toindividuals both prior to testing (‘‘does it make sense toget tested?’’) as well as afterwards (‘‘what does the test
Figure 1 Number of people having undergone a SARS-CoV-2 infection in a hypothetical population of 1,000,000 persons givenR0 = 2.2 and with no mitigating measures implemented. Green bars represent the number of persons having undergone aSARS-CoV-2 infection. Red arrows represent two hypothetical points in time for antibody testing during the pandemic.
Keller and Jenny 3

result imply?’’). However, they only allow calculation ofspecific PPVs/NPVs given a specific prevalence. To decidewhen the prevalence of the disease is high enough for anti-body tests to become useful as a screening-tool, we canuse a PPV/NPV graph (Keller, Timiliotis, McDowell, andBenz, 2020, unpublished data). A PPV/NPV graph showsthe likelihood of a true test result across the entire preva-lence spectrum, given the specific test characteristics.
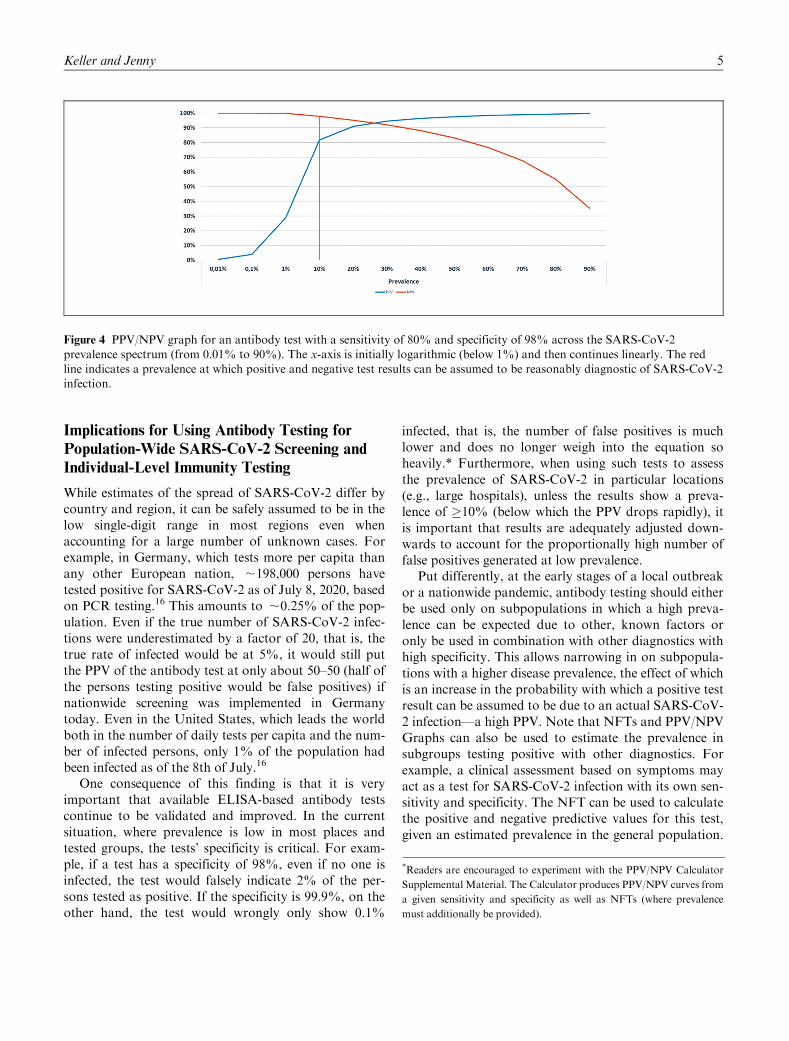
Figure 4 shows a PPV/NPV graph for antibody testsgiven a sensitivity of 80% and a specificity of 98%.From the graph it can be seen that population screening
for SARS-CoV-2 in situations of low prevalence is noteffective as the positive predictive value remains very low(Figure 4). Only once we reach about 1% prevalence ofSARS-CoV-2 does the positive predictive value reachdouble digits and only once we reach about 10% preva-lence does the PPV reach a reasonable satisfactory;82% while maintaining a high NPV of ;98%. Notethat the decision when to implement population-basedscreening depends on the costs and harms attributed to thetest’s two possible errors: false positives as well as falsenegatives.14,15
Figure 3 Natural frequency tree for antibody testing 6 weeks later with a SARS-CoV-2 prevalence of around 40%.
Figure 2 Natural frequency tree for antibody testing at the beginning of the pandemic with a SARS-CoV-2 prevalence of 0.01%.
4 MDM Policy & Practice 00(0)
Implications for Using Antibody Testing for
Population-Wide SARS-CoV-2 Screening and
Individual-Level Immunity Testing
While estimates of the spread of SARS-CoV-2 differ bycountry and region, it can be safely assumed to be in thelow single-digit range in most regions even whenaccounting for a large number of unknown cases. Forexample, in Germany, which tests more per capita thanany other European nation, ;198,000 persons havetested positive for SARS-CoV-2 as of July 8, 2020, basedon PCR testing.16 This amounts to ;0.25% of the pop-ulation. Even if the true number of SARS-CoV-2 infec-tions were underestimated by a factor of 20, that is, thetrue rate of infected would be at 5%, it would still putthe PPV of the antibody test at only about 50–50 (half ofthe persons testing positive would be false positives) ifnationwide screening was implemented in Germanytoday. Even in the United States, which leads the worldboth in the number of daily tests per capita and the num-ber of infected persons, only 1% of the population hadbeen infected as of the 8th of July.16
One consequence of this finding is that it is veryimportant that available ELISA-based antibody testscontinue to be validated and improved. In the currentsituation, where prevalence is low in most places andtested groups, the tests’ specificity is critical. For exam-ple, if a test has a specificity of 98%, even if no one isinfected, the test would falsely indicate 2% of the per-sons tested as positive. If the specificity is 99.9%, on theother hand, the test would wrongly only show 0.1%
infected, that is, the number of false positives is muchlower and does no longer weigh into the equation soheavily.* Furthermore, when using such tests to assessthe prevalence of SARS-CoV-2 in particular locations(e.g., large hospitals), unless the results show a preva-lence of �10% (below which the PPV drops rapidly), itis important that results are adequately adjusted down-wards to account for the proportionally high number offalse positives generated at low prevalence.
Put differently, at the early stages of a local outbreakor a nationwide pandemic, antibody testing should eitherbe used only on subpopulations in which a high preva-lence can be expected due to other, known factors oronly be used in combination with other diagnostics withhigh specificity. This allows narrowing in on subpopula-tions with a higher disease prevalence, the effect of whichis an increase in the probability with which a positive testresult can be assumed to be due to an actual SARS-CoV-2 infection—a high PPV. Note that NFTs and PPV/NPVGraphs can also be used to estimate the prevalence insubgroups testing positive with other diagnostics. Forexample, a clinical assessment based on symptoms mayact as a test for SARS-CoV-2 infection with its own sen-sitivity and specificity. The NFT can be used to calculatethe positive and negative predictive values for this test,given an estimated prevalence in the general population.
Figure 4 PPV/NPV graph for an antibody test with a sensitivity of 80% and specificity of 98% across the SARS-CoV-2prevalence spectrum (from 0.01% to 90%). The x-axis is initially logarithmic (below 1%) and then continues linearly. The redline indicates a prevalence at which positive and negative test results can be assumed to be reasonably diagnostic of SARS-CoV-2infection.
*Readers are encouraged to experiment with the PPV/NPV Calculator
Supplemental Material. The Calculator produces PPV/NPV curves from
a given sensitivity and specificity as well as NFTs (where prevalence
must additionally be provided).
Keller and Jenny 5
The resulting PPV is nothing other than the prevalenceof the disease in the subpopulation of people with thesesymptoms.
There is a seeming paradox here: When using anti-body tests to estimate the true spread of SARS-CoV-2 inthe general population, one must know the prevalencefirst. But it is possible to evaluate its usefulness for esti-mating the overall infection rate in the population in lightof other, more robust indicators for the spread of the dis-ease in a (sub)population such as the local SARS-CoV-2hospitalization, intensive care unit admission, and mor-tality rates. Ideally, antibody studies should include acomparator region with low disease activity as indicatedby these measures. This allows a rough estimate of thesize of the over- or underdiagnosis of the prevalenceassessment in the region of interest. Note that this appliessimilarly to assessing individuals. Comorbidities, expo-sure at the workplace, and other factors may influencethe prior probability estimate of having had the disease(which in a population-screening context is the preva-lence). A clinician seeing a patient with, for example, ahigh exposure workplace or past mild symptoms (with-out a positive PCR result) may wish to use available evi-dence or her clinical intuition to update the priorprobability of the patient presenting having had COVID-19. The NFT or PPV/NPV graph can then be applied asit is presented in this tutorial. However, in the individualcontext, the behavioral consequences of test results needcareful consideration. There is a high potential to elicitextremely risky behaviors from those who tested posi-tively for immunity status, including those with falsepositives. Such persons may be more likely to exposethemselves to SARS-CoV-2 infected persons, may prefer-entially work with vulnerable groups, or reduce hygieneand other protective measures, perhaps in order to saveequipment at their place of work, thus creating situationsof high SARS-CoV-2 transmission risk for themselvesand others.
Individuals as well as the larger public should beinformed about the possibilities and likelihood of falsepositives of antibody testing given estimates of local dis-ease prevalence. Similar calls have been made to informpatients about the accuracy of PCR testing for acuteCOVID-19 infection17 and the principles and tools dis-cussed here apply to all diagnostic testing procedures.To this end, we suggest using natural frequency treesand PPV/NPV graphs to support both, doctor-patientconsultations as well as policy discussions and publiccommunication.
Authors’ Note
Epidemic simulations have been generated using freely availablesoftware (https://gabgoh.github.io/COVID/index.html). Noadditional data have been gathered or generated for the pur-pose of this article.No patients were involved in this study.
ORCID iD
Niklas Keller https://orcid.org/0000-0003-4394-9788
Supplemental Material
Supplementary material for this article is available on theMedical Decision Making Policy & Practice website at https://journals.sagepub.com/home/mpp.
References
1. Xu X, Sun J, Nie S, et al. Seroprevalence of immunoglobu-
lin M and G antibodies against SARS-CoV-2 in China. Nat
Med. 2020;26(8):1193–5. doi:10.1038/s41591-020-0949-62. Sood N, Simon P, Ebner P, et al. Seroprevalence of
SARS-CoV-2-specific antibodies among adults in Los
Angeles county, California, on April 10–11, 2020. JAMA.
2020;323(23):2425–27.3. Pollan M, Perez-Gomez B, Pastor-Barriuso R, et al. Preva-
lence of SARS-CoV-2 in Spain (ENE-COVID): a nation-
wide, population-based seroepidemiological study. Lancet.
2020;396(10250):535–44. doi:10.1016/S0140-6736(20)31483-54. Stringhini S, Wisniak A, Piumatti G, et al. Seroprevalence
of anti-SARS-CoV-2 IgG antibodies in Geneva, Switzer-
land (SEROCoV-POP): a population-based study. Lancet.
2020;396(10247):313–9. doi:10.1016/S0140-6736(20)31304-05. Ng D, Goldgof G, Shy B, et al. SARS-CoV-2 seropreva-
lence and neutralizing activity in donor and patient blood
from the San Francisco Bay area. medRxiv. Published
online May 27, 2020. doi:10.1101/2020.05.19.201074826. Austin LC. Physician and nonphysician estimates of posi-
tive predictive value in diagnostic v. mass screening mam-
mography: an examination of Bayesian reasoning. Med Decis
Making. 2019;39(2):108–18. doi:10.1177/0272989X188237577. Corman VM, Landt O, Kaiser M, et al. Detection of 2019
novel coronavirus (2019-nCoV) by real-time RT-PCR. Euro
Surveill. 2020;25(3):2000045. doi:10.2807/1560-7917.ES.2020
.25.3.20000458. Drosten C, Hennig C. The coronavirus update from NDR
info [in German; cited April 21, 2020]. Norddeutscher Rund-
funk. Available from: https://www.ndr.de/nachrichten/info/
podcast4684.html9. Bendavid E, Mulaney B, Sood N, et al. COVID-19 anti-
body seroprevalence in Santa Clara County, California.
medRxiv. Published online April 30, 2020. doi:10.1101/
2020.04.14.20062463
6 MDM Policy & Practice 00(0)
10. World Health Organization. Report of the WHO-China
Joint Mission on Coronavirus Disease 2019 (COVID-19).World Health Organization; 2020.
11. McDowell M, Jacobs P. Meta-analysis of the effect of nat-ural frequencies on Bayesian reasoning. Psychol Bull.2017;143:1273–312. doi:10.1037/bul0000126.
12. Jenny MA, Keller N, Gigerenzer G. Assessing minimalmedical statistical literacy using the Quick Risk Test: a pro-spective observational study in Germany. BMJ Open. 20188:e020847. doi:10.1136/bmjopen-2017-020847
13. Hoffrage U, Gigerenzer G. Using natural frequencies toimprove diagnostic inferences. Acad Med. 1998;73(5):538–40. doi:10.1097/00001888-199805000-00024
14. Brodersen J, Siersma VD. Long-term psychosocial conse-
quences of false-positive screening mammography. Ann
Fam Med. 2013;11:106–15. doi:10.1370/afm.146615. Bleyer A, Welch HG. Effect of three decades of screening
mammography on breast-cancer incidence. N Engl J Med.
2012;367(21):1998–2005. doi:10.1056/NEJMoa120680916. John Hopkins University, Coronavirus Resource Centre
[cited September 16, 2020]. Available from: https://corona-
virus.jhu.edu/map.html17. Watson J, Whiting PF, Brush JE. Interpreting a covid-19
test result. BMJ. 2020;369:m1808. doi:10.1136/bmj.m1808
Keller and Jenny 7