Embed Size (px)
Citation preview
How to Day
Trade for a
Living
A Beginner’s Guide to Tools
and Tactics, Money
Management, Discipline and
Trading Psychology
© Andrew Aziz, Ph.D. Day Trader at Bear Bull Traders
www.bearbulltraders.com
2
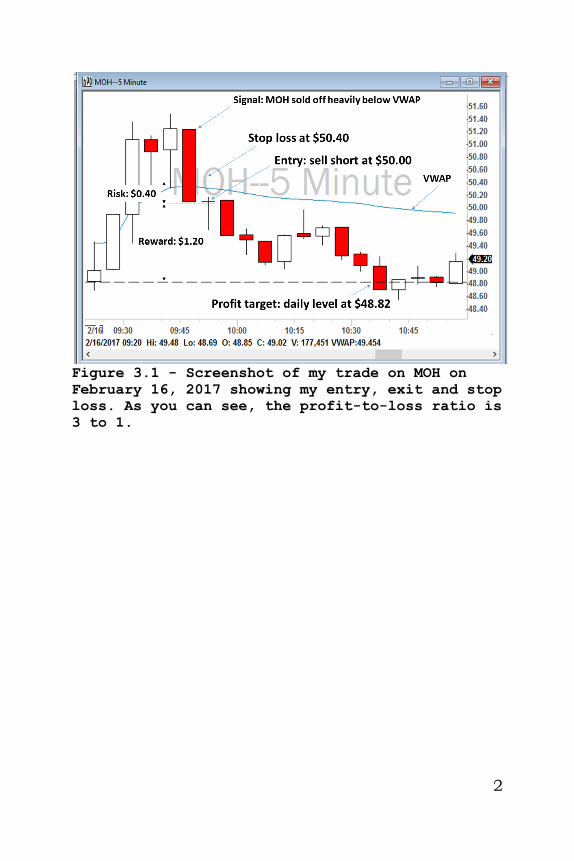
Figure 3.1 - Screenshot of my trade on MOH on
February 16, 2017 showing my entry, exit and stop
loss. As you can see, the profit-to-loss ratio is
3 to 1.
3
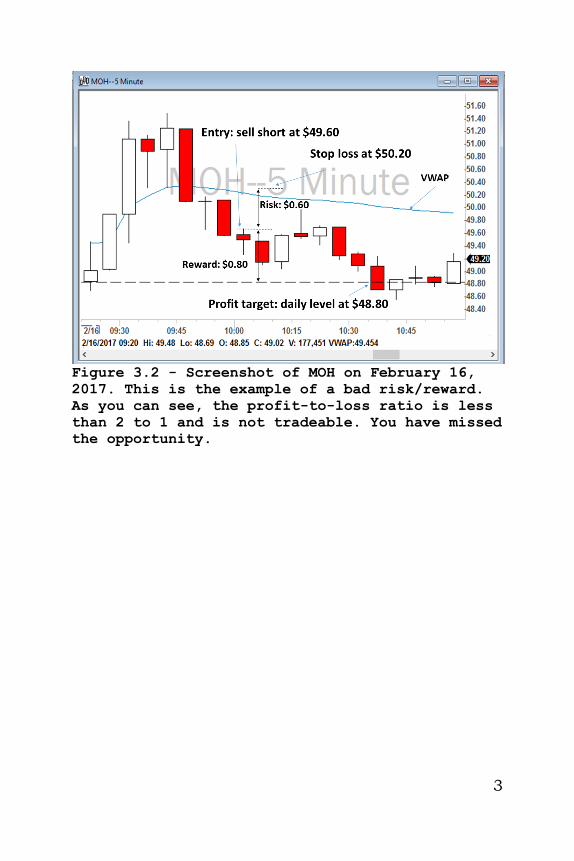
Figure 3.2 - Screenshot of MOH on February 16,
2017. This is the example of a bad risk/reward.
As you can see, the profit-to-loss ratio is less
than 2 to 1 and is not tradeable. You have missed
the opportunity.
4
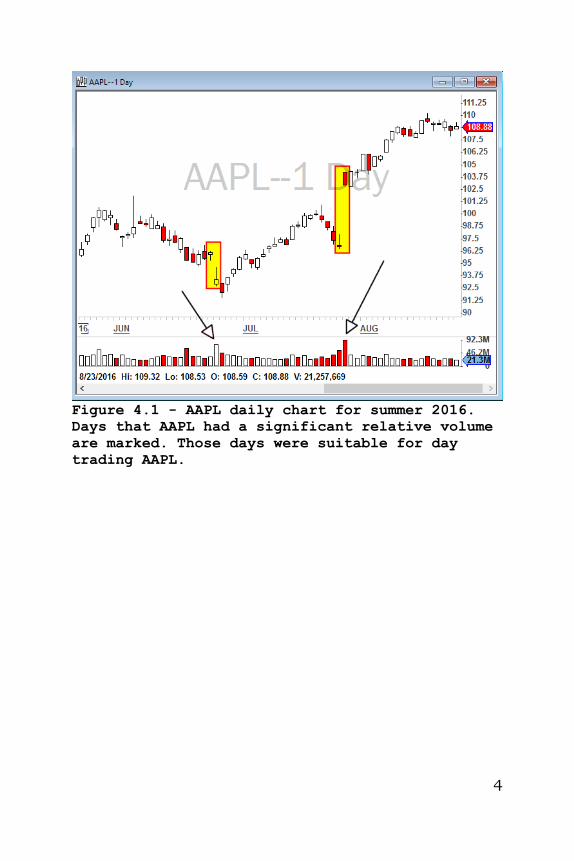
Figure 4.1 - AAPL daily chart for summer 2016.
Days that AAPL had a significant relative volume
are marked. Those days were suitable for day
trading AAPL.

5
The table below summarizes the three
categories of stocks based on float:
Float Price Range My Favorite
Strategy (Chapter
7)
Low float
(less than 10
million)
Under $10 Only Momentum
(Long)
Medium float
(10-500 million)
$10-$100 All, mostly VWAP
and Support or
Resistance
Large float
(+500 million)
Any
(usually
+$20)
All, mostly Moving
Average and
Reversal
6
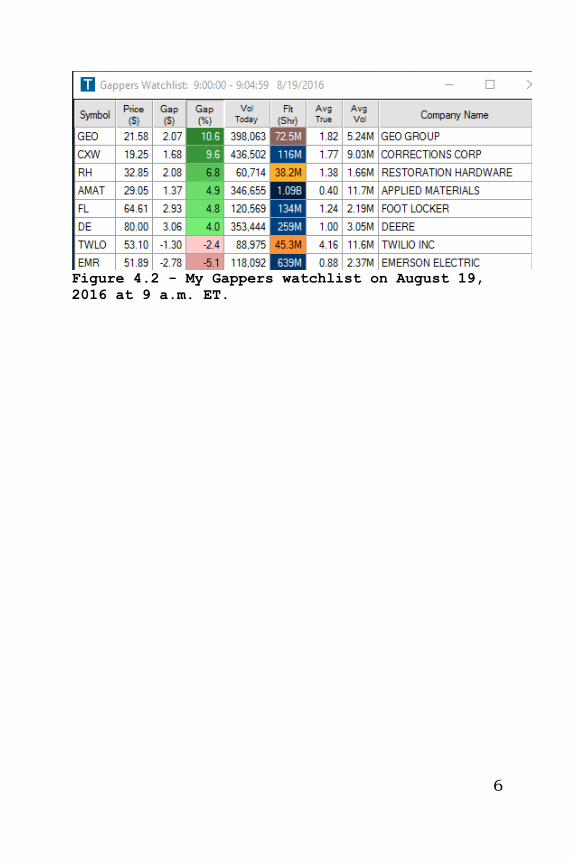
Figure 4.2 - My Gappers watchlist on August 19,
2016 at 9 a.m. ET.
7
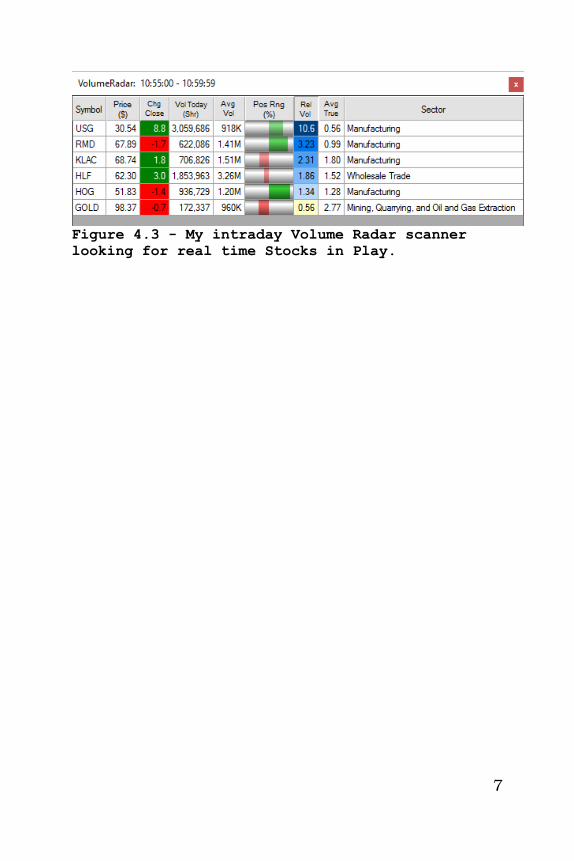
Figure 4.3 - My intraday Volume Radar scanner
looking for real time Stocks in Play.
8
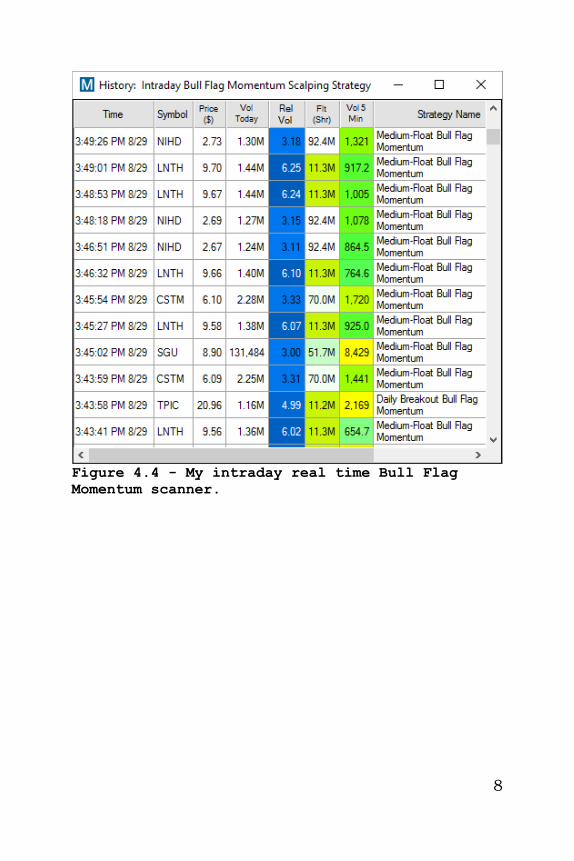
Figure 4.4 - My intraday real time Bull Flag
Momentum scanner.
9
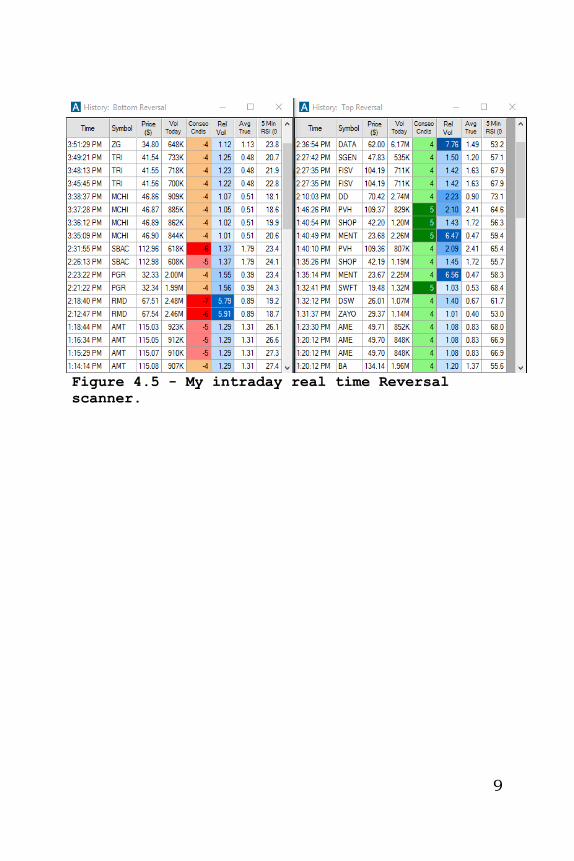
Figure 4.5 - My intraday real time Reversal
scanner.
10
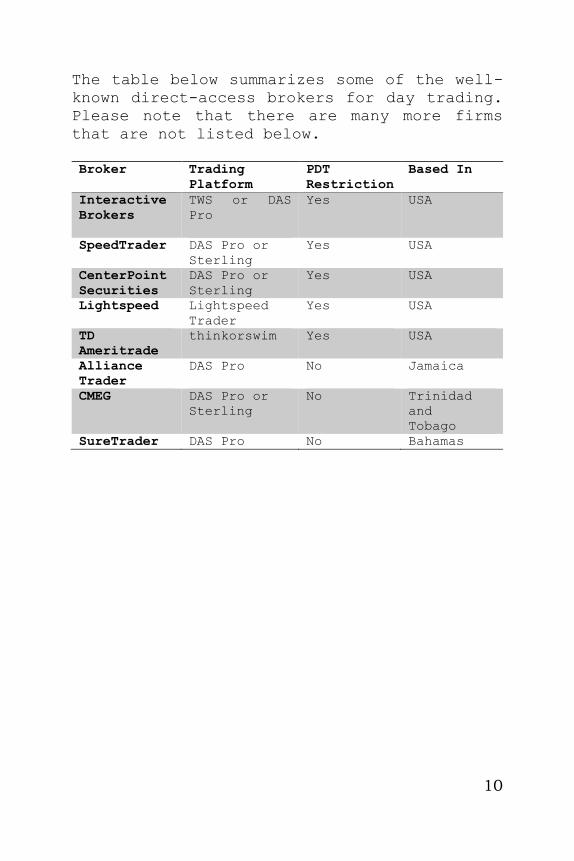
The table below summarizes some of the well-
known direct-access brokers for day trading.
Please note that there are many more firms
that are not listed below.
Broker Trading
Platform
PDT
Restriction
Based In
Interactive
Brokers
TWS or DAS
Pro
Yes USA
SpeedTrader DAS Pro or
Sterling
Yes USA
CenterPoint
Securities
DAS Pro or
Sterling
Yes USA
Lightspeed Lightspeed
Trader
Yes USA
TD
Ameritrade
thinkorswim Yes USA
Alliance
Trader
DAS Pro No Jamaica
CMEG DAS Pro or
Sterling
No Trinidad
and
Tobago
SureTrader DAS Pro No Bahamas
11
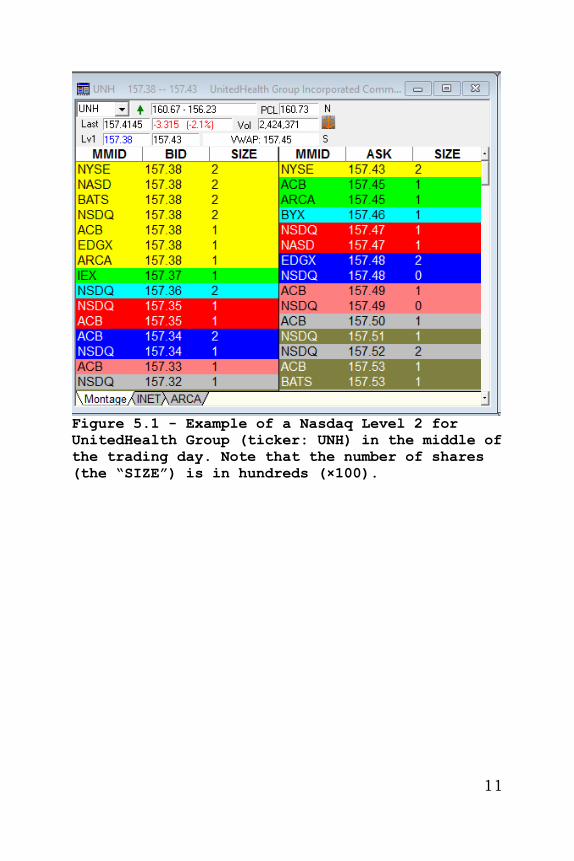
Figure 5.1 - Example of a Nasdaq Level 2 for
UnitedHealth Group (ticker: UNH) in the middle of
the trading day. Note that the number of shares
(the “SIZE”) is in hundreds (×100).
12
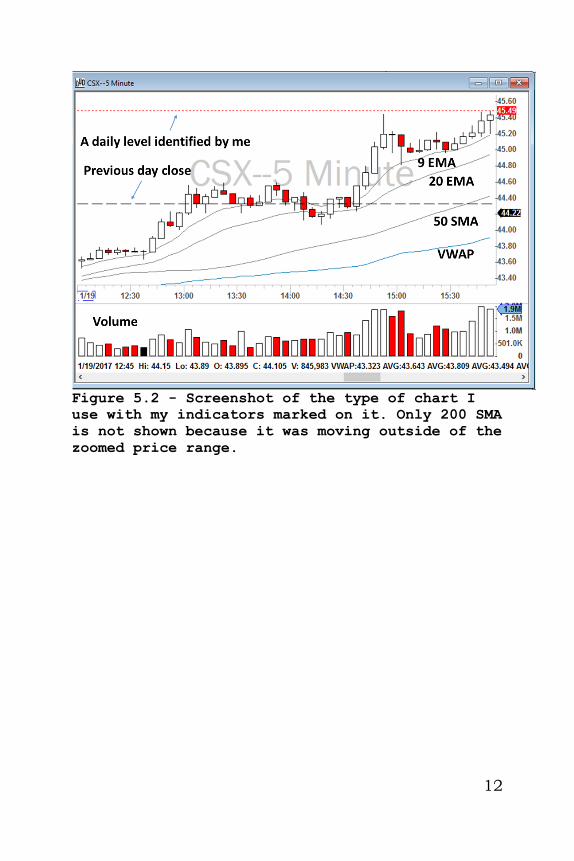
Figure 5.2 - Screenshot of the type of chart I
use with my indicators marked on it. Only 200 SMA
is not shown because it was moving outside of the
zoomed price range.
13
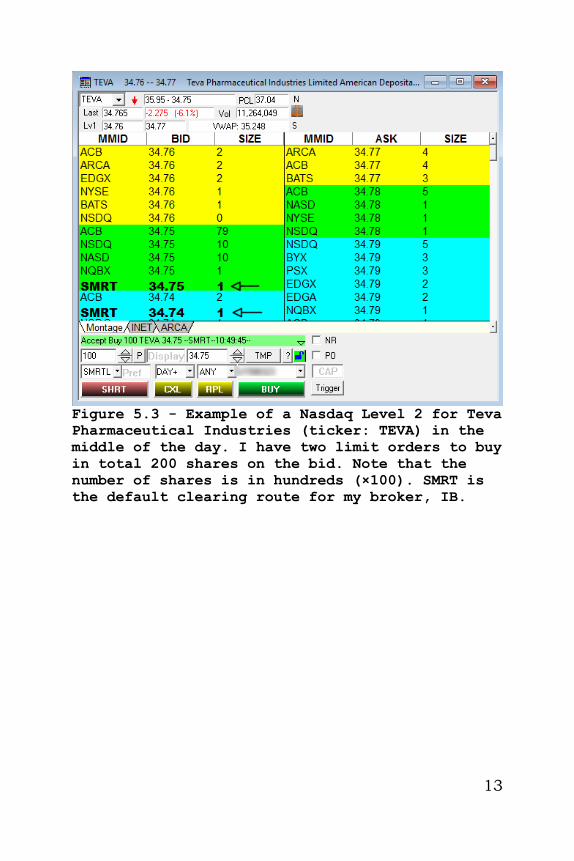
Figure 5.3 - Example of a Nasdaq Level 2 for Teva
Pharmaceutical Industries (ticker: TEVA) in the
middle of the day. I have two limit orders to buy
in total 200 shares on the bid. Note that the
number of shares is in hundreds (×100). SMRT is
the default clearing route for my broker, IB.
14
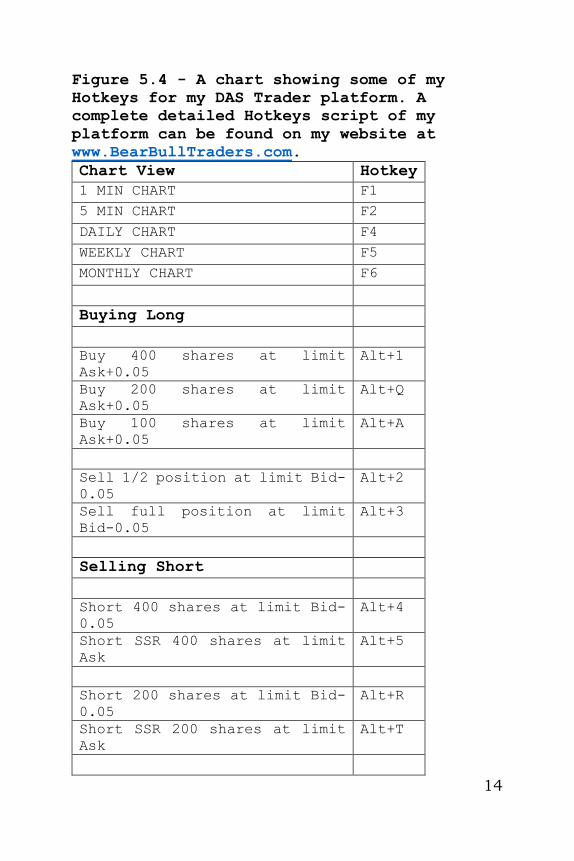
Figure 5.4 - A chart showing some of my
Hotkeys for my DAS Trader platform. A
complete detailed Hotkeys script of my
platform can be found on my website at
www.BearBullTraders.com.
Chart View Hotkey
1 MIN CHART F1
5 MIN CHART F2
DAILY CHART F4
WEEKLY CHART F5
MONTHLY CHART F6
Buying Long
Buy 400 shares at limit
Ask+0.05
Alt+1
Buy 200 shares at limit
Ask+0.05
Alt+Q
Buy 100 shares at limit
Ask+0.05
Alt+A
Sell 1/2 position at limit Bid-
0.05
Alt+2
Sell full position at limit
Bid-0.05
Alt+3
Selling Short
Short 400 shares at limit Bid-
0.05
Alt+4
Short SSR 400 shares at limit
Ask
Alt+5
Short 200 shares at limit Bid-
0.05
Alt+R
Short SSR 200 shares at limit
Ask
Alt+T
15
Short 100 shares at limit Bid-
0.05
Alt+F
Short SSR 100 shares at limit
Ask
Alt+G
Buy to cover 1/2 position at
limit Ask+0.05
Alt+6
Buy to cover full position at
limit Ask+0.05
Alt+7
16
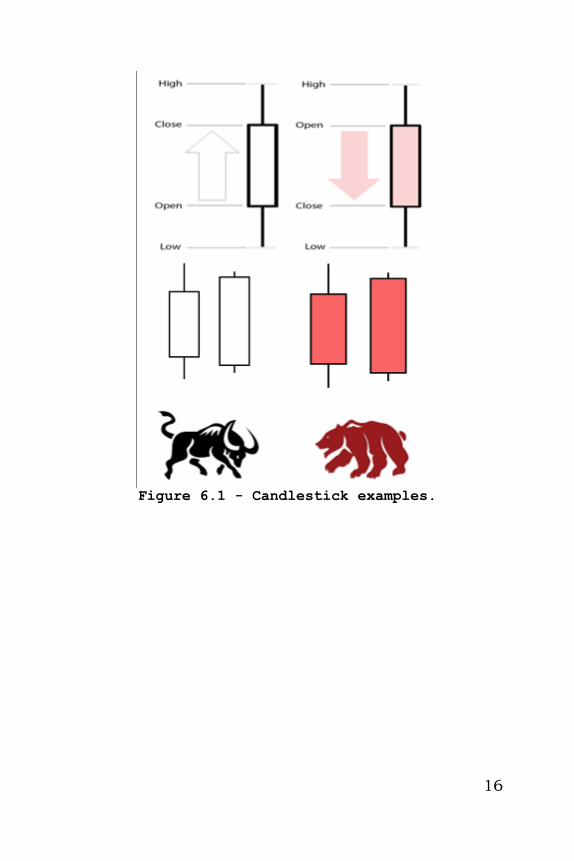
Figure 6.1 - Candlestick examples.
17
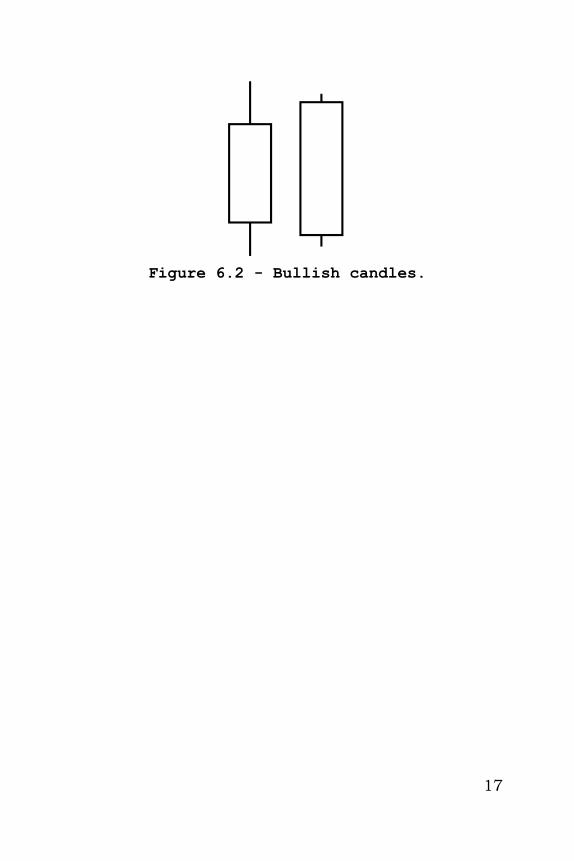
Figure 6.2 - Bullish candles.
18
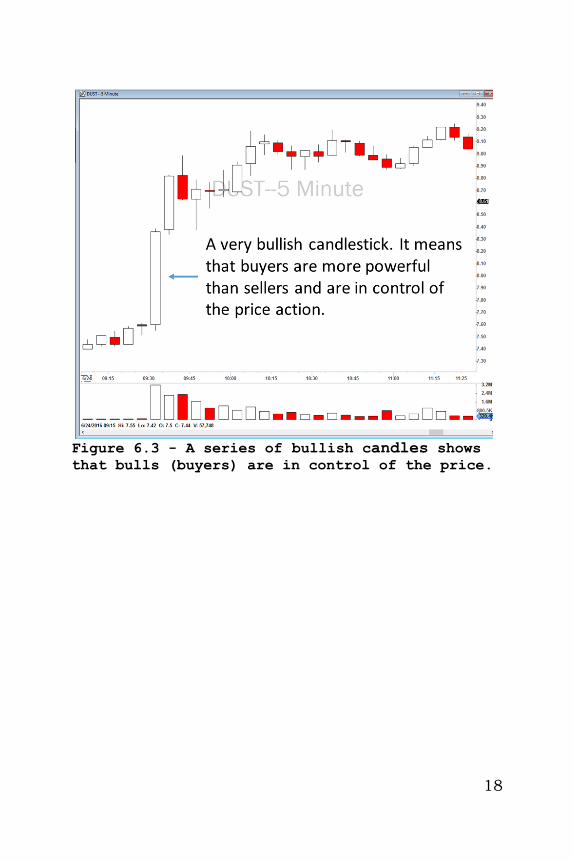
Figure 6.3 - A series of bullish candles shows
that bulls (buyers) are in control of the price.
19
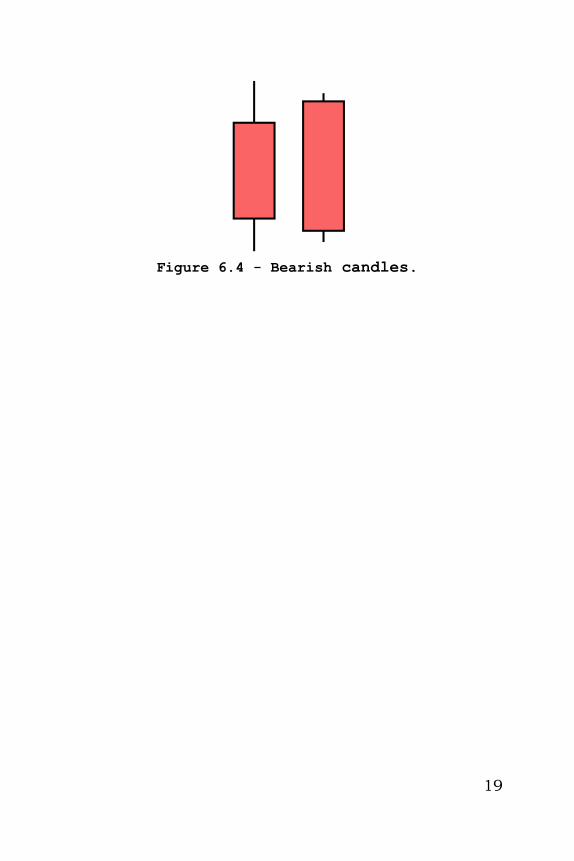
Figure 6.4 - Bearish candles.
20
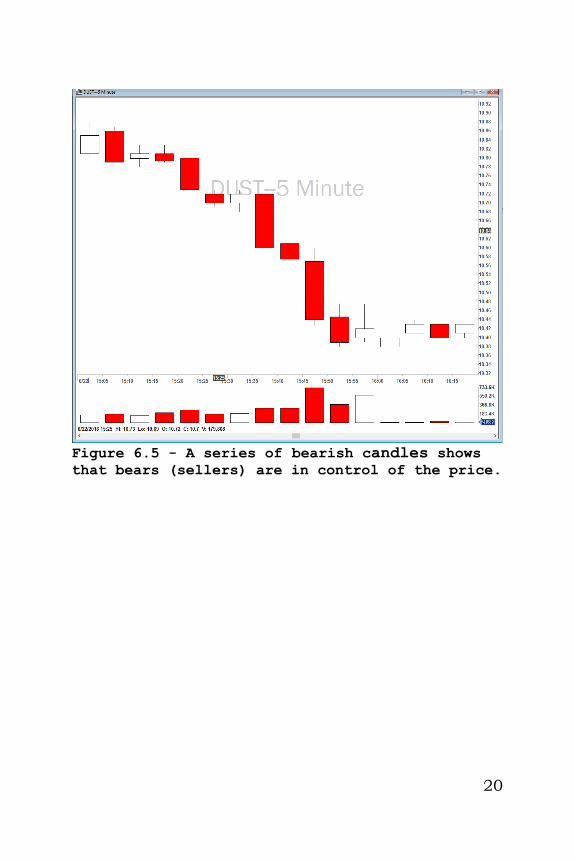
Figure 6.5 - A series of bearish candles shows
that bears (sellers) are in control of the price.
21
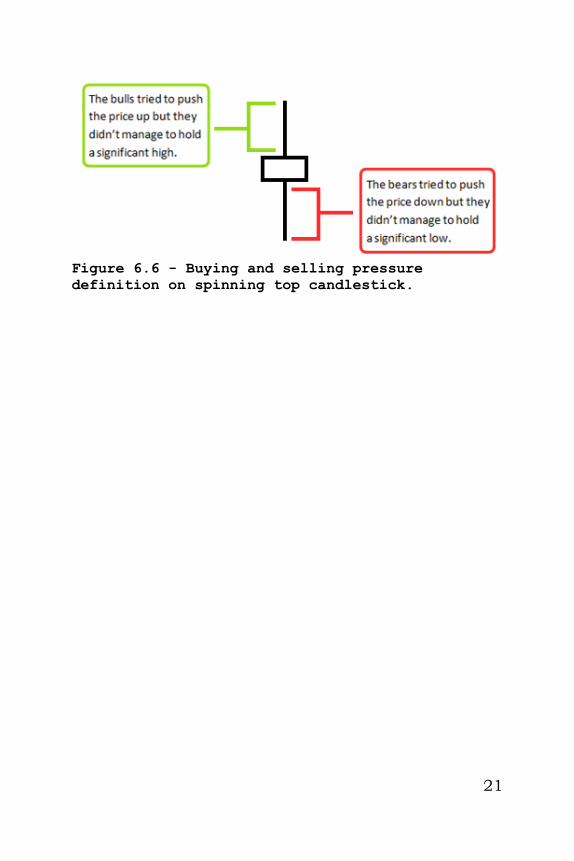
Figure 6.6 - Buying and selling pressure
definition on spinning top candlestick.
22
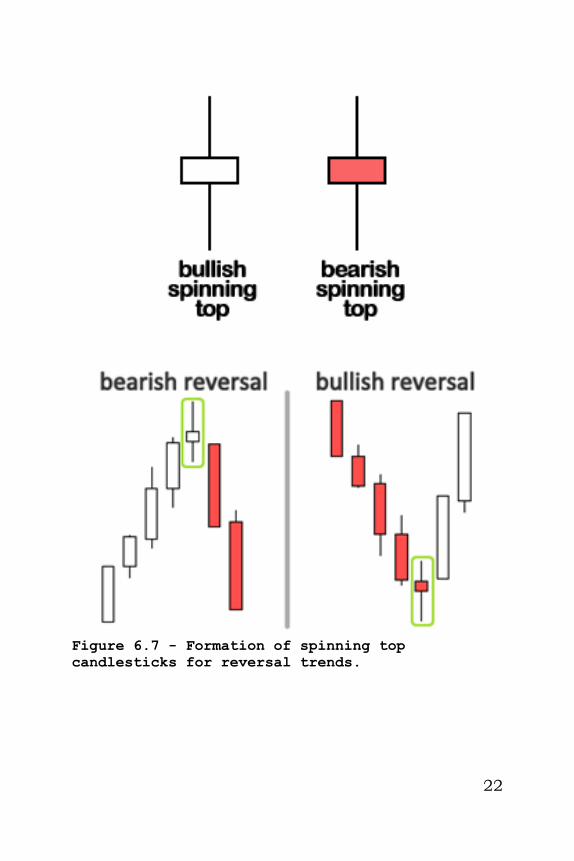
Figure 6.7 - Formation of spinning top
candlesticks for reversal trends.
23
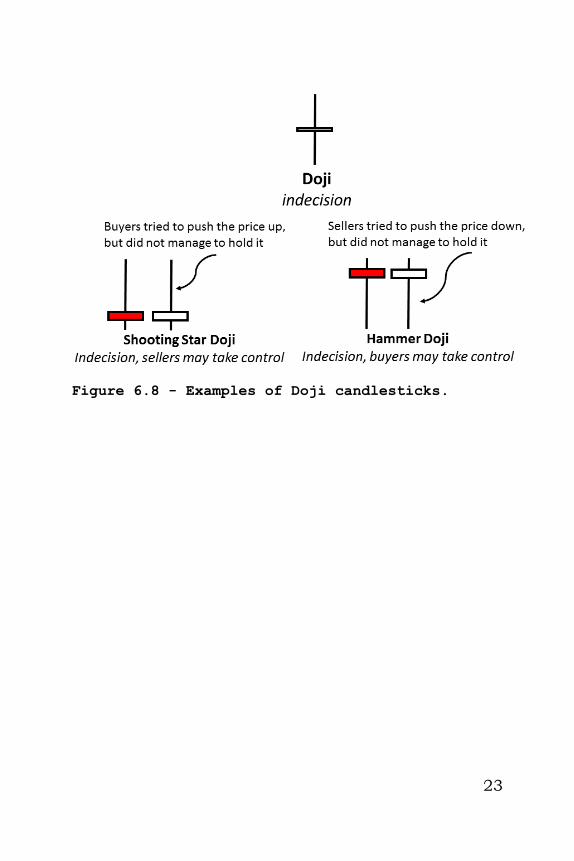
Figure 6.8 - Examples of Doji candlesticks.
24
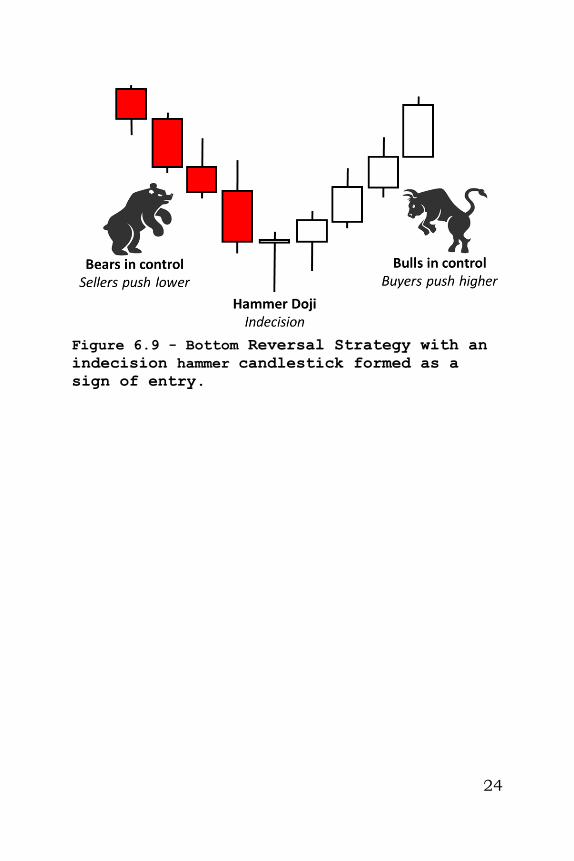
Figure 6.9 - Bottom Reversal Strategy with an
indecision hammer candlestick formed as a
sign of entry.
25
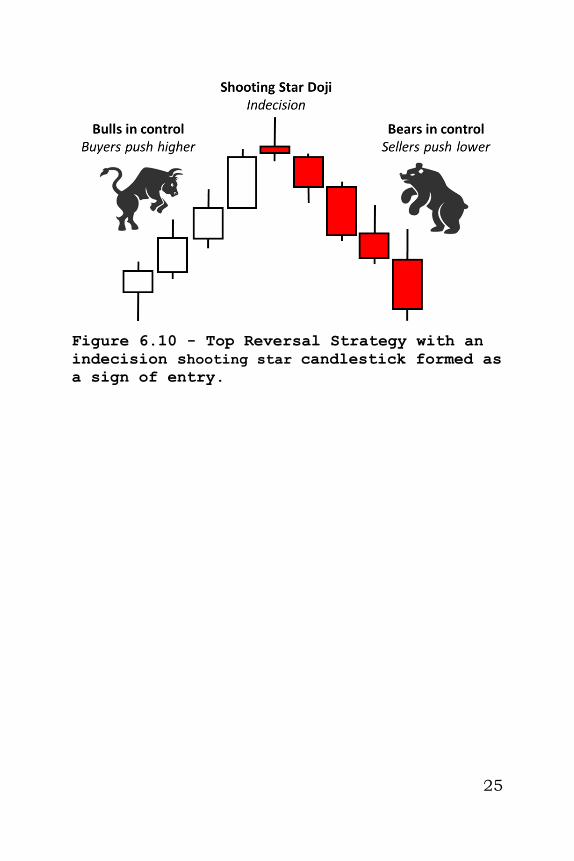
Figure 6.10 - Top Reversal Strategy with an
indecision shooting star candlestick formed as
a sign of entry.
26
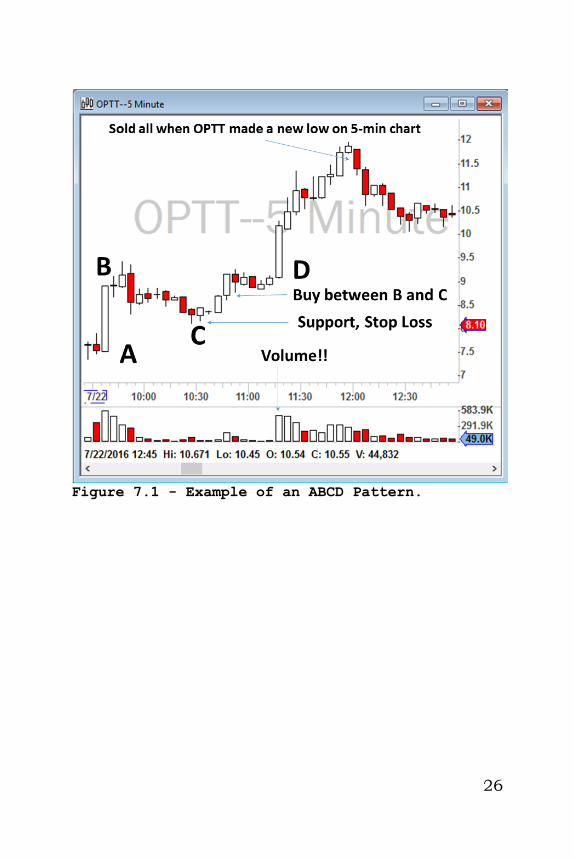
Figure 7.1 - Example of an ABCD Pattern.
27
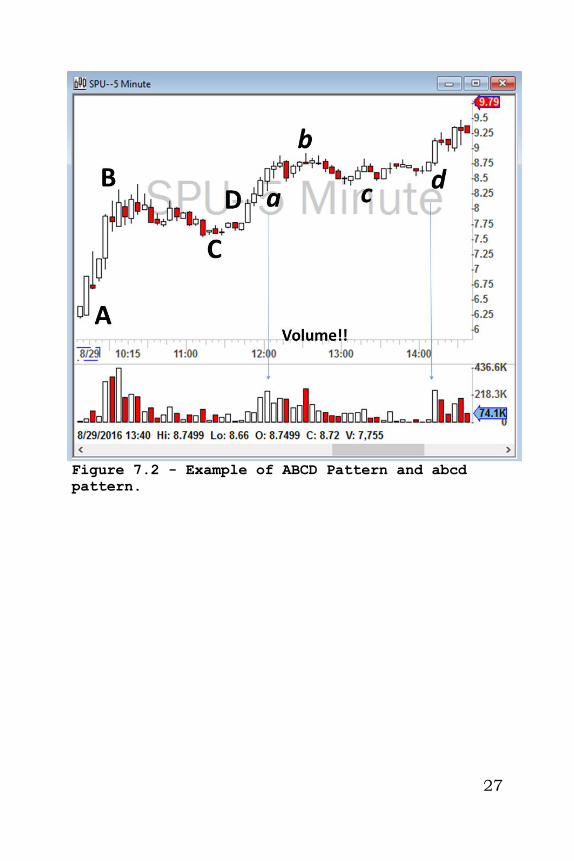
Figure 7.2 - Example of ABCD Pattern and abcd
pattern.
28
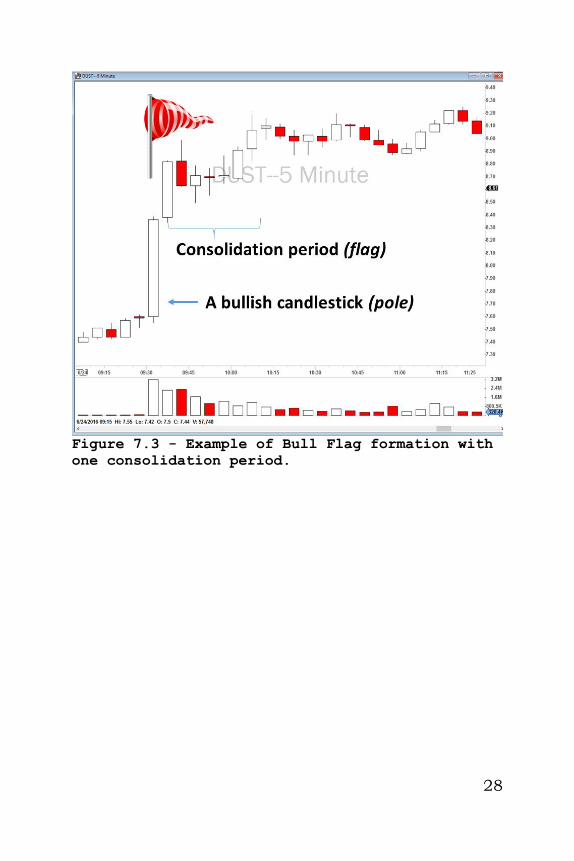
Figure 7.3 - Example of Bull Flag formation with
one consolidation period.
29
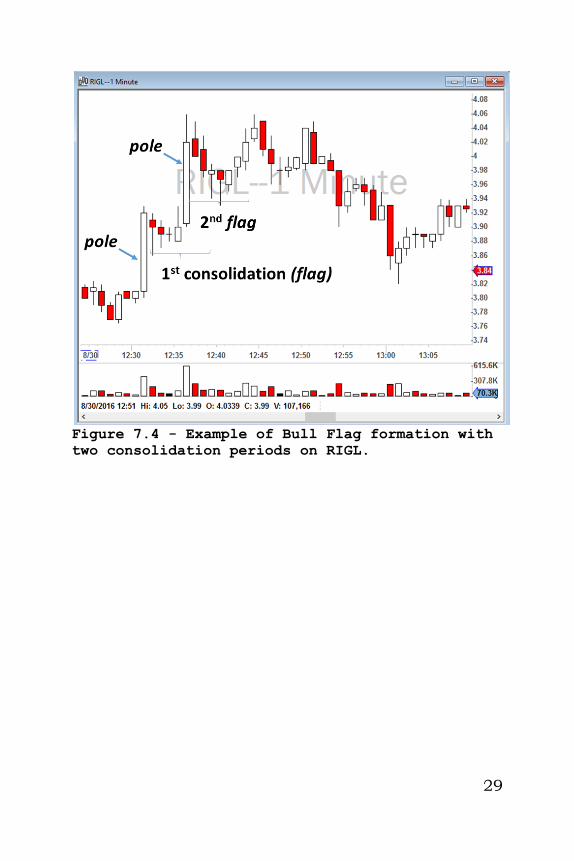
Figure 7.4 - Example of Bull Flag formation with
two consolidation periods on RIGL.
30
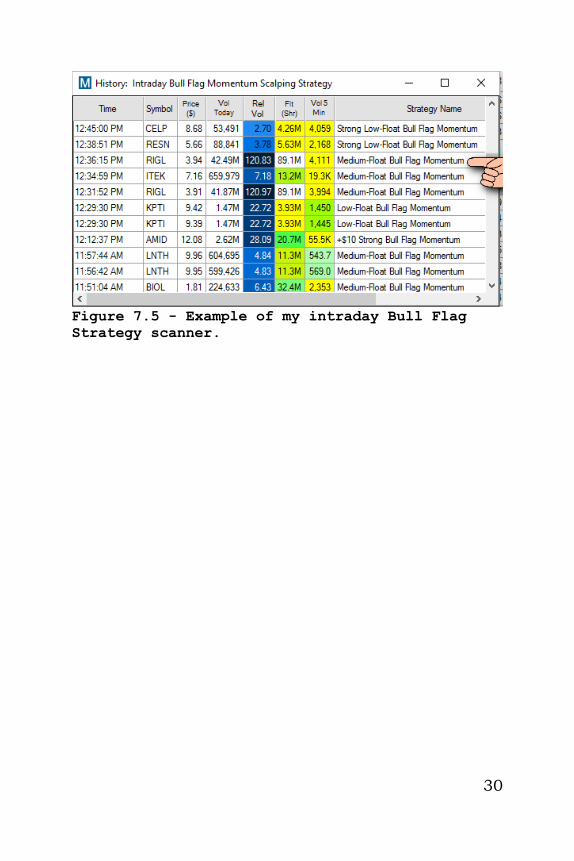
Figure 7.5 - Example of my intraday Bull Flag
Strategy scanner.
31
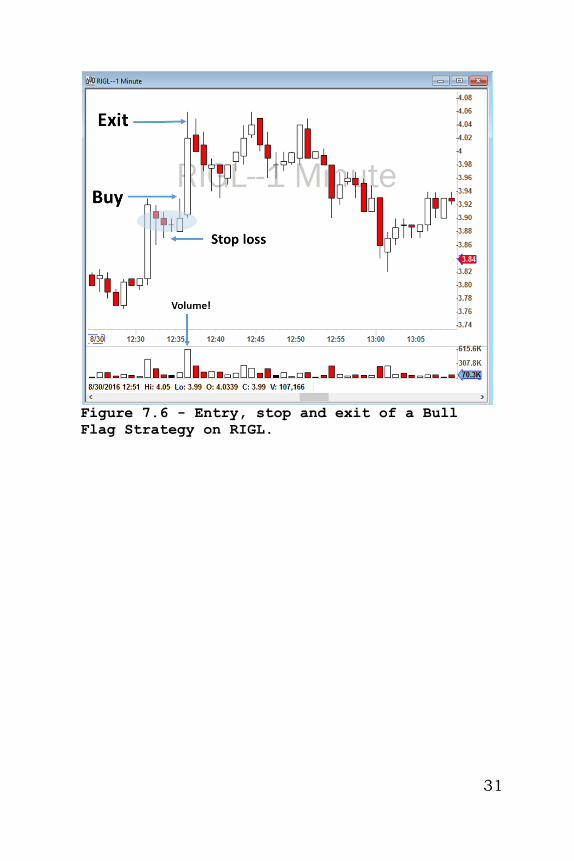
Figure 7.6 - Entry, stop and exit of a Bull
Flag Strategy on RIGL.
32
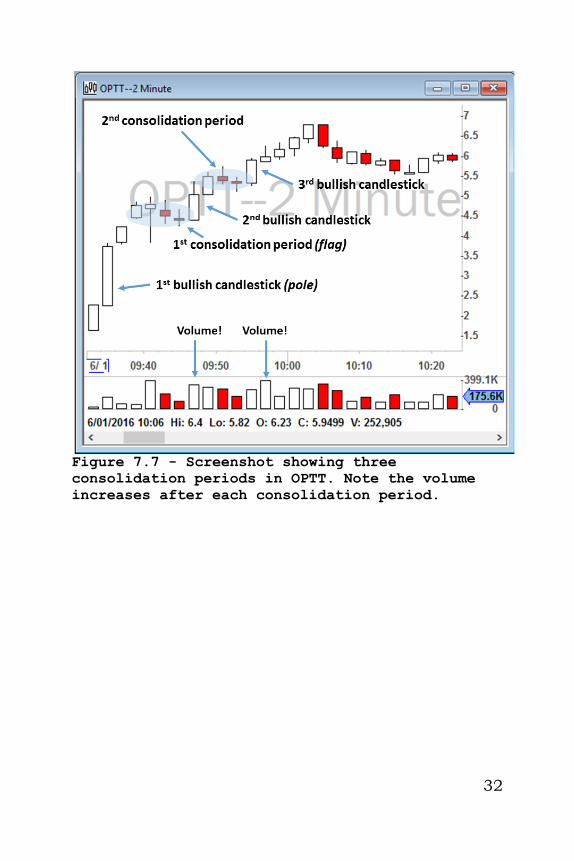
Figure 7.7 - Screenshot showing three
consolidation periods in OPTT. Note the volume
increases after each consolidation period.
33
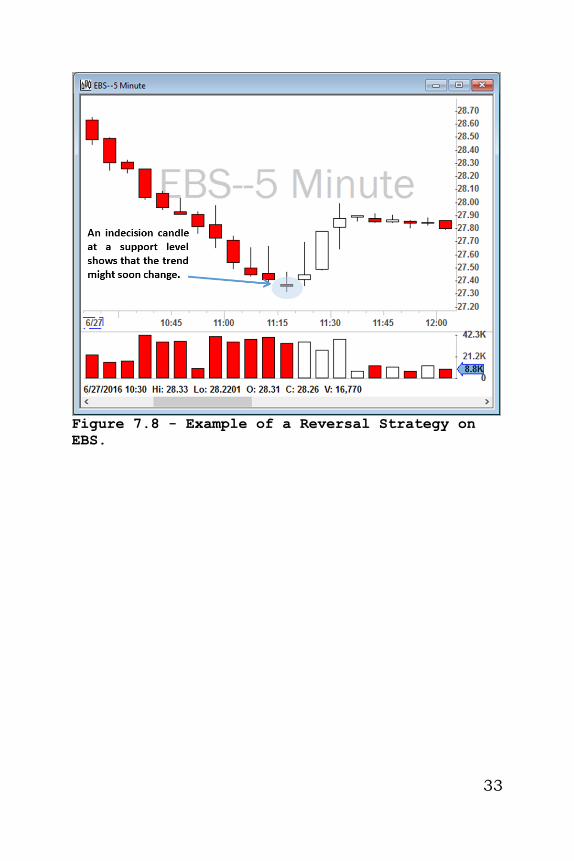
Figure 7.8 - Example of a Reversal Strategy on
EBS.
34
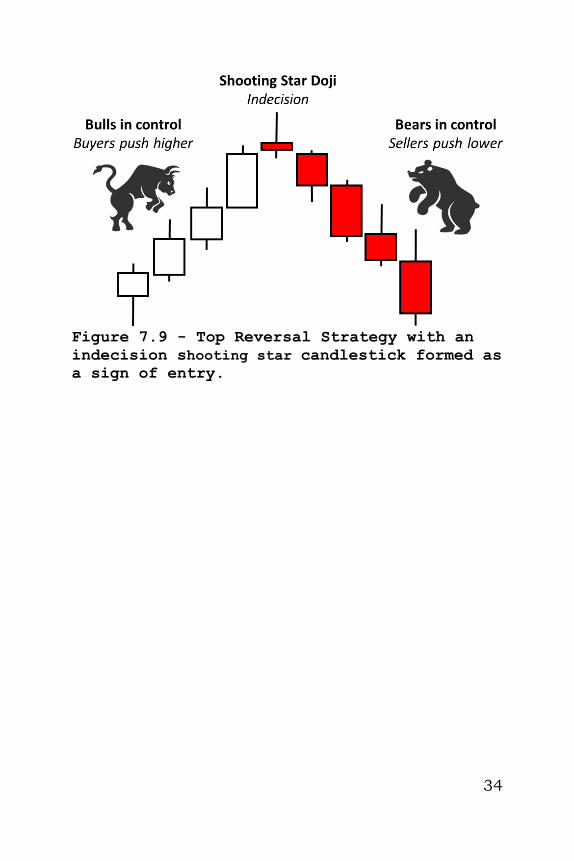
Figure 7.9 - Top Reversal Strategy with an
indecision shooting star candlestick formed as
a sign of entry.
35
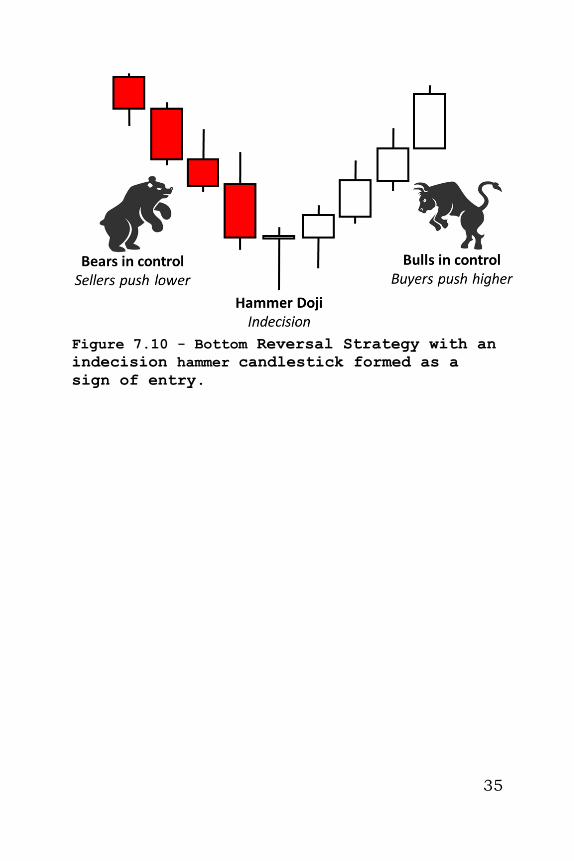
Figure 7.10 - Bottom Reversal Strategy with an
indecision hammer candlestick formed as a
sign of entry.
36
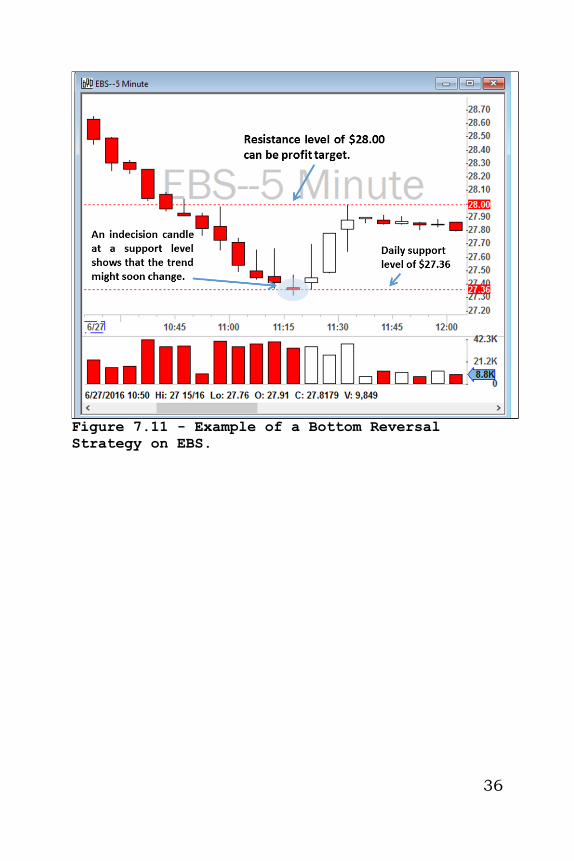
Figure 7.11 - Example of a Bottom Reversal
Strategy on EBS.
37
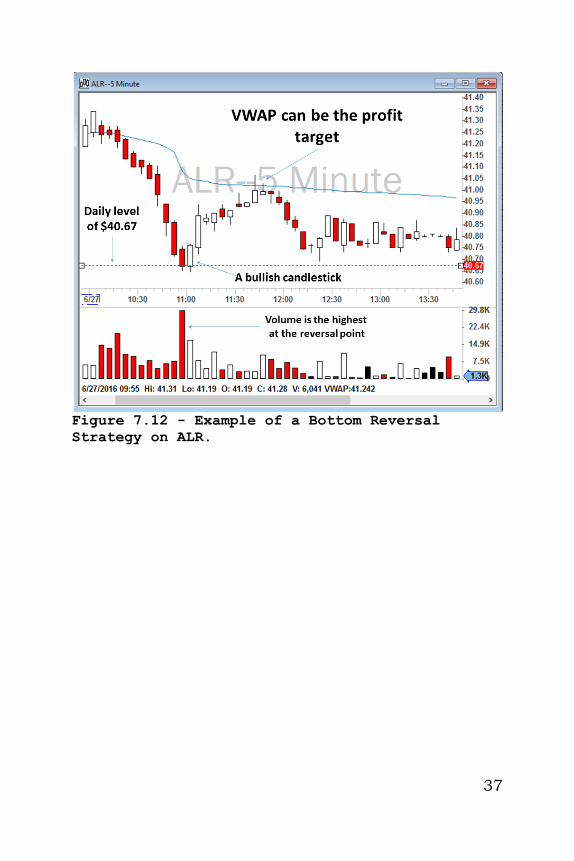
Figure 7.12 - Example of a Bottom Reversal
Strategy on ALR.
38
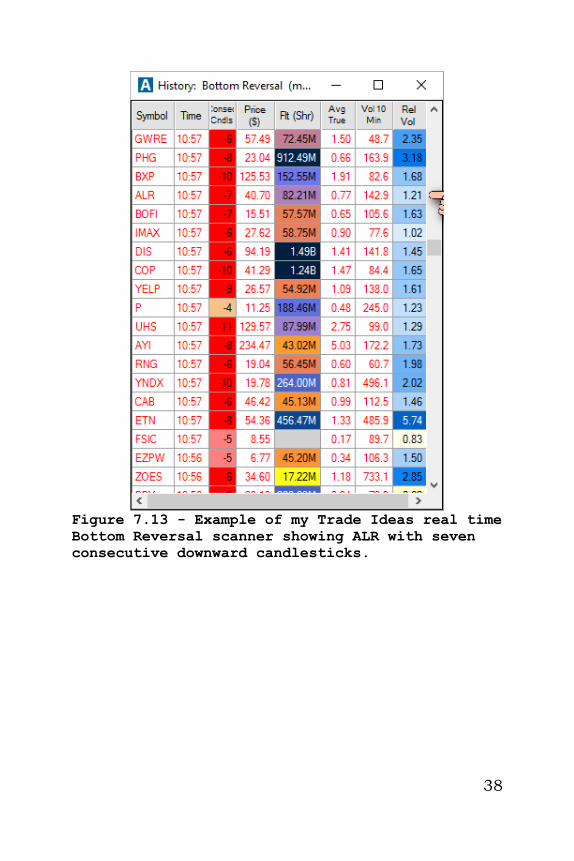
Figure 7.13 - Example of my Trade Ideas real time
Bottom Reversal scanner showing ALR with seven
consecutive downward candlesticks.
39
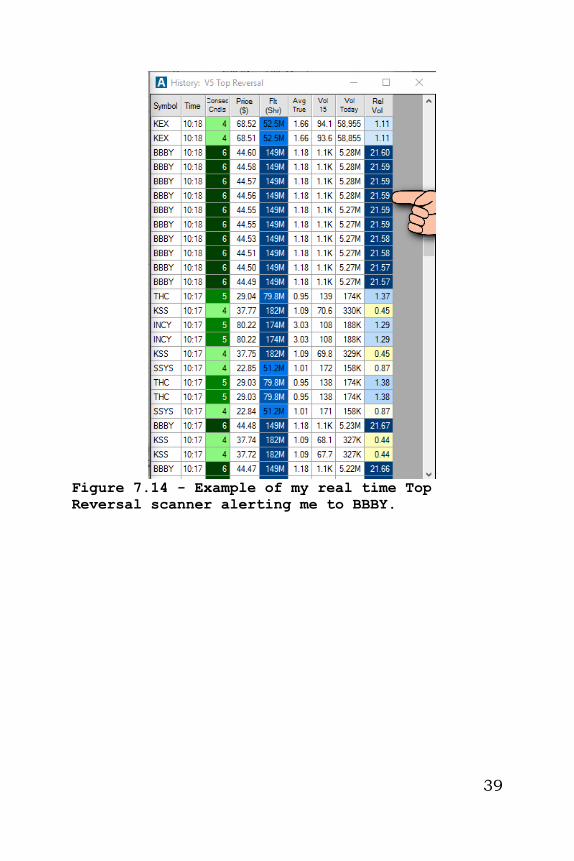
Figure 7.14 - Example of my real time Top
Reversal scanner alerting me to BBBY.
40
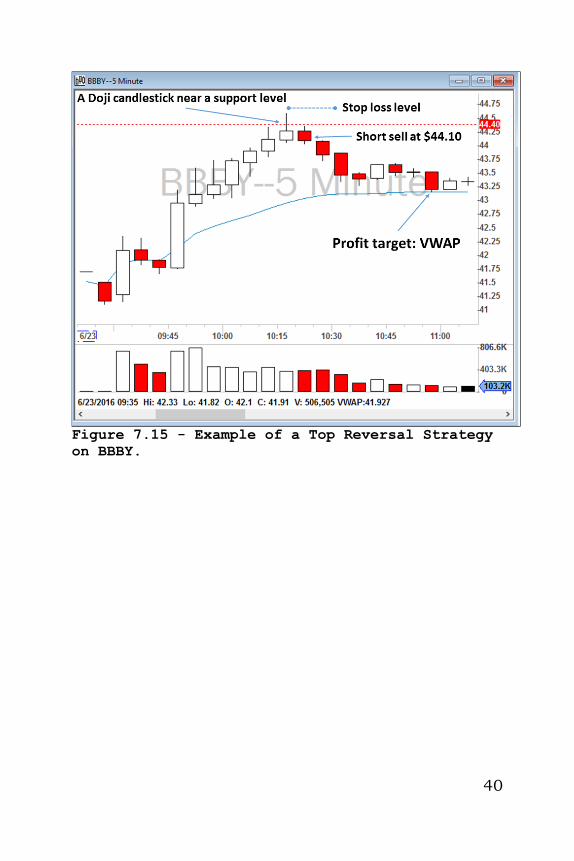
Figure 7.15 - Example of a Top Reversal Strategy
on BBBY.
41
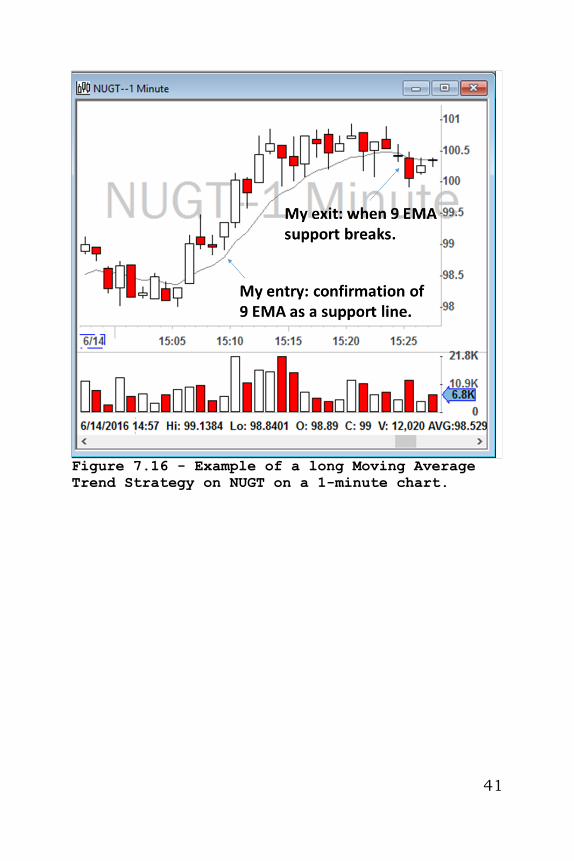
Figure 7.16 - Example of a long Moving Average
Trend Strategy on NUGT on a 1-minute chart.
42
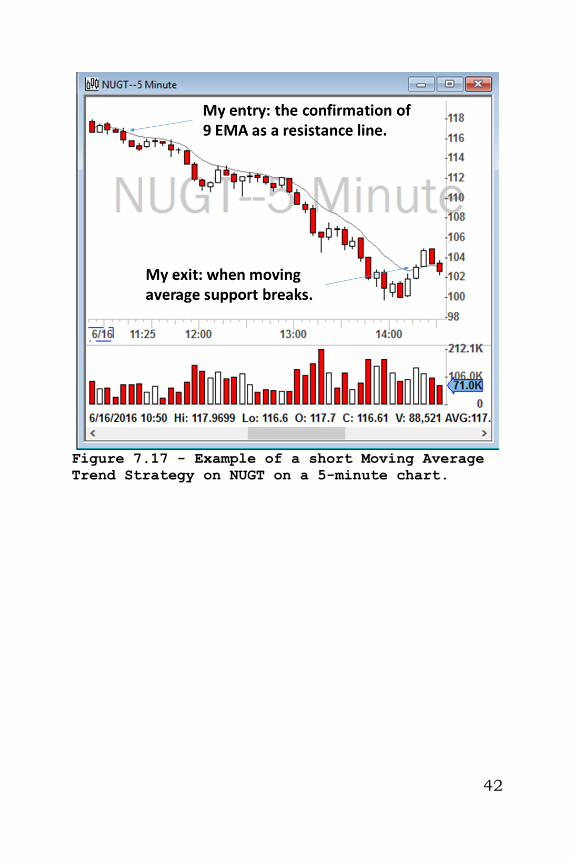
Figure 7.17 - Example of a short Moving Average
Trend Strategy on NUGT on a 5-minute chart.
43
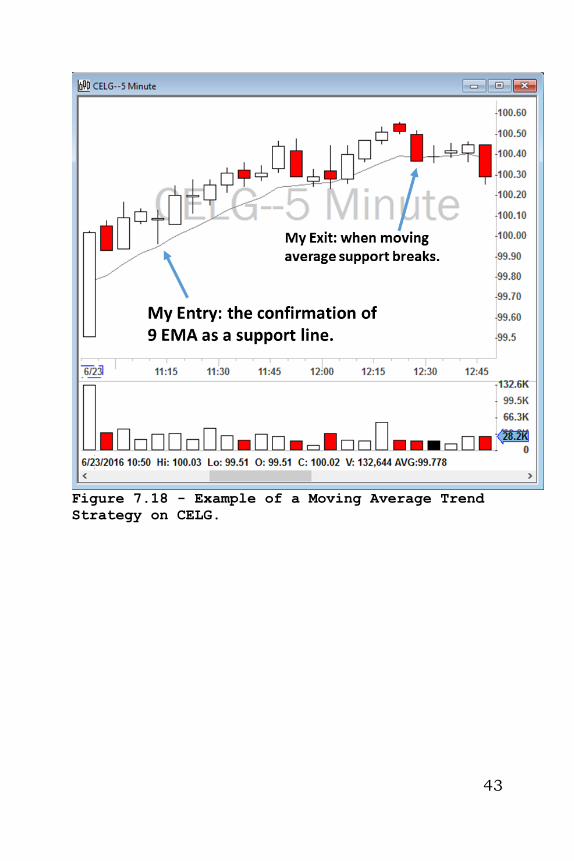
Figure 7.18 - Example of a Moving Average Trend
Strategy on CELG.
44
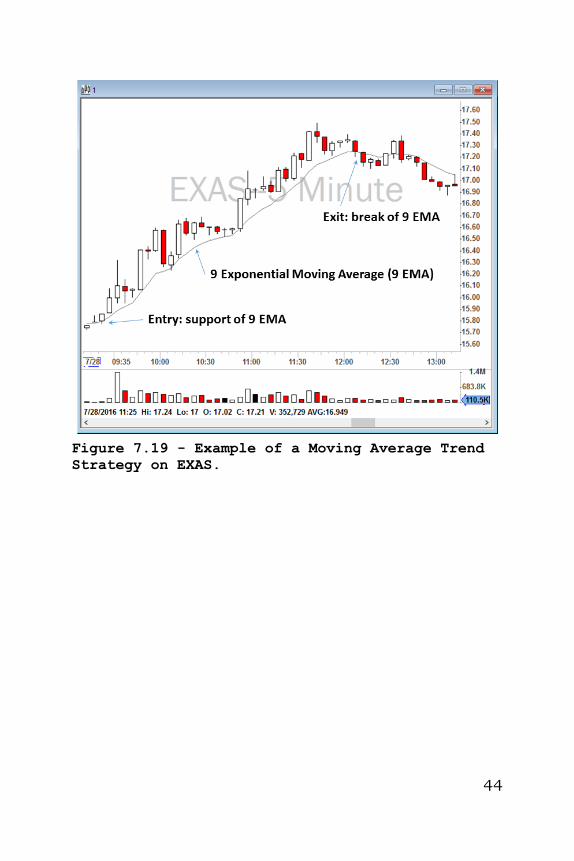
Figure 7.19 - Example of a Moving Average Trend
Strategy on EXAS.
45
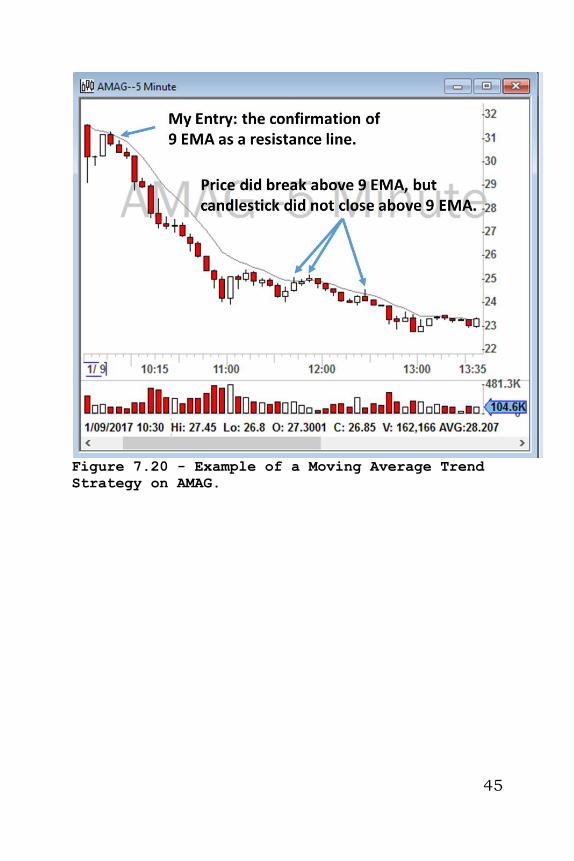
Figure 7.20 - Example of a Moving Average Trend
Strategy on AMAG.
46
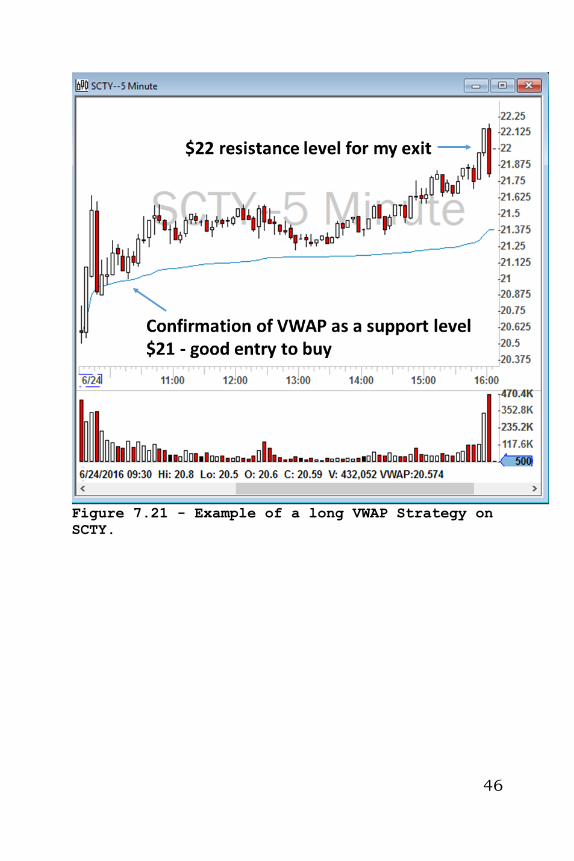
Figure 7.21 - Example of a long VWAP Strategy on
SCTY.
47
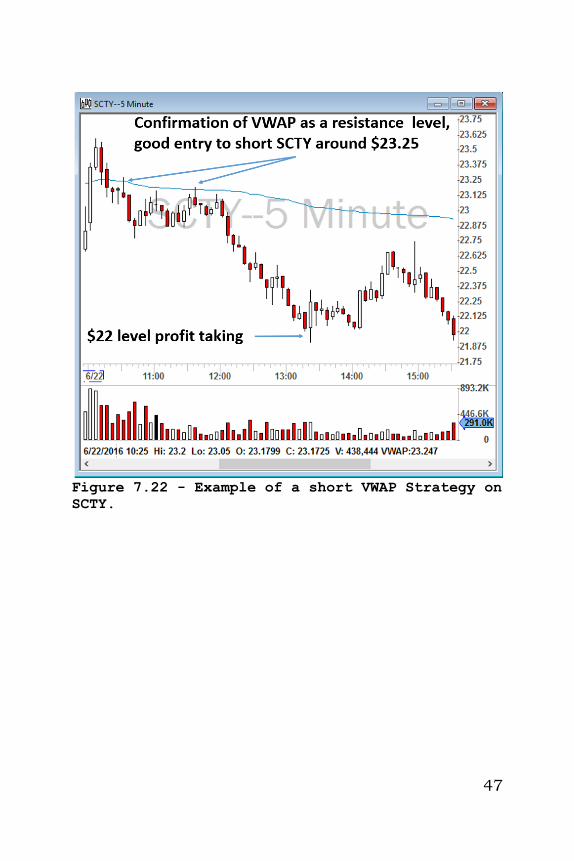
Figure 7.22 - Example of a short VWAP Strategy on
SCTY.
48
49
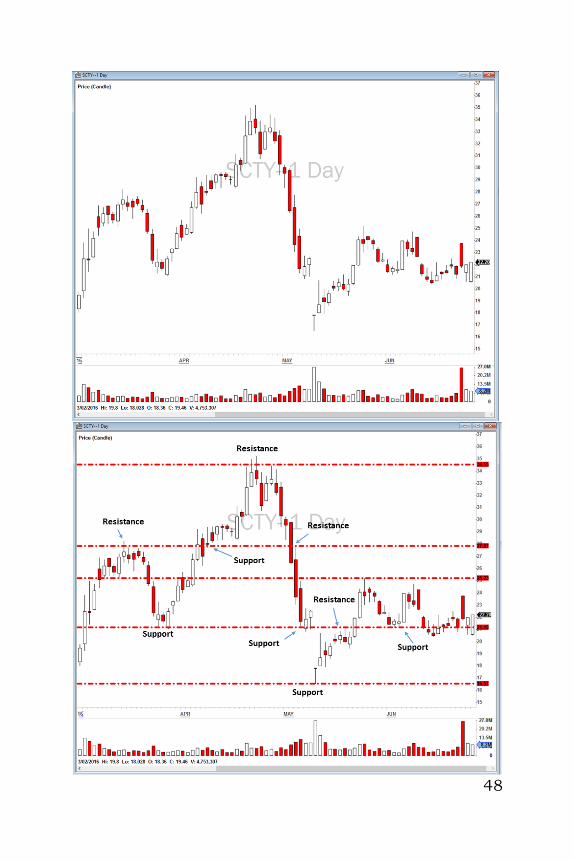
Figure 7.23 - Example of a Support or Resistance
Strategy on SCTY daily chart.
50
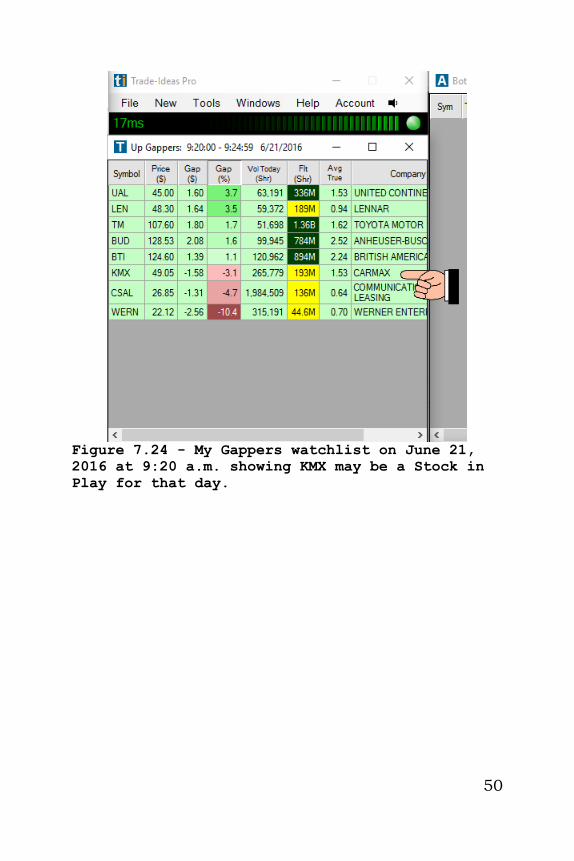
Figure 7.24 - My Gappers watchlist on June 21,
2016 at 9:20 a.m. showing KMX may be a Stock in
Play for that day.
51
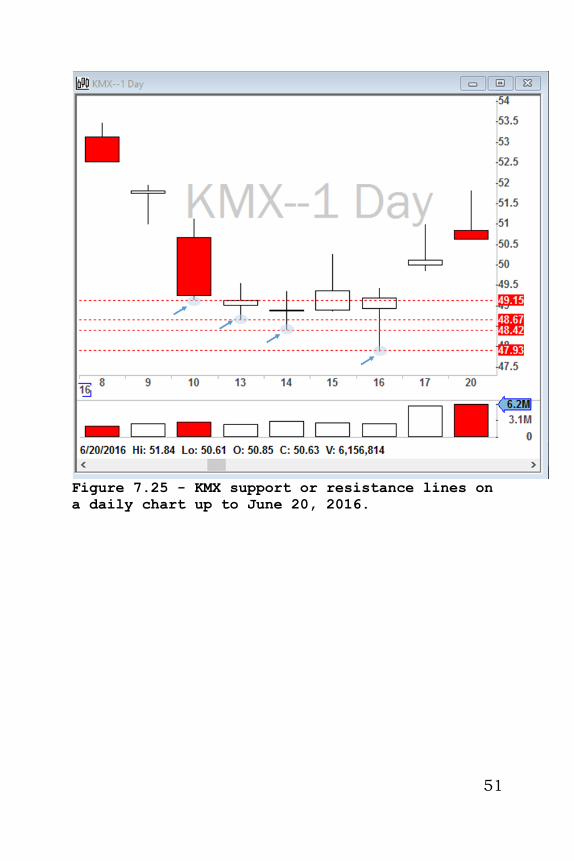
Figure 7.25 - KMX support or resistance lines on
a daily chart up to June 20, 2016.
52
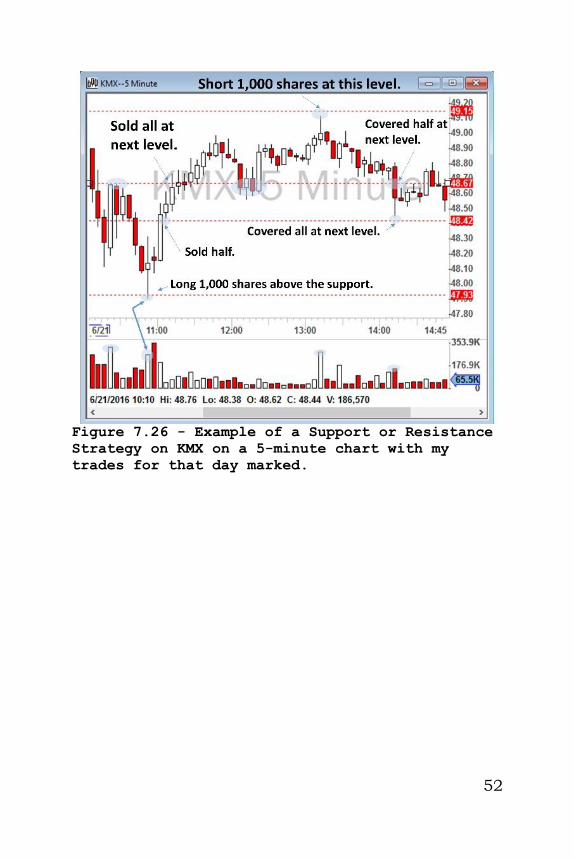
Figure 7.26 - Example of a Support or Resistance
Strategy on KMX on a 5-minute chart with my
trades for that day marked.
53
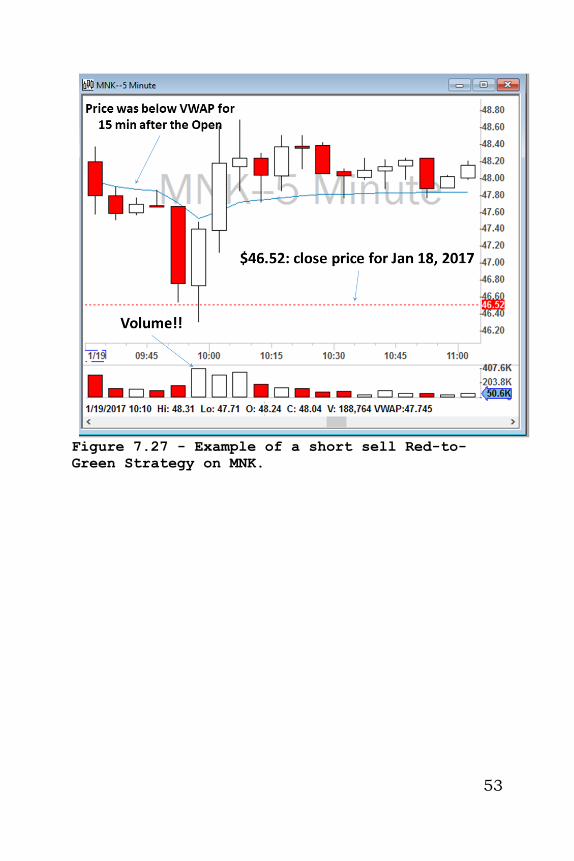
Figure 7.27 - Example of a short sell Red-to-
Green Strategy on MNK.
54
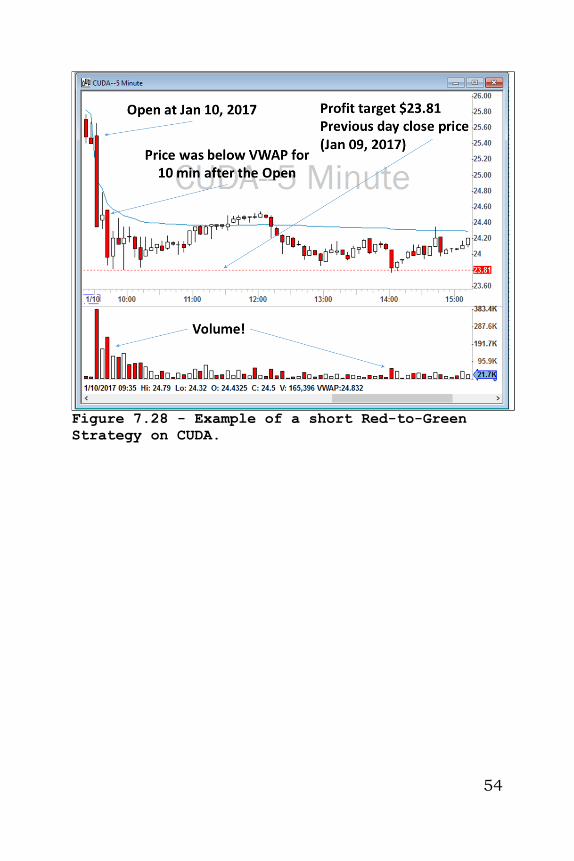
Figure 7.28 - Example of a short Red-to-Green
Strategy on CUDA.
55
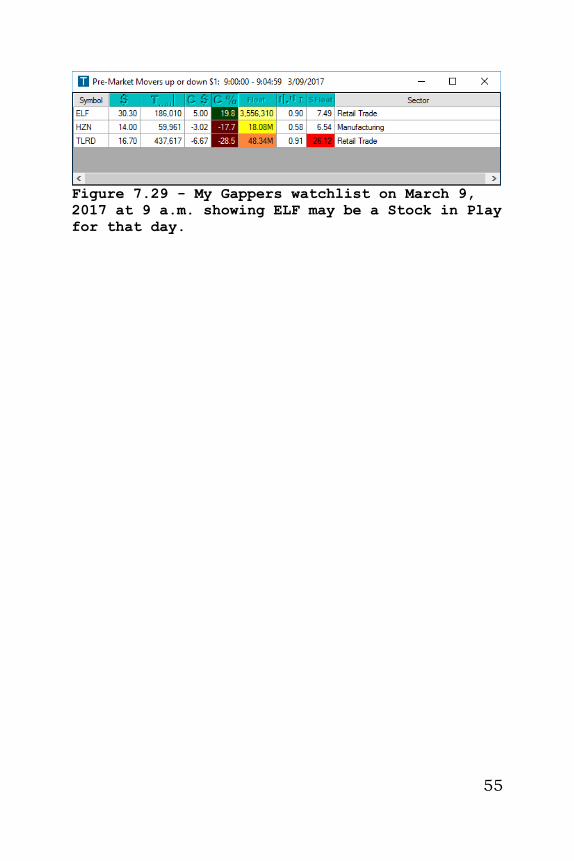
Figure 7.29 - My Gappers watchlist on March 9,
2017 at 9 a.m. showing ELF may be a Stock in Play
for that day.
56
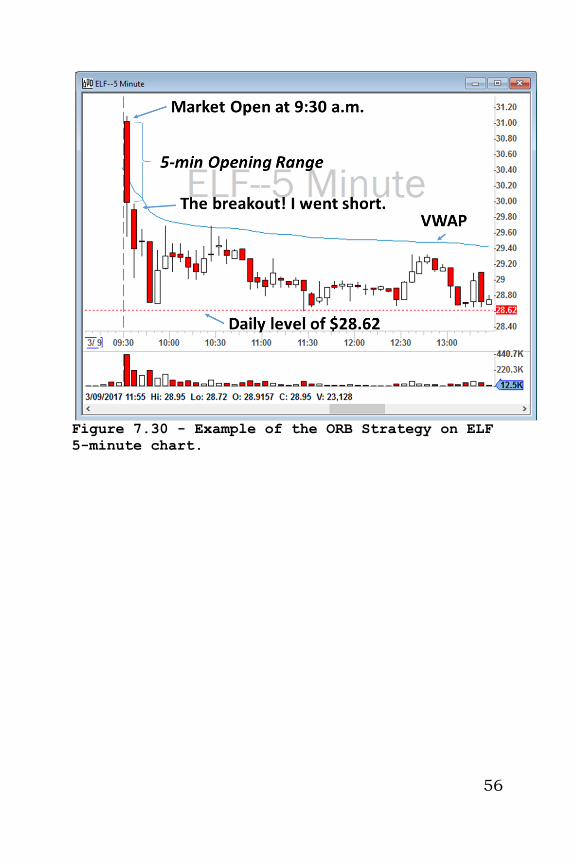
Figure 7.30 - Example of the ORB Strategy on ELF
5-minute chart.
57
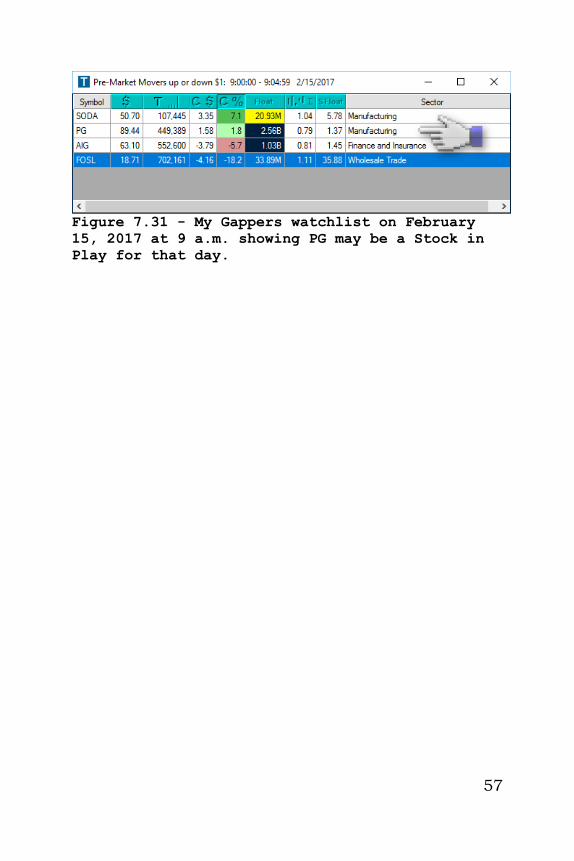
Figure 7.31 - My Gappers watchlist on February
15, 2017 at 9 a.m. showing PG may be a Stock in
Play for that day.
58
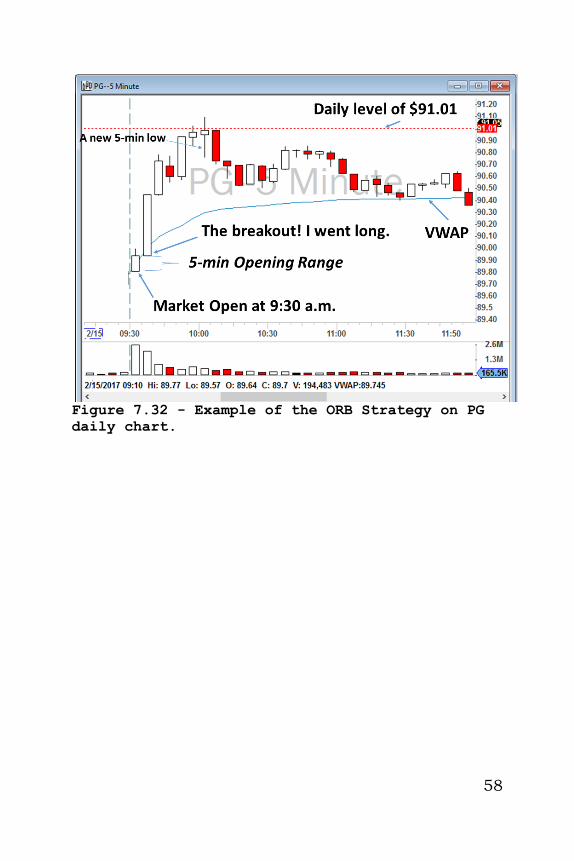
Figure 7.32 - Example of the ORB Strategy on PG
daily chart.
59
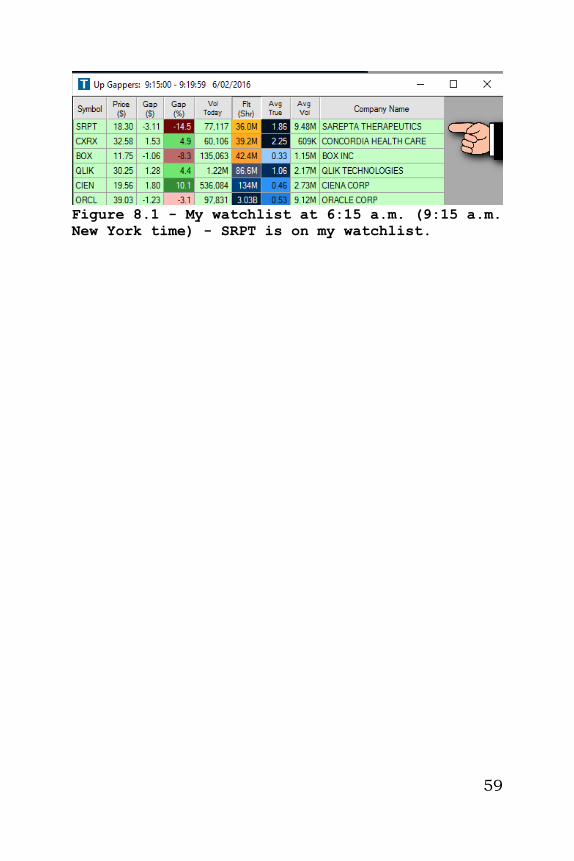
Figure 8.1 - My watchlist at 6:15 a.m. (9:15 a.m.
New York time) - SRPT is on my watchlist.
60
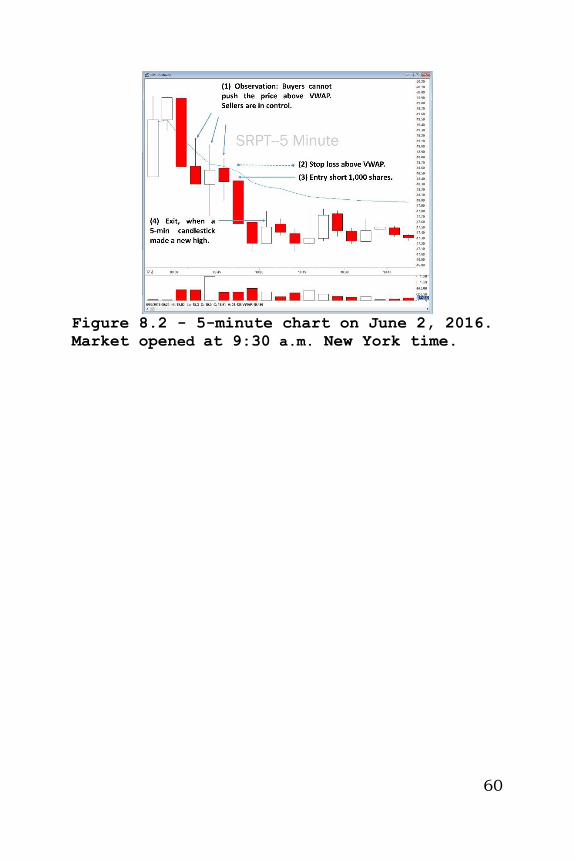
Figure 8.2 - 5-minute chart on June 2, 2016.
Market opened at 9:30 a.m. New York time.
61
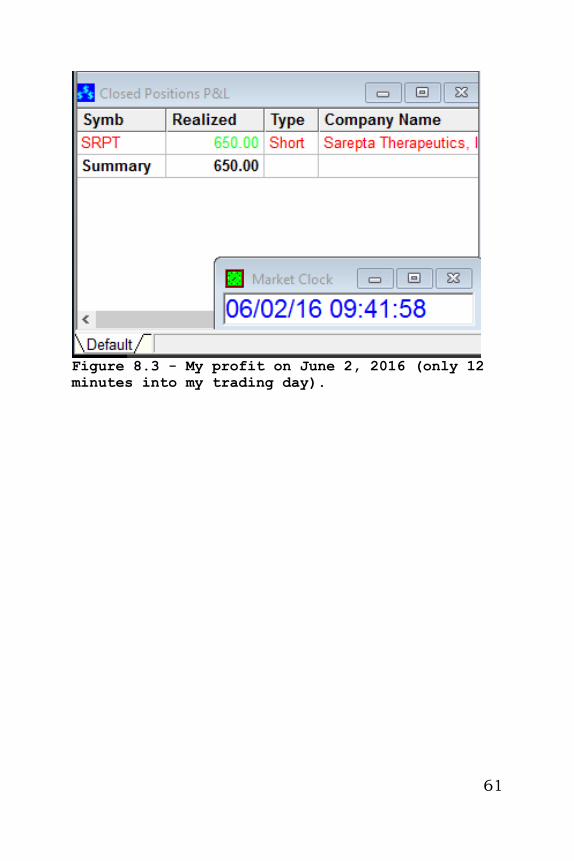
Figure 8.3 - My profit on June 2, 2016 (only 12
minutes into my trading day).
62
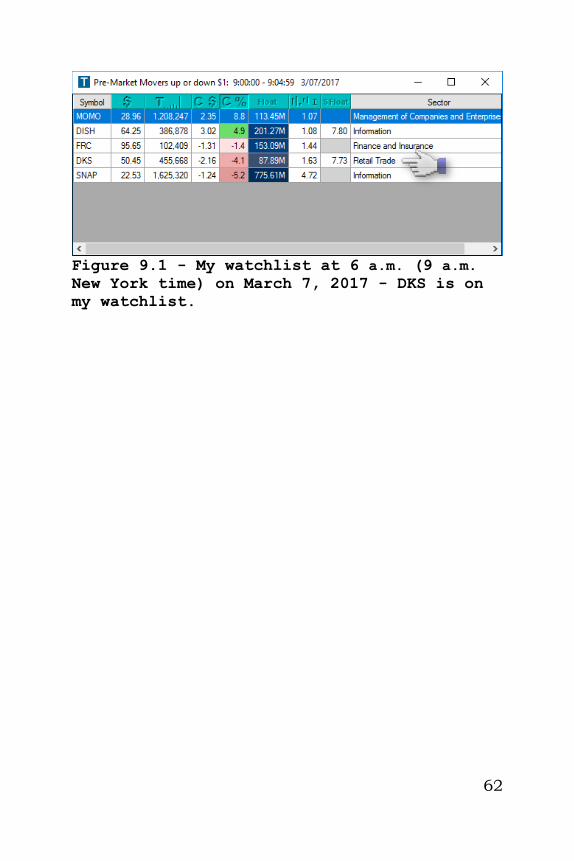
Figure 9.1 - My watchlist at 6 a.m. (9 a.m.
New York time) on March 7, 2017 - DKS is on
my watchlist.
63
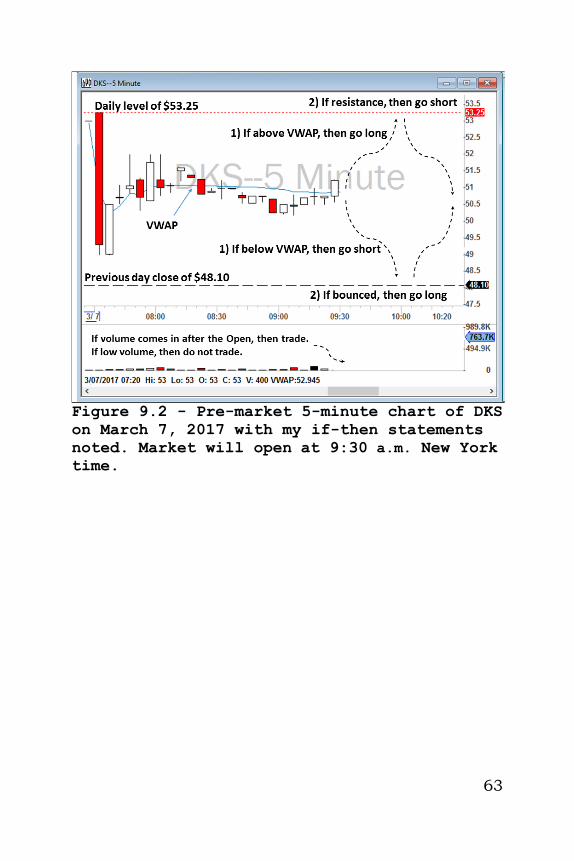
Figure 9.2 - Pre-market 5-minute chart of DKS
on March 7, 2017 with my if-then statements
noted. Market will open at 9:30 a.m. New York
time.
64
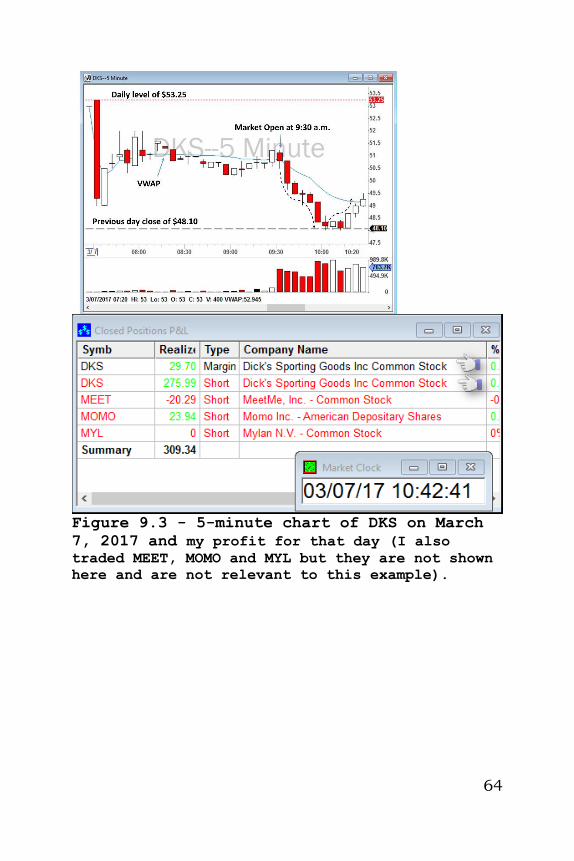
Figure 9.3 - 5-minute chart of DKS on March
7, 2017 and my profit for that day (I also
traded MEET, MOMO and MYL but they are not shown
here and are not relevant to this example).
65
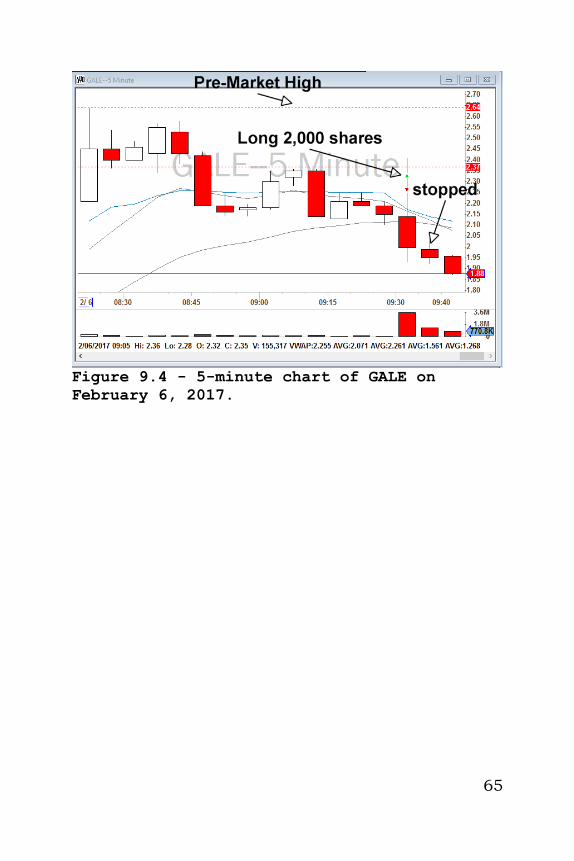
Figure 9.4 - 5-minute chart of GALE on
February 6, 2017.
66
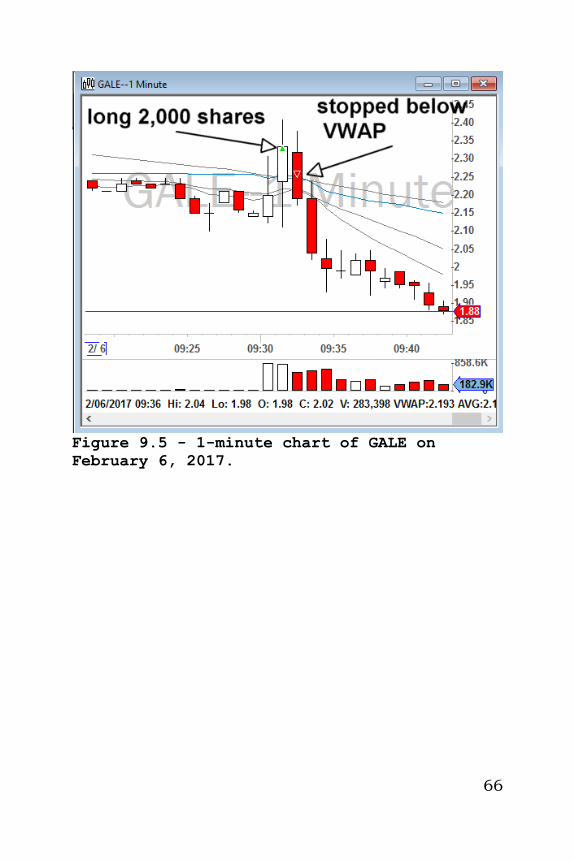
Figure 9.5 - 1-minute chart of GALE on
February 6, 2017.
67
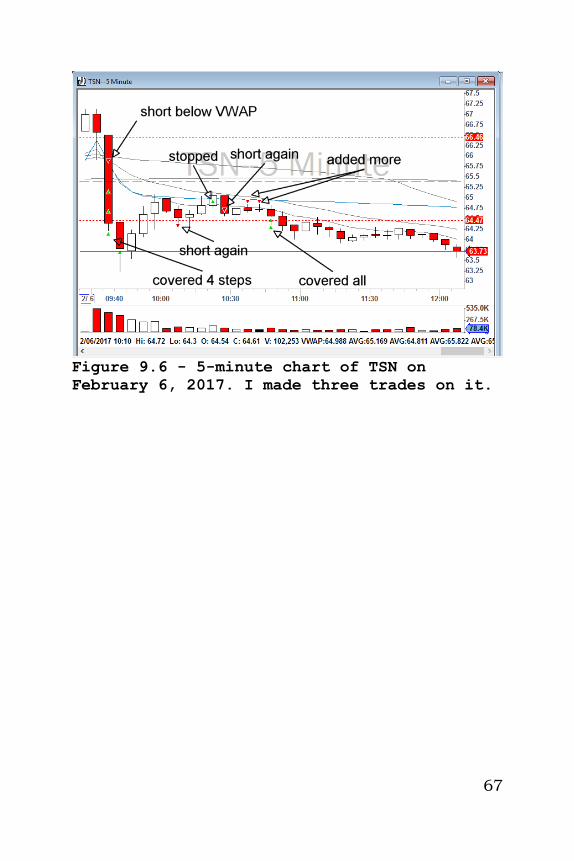
Figure 9.6 - 5-minute chart of TSN on
February 6, 2017. I made three trades on it.
68
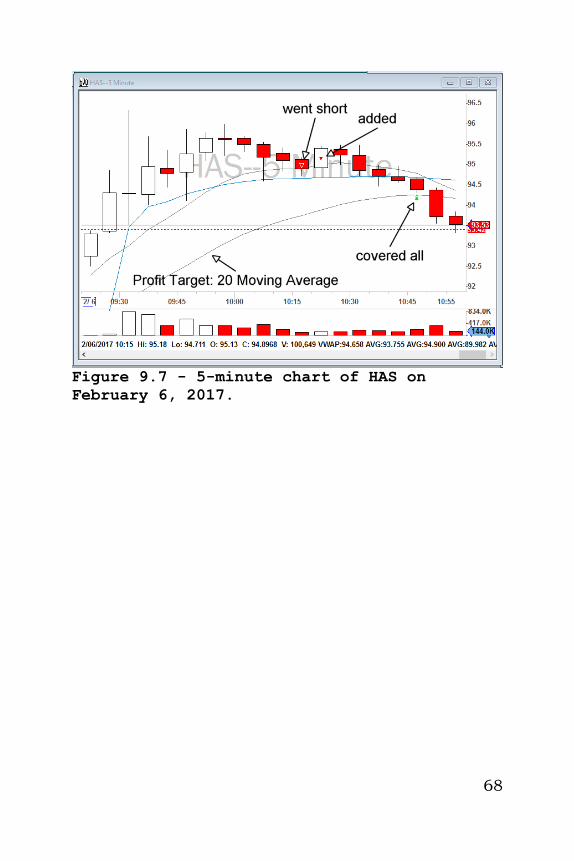
Figure 9.7 - 5-minute chart of HAS on
February 6, 2017.
69
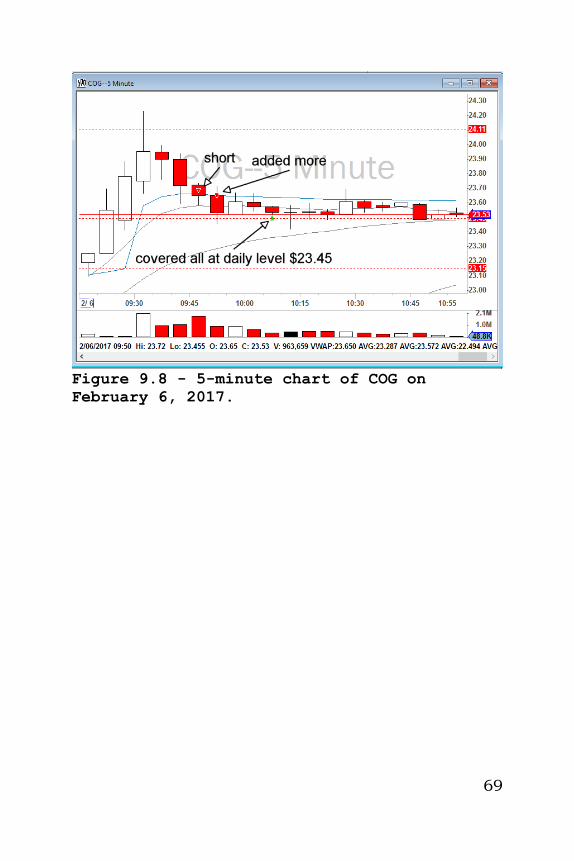
Figure 9.8 - 5-minute chart of COG on
February 6, 2017.