Embed Size (px)
Citation preview

HOW TOCREATE A HISTOGRAM IN EXCEL
STEP 1: INSTALL ANALYSIS TOOLPAK
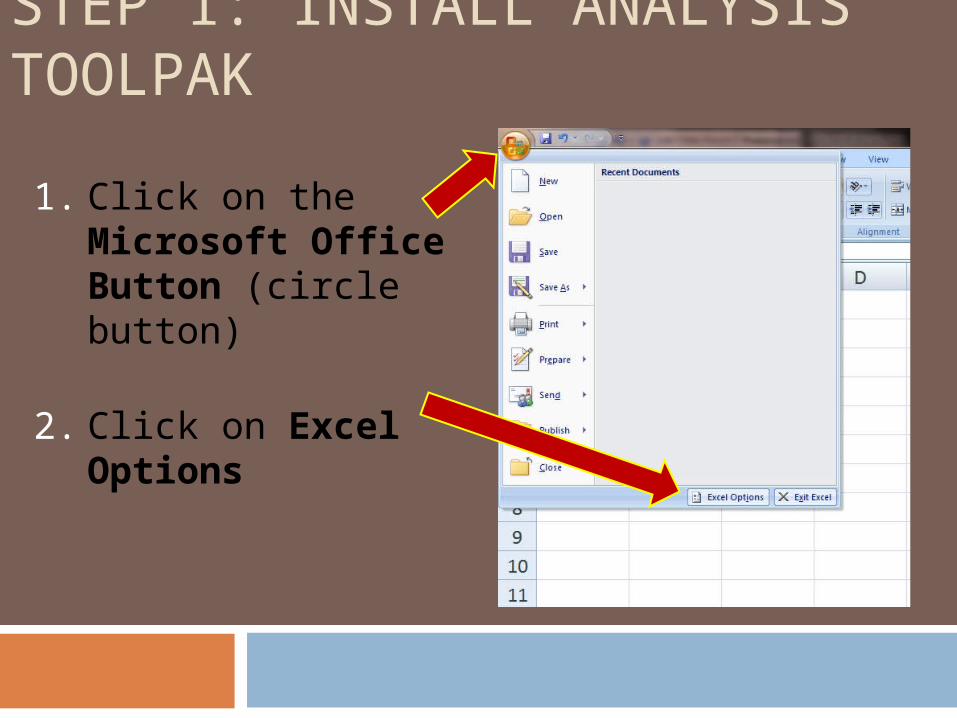
1. Click on the Microsoft Office Button (circle button)
2. Click on Excel Options
STEP 1: INSTALL ANALYSIS TOOLPAK
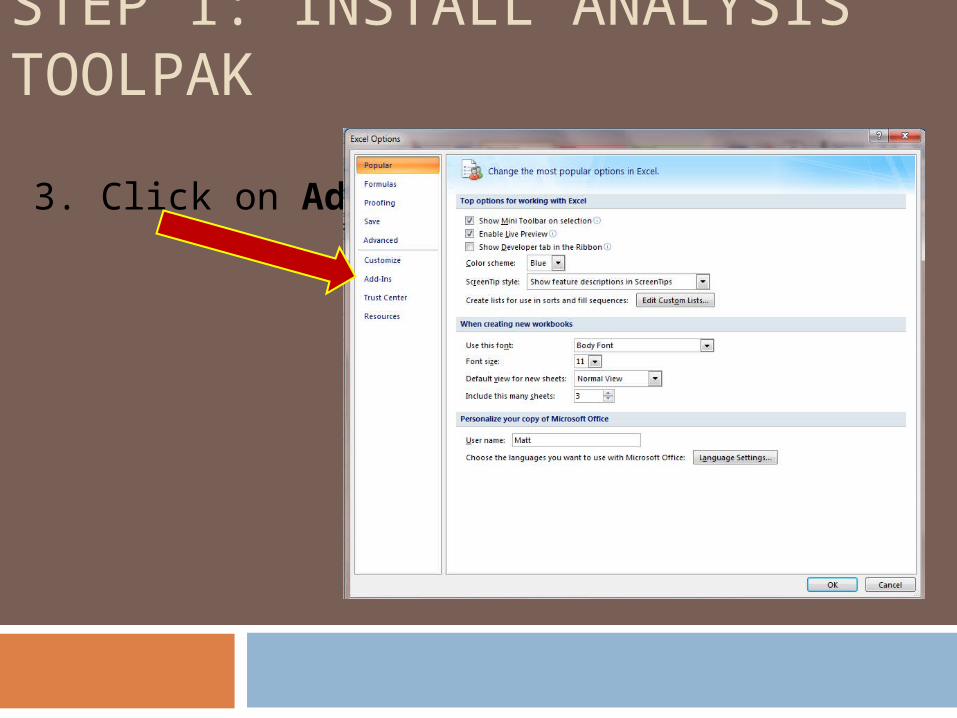
3. Click on Add-Ins
STEP 1: INSTALL ANALYSIS TOOLPAK
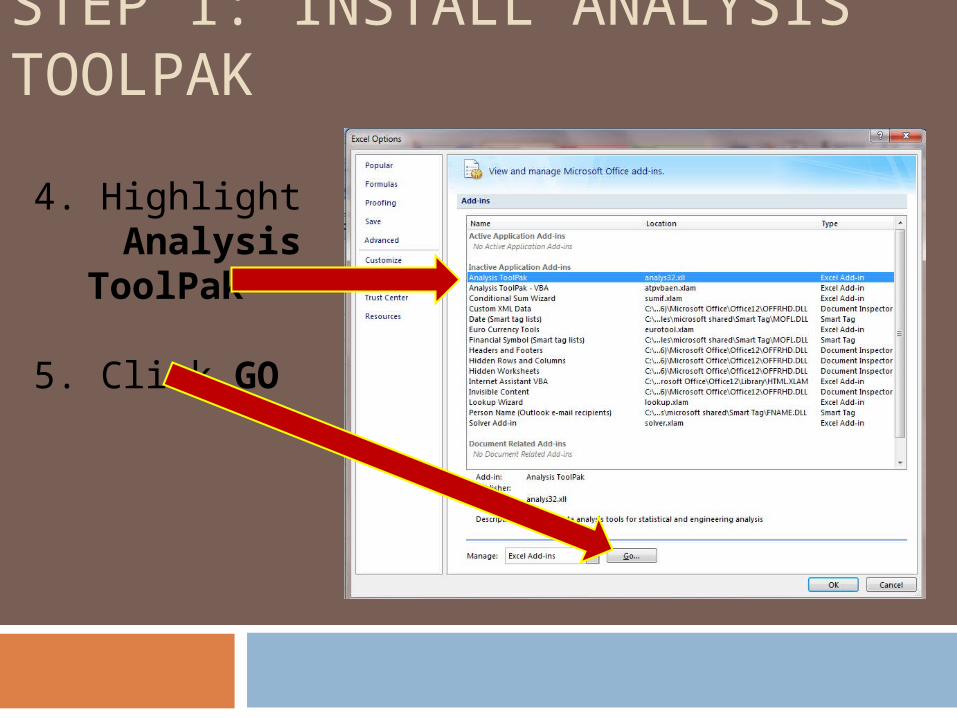
4. Highlight Analysis
ToolPak
5. Click GO
STEP 1: INSTALL ANALYSIS TOOLPAK
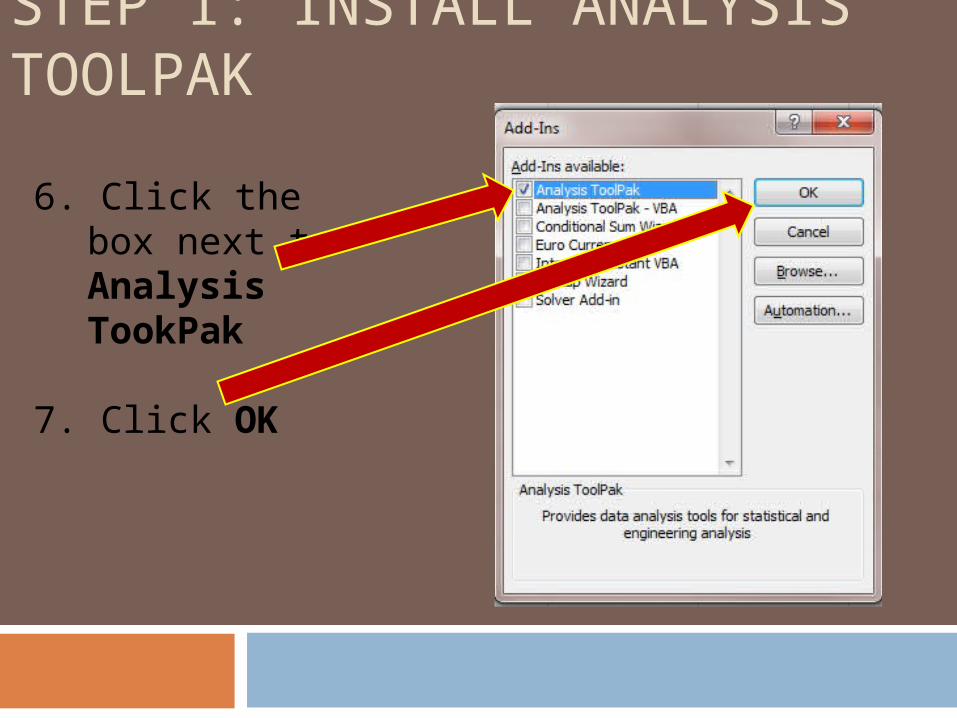
6. Click the box next to Analysis TookPak
7. Click OK
STEP 1: INSTALL ANALYSIS TOOLPAK
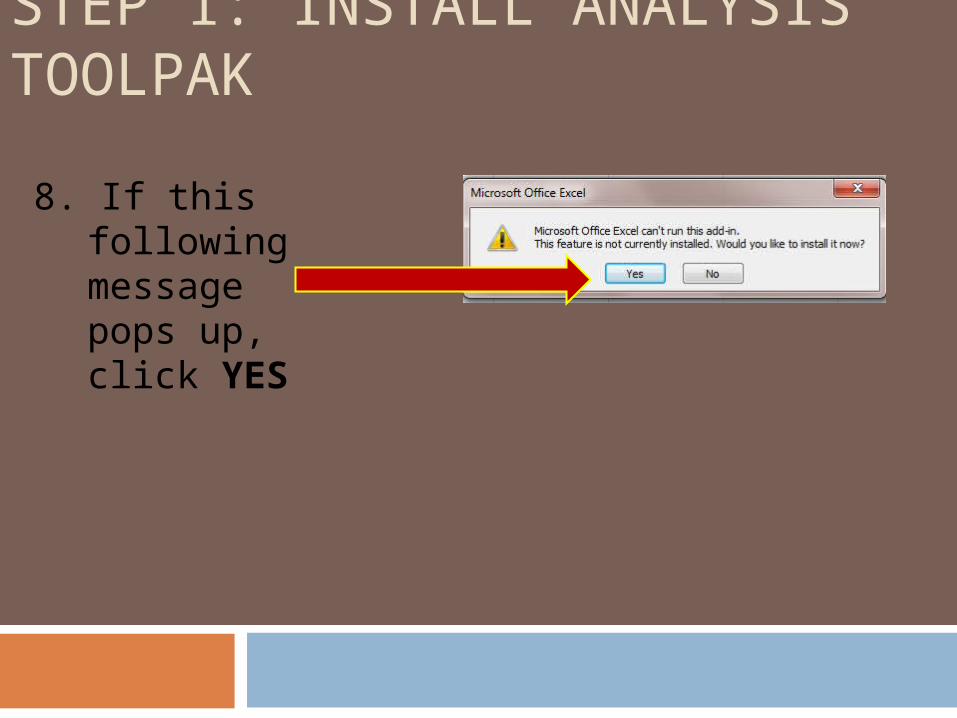
8. If this following message pops up, click YES
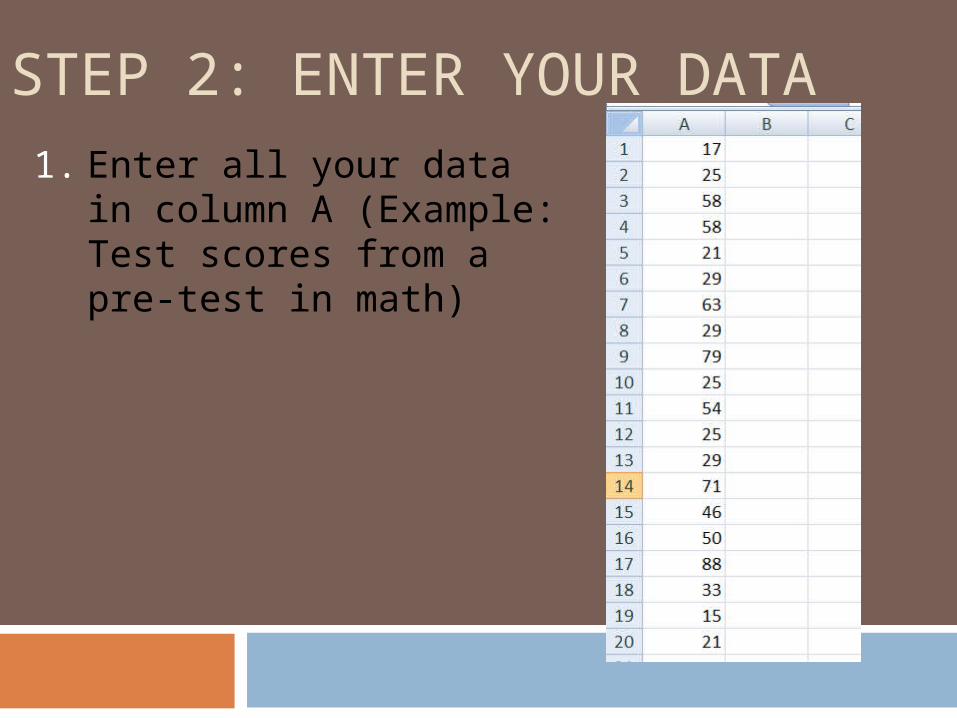
STEP 2: ENTER YOUR DATA1. Enter all your data in
column A (Example: Test scores from a pre-test in math)
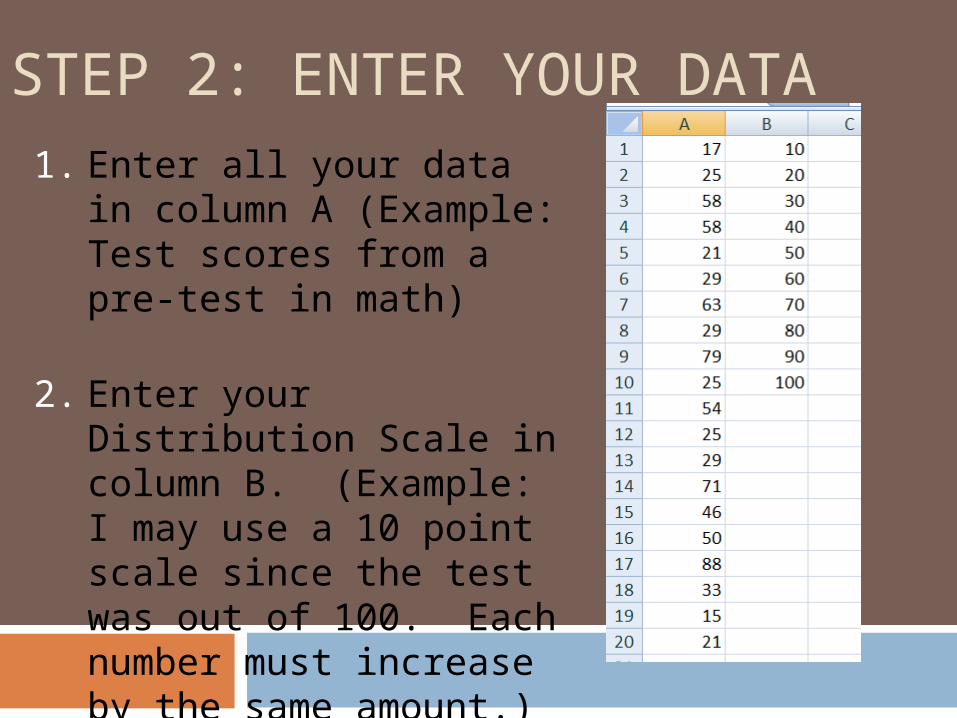
STEP 2: ENTER YOUR DATA1. Enter all your data in
column A (Example: Test scores from a pre-test in math)
2. Enter your Distribution Scale in column B. (Example: I may use a 10 point scale since the test was out of 100. Each number must increase by the same amount.)
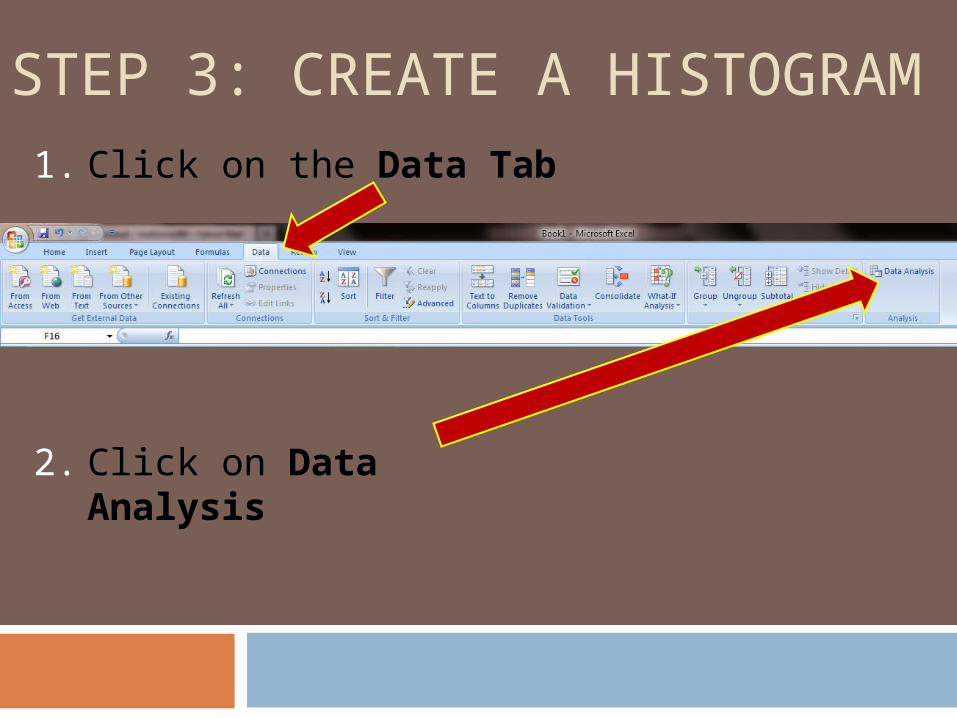
STEP 3: CREATE A HISTOGRAM1. Click on the Data Tab
2. Click on Data Analysis
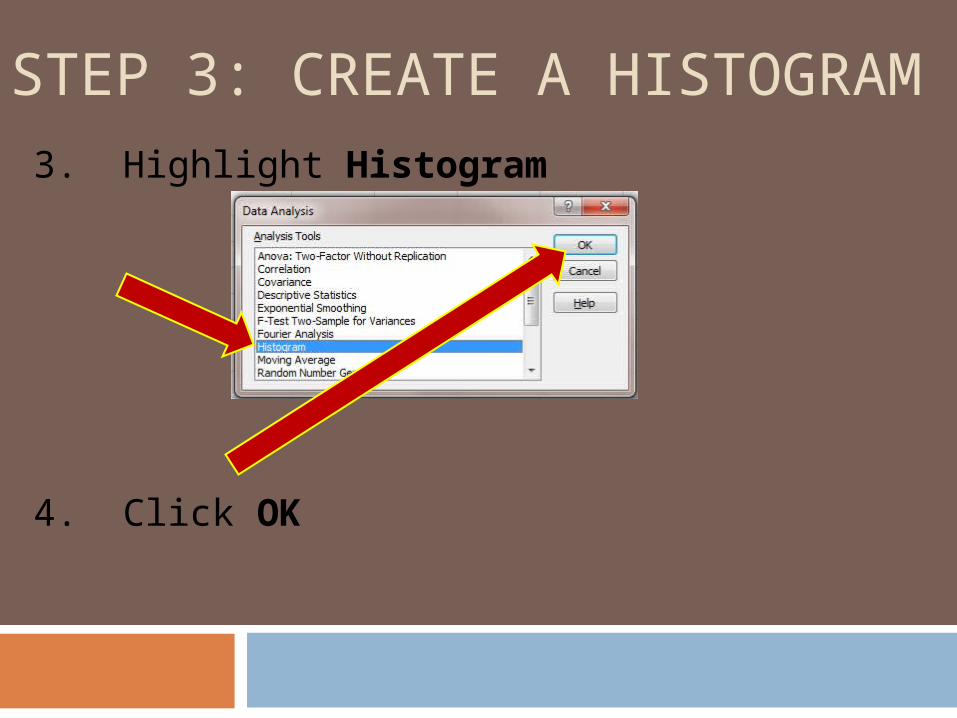
STEP 3: CREATE A HISTOGRAM3. Highlight Histogram
4. Click OK
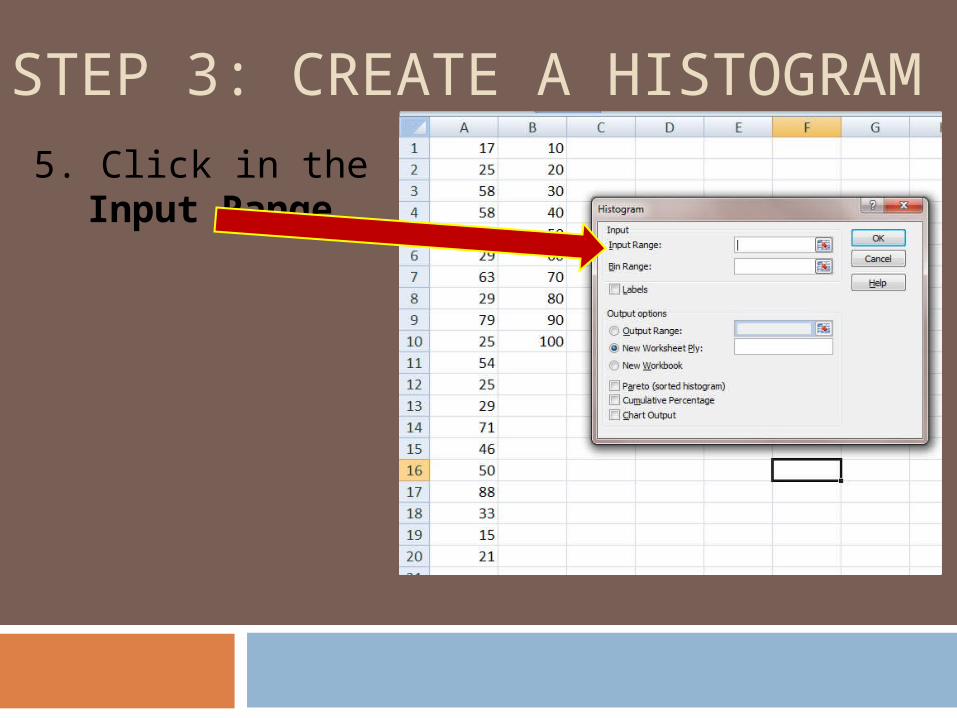
STEP 3: CREATE A HISTOGRAM5. Click in the
Input Range
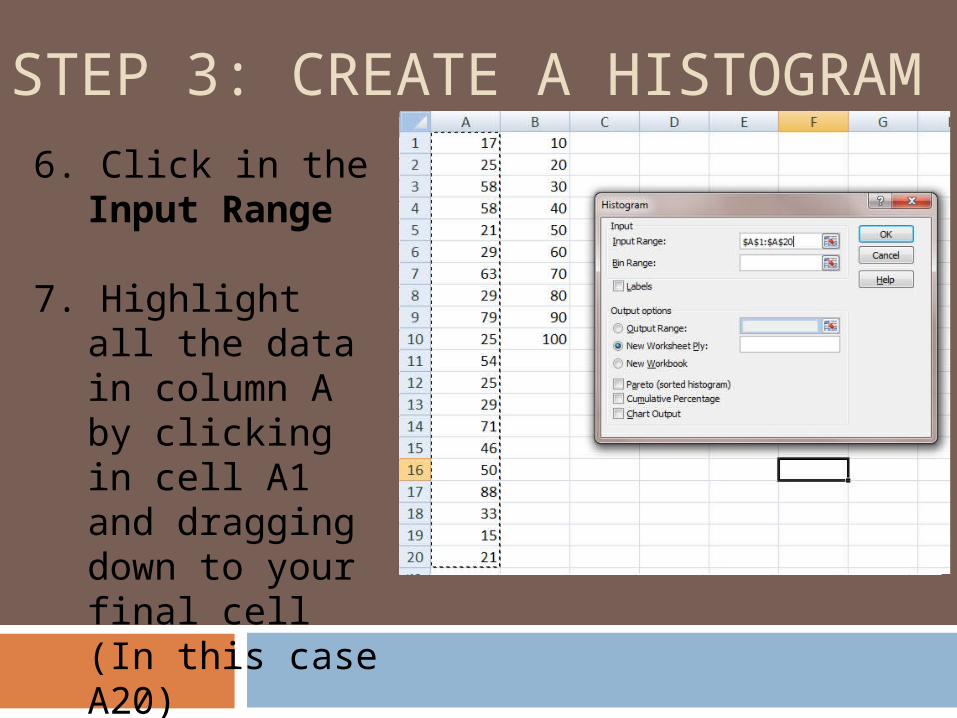
STEP 3: CREATE A HISTOGRAM6. Click in the
Input Range
7. Highlight all the data in column A by clicking in cell A1 and dragging down to your final cell (In this case A20)
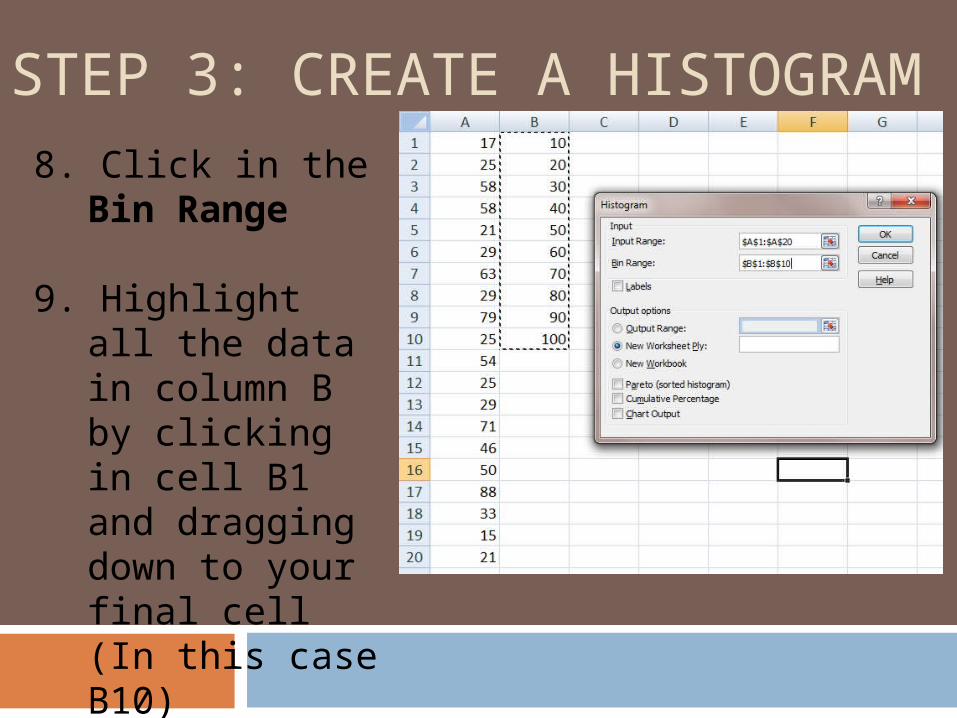
STEP 3: CREATE A HISTOGRAM8. Click in the Bin
Range
9. Highlight all the data in column B by clicking in cell B1 and dragging down to your final cell (In this case B10)
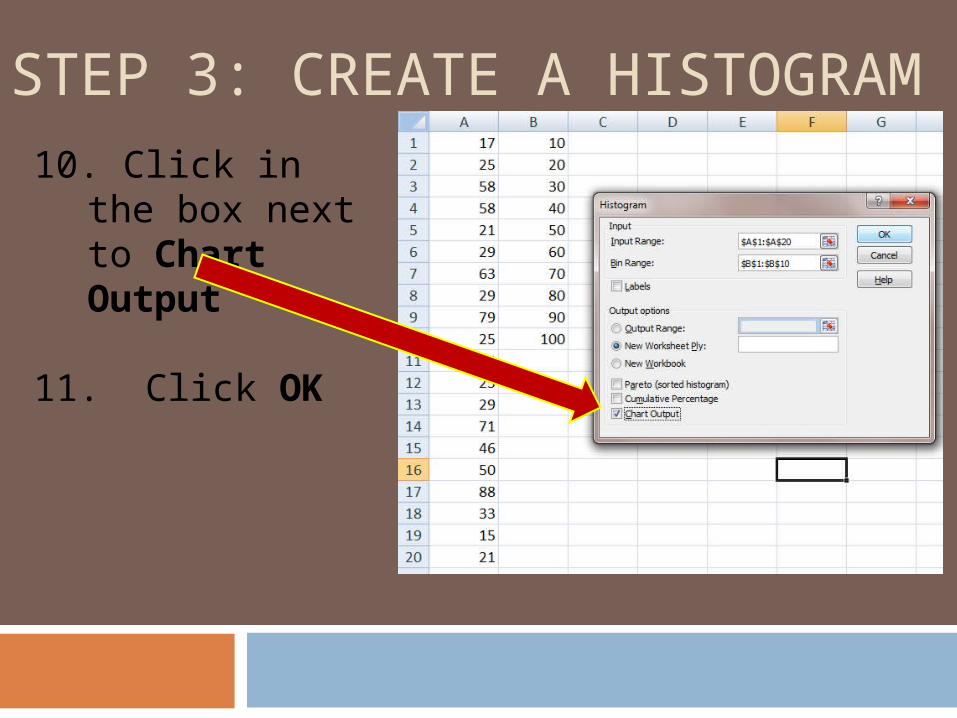
STEP 3: CREATE A HISTOGRAM10. Click in the
box next to Chart Output
11. Click OK
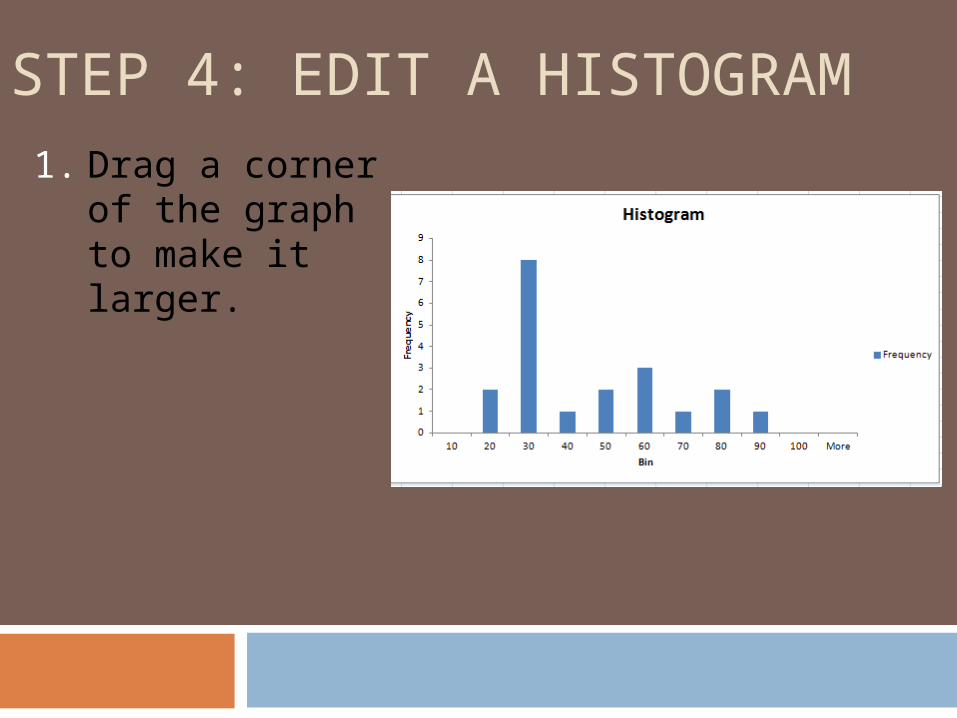
STEP 4: EDIT A HISTOGRAM1. Drag a corner of
the graph to make it larger.
STEP 4: EDIT A HISTOGRAM1. Drag a corner of
the graph to make it larger.
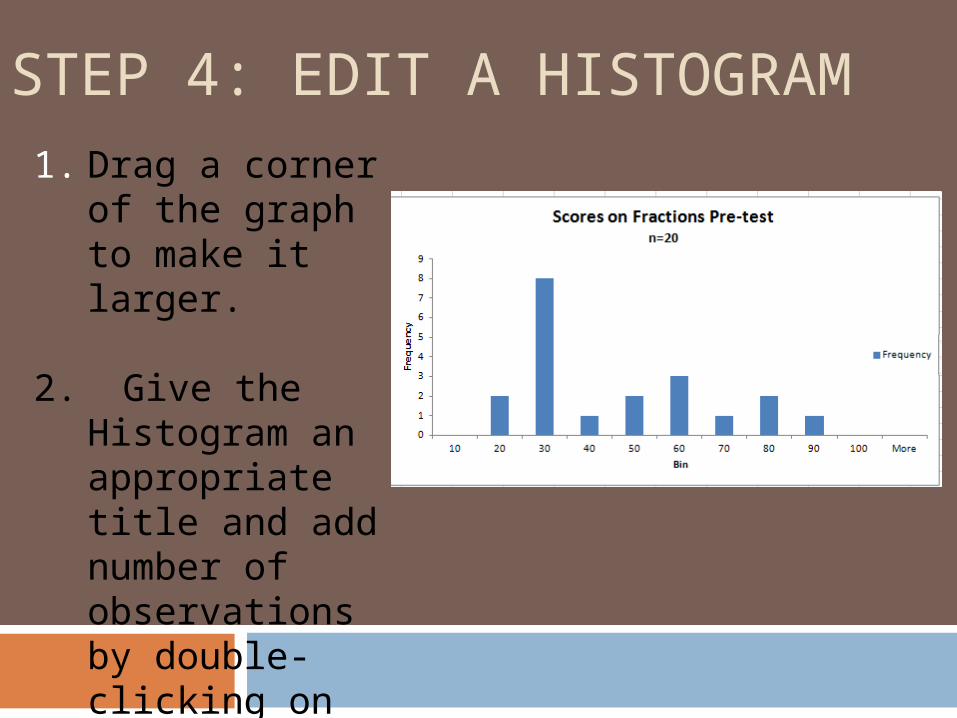
2. Give the
Histogram an appropriate title and add number of observations by double-clicking on the word Histogram
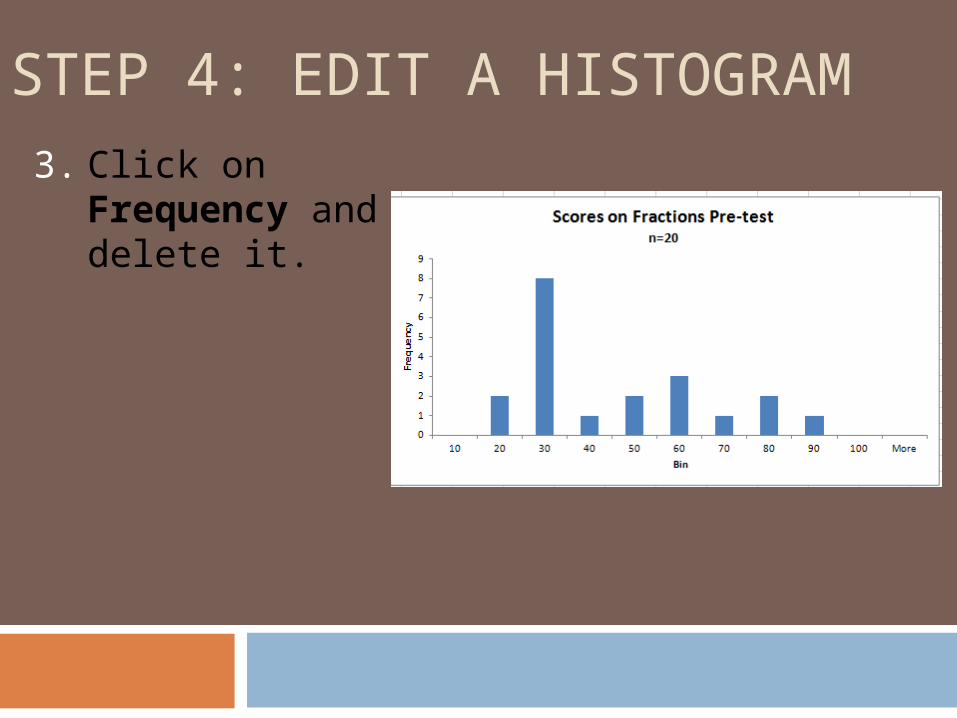
STEP 4: EDIT A HISTOGRAM3. Click on
Frequency and delete it.
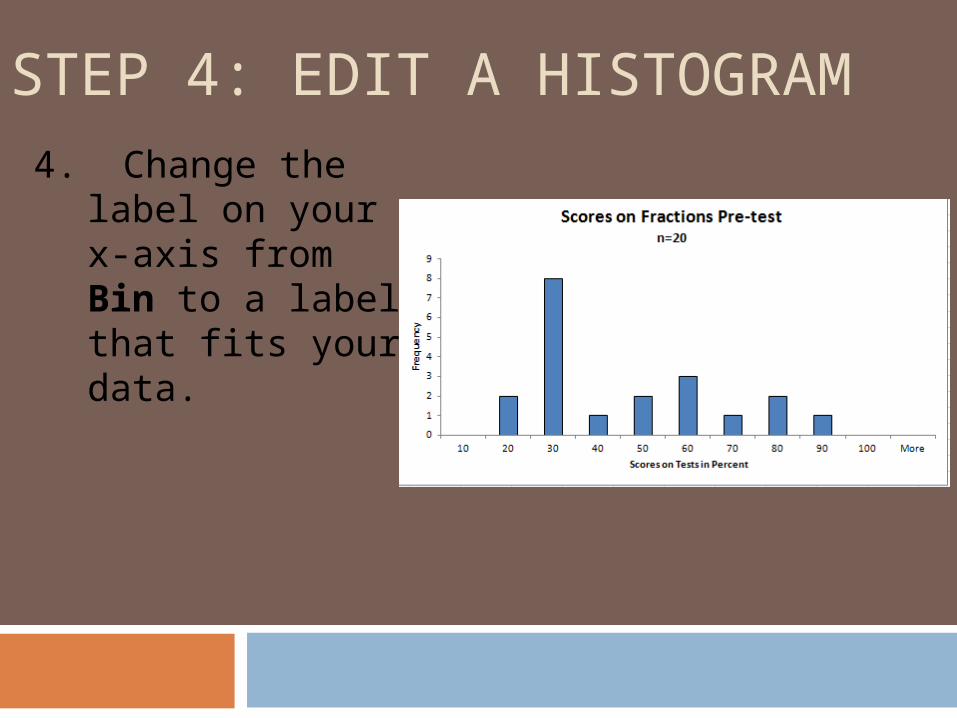
STEP 4: EDIT A HISTOGRAM4. Change the
label on your x-axis from Bin to a label that fits your data.
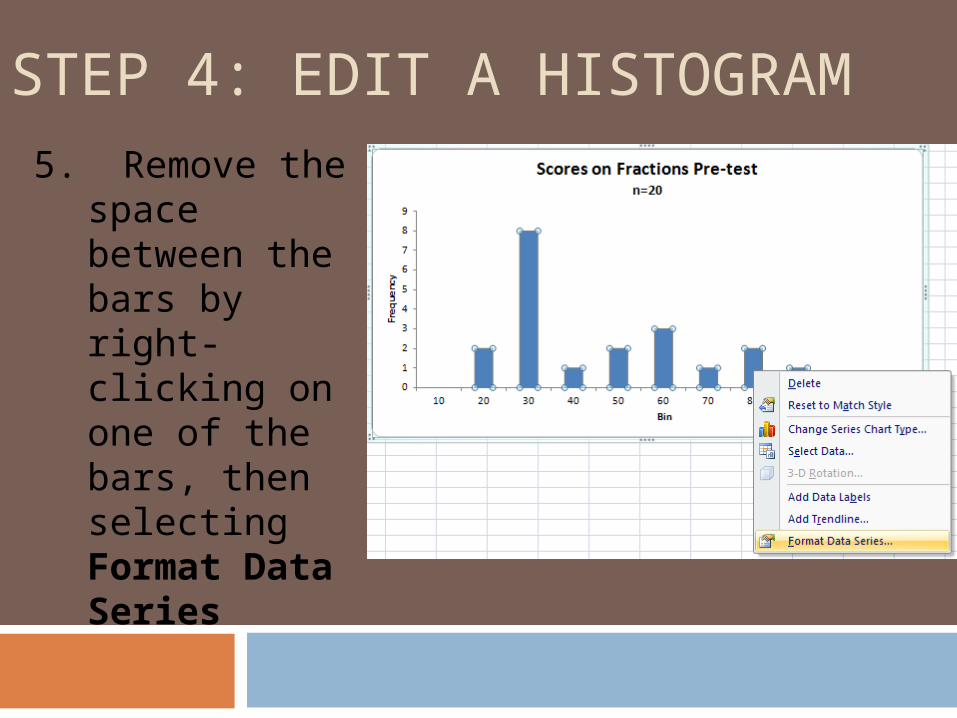
STEP 4: EDIT A HISTOGRAM5. Remove the
space between the bars by right-clicking on one of the bars, then selecting Format Data Series
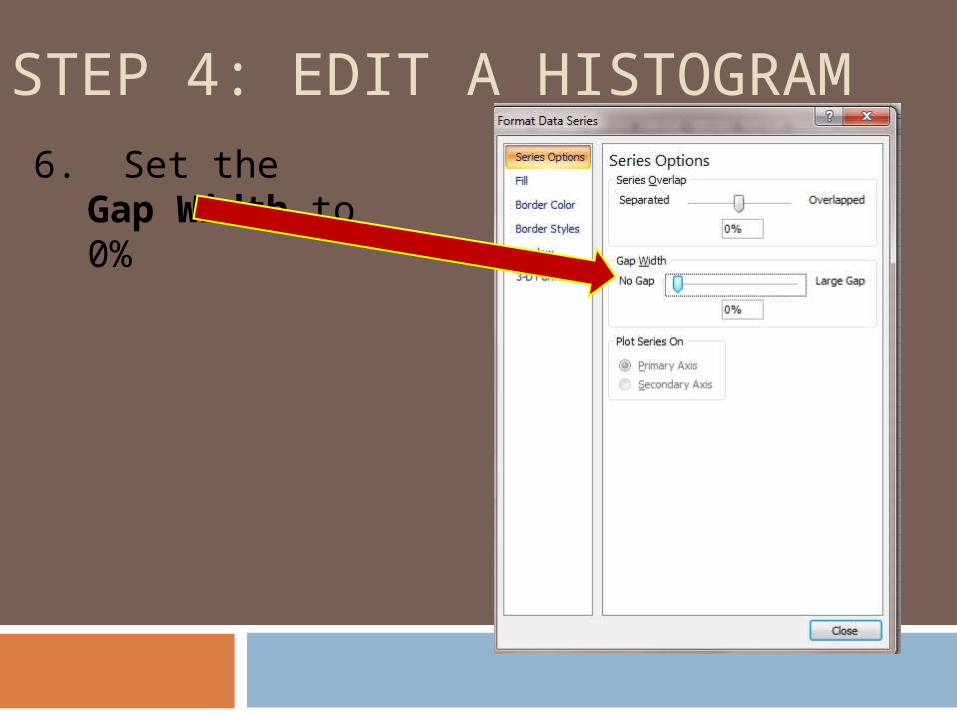
STEP 4: EDIT A HISTOGRAM6. Set the Gap
Width to 0%
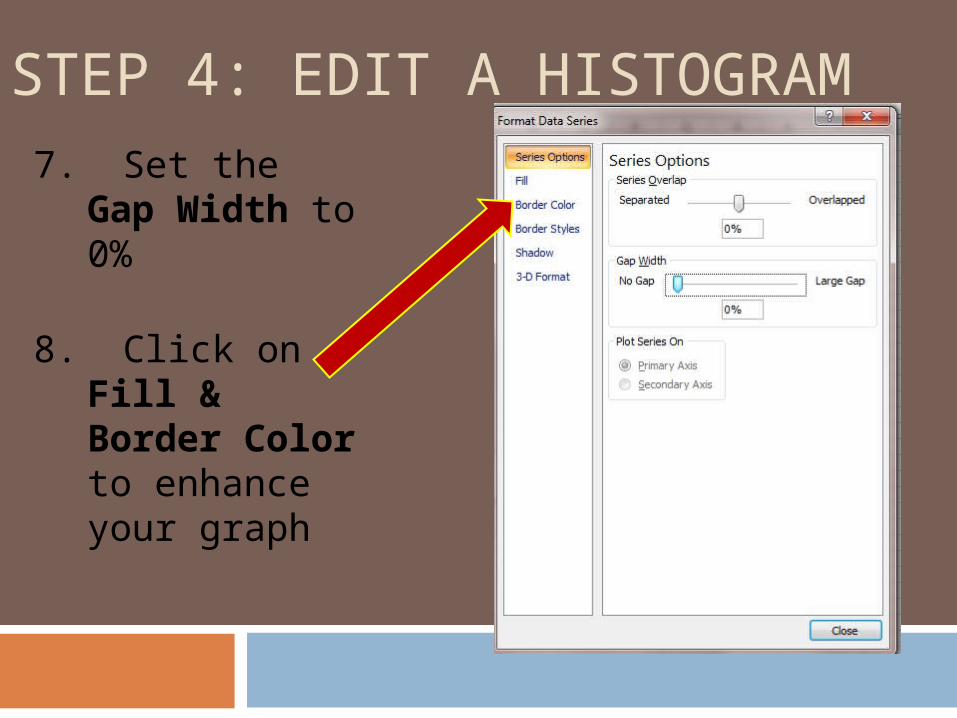
STEP 4: EDIT A HISTOGRAM7. Set the Gap
Width to 0%
8. Click on Fill & Border Color to enhance your graph
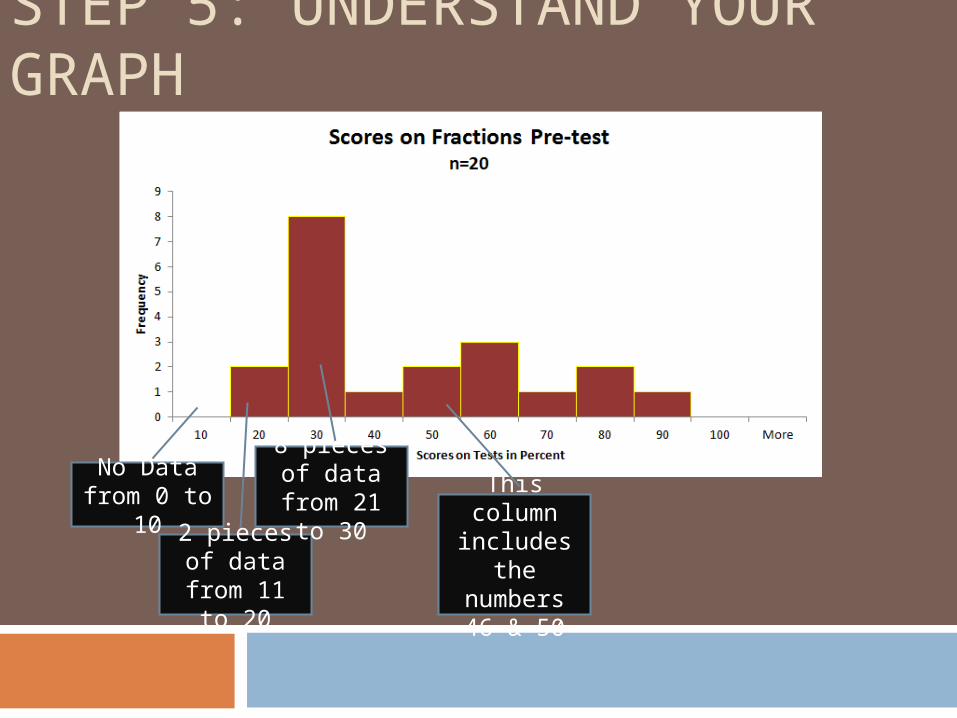
STEP 5: UNDERSTAND YOUR GRAPH
No Data from 0 to
102 pieces of data from 11 to 20
8 pieces of data from 21 to 30
This column includes
the numbers 46 & 50
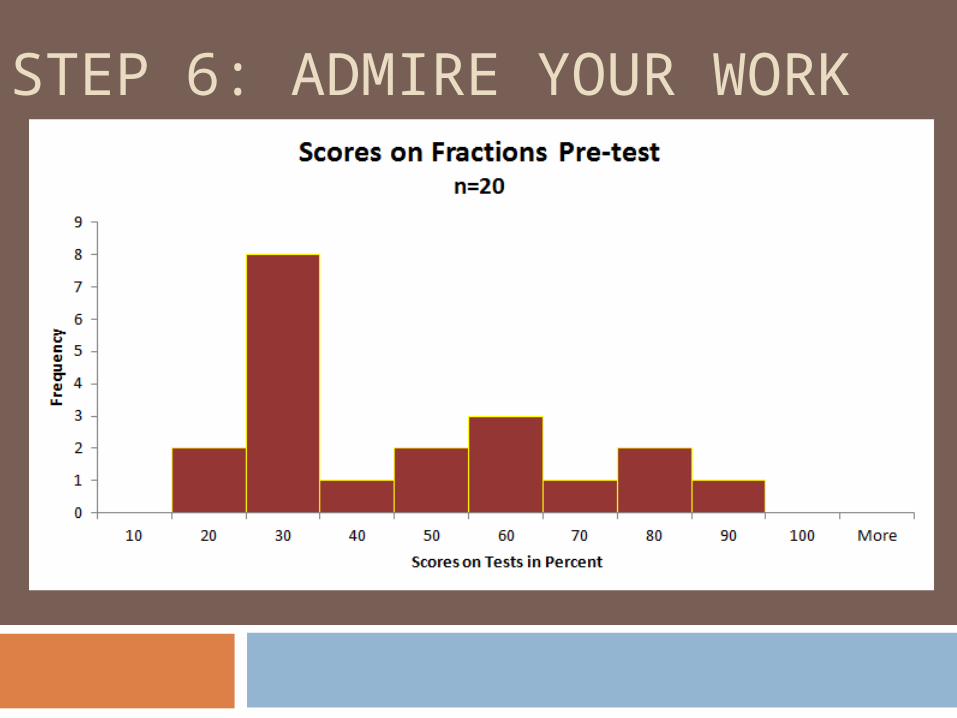
STEP 6: ADMIRE YOUR WORK