Embed Size (px)
Citation preview

Agenda
• Introduction
• Machine Learning: Exploration vs Solution
• CRISP-DM
• Data Flow considerations
• Other key considerations
• Q&A
2
Introduction – Litan ilany
• Data Scientist Leader at Intel’s Advanced Analytics team.
• Owns a M.Sc. degree in Information-Systems Engineering at BGU (focused on Machine-Learning and Reinforcement-Learning)
• Married + 2, Live in Kiryat Motzkin
3

Advanced analytics team
Radical improvement of critical processes
Validation
Design Product DevCost, quality, performance
Unlimited scale
SalesSmart Clinical
Trials
Health Industrial AiEdge-Fog-Cloud
platform
IoT Analytics
Help Building AI Competitive products
Breakthrough Technology that Scales
4

Machine Learning
• Statistics
• Pattern recognition
• Generalization / Inductive Inference
• Types of learning:
• Supervised vs Unsupervised Learning
• Passive vs Active & Reinforcement Learning
• Batch vs Online Learning
5

ML – Algorithm vs Solution
• “Given a data matrix…” – does not exist in real life
• Pareto Principle (80/20 rule)
• Technical aspects
• Business needs
• Extreme cases
6
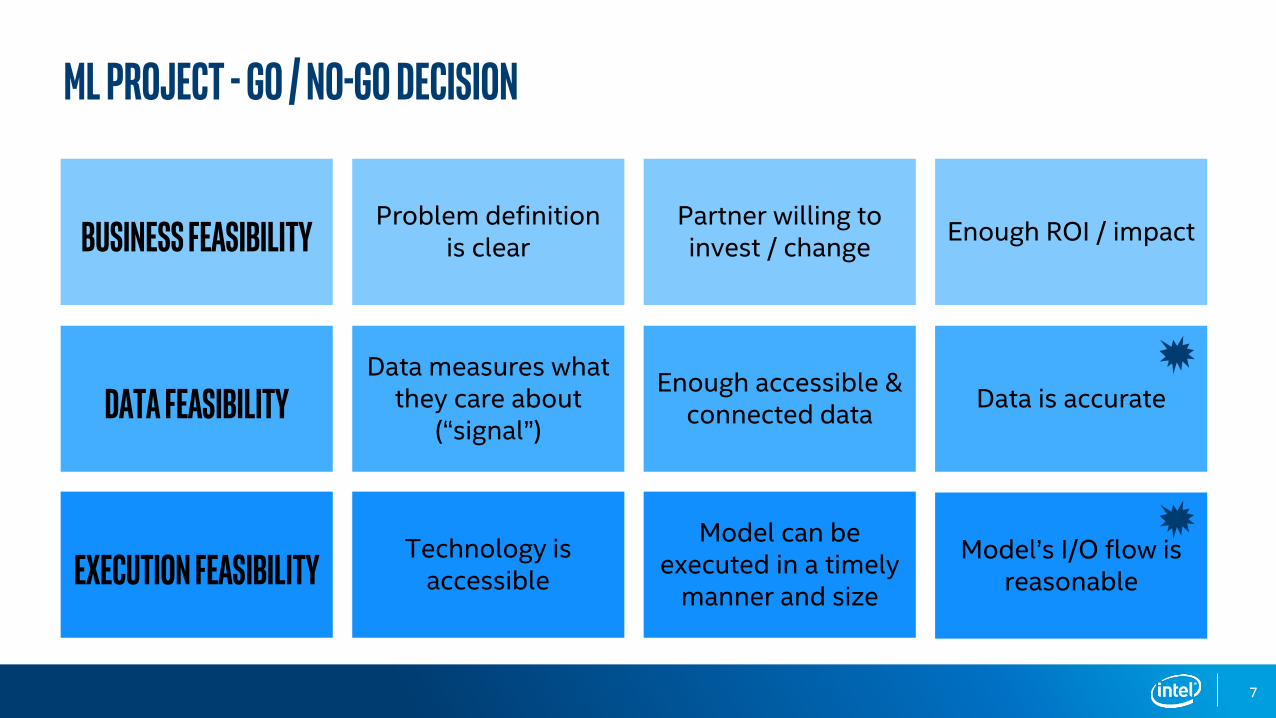
ML project - Go / No-Go Decision
Business Feasibility
Data Feasibility
Execution Feasibility
Problem definition is clear
Partner willing to invest / change
Enough ROI / impact
Data measures what they care about
(“signal”)Data is accurate
Enough accessible & connected data
Technology is accessible
Model can be executed in a timely
manner and size
Model’s I/O flow is reasonable
7

CRISP-DM
Cross-Industry Standard Process for Data Mining
• A structed methodology for DM projects
• Based on practical, real-world experience
• Conceived in 1996-7
8
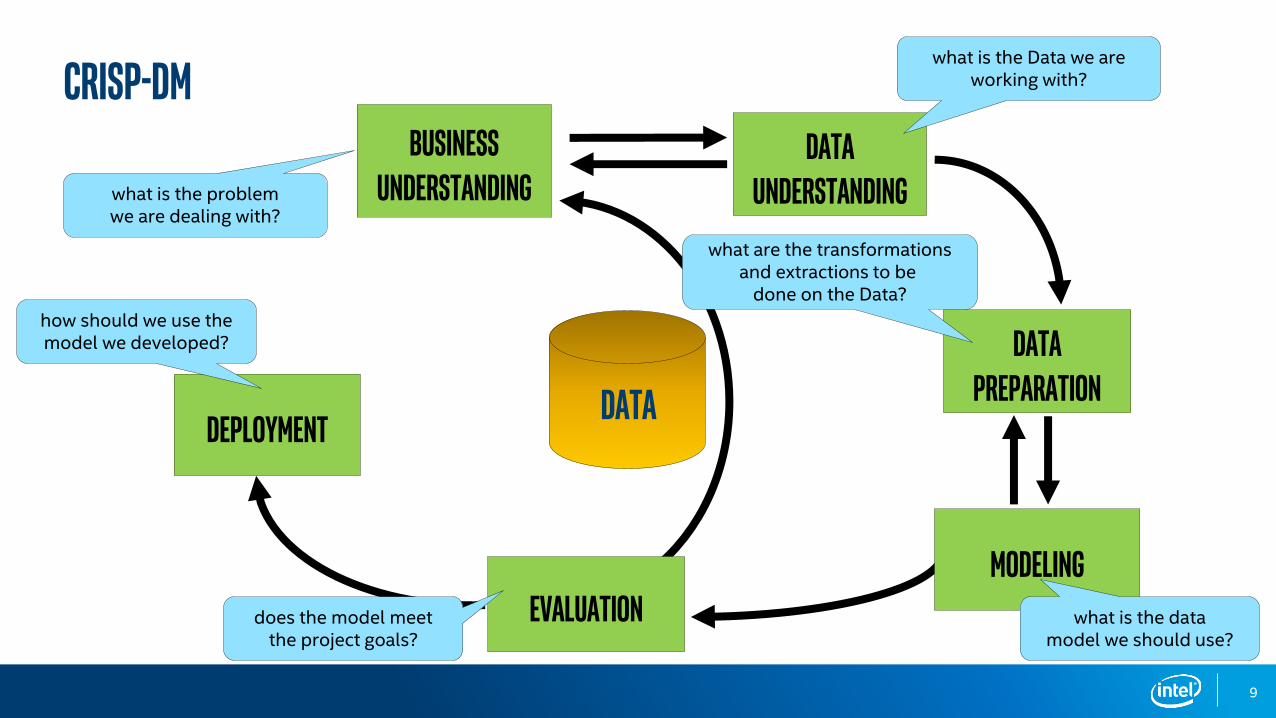
CRISP-DMBusiness
UnderstandingData
Understanding
DataPreparation
Deployment
EvaluationModeling
what is the problemwe are dealing with?
what is the Data we areworking with?
what are the transformationsand extractions to be
done on the Data?
what is the datamodel we should use?
does the model meetthe project goals?
how should we use themodel we developed?
Data
9
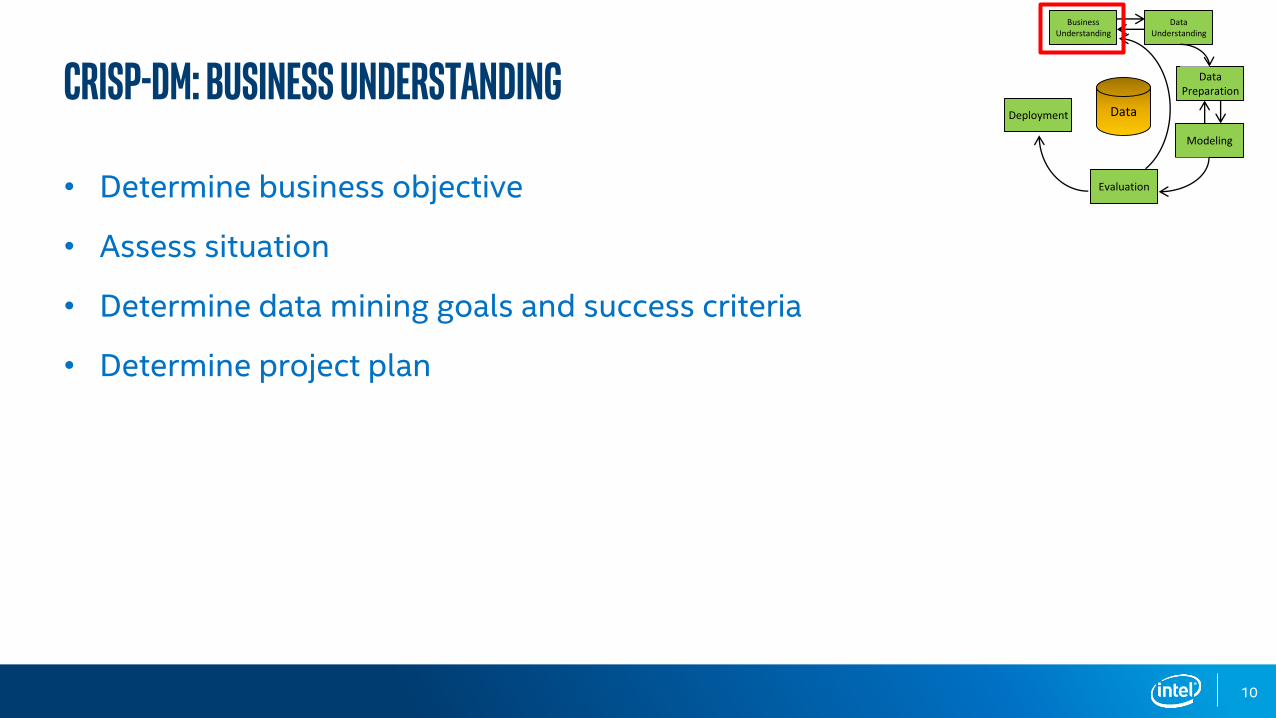
• Determine business objective
• Assess situation
• Determine data mining goals and success criteria
• Determine project plan
Crisp-dm: business understanding
BusinessUnderstanding
DataUnderstanding
DataPreparation
Modeling
Evaluation
Deployment Data
10

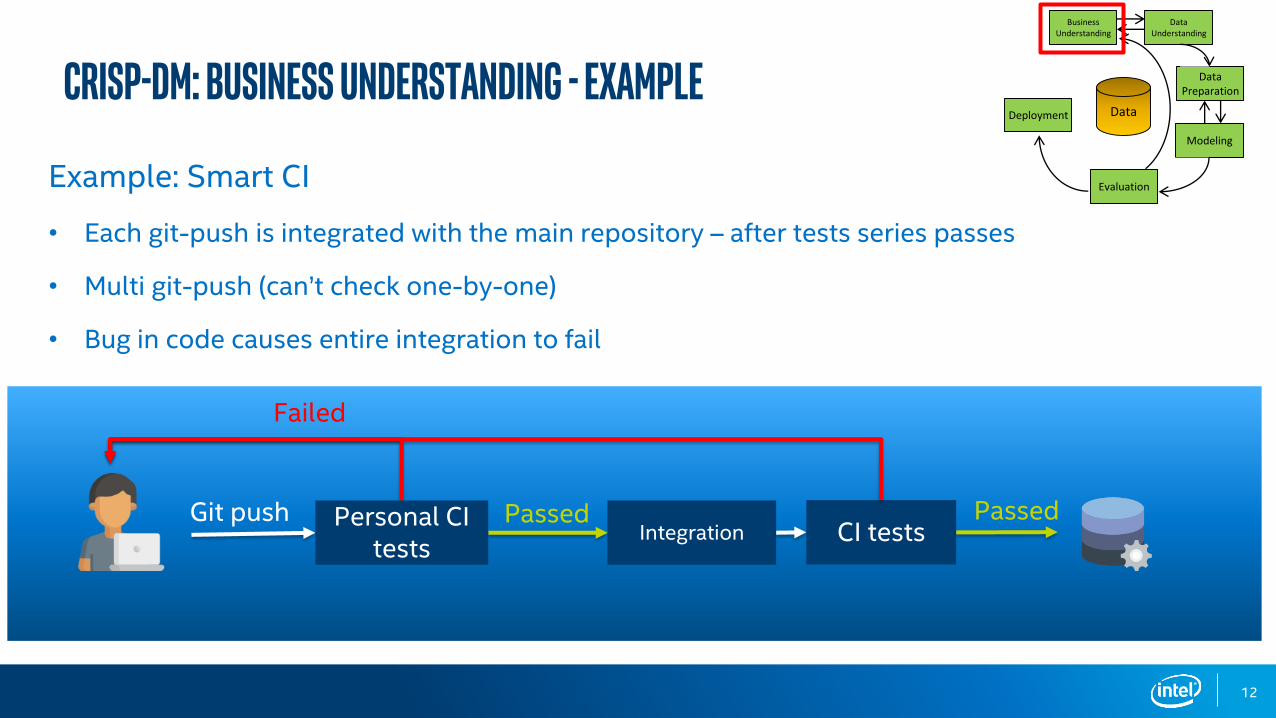
Example: Smart CI
• Each git-push is integrated with the main repository – after tests series passes
• Multi git-push (can’t check one-by-one)
• Bug in code causes entire integration to fail
Crisp-dm: business understanding - eXample
PassedCI tests
Git push
Failed
Integration
BusinessUnderstanding
DataUnderstanding
DataPreparation
Modeling
Evaluation
Deployment Data
11
PassedCI tests
Git push
Failed
IntegrationPassedPersonal CI
tests
Example: Smart CI
• Each git-push is integrated with the main repository – after tests series passes
• Multi git-push (can’t check one-by-one)
• Bug in code causes entire integration to fail
Crisp-dm: business understanding - eXample
BusinessUnderstanding
DataUnderstanding
DataPreparation
Modeling
Evaluation
Deployment Data
12

• Goals and success criteria:
• Reduce Turnaround Time (TAT)
• At least 20% time reduction
• Project plan
Crisp-dm: business understanding - example
Git push PassedIntegration + CI tests
Failed
Predict “pass”
Personal CI tests
ML solution
Predict “fail”
Failed Passed
BusinessUnderstanding
DataUnderstanding
DataPreparation
Modeling
Evaluation
Deployment Data
13
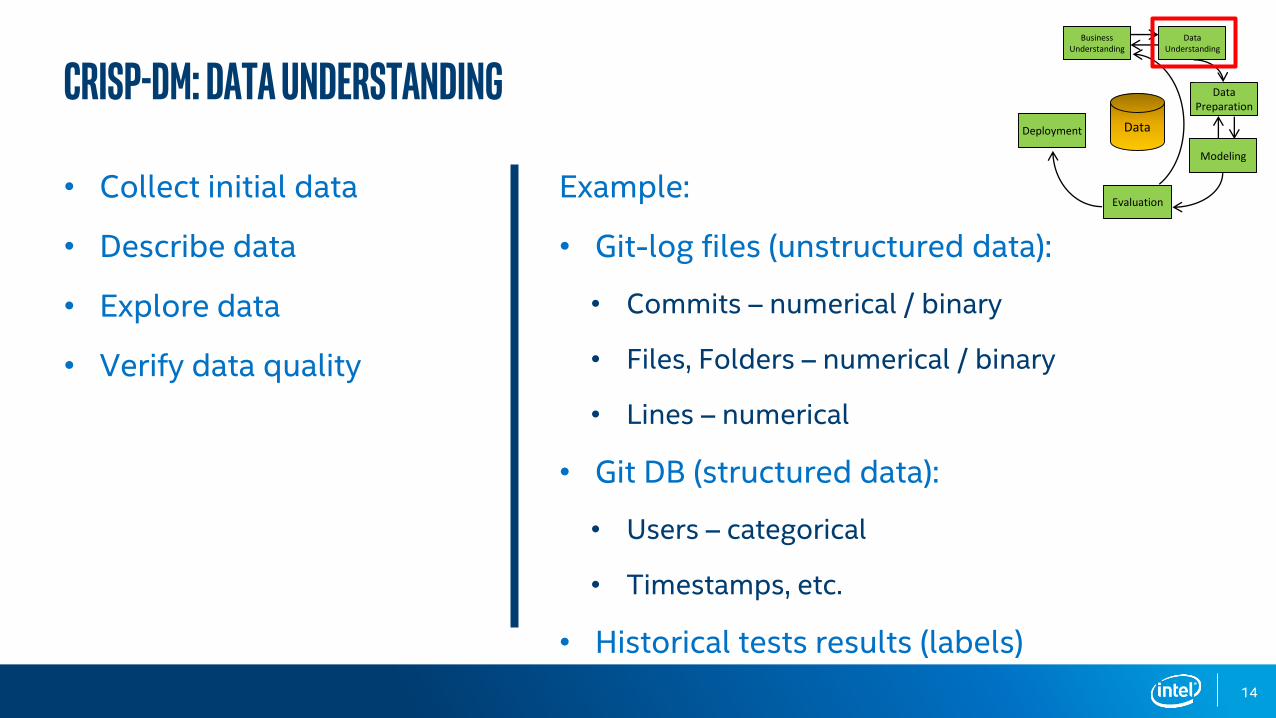
• Collect initial data
• Describe data
• Explore data
• Verify data quality
Example:
• Git-log files (unstructured data):
• Commits – numerical / binary
• Files, Folders – numerical / binary
• Lines – numerical
• Git DB (structured data):
• Users – categorical
• Timestamps, etc.
• Historical tests results (labels)
Crisp-dm: data understandingBusiness
UnderstandingData
Understanding
DataPreparation
Modeling
Evaluation
Deployment Data
14

• Integrate data from multi sources
• Format data
• Feature extraction
• Clean data
• Construct data
• Derive attributes – transformation
• Reduce imbalance data
• Fill in missing values
• Feature selection
Example:
• Generate features from log
• Generate and clean user-features
• Normalize counters
• Thousands of features – remove unnecessary ones
• Data balancing (if needed)
Crisp-dm: data preparationBusiness
UnderstandingData
Understanding
DataPreparation
Modeling
Evaluation
Deployment Data
15
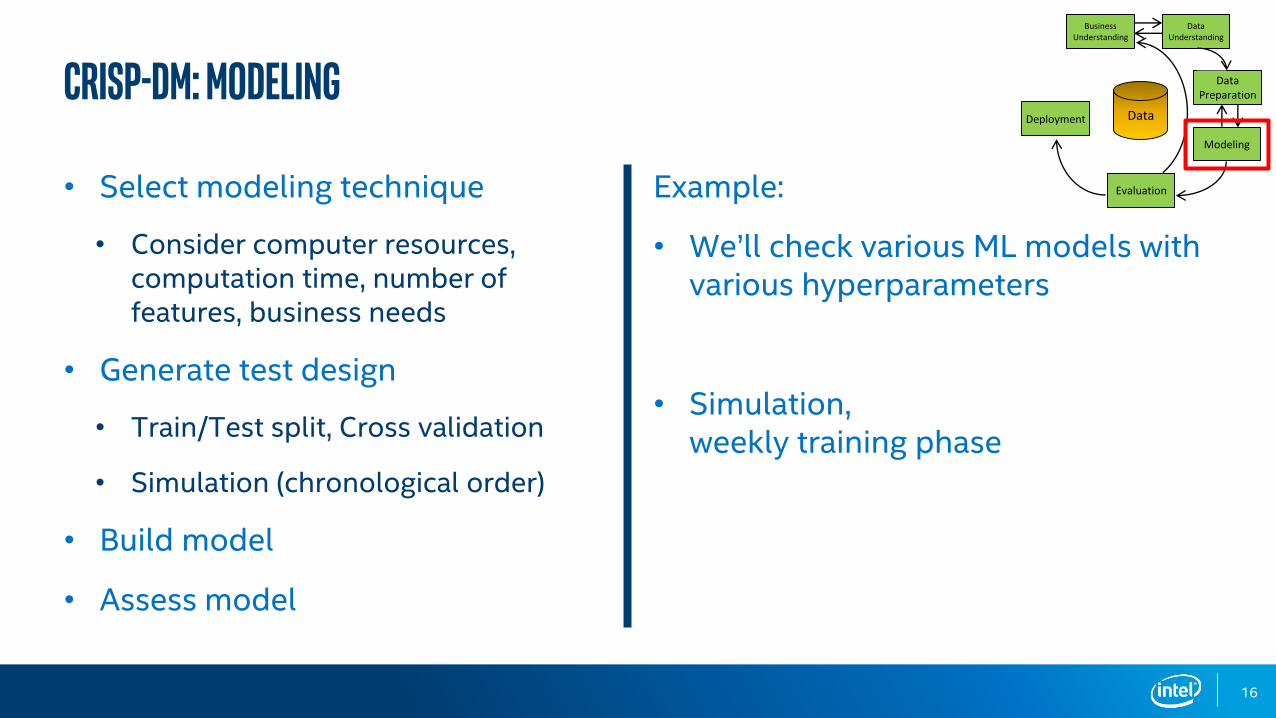
• Select modeling technique
• Consider computer resources, computation time, number of features, business needs
• Generate test design
• Train/Test split, Cross validation
• Simulation (chronological order)
• Build model
• Assess model
Example:
• We’ll check various ML models with various hyperparameters
• Simulation, weekly training phase
Crisp-dm: modelingBusiness
UnderstandingData
Understanding
DataPreparation
Modeling
Evaluation
Deployment Data
16
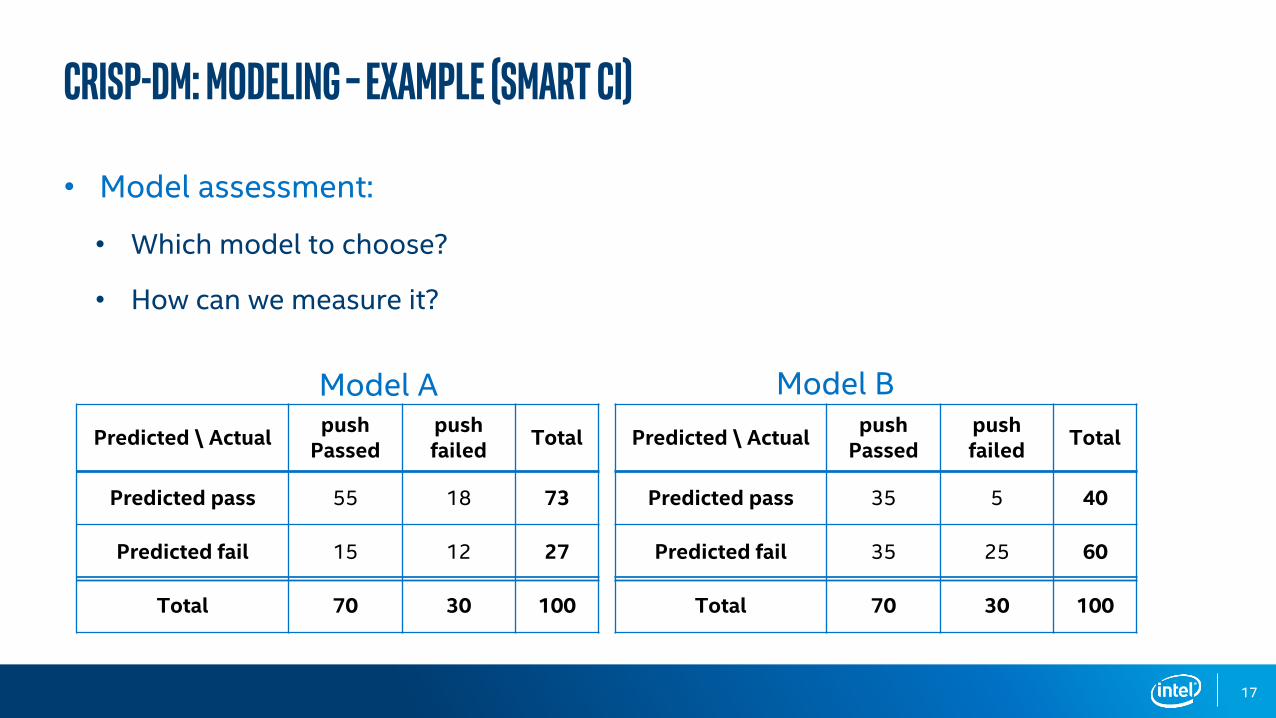
Crisp-dm: modeling – example (smart ci)
Predicted \ Actualpush
Passedpushfailed
Total
Predicted pass 55 18 73
Predicted fail 15 12 27
Total 70 30 100
Predicted \ Actualpush
Passedpushfailed
Total
Predicted pass 35 5 40
Predicted fail 35 25 60
Total 70 30 100
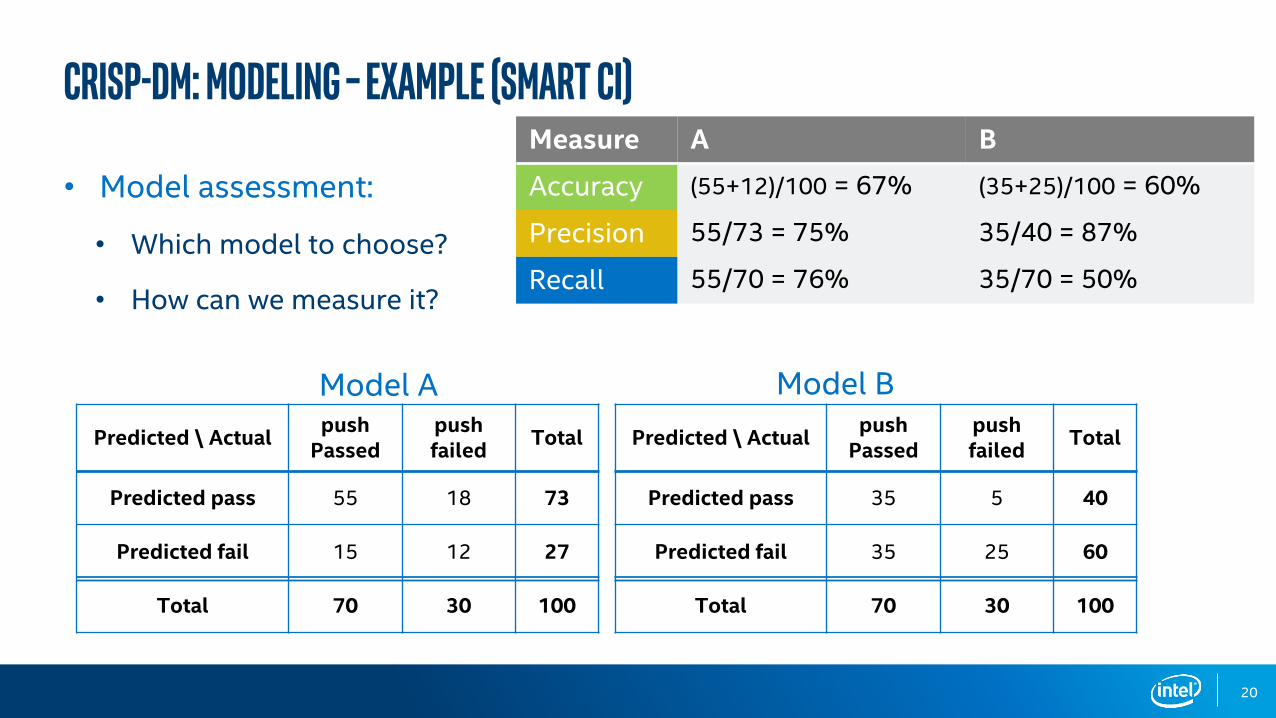
• Model assessment:
• Which model to choose?
• How can we measure it?
Model A Model B
17

Crisp-dm: modeling – example (smart ci)
Predicted \ Actualpush
Passedpushfailed
Total
Predicted pass 55 18 73
Predicted fail 15 12 27
Total 70 30 100
Predicted \ Actualpush
Passedpushfailed
Total
Predicted pass 35 5 40
Predicted fail 35 25 60
Total 70 30 100
• Model assessment:
• Which model to choose?
• How can we measure it?
Measure A B
Accuracy (55+12)/100 = 67% (35+25)/100 = 60%
Model A Model B
18

Crisp-dm: modeling – example (smart ci)
Predicted \ Actualpush
Passedpushfailed
Total
Predicted pass 55 18 73
Predicted fail 15 12 27
Total 70 30 100
Predicted \ Actualpush
Passedpushfailed
Total
Predicted pass 35 5 40
Predicted fail 35 25 60
Total 70 30 100
• Model assessment:
• Which model to choose?
• How can we measure it?
Measure A B
Accuracy (55+12)/100 = 67% (35+25)/100 = 60%
Precision 55/73 = 75% 35/40 = 87%
Model A Model B
19
Crisp-dm: modeling – example (smart ci)
Predicted \ Actualpush
Passedpushfailed
Total
Predicted pass 55 18 73
Predicted fail 15 12 27
Total 70 30 100
Predicted \ Actualpush
Passedpushfailed
Total
Predicted pass 35 5 40
Predicted fail 35 25 60
Total 70 30 100
• Model assessment:
• Which model to choose?
• How can we measure it?
Measure A B
Accuracy (55+12)/100 = 67% (35+25)/100 = 60%
Precision 55/73 = 75% 35/40 = 87%
Recall 55/70 = 76% 35/70 = 50%
Model A Model B
20
Crisp-dm: modeling – example (smart ci)
Predicted \ Actualpush
Passedpushfailed
Total
Predicted pass 55 18 73
Predicted fail 15 12 27
Total 70 30 100
Predicted \ Actualpush
Passedpushfailed
Total
Predicted pass 35 5 40
Predicted fail 35 25 60
Total 70 30 100
Model A Model B
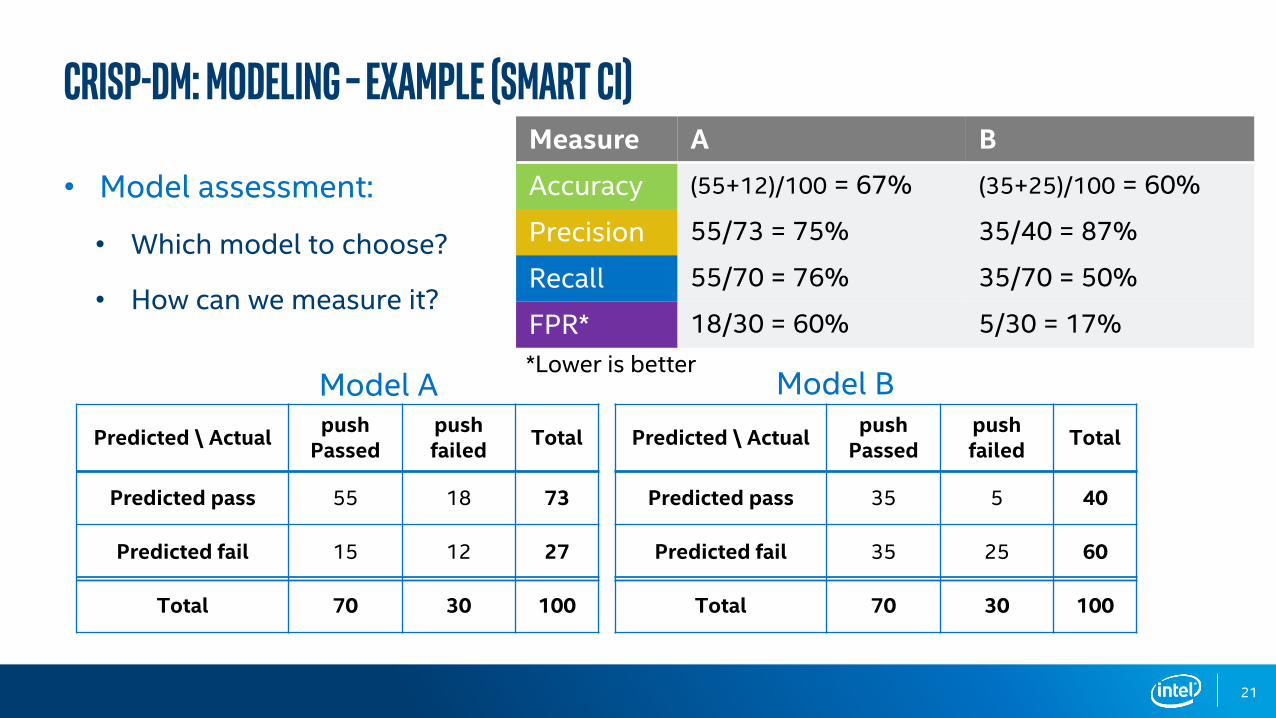
• Model assessment:
• Which model to choose?
• How can we measure it?
Measure A B
Accuracy (55+12)/100 = 67% (35+25)/100 = 60%
Precision 55/73 = 75% 35/40 = 87%
Recall 55/70 = 76% 35/70 = 50%
FPR* 18/30 = 60% 5/30 = 17%
*Lower is better
21

Crisp-dm: modeling – example (smart ci)
KNN
NN
Random Forest
SVM
GBT
Simple
Regression
Decision Tree
Complex
Business ease of explanation
22
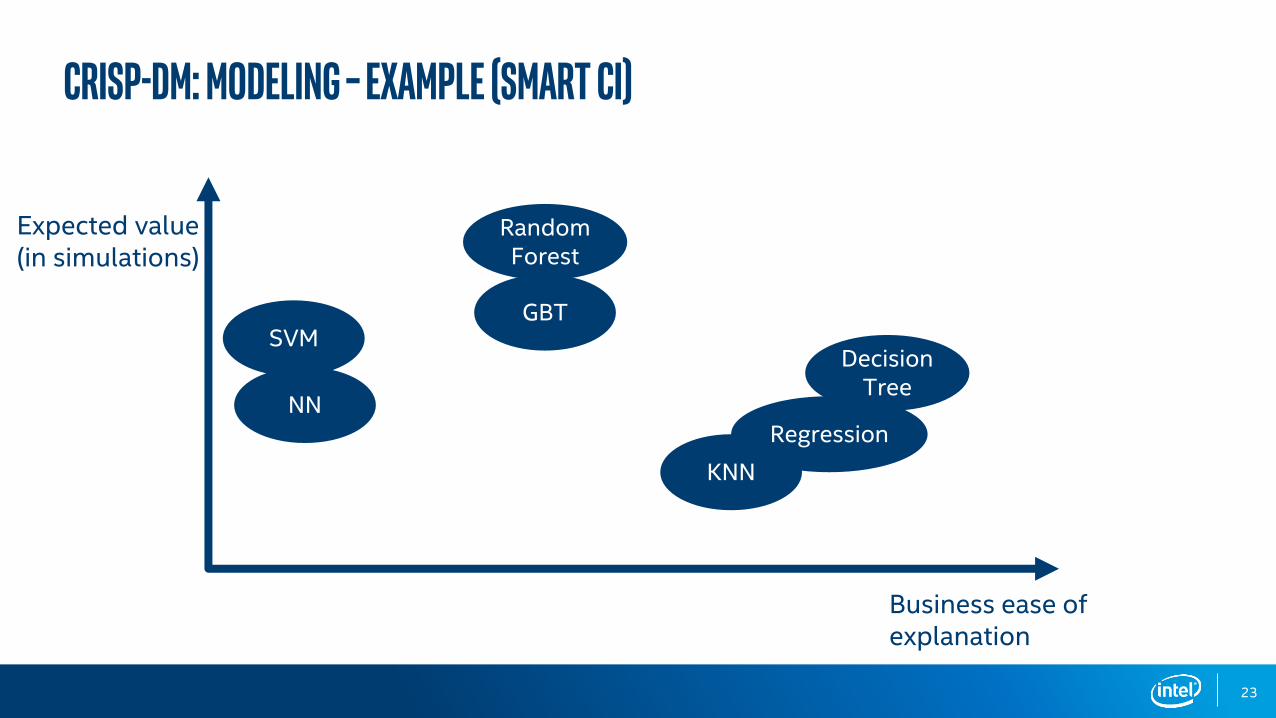
Crisp-dm: modeling – example (smart ci)
KNN
NN
Decision Tree
Random Forest
SVMGBT
Business ease of explanation
Expected value(in simulations)
Regression
23
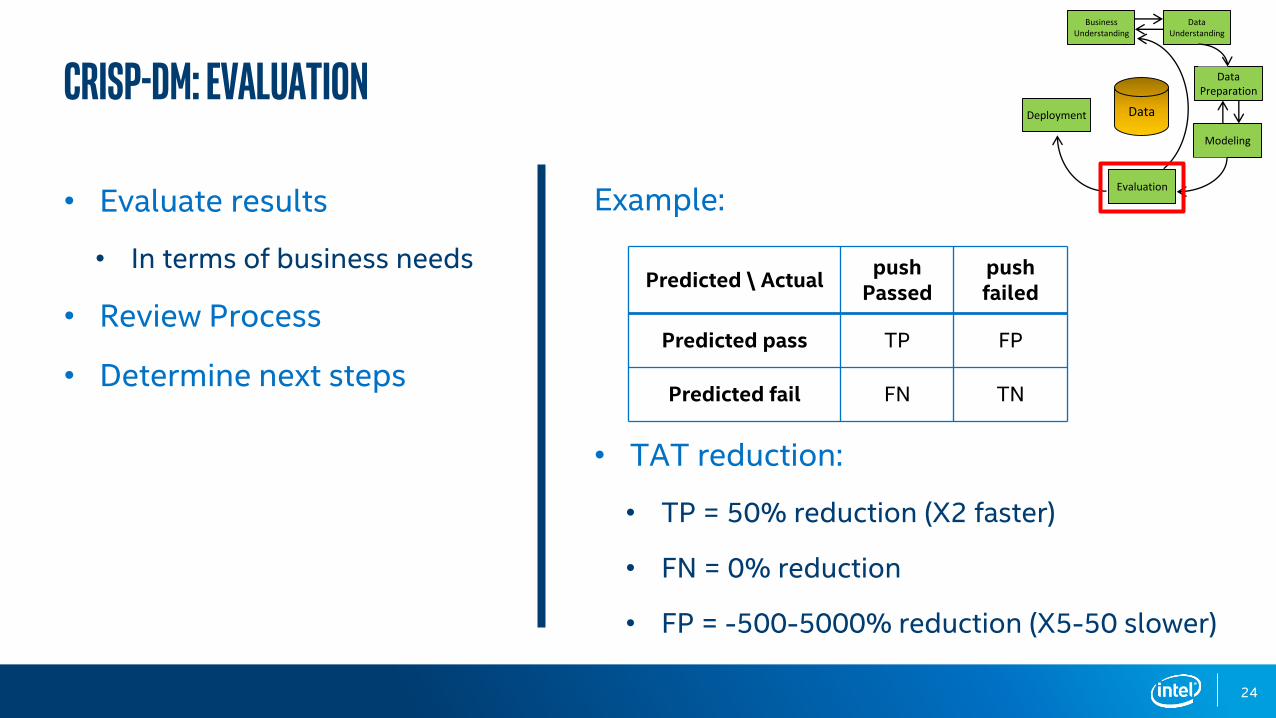
• Evaluate results
• In terms of business needs
• Review Process
• Determine next steps
Example:
• TAT reduction:
• TP = 50% reduction (X2 faster)
• FN = 0% reduction
• FP = -500-5000% reduction (X5-50 slower)
crisp-dm: evaluation
BusinessUnderstanding
DataUnderstanding
DataPreparation
Modeling
Evaluation
Deployment Data
Predicted \ Actualpush
Passedpushfailed
Predicted pass TP FP
Predicted fail FN TN
24
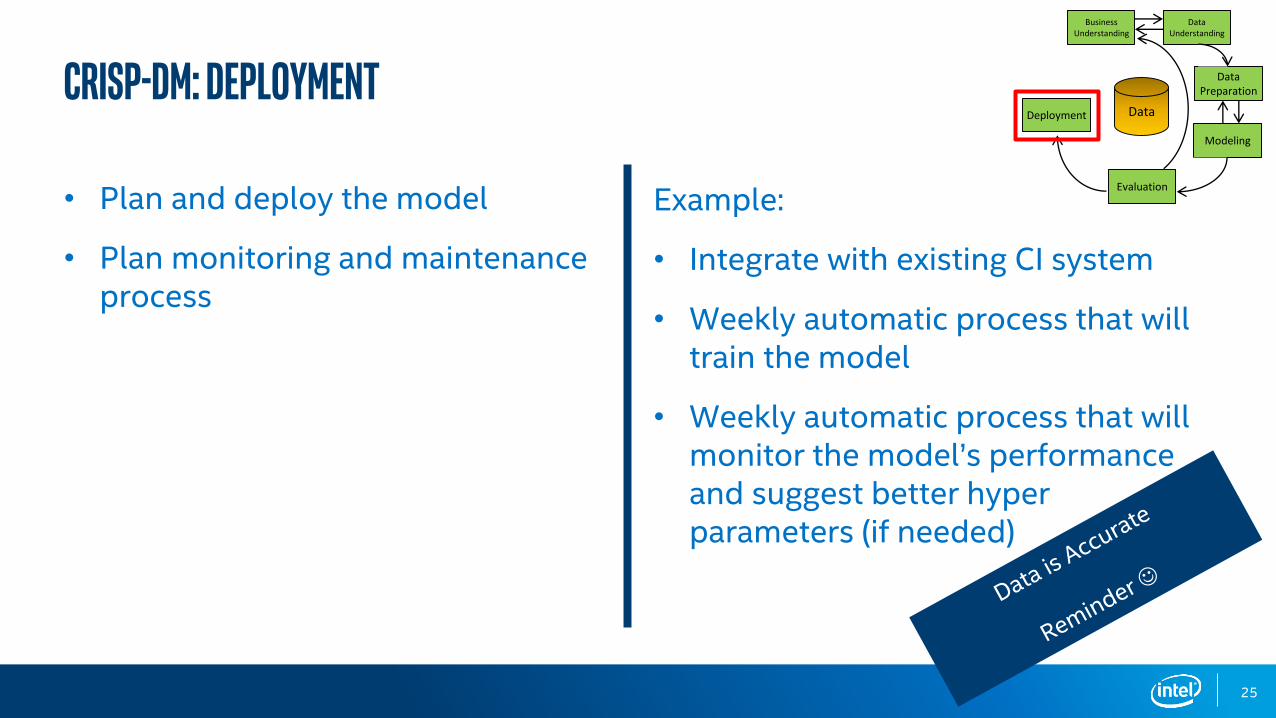
• Plan and deploy the model
• Plan monitoring and maintenance process
Example:
• Integrate with existing CI system
• Weekly automatic process that will train the model
• Weekly automatic process that will monitor the model’s performance and suggest better hyper parameters (if needed)
Crisp-dm: deployment
BusinessUnderstanding
DataUnderstanding
DataPreparation
Modeling
Evaluation
Deployment Data
25

CRISP-DM: data flowBusiness
UnderstandingData
Understanding
DataPreparation
Deployment
Data Flow Architecture
DataSchema
Architecture
EvaluationModeling
Data
Data flow Implementation
Data flow validation
26

Other key considerations
• Use Git (or other version control platform)
• Automate the research process (trial-and-error)
• Use Docker containers
• TEST YOUR CODE (don’t think of it as black box)
• ML Technical Debt – code and data
27

references
CRISP-DM (Wikipedia)
4 things DSs should learn from software engineers
Machine Learning: The High Interest Credit Card of Technical Debt
28