Embed Size (px)
Citation preview
How to Adapt Data Analytics for Data-Driven Decision Making
September 20, 2017

Introduction
9/20/2017 © Care Bridge International 2017 2
Jim Paugh, SVP
Deborah has worked closely with theCenters for Medicare and MedicaidServices (CMS) as the first reporting agentparticipating in beta testing. She alsoworked with CMS and congressional staffadvocating for transparency andimprovements in the MSP program.
Deborah Watkins, CEO
Jim has an extensive background withinworkers’ compensation insurance from safetyand loss control to claim management andconsulting to underwriting and claimanalytics. He has developed many KeyPerformance Indicators for use by regulators,carriers and Fortune 500 employers as well asassociated predictive models for claimcomplexity, case management and provideroutcomes.
During her tenure at Gould & Lamb, the company received the 2010Oracle Titan Award and Gartner 1to1 CRM Silver Award for technologyimplementation of an enterprise analytics platform.
Deborah has worked in major roles for group health, workers comp andgroup benefit insurance companies. She participated in the FederalMedicare + Choice pilot program, the precursor for Medicare AdvantageC plans and is recognized for excellence in medical claims managementand return to work outcomes.
She has a Master’s in Healthcare Leadership (MBA/MPH) from BrownUniversity and a Master of Science in Nursing. She is a past boardsecretary for the National Association of Medicare Set AsideProfessionals (NAMSAP).
He formerly held leadership positions with Deloitte Consulting, VeriskAnalytics and Paradigm Management Services. In these positions, hemanaged and worked on projects for predictive modeling in workers’compensation for a $2B underwriter, one of the first claims complexitymodels for a large national carrier and reserving application for anational third-party administrator. Other project work included, WCand liability claim reviews, medical malpractice regulatory audits anddashboard development work for an actuarial firm and carrier.
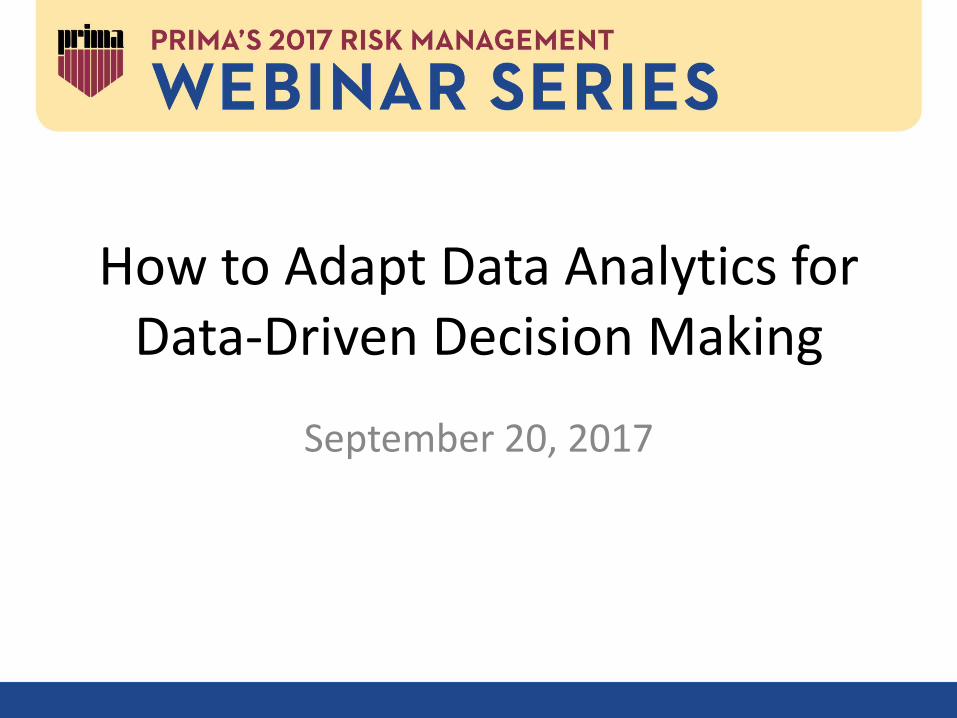
Objectives
Discuss
Introduction to the ever changing world
of data analytics
Understand
How Workers’ Compensation Data
MiningCan Yield Important
and Actionable Information
Learn
How to Develop Key Performance
Indicators/Metrics
9/20/2017 © Care Bridge International 2017 3
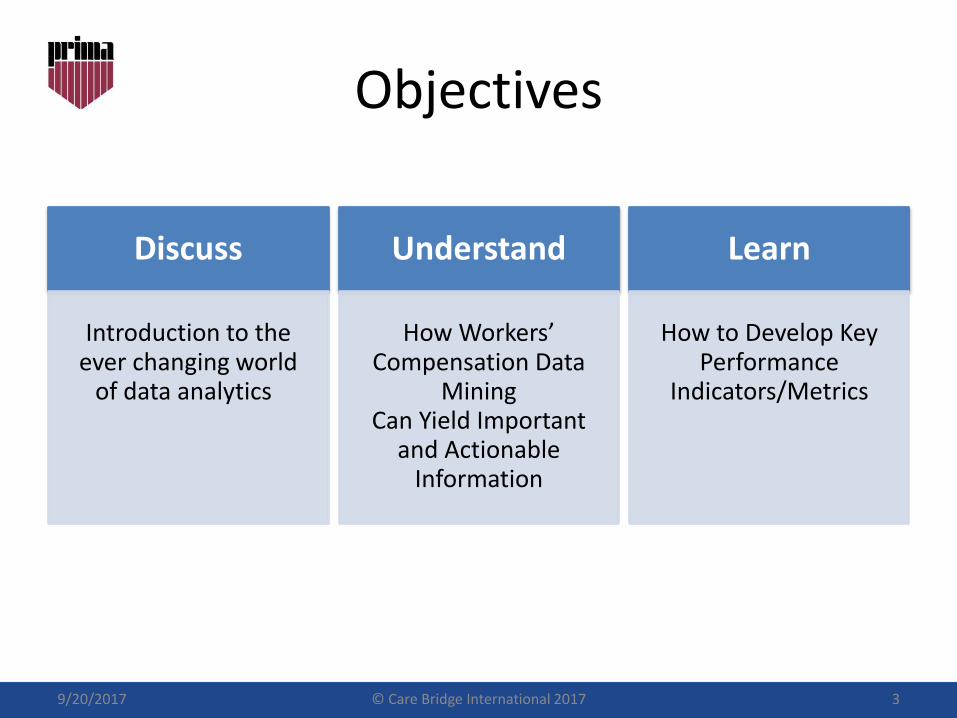
MONEYBALL AND SABERMETRICS Indicators of Offensive Success
9/20/2017 © Care Bridge International 2017 4
Traditional Measure Moneyball Measures
• Batting Average• Home Runs• Pitching Wins• Stolen Bases• RBI’s
• On-Base %-age• Slugging %-age• 100 pitch count
>65% Strikes <58% Strikes
Expected Future Runs Scored in an inning given certain conditions. (1961-77 data set)
The Moneyball Impact
Moneyball changes the way baseball teams evaluate performance for draftees and veteran talent
Moneyball allows teams to focus on value-talent vs. “proto-typical” talent
Moneyball changed the balance of power allowing smaller market teams to compete at the highest levels.
9/20/2017 © Care Bridge International 2017 5
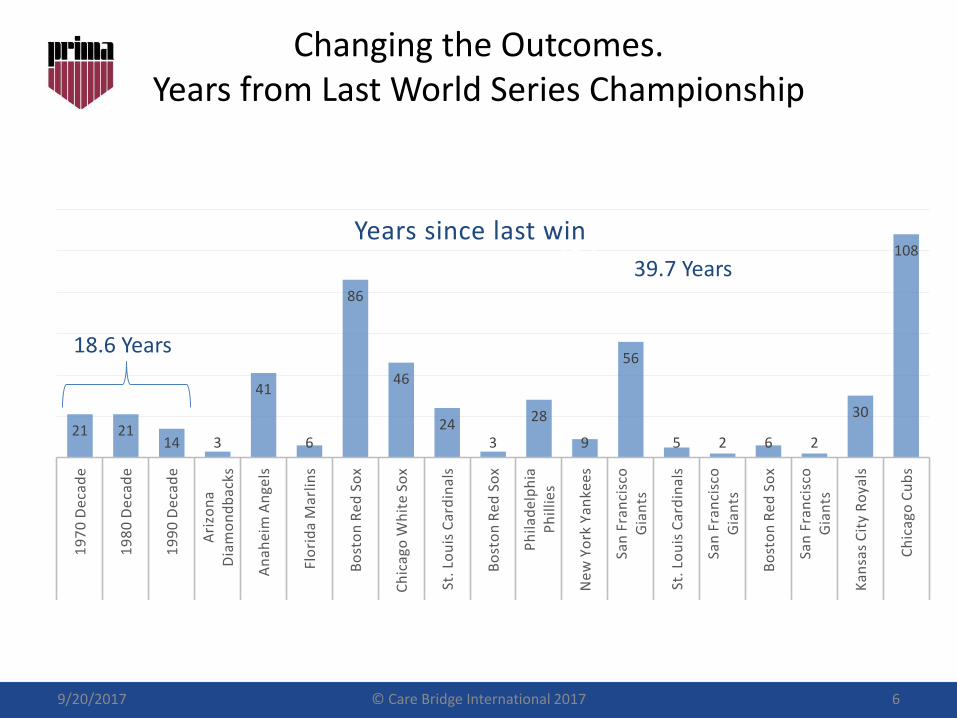
Changing the Outcomes.Years from Last World Series Championship
9/20/2017 © Care Bridge International 2017 6
21 2114 3
41
6
86
46
243
28
9
56
5 2 6 2
30
108
19
70
De
cad
e
19
80
De
cad
e
19
90
De
cad
e
Ari
zon
a D
iam
on
db
acks
An
ahe
im A
nge
ls
Flo
rid
a M
arlin
s
Bo
sto
n R
ed
So
x
Ch
icag
o W
hit
e S
ox
St. L
ou
is C
ard
inal
s
Bo
sto
n R
ed
So
x
Ph
ilad
elp
hia
P
hill
ies
Ne
w Y
ork
Yan
kee
s
San
Fra
nci
sco
G
ian
ts
St. L
ou
is C
ard
inal
s
San
Fra
nci
sco
G
ian
ts
Bo
sto
n R
ed
So
x
San
Fra
nci
sco
G
ian
ts
Kan
sas
Cit
y R
oya
ls
Ch
icag
o C
ub
s
1970 1980 1990 2001 2002 2003 2004 2005 2006 2007 2008 2009 2010 2011 2012 2013 2014 2015 2016
Years since last win
18.6
39.7 Years
18.6 Years
39.7 Years
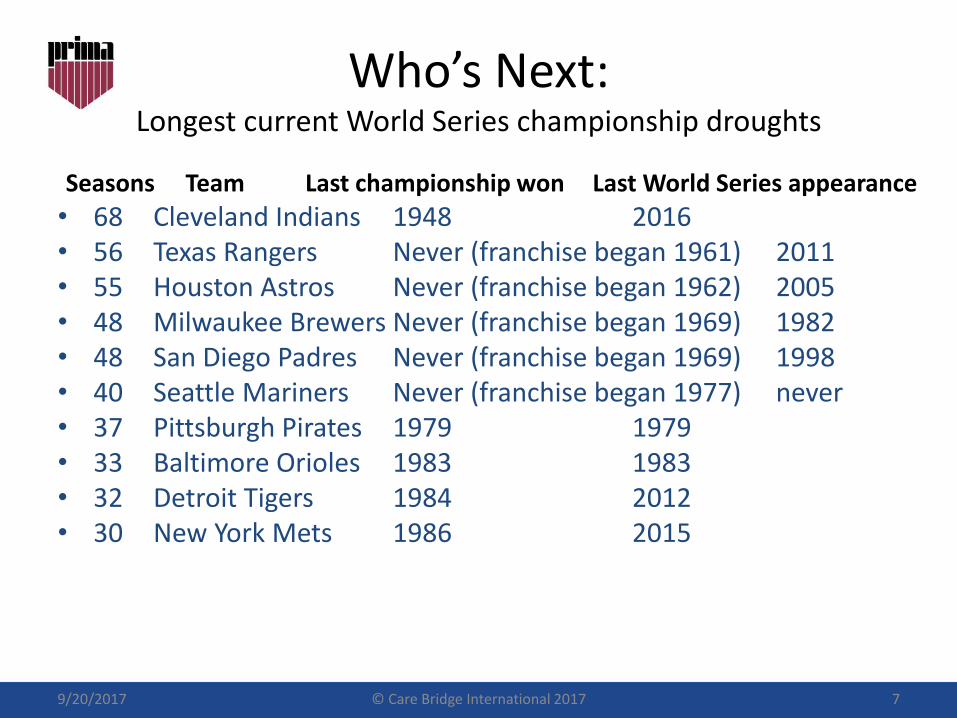
Who’s Next:Longest current World Series championship droughts
Seasons Team Last championship won Last World Series appearance
• 68 Cleveland Indians 1948 2016• 56 Texas Rangers Never (franchise began 1961) 2011• 55 Houston Astros Never (franchise began 1962) 2005• 48 Milwaukee Brewers Never (franchise began 1969) 1982• 48 San Diego Padres Never (franchise began 1969) 1998• 40 Seattle Mariners Never (franchise began 1977) never• 37 Pittsburgh Pirates 1979 1979• 33 Baltimore Orioles 1983 1983• 32 Detroit Tigers 1984 2012• 30 New York Mets 1986 2015
9/20/2017 © Care Bridge International 2017 7
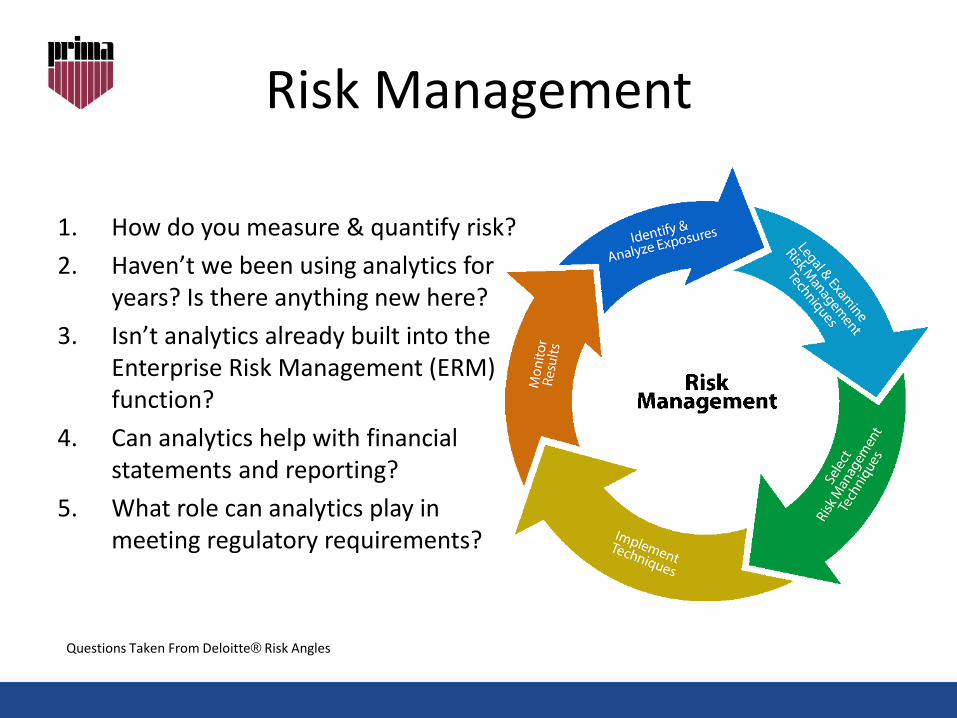
Risk Management
1. How do you measure & quantify risk?
2. Haven’t we been using analytics for years? Is there anything new here?
3. Isn’t analytics already built into the Enterprise Risk Management (ERM) function?
4. Can analytics help with financial statements and reporting?
5. What role can analytics play in meeting regulatory requirements?
Questions Taken From Deloitte® Risk Angles
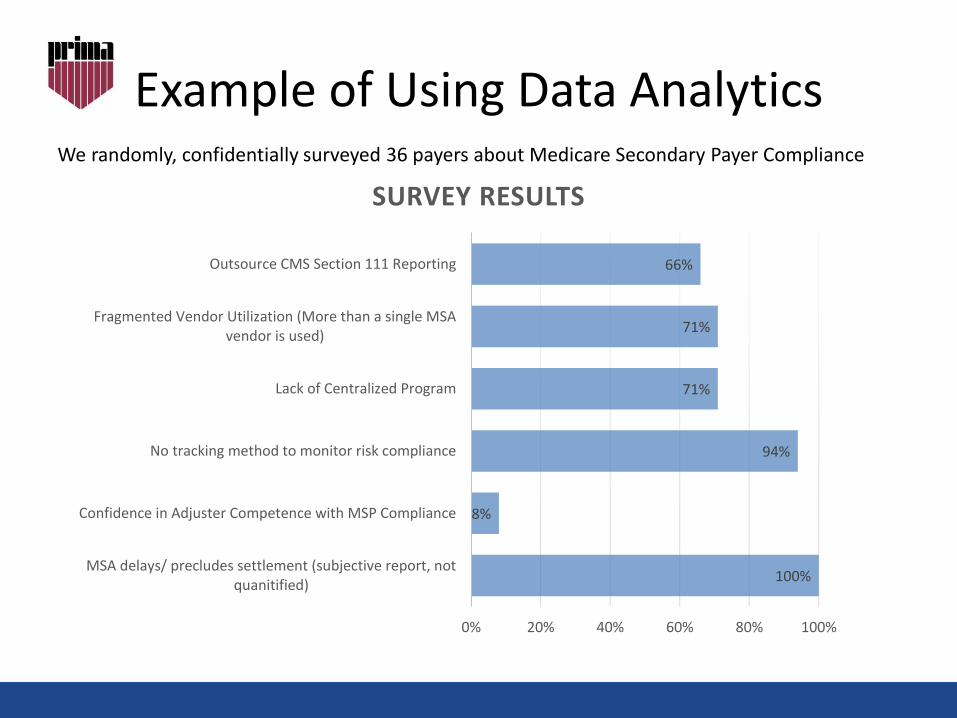
Example of Using Data Analytics
100%
8%
94%
71%
71%
66%
0% 20% 40% 60% 80% 100%
MSA delays/ precludes settlement (subjective report, notquanitified)
Confidence in Adjuster Competence with MSP Compliance
No tracking method to monitor risk compliance
Lack of Centralized Program
Fragmented Vendor Utilization (More than a single MSAvendor is used)
Outsource CMS Section 111 Reporting
SURVEY RESULTS
We randomly, confidentially surveyed 36 payers about Medicare Secondary Payer Compliance
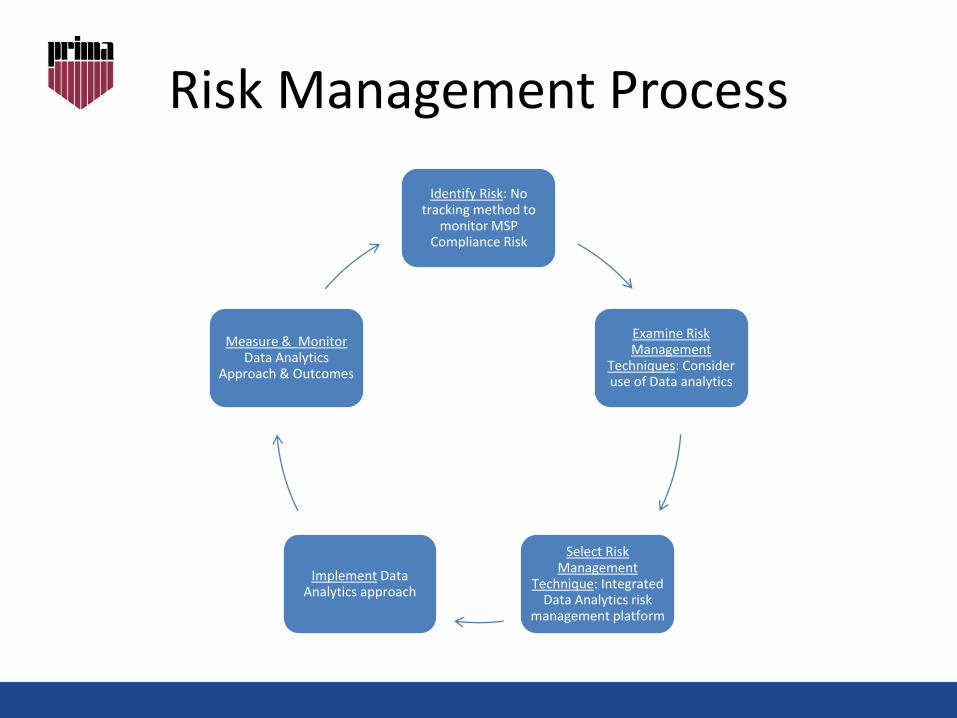
Risk Management Process
Identify Risk: No tracking method to
monitor MSP Compliance Risk
Examine Risk Management
Techniques: Consider use of Data analytics
Select Risk Management
Technique: Integrated Data Analytics risk
management platform
Implement Data Analytics approach
Measure & Monitor Data Analytics
Approach & Outcomes
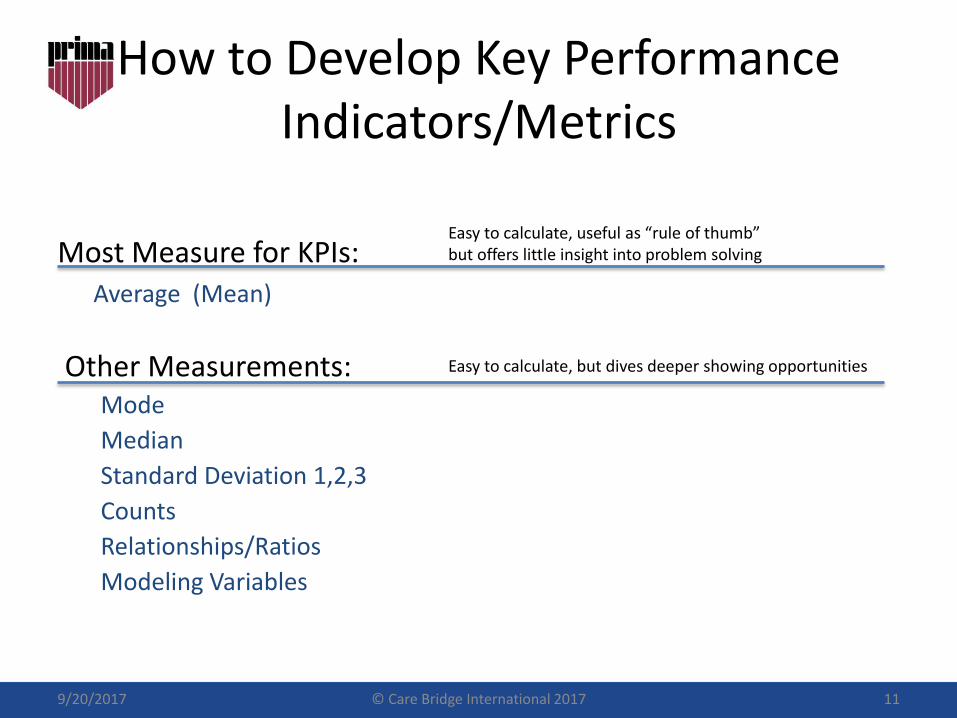
How to Develop Key Performance Indicators/Metrics
Most Measure for KPIs: Average (Mean)
9/20/2017 © Care Bridge International 2017 11
Easy to calculate, useful as “rule of thumb”but offers little insight into problem solving
Other Measurements: Mode
Median
Standard Deviation 1,2,3
Counts
Relationships/Ratios
Modeling Variables
Easy to calculate, but dives deeper showing opportunities
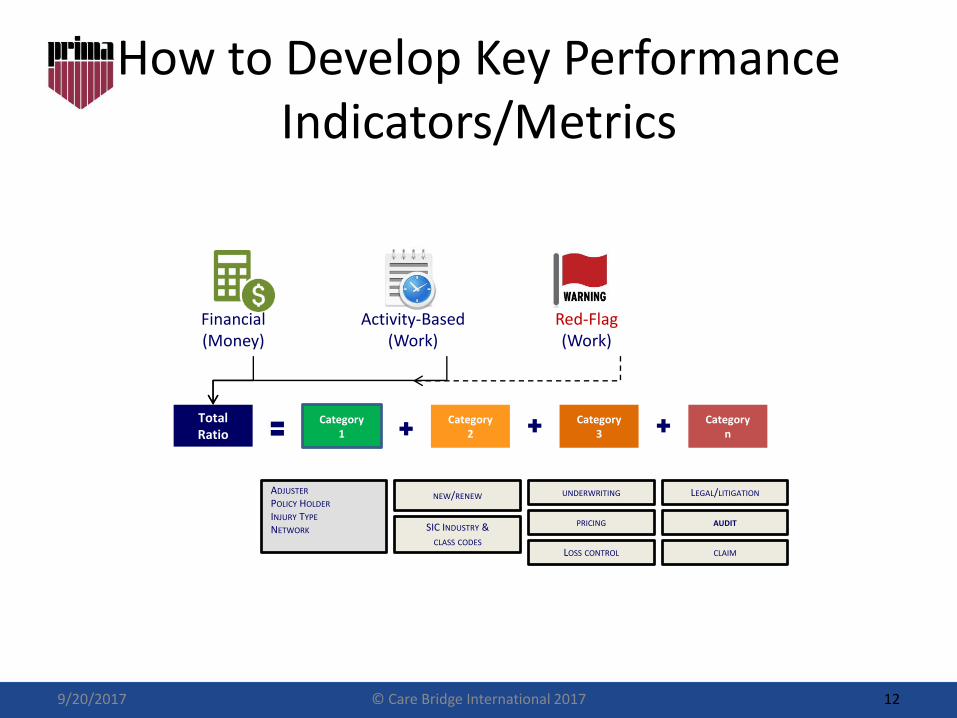
How to Develop Key Performance Indicators/Metrics
9/20/2017 © Care Bridge International 2017 12
Financial(Money)
Activity-Based(Work)
TotalRatio
Category1
Category2
Categoryn
Category3
ADJUSTER
POLICY HOLDER
INJURY TYPE
NETWORK SIC INDUSTRY &
CLASS CODES
NEW/RENEW
CLAIM
LEGAL/LITIGATION
LOSS CONTROL
UNDERWRITING
PRICING AUDIT
Red-Flag(Work)
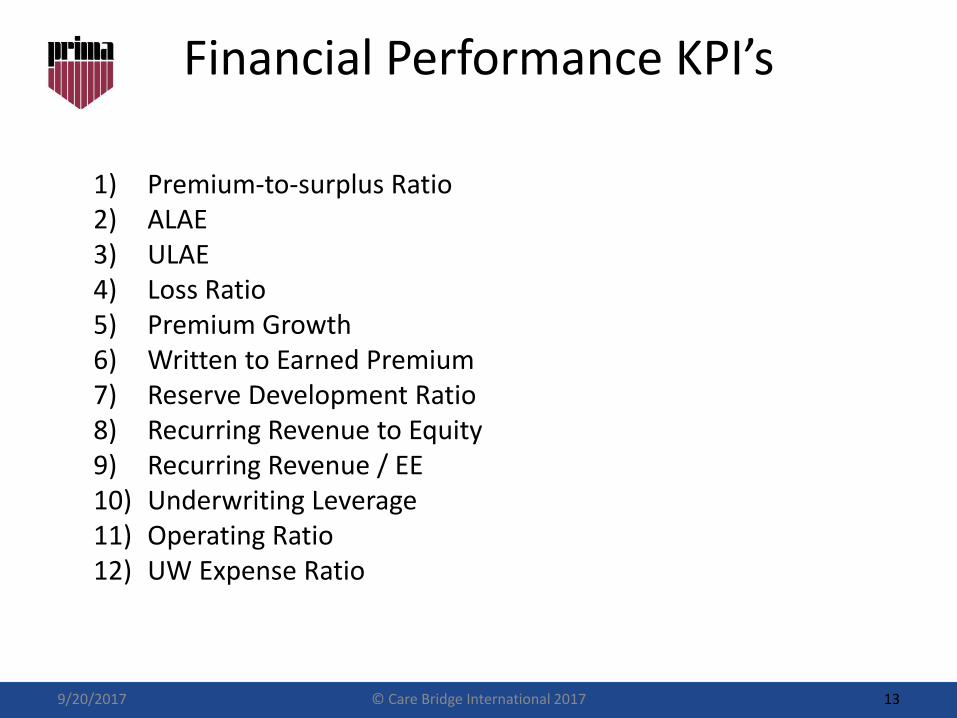
Financial Performance KPI’s
1) Premium-to-surplus Ratio2) ALAE3) ULAE4) Loss Ratio5) Premium Growth6) Written to Earned Premium7) Reserve Development Ratio8) Recurring Revenue to Equity9) Recurring Revenue / EE10) Underwriting Leverage11) Operating Ratio12) UW Expense Ratio
9/20/2017 © Care Bridge International 2017 13
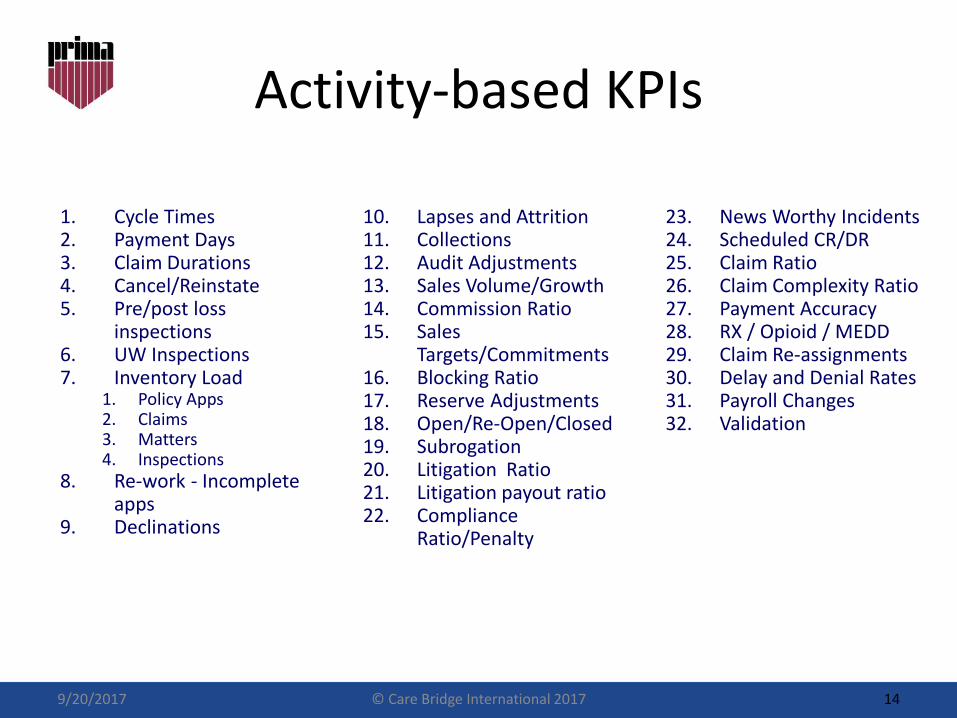
Activity-based KPIs
1. Cycle Times2. Payment Days3. Claim Durations4. Cancel/Reinstate5. Pre/post loss
inspections6. UW Inspections7. Inventory Load
1. Policy Apps2. Claims3. Matters4. Inspections
8. Re-work - Incomplete apps
9. Declinations
10. Lapses and Attrition11. Collections12. Audit Adjustments13. Sales Volume/Growth14. Commission Ratio15. Sales
Targets/Commitments16. Blocking Ratio17. Reserve Adjustments18. Open/Re-Open/Closed19. Subrogation20. Litigation Ratio21. Litigation payout ratio22. Compliance
Ratio/Penalty
23. News Worthy Incidents24. Scheduled CR/DR 25. Claim Ratio26. Claim Complexity Ratio27. Payment Accuracy28. RX / Opioid / MEDD29. Claim Re-assignments30. Delay and Denial Rates31. Payroll Changes32. Validation
9/20/2017 © Care Bridge International 2017 14
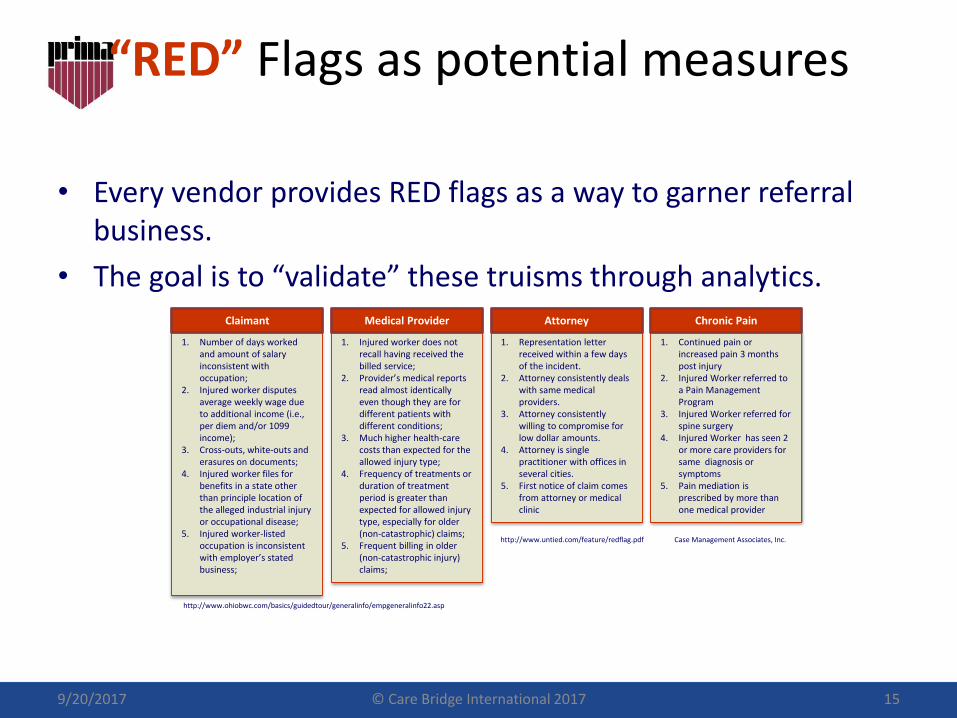
“RED” Flags as potential measures
• Every vendor provides RED flags as a way to garner referral business.
• The goal is to “validate” these truisms through analytics.
9/20/2017 © Care Bridge International 2017 15
http://www.ohiobwc.com/basics/guidedtour/generalinfo/empgeneralinfo22.asp
http://www.untied.com/feature/redflag.pdf
1. Number of days worked and amount of salary inconsistent with occupation;
2. Injured worker disputes average weekly wage due to additional income (i.e., per diem and/or 1099 income);
3. Cross-outs, white-outs and erasures on documents;
4. Injured worker files for benefits in a state other than principle location of the alleged industrial injury or occupational disease;
5. Injured worker-listed occupation is inconsistent with employer’s stated business;
Claimant
1. Injured worker does not recall having received the billed service;
2. Provider’s medical reports read almost identically even though they are for different patients with different conditions;
3. Much higher health-care costs than expected for the allowed injury type;
4. Frequency of treatments or duration of treatment period is greater than expected for allowed injury type, especially for older (non-catastrophic) claims;
5. Frequent billing in older (non-catastrophic injury) claims;
Medical Provider
1. Representation letter received within a few days of the incident.
2. Attorney consistently deals with same medical providers.
3. Attorney consistently willing to compromise for low dollar amounts.
4. Attorney is single practitioner with offices in several cities.
5. First notice of claim comes from attorney or medical clinic
Attorney
1. Continued pain or increased pain 3 months post injury
2. Injured Worker referred to a Pain Management Program
3. Injured Worker referred for spine surgery
4. Injured Worker has seen 2 or more care providers for same diagnosis or symptoms
5. Pain mediation is prescribed by more than one medical provider
Chronic Pain
Case Management Associates, Inc.
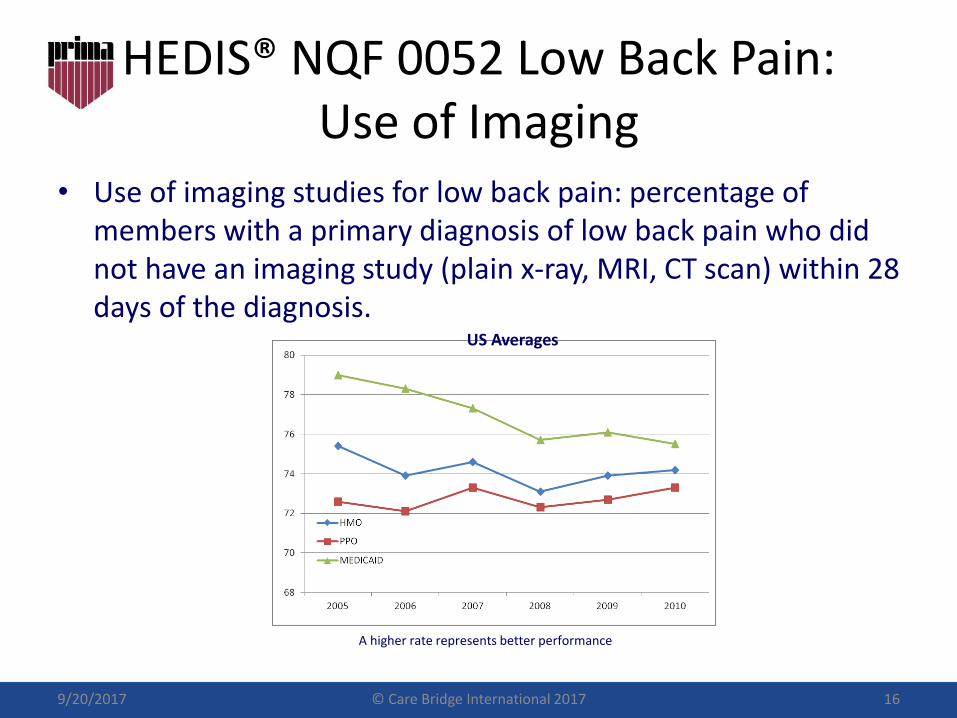
HEDIS® NQF 0052 Low Back Pain: Use of Imaging
• Use of imaging studies for low back pain: percentage of members with a primary diagnosis of low back pain who did not have an imaging study (plain x-ray, MRI, CT scan) within 28 days of the diagnosis.
9/20/2017 © Care Bridge International 2017 16
A higher rate represents better performance
US Averages
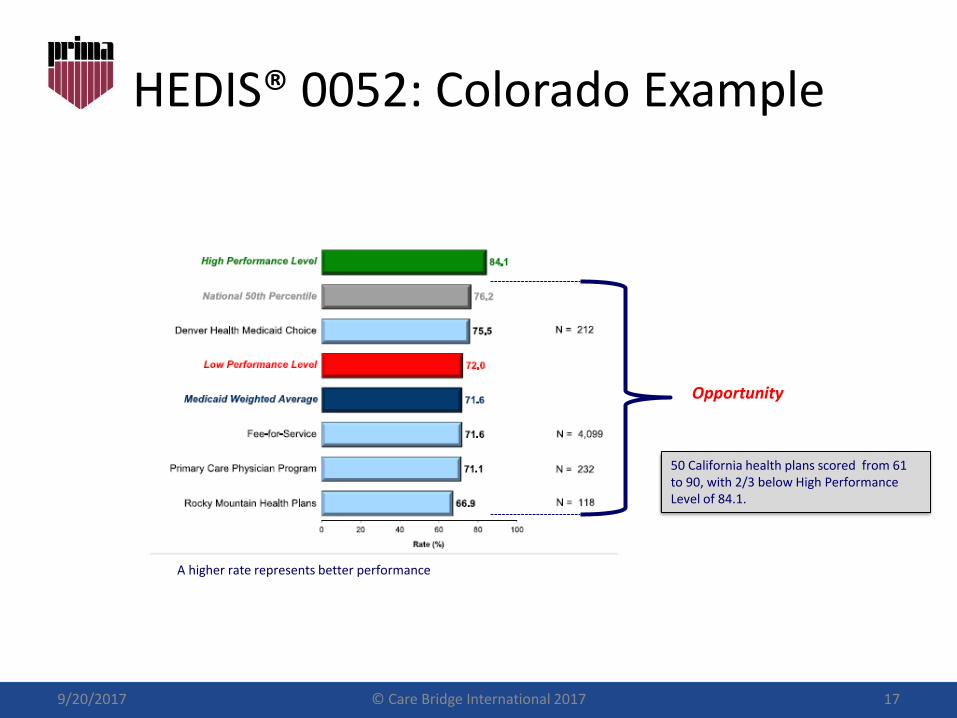
HEDIS® 0052: Colorado Example
9/20/2017 © Care Bridge International 2017 17
Opportunity
A higher rate represents better performance
50 California health plans scored from 61 to 90, with 2/3 below High Performance Level of 84.1.
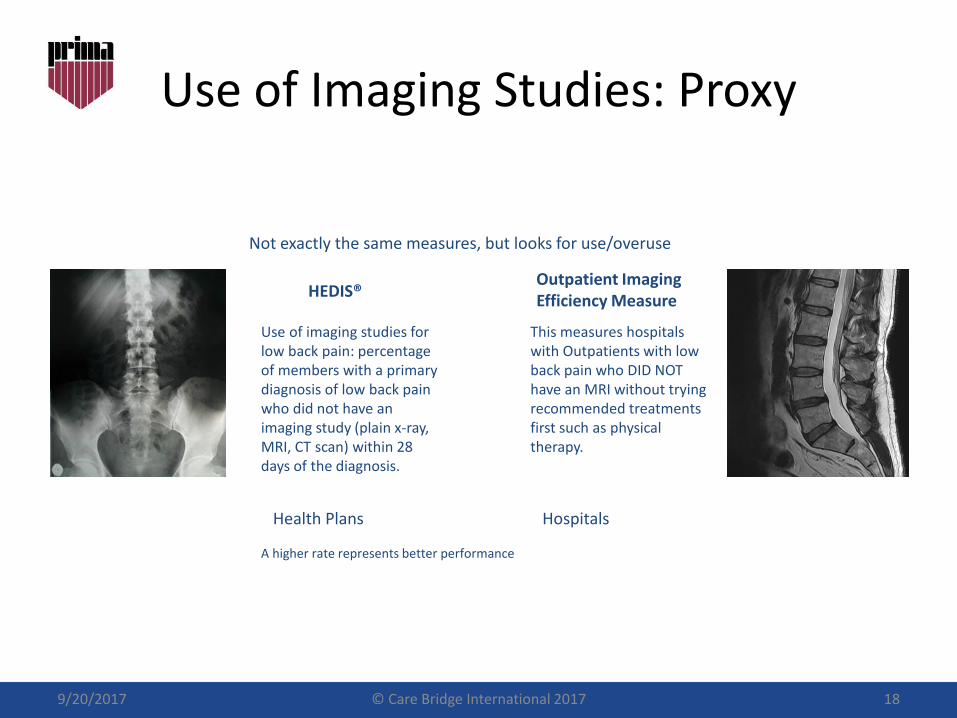
Use of Imaging Studies: Proxy
9/20/2017 © Care Bridge International 2017 18
This measures hospitals with Outpatients with low back pain who DID NOT have an MRI without trying recommended treatments first such as physical therapy.
Use of imaging studies for low back pain: percentage of members with a primary diagnosis of low back pain who did not have an imaging study (plain x-ray, MRI, CT scan) within 28 days of the diagnosis.
HEDIS®Outpatient Imaging Efficiency Measure
Health Plans Hospitals
A higher rate represents better performance
Not exactly the same measures, but looks for use/overuse
0.0
10.0
20.0
30.0
40.0
50.0
60.0
70.0
80.0
90.0
100.0
0 500 1000 1500 2000
Ou
tpat
ien
ts w
ith
low
bac
k p
ain
wh
o D
ID N
OT
hav
e
an M
RI
Number of Hospitals
US HOSPITALSMEDICARE DATA
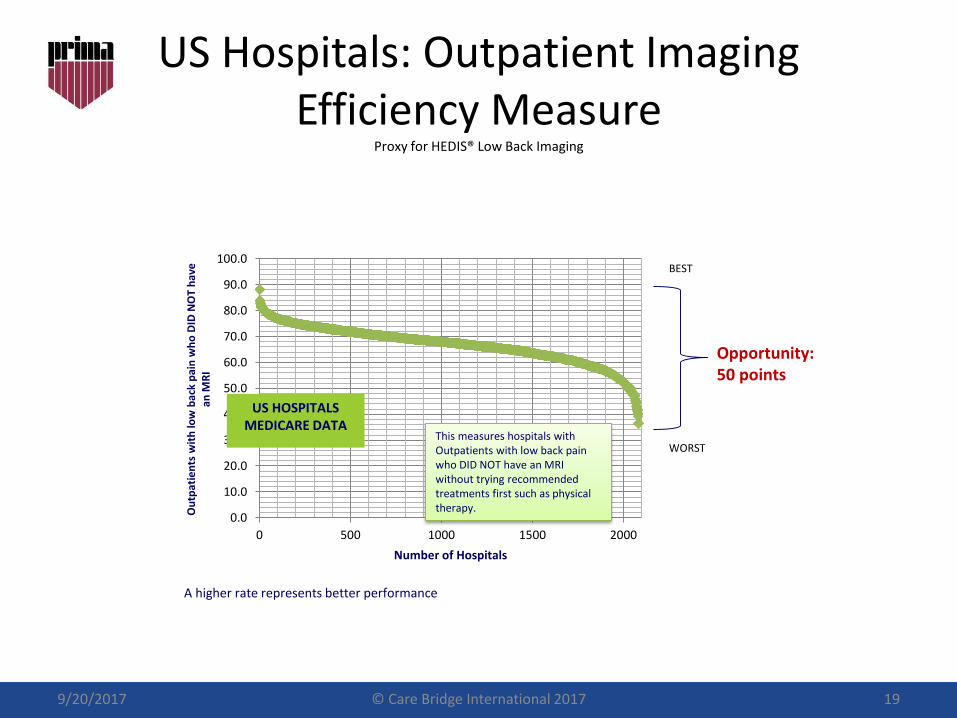
US Hospitals: Outpatient Imaging Efficiency Measure
Proxy for HEDIS® Low Back Imaging
9/20/2017 © Care Bridge International 2017 19
A higher rate represents better performance
Opportunity:50 points
This measures hospitals with Outpatients with low back pain who DID NOT have an MRI without trying recommended treatments first such as physical therapy.
BEST
WORST
Making Data Actionable
• Defining Data Elements –
• Structured Data (numbers, formatted text)
• Unstructured Data ( text or free-form)
– Name variations: USA, U.S.A., America, United States, United States of America, US, U.S., not to mention typos.
• Care Bridge Approach to Data
9/20/2017 © Care Bridge International 2017 20
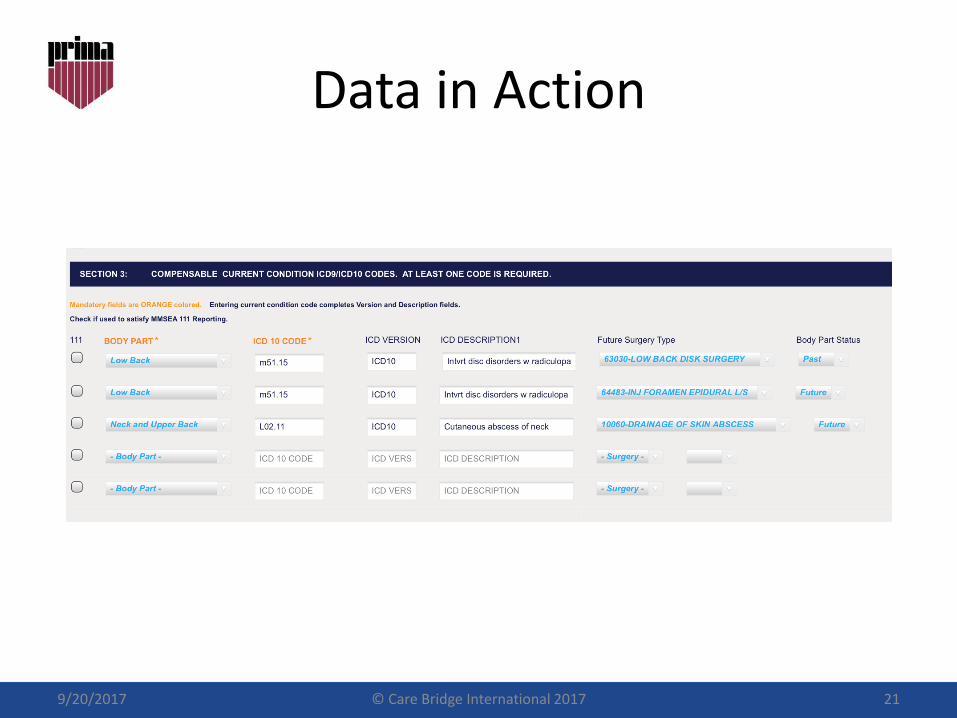
Data in Action
9/20/2017 © Care Bridge International 2017 21
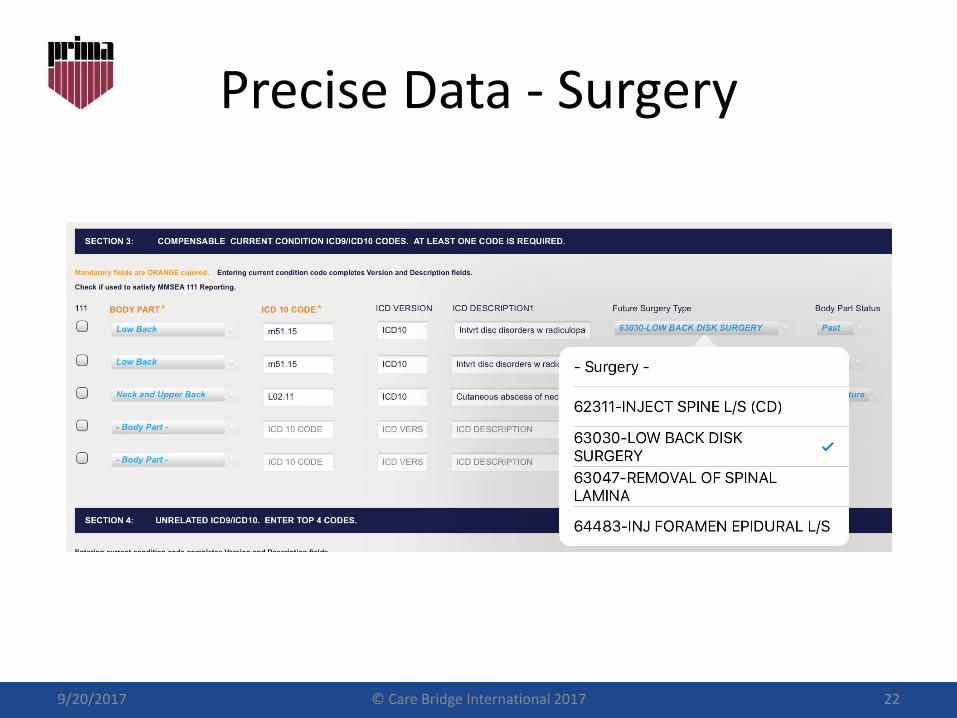
Precise Data - Surgery
9/20/2017 © Care Bridge International 2017 22
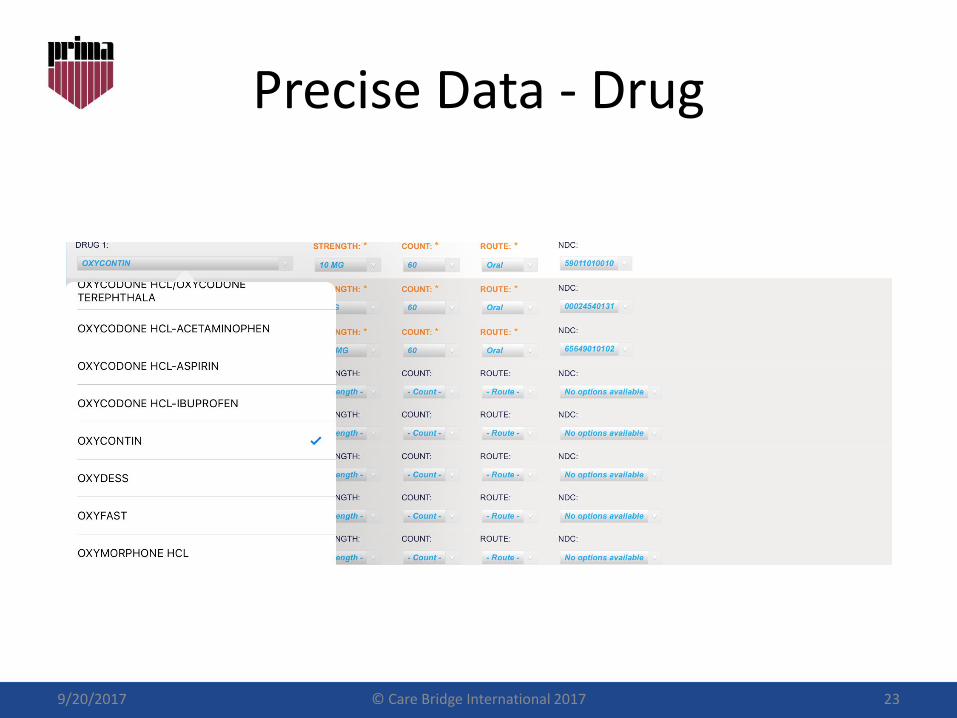
Precise Data - Drug
9/20/2017 © Care Bridge International 2017 23
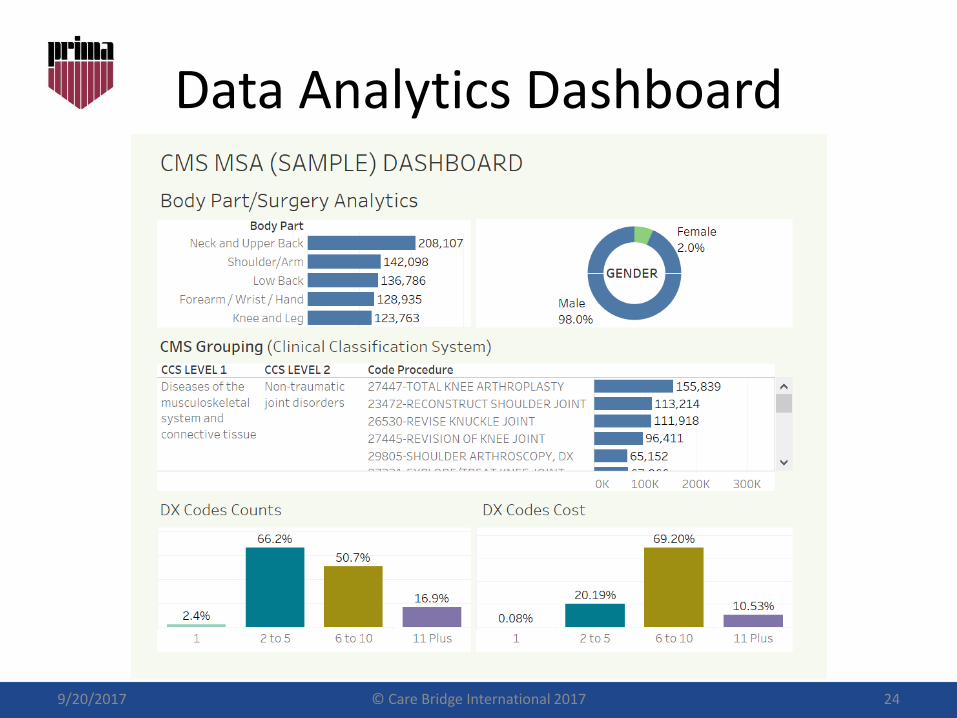
Data Analytics Dashboard
9/20/2017 © Care Bridge International 2017 24
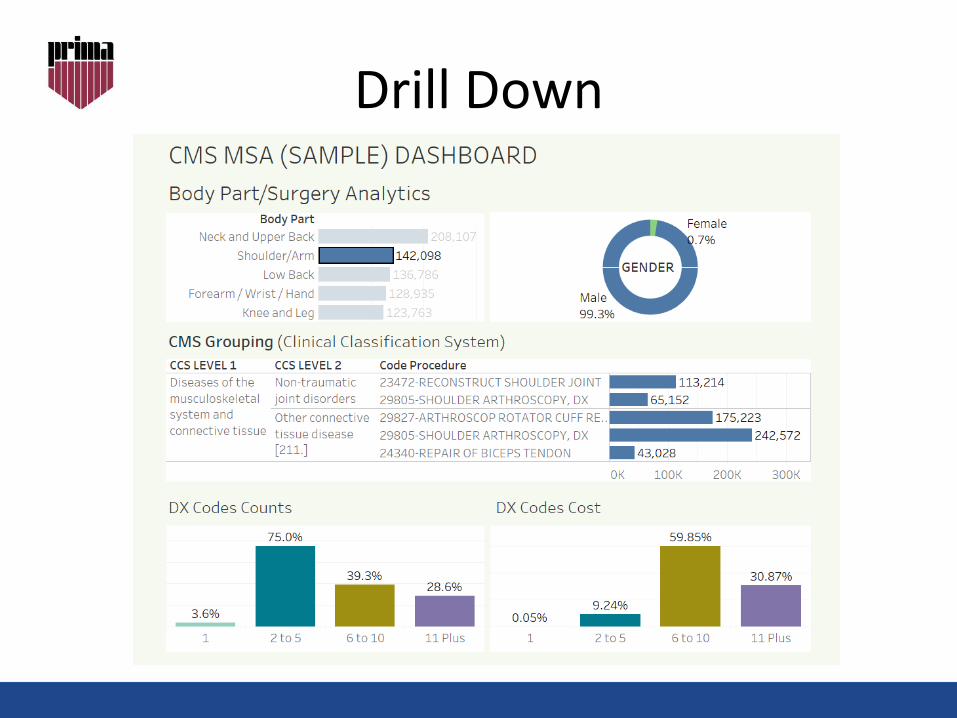
Drill Down
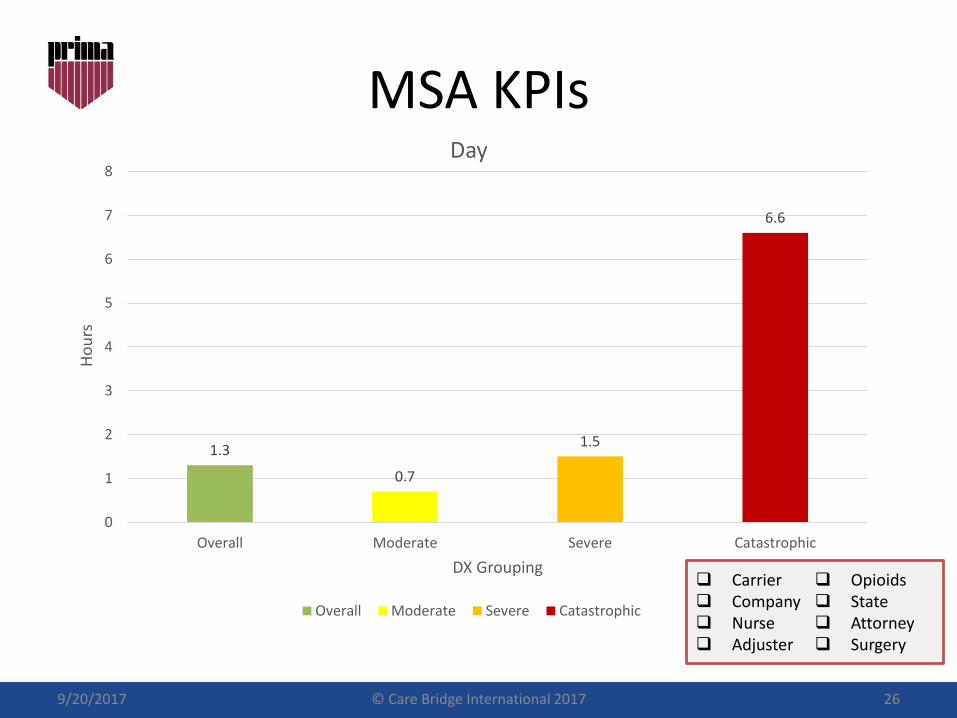
MSA KPIs
9/20/2017 © Care Bridge International 2017 26
Carrier Company Nurse Adjuster
Opioids State Attorney Surgery
1.3
0.7
1.5
6.6
0
1
2
3
4
5
6
7
8
Overall Moderate Severe Catastrophic
Ho
urs
DX Grouping
Day
Overall Moderate Severe Catastrophic
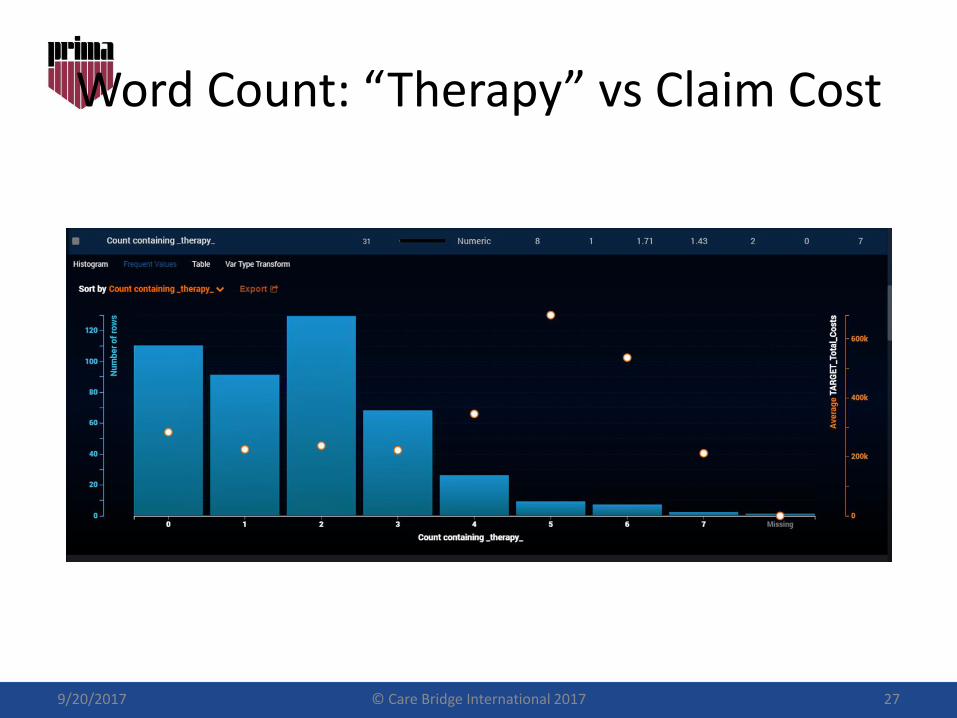
Word Count: “Therapy” vs Claim Cost
9/20/2017 © Care Bridge International 2017 27
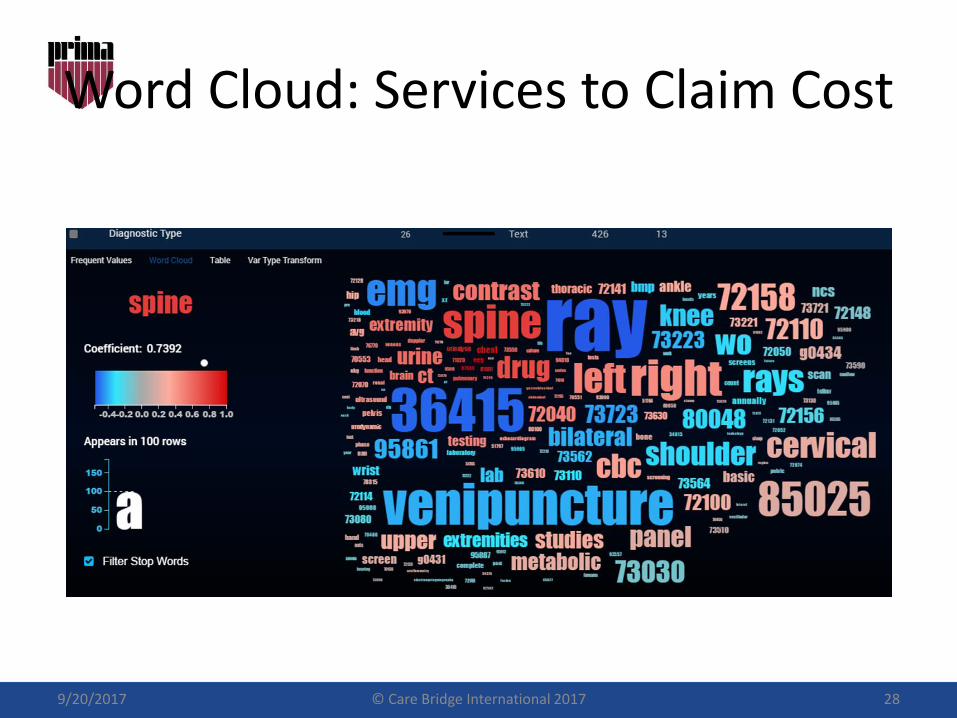
Word Cloud: Services to Claim Cost
9/20/2017 © Care Bridge International 2017 28
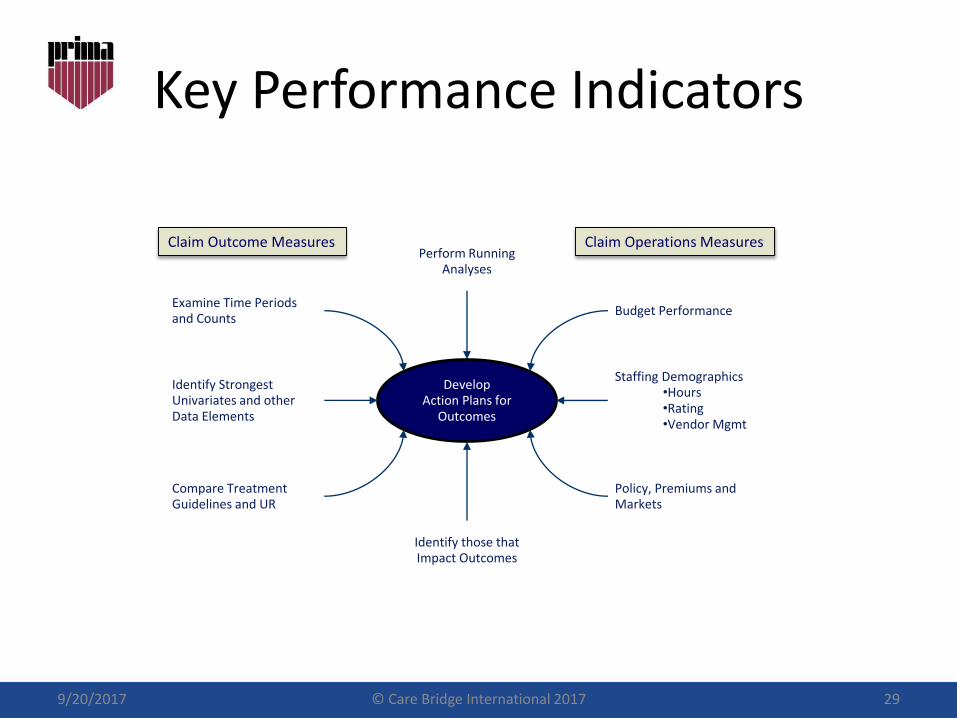
Develop Action Plans for
Outcomes
Identify those that Impact Outcomes
Budget Performance
Staffing Demographics•Hours•Rating•Vendor Mgmt
Compare Treatment Guidelines and UR
Policy, Premiums and Markets
Perform Running Analyses
Identify Strongest Univariates and other Data Elements
Examine Time Periods and Counts
Claim Outcome Measures Claim Operations Measures
Key Performance Indicators
9/20/2017 © Care Bridge International 2017 29
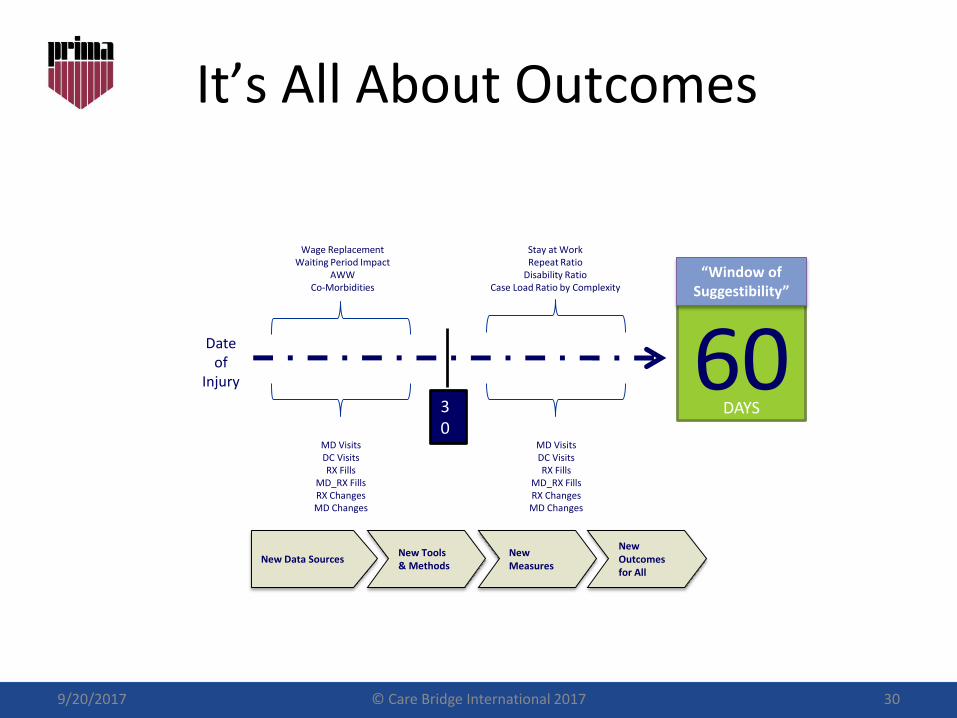
It’s All About Outcomes
9/20/2017 © Care Bridge International 2017 30
Date of
Injury
30
MD VisitsDC VisitsRX Fills
MD_RX FillsRX ChangesMD Changes
MD VisitsDC VisitsRX Fills
MD_RX FillsRX ChangesMD Changes
Wage ReplacementWaiting Period Impact
AWWCo-Morbidities
Stay at WorkRepeat Ratio
Disability RatioCase Load Ratio by Complexity
New Data SourcesNew Outcomes for All
New Measures
New Tools & Methods
60“Window of
Suggestibility”
DAYS
References
9/20/2017 © Care Bridge International 2017 31
Thank You!
Deborah Watkins, CEOP: + 1(888) 434-9326 Ext. [email protected]
Jim Paugh, SVPP: + 1(888) 434-9326 Ext. 102
9/20/2017 © Care Bridge International 2017 32
Care Bridge International, Inc9040 Town Center ParkwayLakewood Ranch, FL 34202
www.carebridgeinc.com