Embed Size (px)
Citation preview

How the U.S. Economy Benefits from International Trade & Investment
Contact: David Thomas, Business Roundtable, 202-496-3262, [email protected] www.brt.org/trade
Overview
With more than 95 percent of the world’s population and 80 percent of the world’s purchasing power outside
the United States, future economic growth and jobs for America increasingly depend on expanding U.S. trade
and investment opportunities in the global marketplace.
The following pages feature key facts and figures drawn from new Business Roundtable research, U.S.
government data, and other data sources that demonstrate the benefits of international trade and investment
to economic growth and jobs in United States.
Why is International Trade & Investment Important to the United States?
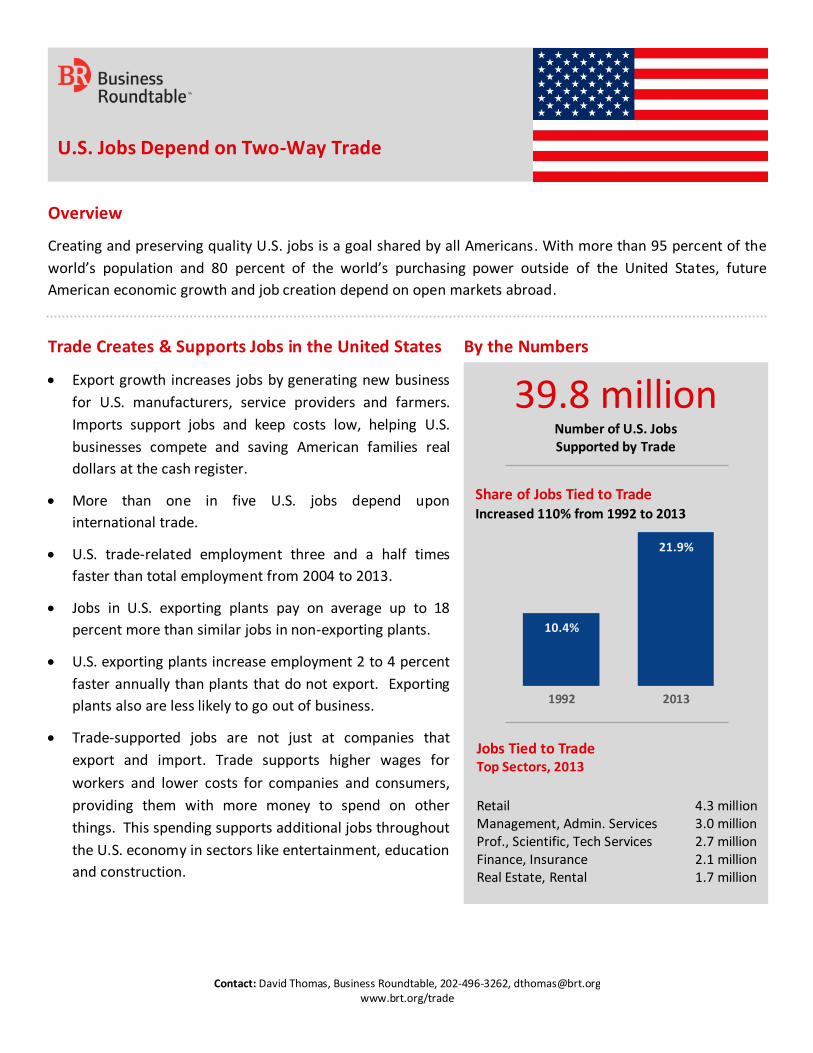
International trade, including exports and imports, supports 39.8 million U.S. jobs – more than 1 in 5.
These trade-related jobs grew three and a half times faster than total employment from 2004 to 2013 and
are at large and small companies, on farms, in factories, and at the headquarters of globally engaged U.S.
firms. (See U.S. Jobs Depend On Two-Way Trade)
The United States exported $1.6 trillion in goods and $687.4 billion in services in 2013, including
petroleum and coal products, aerospace products, motor vehicles and parts, computer software, and
travel services. Of the 304,867 U.S. exporters, 98 percent are small- and medium-sized companies with less
than 500 workers. (See U.S. Businesses Grow With Exports)
Customers in 234 countries buy U.S.-made goods and services, including hundreds of billions of dollars in
annual exports to top markets like Canada, Mexico and China. U.S. goods exports have grown more than
two times faster than GDP since 2003. (See U.S. Companies Export Throughout The World)
Imports lower prices and increase choices for U.S. companies and families. Lower raw material and input
costs help American companies stay competitive in global markets, while families can stretch paychecks
further as trade agreements reduce the cost of products by eliminating costly barriers to trade. (See U.S.
Companies And Workers Use Imports To Compete)
Free trade agreements (FTAs) have helped fuel rapid U.S. export growth to partner countries. In 2013,
$733 billion of U.S. goods exports, or 46 percent, went to FTA partners. This represents a 107 percent
increase since 2003. (See The United States Needs Trade Agreements To Grow)
Foreign-owned companies invest and build facilities and employ 5.8 million workers in the United
States. (See Foreign Investment In United States Creates Jobs)
Contact: David Thomas, Business Roundtable, 202-496-3262, [email protected] www.brt.org/trade
U.S. Jobs Depend on Two-Way Trade
Overview
Creating and preserving quality U.S. jobs is a goal shared by all Americans. With more than 95 percent of the
world’s population and 80 percent of the world’s purchasing power outside of the United States, future
American economic growth and job creation depend on open markets abroad.
Trade Creates & Supports Jobs in the United States
Export growth increases jobs by generating new business
for U.S. manufacturers, service providers and farmers.
Imports support jobs and keep costs low, helping U.S.
businesses compete and saving American families real
dollars at the cash register.
More than one in five U.S. jobs depend upon
international trade.
U.S. trade-related employment three and a half times
faster than total employment from 2004 to 2013.
Jobs in U.S. exporting plants pay on average up to 18
percent more than similar jobs in non-exporting plants.
U.S. exporting plants increase employment 2 to 4 percent
faster annually than plants that do not export. Exporting
plants also are less likely to go out of business.
Trade-supported jobs are not just at companies that
export and import. Trade supports higher wages for
workers and lower costs for companies and consumers,
providing them with more money to spend on other
things. This spending supports additional jobs throughout
the U.S. economy in sectors like entertainment, education
and construction.
By the Numbers
39.8 million
Number of U.S. Jobs Supported by Trade
10.4%
21.9%
1992 2013
Share of Jobs Tied to Trade
Increased 110% from 1992 to 2013
Jobs Tied to Trade Top Sectors, 2013
Retail 4.3 million Management, Admin. Services 3.0 million Prof., Scientific, Tech Services 2.7 million Finance, Insurance 2.1 million Real Estate, Rental 1.7 million
Contact: David Thomas, Business Roundtable, 202-496-3262, [email protected] www.brt.org/trade
U.S Businesses Grow with Exports
Overview
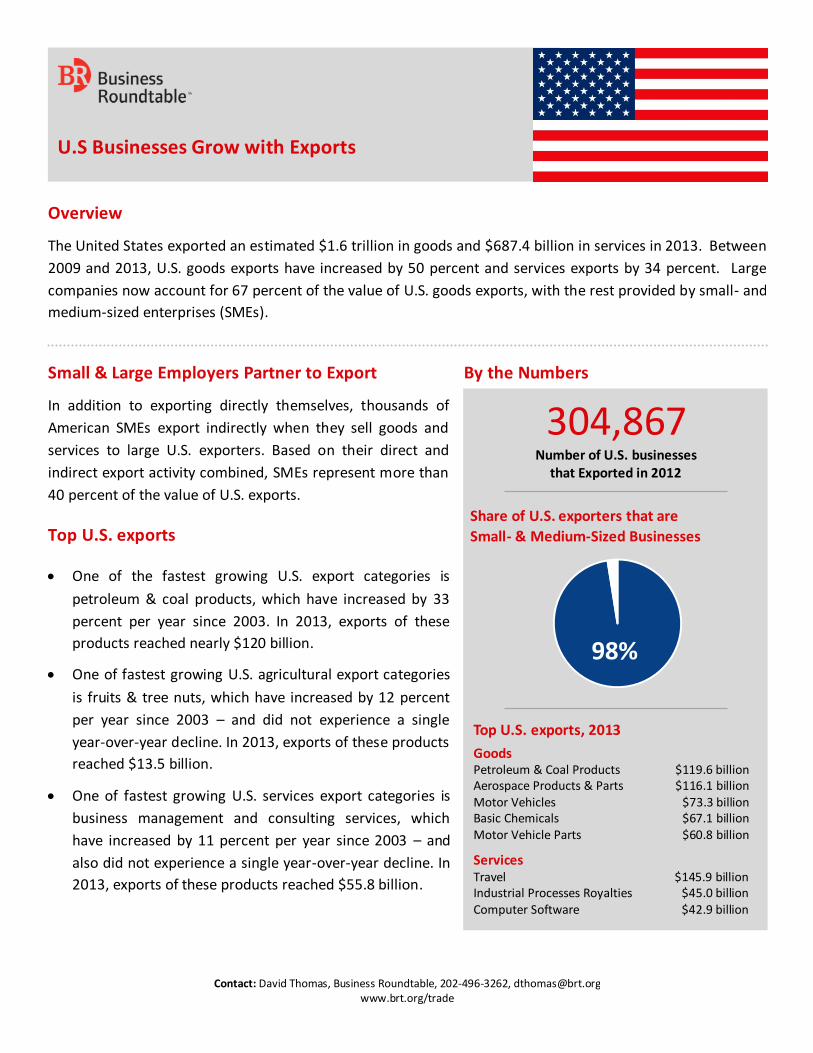
The United States exported an estimated $1.6 trillion in goods and $687.4 billion in services in 2013. Between
2009 and 2013, U.S. goods exports have increased by 50 percent and services exports by 34 percent. Large
companies now account for 67 percent of the value of U.S. goods exports, with the rest provided by small- and
medium-sized enterprises (SMEs).
Small & Large Employers Partner to Export
In addition to exporting directly themselves, thousands of
American SMEs export indirectly when they sell goods and
services to large U.S. exporters. Based on their direct and
indirect export activity combined, SMEs represent more than
40 percent of the value of U.S. exports.
Top U.S. exports
One of the fastest growing U.S. export categories is
petroleum & coal products, which have increased by 33
percent per year since 2003. In 2013, exports of these
products reached nearly $120 billion.
One of fastest growing U.S. agricultural export categories
is fruits & tree nuts, which have increased by 12 percent
per year since 2003 – and did not experience a single
year-over-year decline. In 2013, exports of these products
reached $13.5 billion.
One of fastest growing U.S. services export categories is
business management and consulting services, which
have increased by 11 percent per year since 2003 – and
also did not experience a single year-over-year decline. In
2013, exports of these products reached $55.8 billion.
By the Numbers
304,867
Number of U.S. businesses that Exported in 2012
98%
Share of U.S. exporters that are
Small- & Medium-Sized Businesses
Top U.S. exports, 2013
Goods Petroleum & Coal Products $119.6 billion Aerospace Products & Parts $116.1 billion Motor Vehicles $73.3 billion Basic Chemicals $67.1 billion Motor Vehicle Parts $60.8 billion
Services Travel $145.9 billion Industrial Processes Royalties $45.0 billion Computer Software $42.9 billion
Contact: David Thomas, Business Roundtable, 202-‐496-‐3262, [email protected] www.brt.org/trade
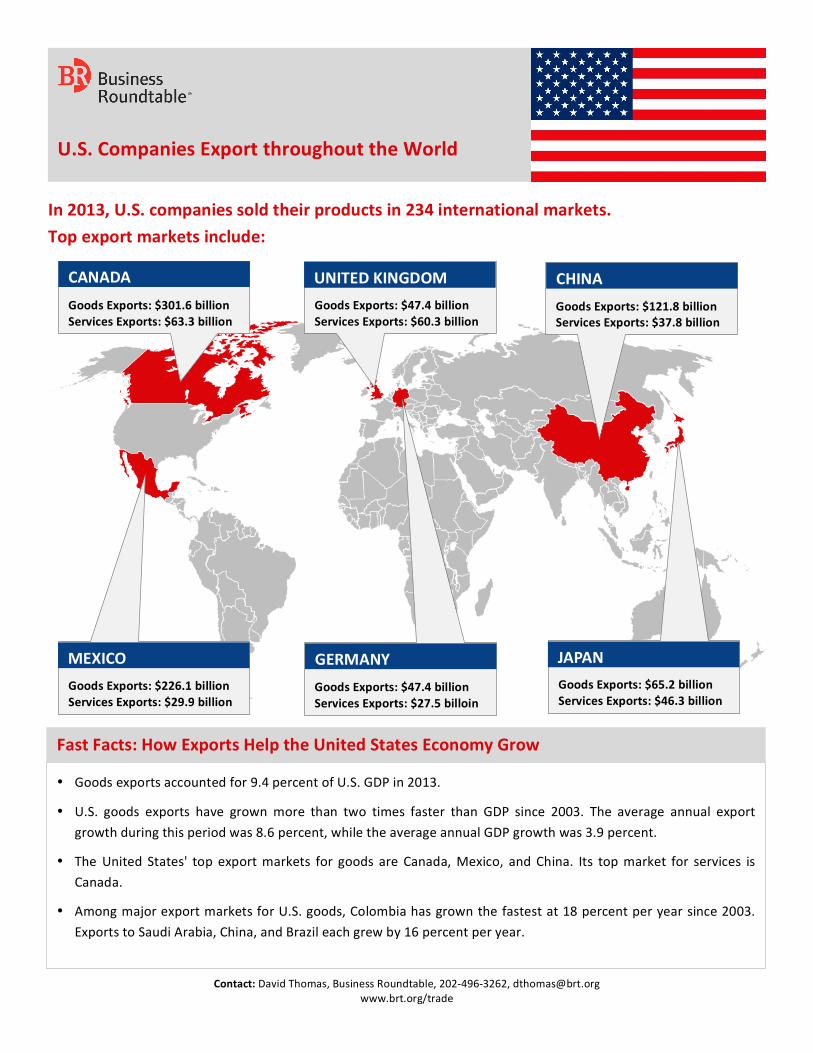
U.S. Companies Export throughout the World
In 2013, U.S. companies sold their products in 234 international markets. Top export markets include:
• Goods exports accounted for 9.4 percent of U.S. GDP in 2013.
• U.S. goods exports have grown more than two times faster than GDP since 2003. The average annual export growth during this period was 8.6 percent, while the average annual GDP growth was 3.9 percent.
• The United States' top export markets for goods are Canada, Mexico, and China. Its top market for services is Canada.
• Among major export markets for U.S. goods, Colombia has grown the fastest at 18 percent per year since 2003. Exports to Saudi Arabia, China, and Brazil each grew by 16 percent per year.
Fast Facts: How Exports Help the United States Economy Grow
Goods Exports: $301.6 billion Services Exports: $63.3 billion
Goods Exports: $47.4 billion Services Exports: $60.3 billion
CANADA UNITED KINGDOM
Goods Exports: $226.1 billion Services Exports: $29.9 billion
Goods Exports: $47.4 billion Services Exports: $27.5 billoin
Goods Exports: $65.2 billion Services Exports: $46.3 billion
Goods Exports: $121.8 billion Services Exports: $37.8 billion
MEXICO GERMANY JAPAN
CHINA
Contact: David Thomas, Business Roundtable, 202-‐496-‐3262, [email protected] www.brt.org/trade
U.S. Companies & Workers Use Imports to Make Products and Compete in International Markets
Overview
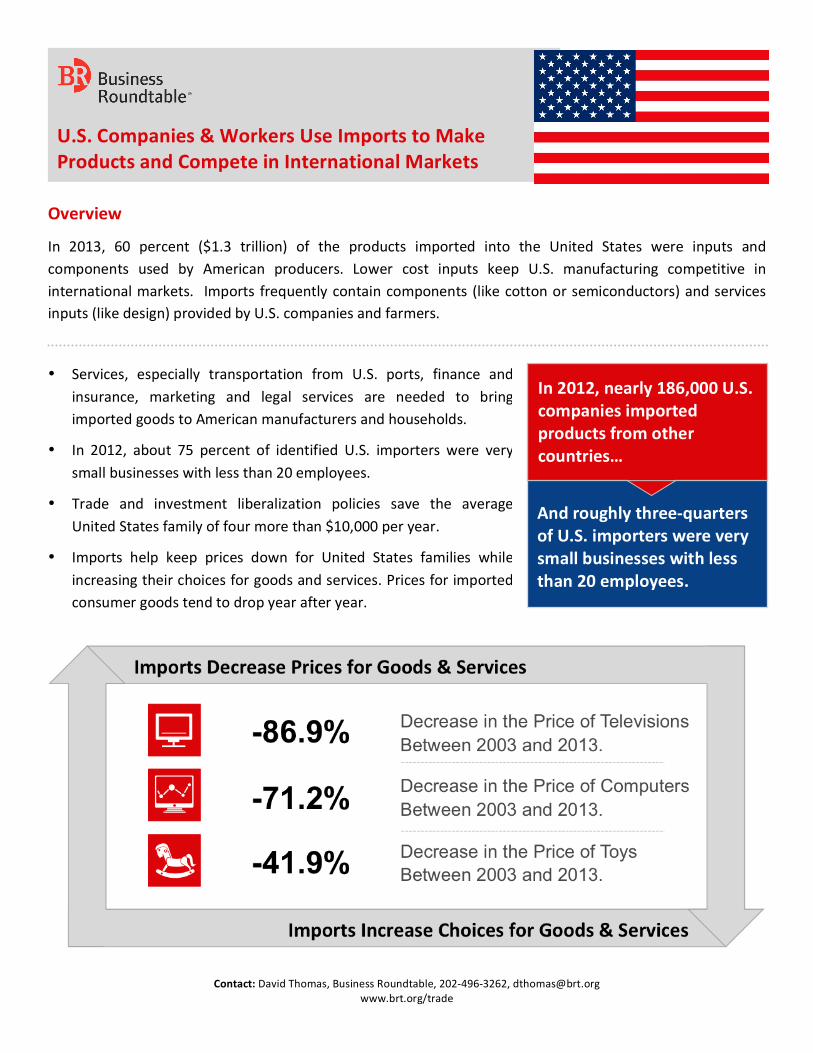
In 2013, 60 percent ($1.3 trillion) of the products imported into the United States were inputs and components used by American producers. Lower cost inputs keep U.S. manufacturing competitive in international markets. Imports frequently contain components (like cotton or semiconductors) and services inputs (like design) provided by U.S. companies and farmers.
• Services, especially transportation from U.S. ports, finance and insurance, marketing and legal services are needed to bring imported goods to American manufacturers and households.
• In 2012, about 75 percent of identified U.S. importers were very small businesses with less than 20 employees.
• Trade and investment liberalization policies save the average United States family of four more than $10,000 per year.
• Imports help keep prices down for United States families while increasing their choices for goods and services. Prices for imported consumer goods tend to drop year after year.
And roughly three-‐quarters of U.S. importers were very small businesses with less than 20 employees.
In 2012, nearly 186,000 U.S. companies imported products from other countries…
Contact: David Thomas, Business Roundtable, 202-496-3262, [email protected] www.brt.org/trade
The United States Needs Trade Agreements to Grow
Overview
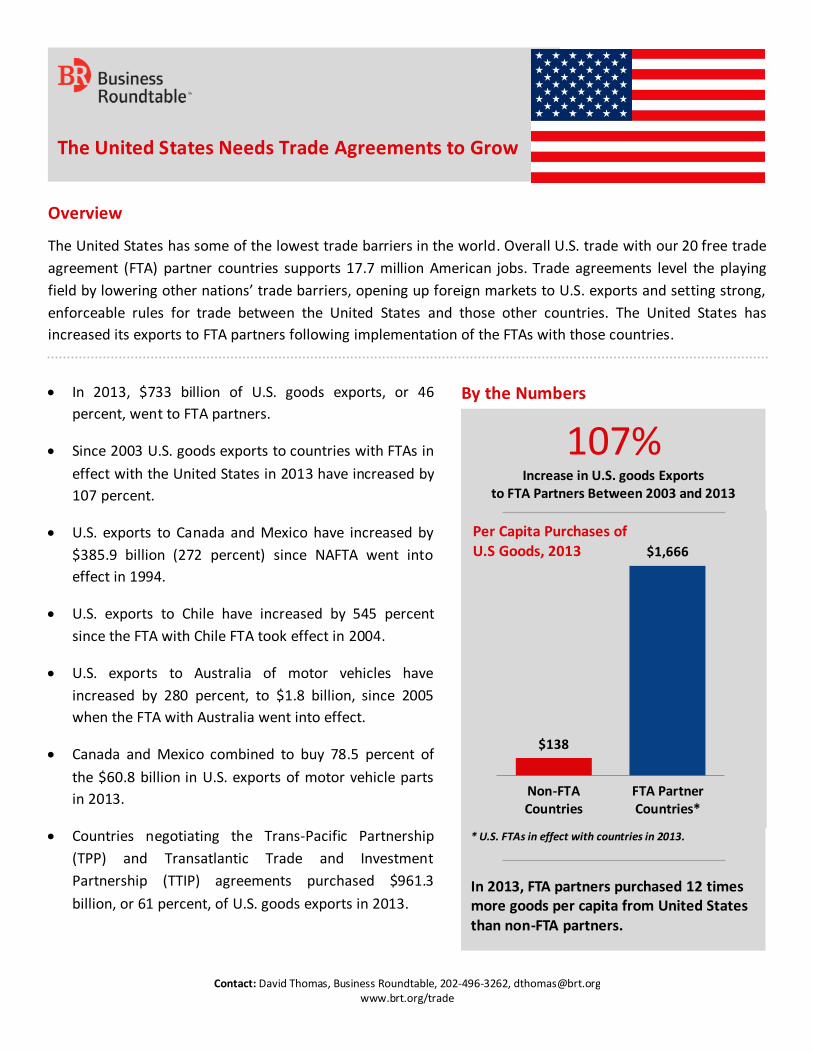
The United States has some of the lowest trade barriers in the world. Overall U.S. trade with our 20 free trade
agreement (FTA) partner countries supports 17.7 million American jobs. Trade agreements level the playing
field by lowering other nations’ trade barriers, opening up foreign markets to U.S. exports and setting strong,
enforceable rules for trade between the United States and those other countries. The United States has
increased its exports to FTA partners following implementation of the FTAs with those countries.
In 2013, $733 billion of U.S. goods exports, or 46
percent, went to FTA partners.
Since 2003 U.S. goods exports to countries with FTAs in
effect with the United States in 2013 have increased by
107 percent.
U.S. exports to Canada and Mexico have increased by
$385.9 billion (272 percent) since NAFTA went into
effect in 1994.
U.S. exports to Chile have increased by 545 percent
since the FTA with Chile FTA took effect in 2004.
U.S. exports to Australia of motor vehicles have
increased by 280 percent, to $1.8 billion, since 2005
when the FTA with Australia went into effect.
Canada and Mexico combined to buy 78.5 percent of
the $60.8 billion in U.S. exports of motor vehicle parts
in 2013.
Countries negotiating the Trans-Pacific Partnership
(TPP) and Transatlantic Trade and Investment
Partnership (TTIP) agreements purchased $961.3
billion, or 61 percent, of U.S. goods exports in 2013.
By the Numbers
107%
Increase in U.S. goods Exports to FTA Partners Between 2003 and 2013
$138
$1,666
Non-FTACountries
FTA PartnerCountries*
Per Capita Purchases of U.S Goods, 2013
In 2013, FTA partners purchased 12 times more goods per capita from United States than non-FTA partners.
* U.S. FTAs in effect with countries in 2013.
Contact: David Thomas, Business Roundtable, 202-496-3262, [email protected] www.brt.org/trade
Foreign Investment in the United States Creates Jobs
Overview
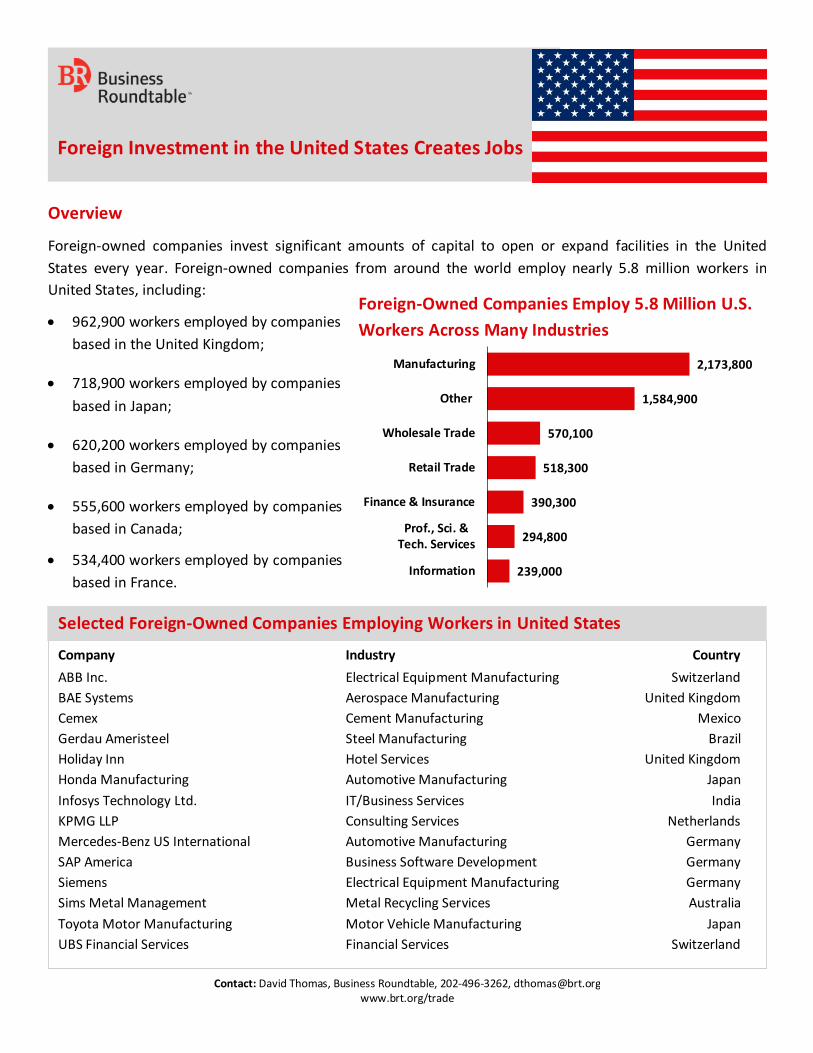
Foreign-owned companies invest significant amounts of capital to open or expand facilities in the United
States every year. Foreign-owned companies from around the world employ nearly 5.8 million workers in
United States, including:
962,900 workers employed by companies
based in the United Kingdom;
718,900 workers employed by companies
based in Japan;
620,200 workers employed by companies
based in Germany;
555,600 workers employed by companies
based in Canada;
534,400 workers employed by companies
based in France.
Company Industry Country
ABB Inc. Electrical Equipment Manufacturing Switzerland
BAE Systems Aerospace Manufacturing United Kingdom
Cemex Cement Manufacturing Mexico
Gerdau Ameristeel Steel Manufacturing Brazil
Holiday Inn Hotel Services United Kingdom
Honda Manufacturing Automotive Manufacturing Japan
Infosys Technology Ltd. IT/Business Services India
KPMG LLP Consulting Services Netherlands
Mercedes-Benz US International Automotive Manufacturing Germany
SAP America Business Software Development Germany
Siemens Electrical Equipment Manufacturing Germany
Sims Metal Management Metal Recycling Services Australia
Toyota Motor Manufacturing Motor Vehicle Manufacturing Japan
UBS Financial Services Financial Services Switzerland
Selected Foreign-Owned Companies Employing Workers in United States
Foreign-Owned Companies Employ 5.8 Million U.S.
Workers Across Many Industries
2,173,800
1,584,900
570,100
518,300
390,300
294,800
239,000
Manufacturing
Other
Wholesale Trade
Retail Trade
Finance & Insurance
Prof., Sci. &Tech. Services
Information
Contact: David Thomas, Business Roundtable, 202-496-3262, [email protected] www.brt.org/trade
Data Sources
U.S. JOBS DEPEND ON TWO-WAY TRADE
Jobs-Tied-to-Trade: Baughman and Francois, “Trade and American Jobs, The Impact of Trade on U.S. and State-Level Employment: 2014 Update” (2014) (http://businessroundtable.org/resources/trade-and-american-jobs-2014-update)
Exporting Firm Wages: Riker, “Do Jobs in Export Industries Still Pay More? And Why?” (2010) (http://www.trade.gov/mas/ian/build/groups/public/@tg_ian/documents/webcontent/tg_ian_003208.pdf)
Exporting Firm Growth: Bernard and Jensen, “Exporting and Productivity in the USA” (2004) (http://faculty.tuck.dartmouth.edu/images/uploads/faculty/andrew-bernard/exprod.pdf)
U.S. BUSINESSES GROW WITH EXPORTS
Small and Large Firms Partnering to Export (for 2007, the most recent year for which data were available): U.S. International Trade Commission, Small and Medium-Sized Enterprises: Characteristics and Performance, November 2010, (http://www.usitc.gov/publications/332/pub4189.pdf)
Exports, Rankings, and Trends: The Trade Partnership, derived from U.S. Census Bureau (“Census”) data (http://tradepartnership.com/data/cdxports-and-cdxjobs)
Exporting Company Information: Census, “A Profile of U.S. Importing and Exporting Companies, 2011 – 2012” (http://www.census.gov/foreign-trade/Press-Release/edb/2012)
U.S. COMPANIES EXPORT THROUGHOUT THE WORLD
Exports, Rankings, and Trends: The Trade Partnership (http://tradepartnership.com/data/cdxports-and-cdxjobs)
Export vs. GDP Growth: Derived from Census export data and U.S. Bureau of Economic Analysis (BEA) “GDP by State” database (http://bea.gov/regional/index.htm)
U.S. COMPANIES & WORKERS USE IMPORTS TO COMPETE IN INTERNATIONAL MARKETS
Importing Company Information: Census, “A Profile of U.S. Importing and Exporting Companies, 2011 – 2012” (http://www.census.gov/foreign-trade/Press-Release/edb/2012)
Imports as Components: Derived from Census end-use import data
Savings from Liberalization: Bradford, Grieco, and Hufbauer, “The Payoff to America from Global Integration” (2005) (http://www.piie.com/publications/papers/2iie3802.pdf)
Price Changes: Derived from BLS Consumer Price Index database (http://www.bls.gov/cpi/)
THE UNITED STATES NEEDS TRADE AGREEMENTS TO GROW
Exports and Trends: The Trade Partnership (http://tradepartnership.com/data/cdxports-and-cdxjobs)
Per Capita Purchases of United States Goods: Derived from The Trade Partnership (http://tradepartnership.com/data/cdxports-and-cdxjobs) and World Bank population estimates
Jobs-Tied-to-FTAs: U.S. Chamber of Commerce, “Opening Markets, Creating Jobs: Estimated U.S. Employment Effects of Trade with FTA Partners” (2010) (http://tradepartnership.com/pdf_files/US%20Chamber%20-%20Opening%20Markets,%20Creating%20Jobs%20study.pdf)
FOREIGN INVESTMENT IN THE UNITED STATES CREATES JOBS
Employment Data: BEA “Direct Investment & Multinational Companies” database (http://bea.gov/iTable/index_MNC.cfm)
Foreign Investors: Uniworld BP database of “Foreign Firms Operating in the United States” (http://www.uniworldbp.com)


![White Paper on International Economy and Trade …White Paper on International Economy and Trade 2019 [Outline] July 2019 Trade Policy Bureau Ministry of Economy, Trade and Industry1](https://img.pdfslide.us/doc/110x75/5e9cc27f2dba9e66db7ea99a/white-paper-on-international-economy-and-trade-white-paper-on-international-economy.jpg)