Embed Size (px)
Citation preview
How the Perception of Control Influences Unemployed Job Search
Andrew McGee Department of Economics Simon Fraser University
December 2013
Abstract: I consider how locus of control—the degree to which one believes one’s actions influence outcomes—is related to unemployed job search. I find evidence that “internal” job seekers (who believe their actions determine outcomes) set higher reservation wages than do their more “external” counterparts (who believe their actions have little effect on outcomes) and weak evidence that internal job seekers search more intensively. Consistent with the assumption that locus of control influences job search through an effect on beliefs about the return to search effort, internal job seekers are no better at converting search effort into job offers and earn no more than their peers upon finding employment.
1
I. Introduction
With youth unemployment at historically high levels in the United States (Bell and
Branchflower 2011), efforts to help young people find employment have taken on renewed
urgency. Such efforts have tended to focus on costly and time-consuming job training programs
to improve workers’ human capital, but the evidence of the effectiveness of such programs is
mixed (Smith 1998). Workers’ economic preferences, personality traits and other psychological
factors may be less malleable and thus less suited to interventions aimed at changing them than
human capital, but these “noncognitive” characteristics are almost certainly related to job search
decisions as they have been shown to be related to schooling decisions, occupational choice, and
job search (e.g., Coleman and Deliere 2003; Della Vigna and Paserman 2005; Heckman, Stixrud,
and Urzua 2006; Piatek and Pinger 2010; Antecol and Cobb-Clark 2013; Lundberg 2013) as well
as to earnings (e.g., Kuhn and Weinberger 2005; Borghans, ter Weel, and Weinberg 2008).
Intervening to help job seekers avoid the costly mistakes that their noncognitive characteristics
suggest they may make in their job search decisions could prove to be both an expedient and
cost-effective strategy to promote successful employment outcomes.
For instance, many job seekers are likely uncertain about the extent to which time spent
looking for work affects the probability that they will find a job. When uncertain about this
return to search effort, general beliefs about the connection between one’s effort and outcomes in
life—one’s locus of control (Rotter 1966)—may influence job search decisions by informing
beliefs about the return to search effort. In this study, I investigate whether unemployed job
seekers’ locus of control beliefs are related to their search behavior. Understanding how locus of
control influences reservation wage and search effort decisions may help programs to provide
2
customized assistance to unemployed job seekers in order to speed their return to employment.
I incorporate locus of control into a discrete time, infinite horizon model of unemployed
job search to derive comparative static predictions concerning the effects of locus of control on
reservation wages and search effort. I assume that job seekers’ locus of control beliefs influence
beliefs about the arrival rate of job offers conditional on search effort. The model predicts that a
job seeker with an “internal” locus of control who believes his efforts will influence outcomes
searches more than a job seeker with an “external” locus of control who believes his efforts have
little effect on outcomes because the “internal” job seeker believes the return to search effort to
be higher. Because the more internal job seeker expects more offers conditional on search effort
than does his less internal counterpart, he also sets a higher reservation wage. The predicted
effect on the exit rate from unemployment is ambiguous: increased search effort makes job offers
more likely but higher reservation wages increase the likelihood that these offers will be rejected.
Incorporating locus of control into a job search model in this manner is consistent with
locus of control’s role in social learning theory, which posits that beliefs about the likelihood of
outcomes given specific behaviors are influenced most by prior experiences in the same or
related situations but also that general beliefs applying to a broad spectrum of situations and
behaviors such as locus of control are important in determining beliefs when individuals confront
unfamiliar situations (Phares 1976). Psychologists have argued that internal individuals will exert
more effort searching for employment than external individuals (Friedrich 1987), but the
evidence is inconclusive. Friedrich (1987) and Heaven (1995) find small positive correlations
between internality and search activities among college students and teenage job seekers,
respectively, while Saks and Ashforth (1999) and Feather and O’Brien (1987) find insignificant
correlations in samples of college seniors and Australian youth. Kanfer, Wanberg, and
3
Kantrowitz (2001) perform a meta-analysis of existing studies and find a small but positive and
statistically significant correlation between internality and search intensity. These studies,
however, make no attempt to disentangle locus of control’s effects from the effects of human
capital. More importantly, the relationship between locus of control and reservation wages—a
key feature of any economic model of search—has gone unstudied. Focusing only on the effects
of locus of control on search intensity has led authors such as Plumly and Oliver (1987) to
conclude—perhaps incorrectly—that internality leads to shorter unemployment durations.
Understanding the relationship between locus of control and unemployment durations requires
considering the effects of locus of control on both search intensity and reservation wages.
I test the model’s assumptions and predictions using data from the 1979 National
Longitudinal Survey of Youth (NLSY79), which provides direct measures of locus of control,
reservation wages and the search experiences of unemployed respondents between 1979 and
1986 and—for 1981 only—data on time spent searching for employment and the receipt of job
offers. I find that locus of control is related to both reservation wages and search intensity in the
manner predicted by the model: a one standard deviation increase in “internality” is associated
with a 1.1% increase in reservation wages and an imprecisely estimated 0.42 hour increase in
weekly search hours—effects on search behavior comparable to those of conventional measures
of human capital. I find no significant relationship between locus of control and the probability
of exiting unemployment—suggesting that the effects of locus of control on reservation wages
and search intensity may offset each other. Finally, I show that locus of control does not
influence reemployment wages as it would if employers value internality as a skill and that
internal workers are not, in fact, better searchers than their less internal peers.
Closely related to this study is the independent work by Caliendo, Cobb-Clark, and
4
Uhlendorff (2012), who find that a one standard deviation increase in internality is associated
with a 1.5% increase in reservation wages and 0.14 additional applications submitted to
employers among German job seekers in 2007 and 2008. Their study has several advantages. In
particular, their findings are robust to controlling for personality traits unobserved in my data and
using different methods to identify “internal” and “external” respondents. They also avoid the
selection issues present in my sample by studying a sample of newly unemployed workers.
Perhaps most importantly, Caliendo et al. find that internal job seekers believe each application
submitted increases the chances of receiving an acceptable job offer by more than do external job
seekers—direct evidence that locus of control affects beliefs about the efficacy of search effort.
By contrast, I provide indirect evidence to this effect by ruling out competing explanations for
the effects of locus of control on search behavior, and I exploit the NLSY79’s extensive work
history information to examine the relationships between locus of control and unemployment
durations and re-employment wages. Both studies are consistent with McGee and McGee’s
(2011) finding that locus of control is related to search behavior in a lab experiment only when
subjects are uncertain about the return to search effort, and overall the studies complement each
other to the extent that the findings are so similar despite using different measures of locus of
control and search intensity in samples from different populations, countries and time periods.
By modeling locus of control’s effect on beliefs that in turn affect decision-making, the
study is consistent with prior studies that assume that locus of control influences educational
attainment (Coleman and Deleire 2003) and labor contracts (Bowles, Gintis, and Osborne 2000)
through effects on beliefs. Numerous studies model how searchers update beliefs about the
arrival rate of offers (Chalkley 1984; Falk, Huffman, and Sunde 2006) and the offer distribution
(Morgan 1985; Burdett and Vishwanath 1988), but few papers examine empirically how beliefs

5
about the search process affect search behavior. Important exceptions include Anderson (1992),
who finds that higher recall expectations reduce the hazard rate from unemployment, and
Spinnewijn (2009), who finds that searchers overestimate the arrival rate of job offers
independent of search effort.
In the context of educational attainment, Lundberg (2013) suggests that policy-makers
adapt school environments to suit the personality traits students already possess given that the
traits themselves may be difficult to alter. Like personality traits, attempts to influence locus of
control beliefs may be ineffectual, and policy-makers whose objective is to reduce the ranks of
the unemployed might wish to provide job seekers with different locus of control beliefs with
different assistance. Locus of control can be easily measured using a short, four-item
questionnaire. External job seekers who might spend less time searching may need to be
encouraged to search more, while internal job seekers may need to be encouraged to not let
hopes of the “perfect job” stand in the way of an acceptable job by setting high reservation
wages. In addition, McGee and McGee (2011) find evidence in the lab that external searchers are
more likely to become discouraged and quit searching, suggesting that—if also true in the labor
market—assistance programs might be able to use locus of control measures to identify
unemployed job seekers most at risk of exiting the workforce.
Finally, suggesting the use of locus of control to target particular job seekers for
customized assistance is both ambitious and speculative, but the study does highlight one sure-
fire, welfare-enhancing intervention: providing job seekers with counseling to improve their
understanding of the job market and the role search effort plays in finding work. Job seekers
choose reservation wages and search effort that maximize their expected utility given their
beliefs, but only with properly “calibrated” beliefs will they make the search decisions that

6
benefit them the most. Encouragingly in this regard, McGee and McGee (2011) show that the
correlation between locus of control beliefs and search behavior in their experiment was
eliminated by providing subjects with fairly minimal information about the search process.
II. Model of Unemployed Job Search
A. Structure of the Model
I consider a discrete-time version of the infinite horizon job search model with a known
offer distribution and endogenous search effort studied by Mortensen (1977, 1986). In any
period, an unemployed job seeker exerts effort st looking for a job. The probability of receiving a
job offer conditional on this effort is given by tiiti sbasg +=)( if
i
it
b
as
−≤
1 and 1)( =ti sg
otherwise, where the baseline arrival rate of offers (�� = �(��)) and search efficiency (�� =
�(��)) are deterministic functions of individual characteristics and local labor market conditions.
I depart from the literature by assuming that job seekers know the baseline arrival rate of
offers, ia , but are uncertain about the efficiency of job search
ib . I further assume that general
locus of control beliefs inform beliefs about the return to search effort and that these beliefs are
increasing in internality.1 Specifically, I assume that iiiii lXblXbE )(),|( = , where locus of
control, il , ranges from ],0[ l and is increasing in internality. The job seeker’s estimate of the
probability of receiving an offer conditional on effort is tiiiiit
E slXbXalXsg )()(),|( += . I
assume that job seekers do not update their beliefs within unemployment spells in order to focus
on the stationary solution to this dynamic programming problem and gain insight into how locus
of control affects search behavior in a simple, analytically tractable model.
1 Locus of control is assumed to not influence beliefs about the baseline arrival rate of job offers because �� is
unrelated to effort. Spinnewijn (2009) finds that individuals overestimate this baseline arrival rate.
7
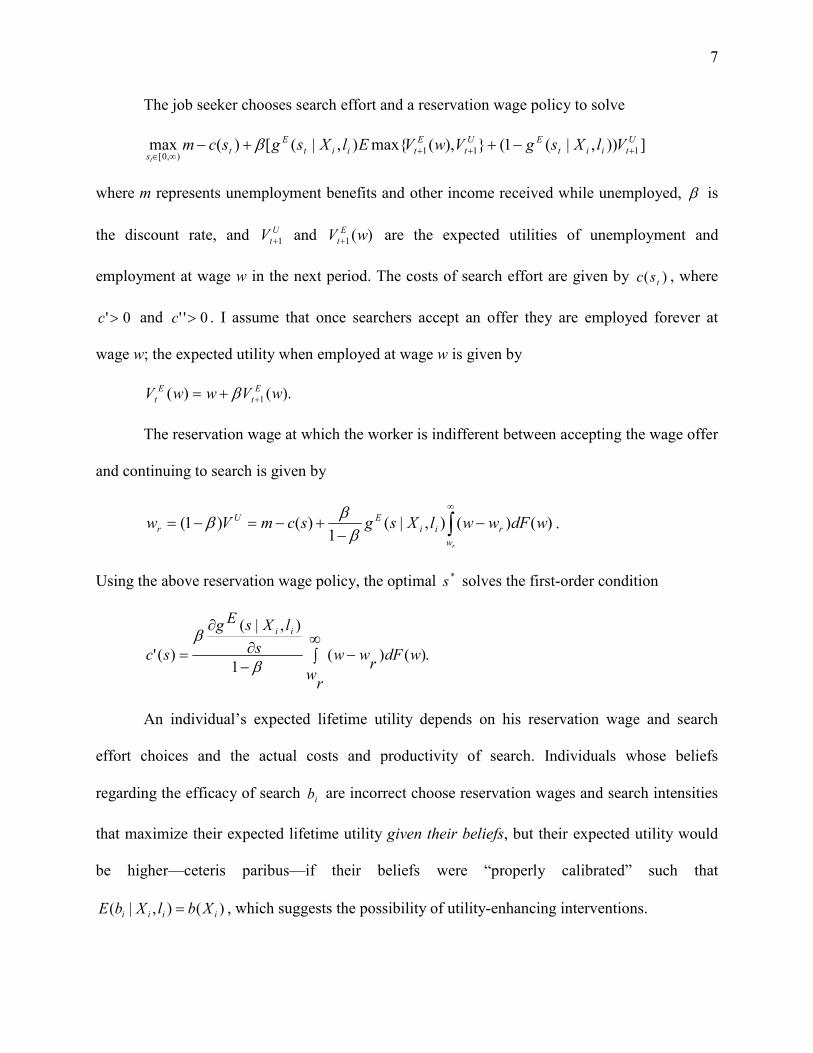
The job seeker chooses search effort and a reservation wage policy to solve
])),|(1(}),(max{),|([)(max 111),0[
U
tiit
EU
t
E
tiit
E
ts
VlXsgVwVElXsgscmt
+++∞∈
−++− β
where m represents unemployment benefits and other income received while unemployed, β is
the discount rate, and U
tV 1+ and )(1 wV E
t+ are the expected utilities of unemployment and
employment at wage w in the next period. The costs of search effort are given by )( tsc , where
0'>c and 0'' >c . I assume that once searchers accept an offer they are employed forever at
wage w; the expected utility when employed at wage w is given by
).()( 1 wVwwV E
t
E
t ++= β
The reservation wage at which the worker is indifferent between accepting the wage offer
and continuing to search is given by
∫∞
−−
+−=−=rw
rii
EU
r wdFwwlXsgscmVw )()(),|(1
)()1(β
ββ .
Using the above reservation wage policy, the optimal *s solves the first-order condition
.)()(1
),|(
)(' ∫∞
−−∂
∂
=
rw
wdFr
wws
lXsEg
sc
ii
β
β
An individual’s expected lifetime utility depends on his reservation wage and search
effort choices and the actual costs and productivity of search. Individuals whose beliefs
regarding the efficacy of search ib are incorrect choose reservation wages and search intensities
that maximize their expected lifetime utility given their beliefs, but their expected utility would
be higher—ceteris paribus—if their beliefs were “properly calibrated” such that
)(),|( iiii XblXbE = , which suggests the possibility of utility-enhancing interventions.

8
B. Predictions
I show in Appendix A that 0*
>∂
∂
l
s and 0>
∂
∂
l
wr . Internal (high-l) individuals believe
that the return to search effort in terms of the probability of receiving an offer is higher than do
external individuals and exert more search effort ( *s ) as a result. Conditional on their search
effort, however, internal individuals expect more offers and thus set higher reservation wages
(wr). The probability of exiting unemployment in any period is given by
)Pr()|1Pr(),( rr wwsOfferwsh ≥== , where Offer=1 indicates receipt of an offer. Search effort
and reservation wages have competing effects on the exit rate from unemployment, resulting in
an ambiguous comparative static prediction. Internal individuals search more and receive more
offers as a result, but they refuse more offers as a consequence of their higher reservation wages.
C. Other Roles for Locus of Control
The model assumes that locus of control affects unemployed search only through its
effect on beliefs about the return to search effort, but other channels may exist. First, locus of
control may be a skill or be correlated with unmeasured skills that influence productivity on-the-
job. Second, locus of control may be related to the actual productivity of job search. Finally,
internality may be associated with lower search costs if internal individuals find search effort less
onerous. These alternative channels imply that an increase in “internality” leads to a higher
continuation payoff to search resulting in higher reservation wages and either higher marginal
benefits or lower marginal costs of search resulting in higher search intensity—the same
comparative static predictions as in my model. The assumption that locus of control affects
search through an effect on beliefs about the efficacy of search effort is most consistent with the
construct that psychologists designed locus of control scales to measure, but empirical tests of
this assumption and each comparative static prediction are presented in section IV.
9
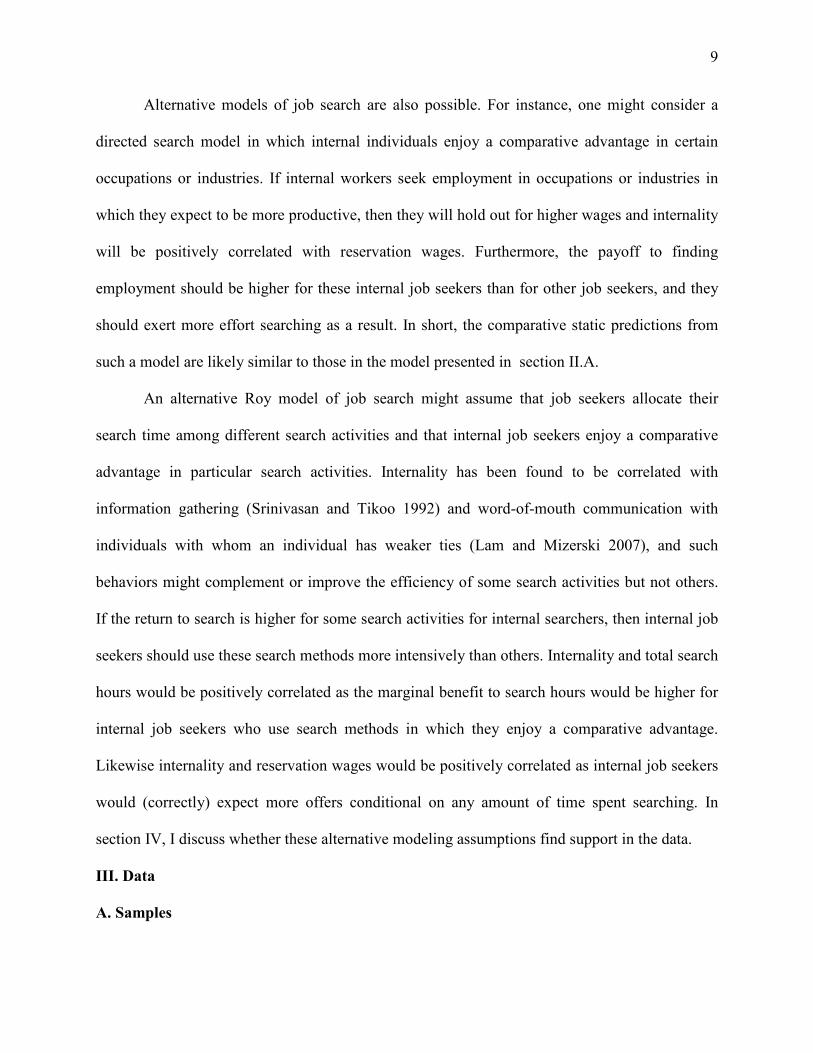
Alternative models of job search are also possible. For instance, one might consider a
directed search model in which internal individuals enjoy a comparative advantage in certain
occupations or industries. If internal workers seek employment in occupations or industries in
which they expect to be more productive, then they will hold out for higher wages and internality
will be positively correlated with reservation wages. Furthermore, the payoff to finding
employment should be higher for these internal job seekers than for other job seekers, and they
should exert more effort searching as a result. In short, the comparative static predictions from
such a model are likely similar to those in the model presented in section II.A.
An alternative Roy model of job search might assume that job seekers allocate their
search time among different search activities and that internal job seekers enjoy a comparative
advantage in particular search activities. Internality has been found to be correlated with
information gathering (Srinivasan and Tikoo 1992) and word-of-mouth communication with
individuals with whom an individual has weaker ties (Lam and Mizerski 2007), and such
behaviors might complement or improve the efficiency of some search activities but not others.
If the return to search is higher for some search activities for internal searchers, then internal job
seekers should use these search methods more intensively than others. Internality and total search
hours would be positively correlated as the marginal benefit to search hours would be higher for
internal job seekers who use search methods in which they enjoy a comparative advantage.
Likewise internality and reservation wages would be positively correlated as internal job seekers
would (correctly) expect more offers conditional on any amount of time spent searching. In
section IV, I discuss whether these alternative modeling assumptions find support in the data.
III. Data
A. Samples
10
The data come from the 1979 National Longitudinal Survey of Youth (NLSY79), which
follows a nationally representative sample of 12,686 men and women who were between the
ages of 14 and 22 when first interviewed in 1979. The respondents have been interviewed
annually between 1979 and 1994 and biennially thereafter, providing information on their
families, backgrounds, educational attainment, and labor market experiences.
To maximize sample sizes, I use separate samples to estimate the relationships between
locus of control and reservation wages, search intensity, the exit rate from unemployment,
reemployment wages, and the productivity of search effort. All samples are restricted to person-
year observations from respondents born between 1960 and 1964 who were unemployed and 18
or older when interviewed between 1979 and 1986 with valid responses for all controls. These
restrictions ensure that complete labor market histories are observed from age 18 onwards and
that locus of control is measured early in most respondents’ labor market careers.
A respondent contributes a person-year observation to the reservation wage sample if
when interviewed between 1979 and 1986 he/she was unemployed and reported a reservation
wage. Respondents contribute multiple person-year observations if their unemployment spell
spans multiple interviews or if they are interviewed in two distinct unemployment spells in this
period. I drop the top 1% and bottom 1% of reported reservation wages, leaving me with a
sample of 5,615 person-year observations from 3,291 respondents.2
The sample used to estimate the relationship between locus of control and search effort is
restricted to respondents who were unemployed when interviewed and had looked for work in
the previous four weeks in 1981—the only year respondents were asked the number of hours
2 Trimming the extreme responses eliminates reported reservation wages below $1.50/hour and above $25/hour. To
put this in perspective, the federal minimum wage on January 1, 1979, was $2.90.
11
spent searching in the last week in which the respondent looked for work. The resulting sample,
which is also used to estimate the relationship between locus of control and the productivity of
search effort, has observations from 386 respondents.
The sample used to estimate the proportional hazard model of the exit rate from
unemployment includes the first unemployment spell ongoing when a respondent was
interviewed between 1979 and 1986. Unemployment durations are not observed for 76
respondents who contribute observations to the reservation wage sample, leaving me with a
sample of 3,215 unemployment spells.
The sample used to estimate the relationship between locus of control and reemployment
wages includes observations of wages observed upon completion of unemployment spells
associated with observations in the reservation wage samples. Respondents contribute multiple
person-year observations only if they were interviewed during separate unemployment spells in
this period, and I also drop the top and bottom 1% of reemployment wages, resulting in a sample
of 4,646 person-year observations from 3,157 respondents.3
B. Dependent Variables
The self-reported reservation wage comes from responses to the question, “What would
the wage or salary have to be for you to be willing to take [a job offer]?” Asked of unemployed
respondents who were looking for work or who had looked for work in the previous four weeks
between 1979 and 1986, responses are converted to 1979 dollars using the consumer price index.
The search intensity measure sums the number of hours in the last week in which a
3 The sample is smaller than the reservation wage sample because some respondents are interviewed twice in a
single (lengthy) unemployment spell, drop out of the survey before their reemployment wage can be observed, or are
missing data on reemployment wages.
12
respondent looked for work spent contacting employers directly, checking with state or private
employment agencies, placing or answering ads, looking in the newspaper, checking with a
school placement service, looking for work through friends or relatives, and using all other
methods of looking for work. I use responses concerning whether each search method led to a
job offer to create the indicator for whether a job offer had been received when interviewed.
The completed duration of an unemployment spell counts the number of weeks spent
unemployed using the NLSY79’s weekly labor force status array. The weekly labor force status
identifies whether the respondent was working, out of the labor force, unemployed, or in the
military on a week-by-week basis from January 1, 1978, onwards.4 I exclude 76 observations for
which the calculated duration equals zero.5 Approximately two percent of spell durations are
right-censored because respondents drop out of the survey before their unemployment spell ends,
and unemployment spells longer than 140 weeks are treated as if they are right-censored given
the difficulty in estimating the baseline hazard in these periods.
Once unemployment spells are complete, respondents report wages with their new
employers—the reemployment wage. Reemployment wages are also converted to 1979 dollars.
C. Independent Variables
4 Categories in the weekly status array also include cases in which out of the labor force versus unemployed cannot
be determined and cases of employment with gaps in employment with the same employer when the dates of the
gaps cannot be identified. When counting the weeks of unemployment, I include weeks when out of the labor force
versus unemployment cannot be determined but not weeks associated with a period of employment with gaps. How
one handles these ambiguous weeks does not affect the findings presented in the next section.
5 Calculated duration can equal zero if the respondent indicated that they had looked for work in the previous four
weeks but not in the current week. When calculating the length of an unemployment spell using the weekly labor
force status array, I required that the unemployment spell include the week of the interview.
13
In the 1979 interview, respondents completed an abbreviated four-item version of
Rotter’s Internal-External Locus of Control Scale measuring general locus of control.6 Each item
consists of a pair of statements, one reflecting an internal locus of control and the other reflecting
an external locus of control. The items are scored by assigning a value of four when respondents
indicate that the internal statement is “much closer” to their own views, three when this
statement is only “slightly closer,” two when the external statement is “slightly closer,” and one
when the external statement is “much closer” to their own views. Raw scores ranging from 4
(highly external) to 16 (highly internal) are obtained by summing these responses.7 I subtract
birth year means to avoid confounding locus of control with age-at-test effects and divide by the
standard deviation for all respondents to the NLSY79 (regardless of whether they are in my
samples) to produce standardized locus of control scores.8
If locus of control changes over the life-cycle or in response to events, a respondent’s
locus of control when unemployed may not be well-measured by the 1979 score. Buchele (1983),
however, finds that labor market experiences have at most very small effects on measured locus
of control using longitudinal data, while more recently Cobb-Clark and Schurer (2011) show
using Australian data that locus of control is a mostly stable trait that largely does not respond to
important life events. As such, I assume that locus of control measured in 1979 is representative
6 Locus of control beliefs may be either situation-specific or general. For instance, an individual may believe based
on prior experience that outcomes in Scrabble depend mostly on random letter draws rather than effort. The same
individual may believe in general when confronting unfamiliar situations that his effort is the primary determinant of
outcomes. This individual is internal in general, but is external in the context of a specific activity.
7 All four paired statements are provided in Appendix B.
8 Children exercise little control over their daily routines and are very external as a result but become more internal
with age with internality peaking between 8th and 10th grades (Sherman 1984).
14
of locus of control in later periods. The potential for reverse causality is mitigated by considering
unemployment spells ongoing at the same time as or after locus of control was measured.
Internality is positively related to intelligence (Bar-Tal and Bar-Zohar 1977), self-esteem
(Judge, Erez, Bono, and Thoresen 2002), and motivation (Spector 1982)—characteristics that
may also be related to productivity and hence reservation wages and search effort. To proxy for
cognitive ability, I control for respondents’ standardized 1980 Armed Forces Qualifying Test
(AFQT) scores. To proxy for psychological factors, I include standardized scores from the
Rosenberg Self-Esteem Scale score, the ASVAB coding test as a proxy for conscientiousness
(Segal 2008), and the interviewers’ assessments of the respondent’s attitude.9
Additional controls for human capital include the respondent’s highest grade completed
and the number of weeks worked after the respondent turned 18 before the unemployment spell.
Other controls capture differences in the offer distribution and availability of employment
opportunities (region of residence, whether the residence is urban, local unemployment rates,
indicators for union membership in the previous job), differences in the opportunity costs of
search (weekly unemployment insurance benefits, marital status, family size, whether the
residence is urban), and differences in access to social and employment networks (race, gender,
mother’s highest grade completed). Finally, I include as additional covariates the total number of
9 I subtract birth year means and divide by the standard deviation of the full NLSY79 sample for the AFQT, self-
esteem and coding test scores. The interviewer’s assessment of the respondent’s attitude comes from remarks in
which the interviewer indicated whether the respondent was “friendly and interested,” “cooperative but not
interested,” “impatient and restless,” or “hostile.” I assign scores ranging from four for “friendly and interested” to
one for “hostile.” Interviewers, however, differ systematically in their perceptions of respondents’ attitudes, so I
subtract from the respondent’s score the average score assigned by the interviewer, take the average of the
respondent’s interviewer-adjusted scores from 1979 and 1980, and divide by the sample standard deviation.

15
weeks the respondent had spent unemployed since entering the workforce as of the interview and
the number of weeks unemployed in the current unemployment spell as of the interview.
D. Summary Statistics
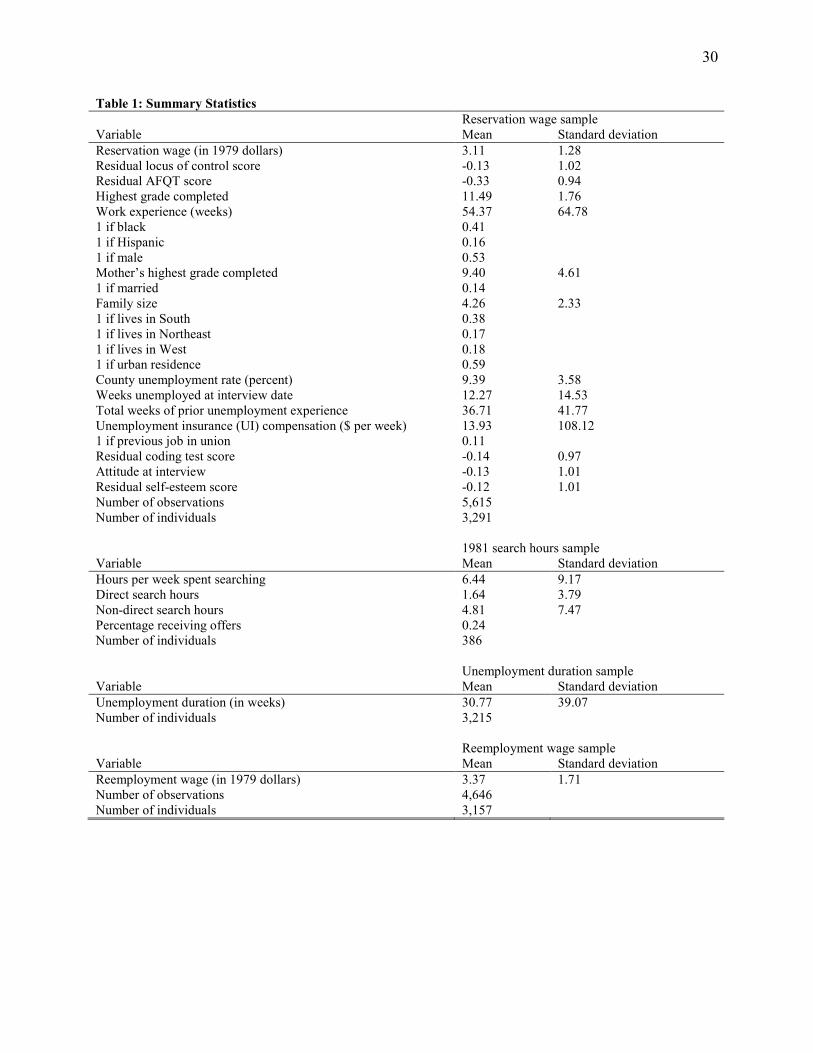
Table 1 presents the summary statistics for the reservation wage sample and for the
dependent variables in the remaining samples.10 The average reservation wage deflated to 1979
dollars ($3.11) is approximately 7% higher than the 1979 minimum wage and $0.26 less than the
average reemployment wage. Unemployed job seekers spend on average just 6.4 hours per week
looking for work—75% of which time they devote to looking for work through means other than
directly contacting employers. About a quarter of unemployed job seekers had received a job
offer at some point prior to being interviewed. On average, these job seekers spend just over 30
weeks before finding work. In terms of the controls, the average locus of control, AFQT, self-
esteem, coding, and interview attitude scores in the NLSY79 as a whole are zero by construction,
implying that the respondents contributing observations to the reservation wage sample are more
external, less cognitively able, have lower self-esteem, demonstrate less “conscientiousness,” and
were less cooperative when interviewed than the average NLSY79 respondent.
IV. Findings
A. Reservation Wages
To test the prediction that internality and reservation wages are positively related, I
estimate by OLS the log-reservation wage model
w
it
w
iti
wr
it Xlw εβα ++=ln
where r
itw is respondent i’s reservation wage at time t, li his/her locus of control, Xit the controls
described in the previous section, and w
itε the econometric error term. I correct the standard
10 The summary statistics for the independent variables in the other samples are similar to those reported here.
16
errors in the reservation and reemployment wage regressions to reflect the non-independence of
the error terms resulting from having multiple observations from some respondents.
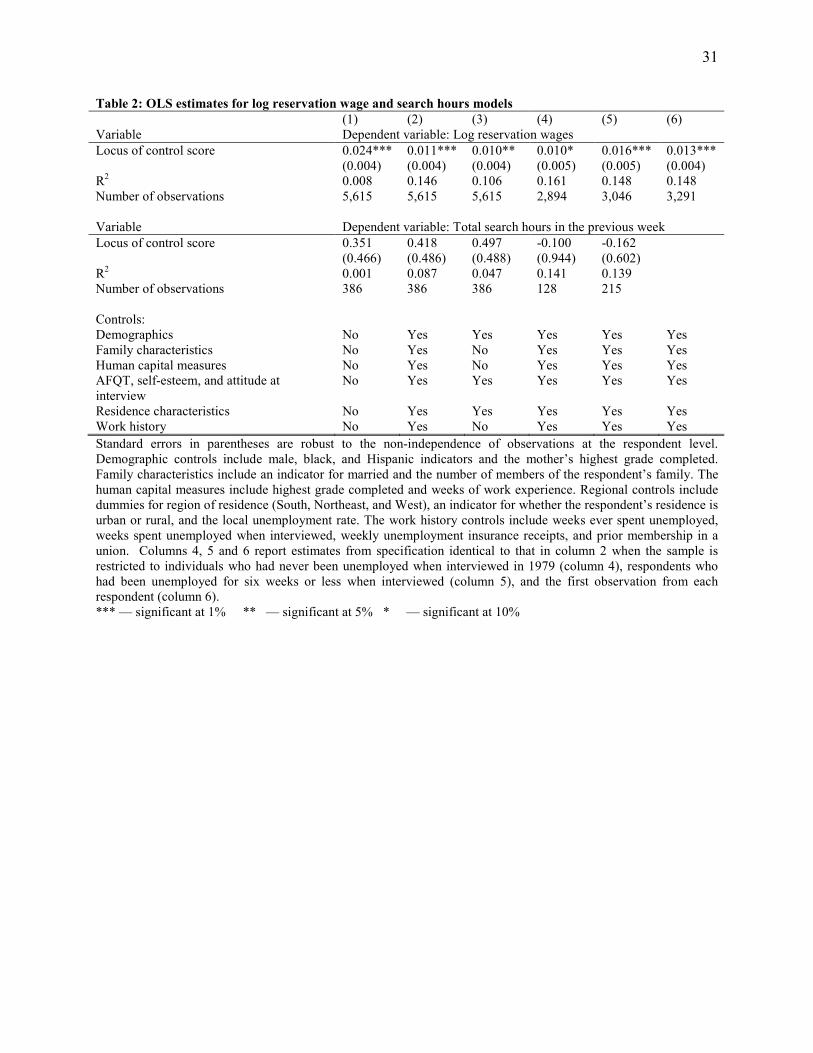
The top panel of table 2 reports the coefficient estimates for locus of control in alternative
specifications of the reservation wage model. Without other controls in column 1, a one standard
deviation increase in internality is associated with an estimated increase in a respondent’s
reservation wage of 2.4%. Consistent with the model’s prediction, a one standard deviation
increase in internality with the full set of controls in column 2 is associated with an estimated
increase in reservation wages of 1.1%—slightly smaller than the estimated 1.5% increase among
German job seekers that Caliendo et al. (2012) report.11 The effect of a one standard deviation
increase in internality is comparable to increasing the highest grade completed by more than half
a grade level or work experience by eighteen weeks, while a one standard deviation increase in
cognitive ability is associated with an estimated increase in reservation wages of just 0.5%. Some
controls in column 2 such as highest grade completed and work experience may be influenced by
locus of control, but the estimated relationship between locus of control and reservation wages
without these controls in column 3 (0.010) is essentially the same as that in column 2—
suggesting that most of the effect of locus of control on reservation wages is unrelated to its
relationship with human capital formation.
A potential problem is the fact that some respondents already had experience with
unemployment when locus of control was measured in 1979. If respondents had unobserved
characteristics that led them to be unemployed prior to the 1979 interview and these
unemployment experiences affected their Rotter scores, then locus of control score may be
correlated with this unobserved heterogeneity. In column 4, I restrict the sample to observations
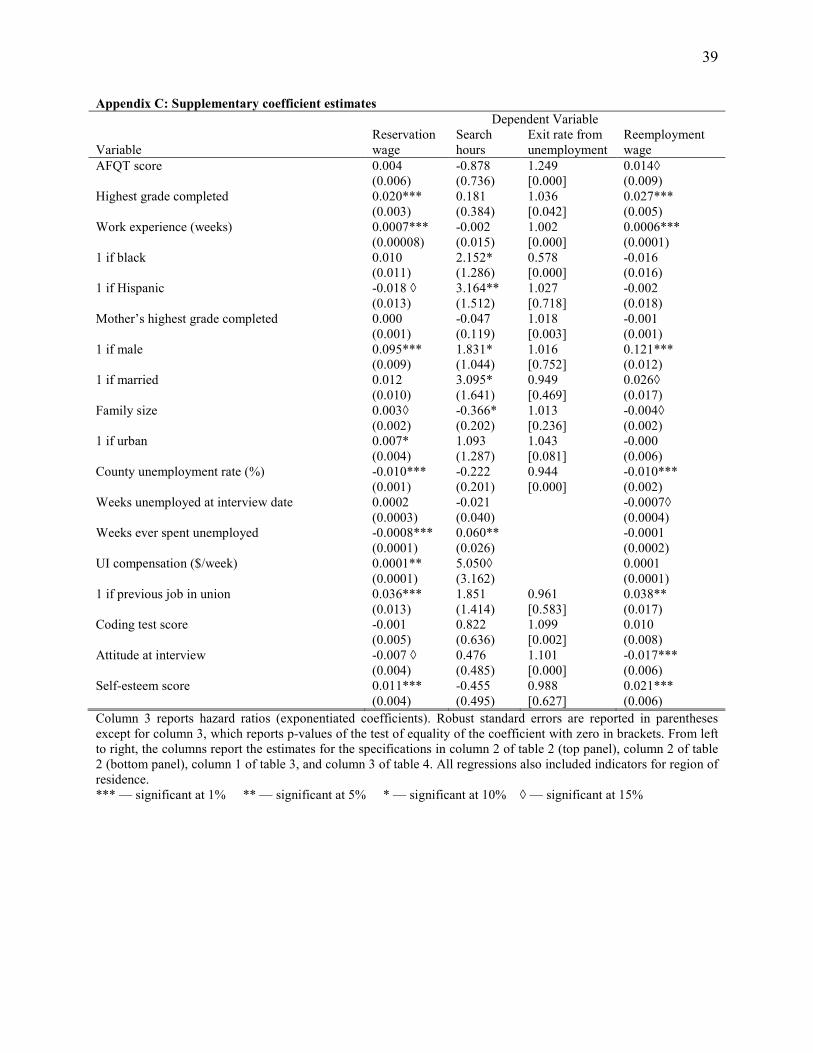
11 The table in Appendix C reports coefficient estimates for the remaining controls for a selection of the regressions.
17
from respondents who had not experienced unemployment prior to the 1979 interview. While
this restriction eliminates almost half of my sample, the estimated coefficient of locus of control
(0.010) is statistically indistinguishable from that in column 2.
Dynamic selection may influence my estimates if respondents who are unemployed for
long periods because of some unobserved characteristic(s) are more likely to be interviewed
while unemployed and if this unobserved heterogeneity is correlated with locus of control.
Caliendo et al. avoid this selection issue by using a random sample of newly unemployed
workers. While mine is not a random sample of the newly unemployed, I can restrict my sample
to respondents who have been unemployed for six weeks or less when interviewed. The estimate
in column 5 (0.016) is similar to that in column 2 and nearly identical to that obtained by
Caliendo et al. Similarly, the fact that some respondents contribute more observations than others
may pose a problem if respondents who are more frequently observed unemployed differ in some
unobserved way that affects their search behavior and if this heterogeneity is correlated with
locus of control. In column 6, I restrict the sample to the first observation contributed by every
respondent and obtain an estimated coefficient of locus of control of 0.013. The estimates in
column 5 and 6 suggest that if anything these sample selection and composition problems lead to
underestimates of internality’s relationship with reservation wages.
B. Search Intensity
To test the prediction that internality and search intensity are positively related, I estimate
by OLS the search intensity model
s
it
s
iti
s
it Xls εβα ++=
where sit is the number of hours respondent i spent searching in the last week of looking for
work. The bottom panel of table 2 reports the coefficient estimates for locus of control from
18
different specifications of the search intensity model. Because respondents were only asked
about their time spent looking for work in 1981, this sample is small, and the resulting estimates
imprecise. Though never precisely estimated, internality is positively correlated with the number
of hours spent looking for work as the model predicts in columns 1-3. In a sample in which
respondents report spending just 6.4 hours per week searching for employment, a one standard
deviation increase in internality is associated with an estimated increase of 0.35 hours of search
without other controls in column 1, 0.42 hours with all controls in column 2 and 0.50 hours with
all but the controls potentially influenced by locus of control in column 3. By contrast, search
hours are negatively correlated with cognitive ability (-0.99) but positively correlated with
coding scores (“conscientiousness”) and respondents’ attitudes (“cooperativeness”).
Columns 4 again reports the estimated coefficient of locus of control restricting the
sample to respondents who had never been unemployed when interviewed in 1979. This
restriction reduces the sample to 128 respondents, and internality and search hours are
uncorrelated in this subsample of observations. Likewise, internality and search hours are
uncorrelated when I restrict the sample to the 215 respondents who had been unemployed for six
weeks or less when interviewed in 1981 in column 5. Whether this is due to the extremely small
samples after imposing these restrictions or unobserved heterogeneity is unclear. The estimates
are too imprecise to draw conclusions from on their own, but the positive correlation between
search hours and internality in columns 1-3 is consistent with the positive correlation between
internality and search intensity observed in Kanfer et al.’s (2001) meta-analysis, Caliendo et al.’s
finding that more internal searchers submit more job applications, and McGee and McGee’s
finding that internality is positively correlated with search effort in the laboratory.
Like Caliendo et al., I also examined whether locus of control affects job search
19
differently for men and women. Also like those authors, I am unable to reject the hypothesis that
locus of control is related to search behavior in the same way for men and women in every
specification reported in the study, but also like those authors I note that the coefficient estimates
indicate that locus of control may be unrelated to search effort for women. While a one standard
deviation increase in internality is associated with a 0.81 hour increase in search hours for men,
the same increase is associated with a -0.29 hour decrease for women. While this small sample
precludes inferring that a gender difference exists, future investigation of potential gender
differences in the roles of locus of control and other psychological factors seems warranted.
C. Exit Rate from Unemployment
To examine the relationship between internality and the exit rate from unemployment, I
estimate by maximum likelihood a proportional hazard function of the form
])(exp[)()( 0
h
iiii Xlftt βλθλ +=
where )(0 tλ is the baseline hazard, iθ unobserved individual heterogeneity independent of the
other covariates, and the other controls identical to those used in the reservation wage and search
intensity samples.12 I estimate the model using a “flexibly parametric” baseline hazard that
estimates the baseline hazard in each of 24 six-week periods. I assume iθ is drawn from a
gamma distribution with mean one; the log-likelihood function for this specification of the
hazard function is given in Meyer (1990).
The model predicts that increases in internality will increase an individual’s reservation
12 I exclude from
itX the number of weeks unemployed when interviewed and the total weeks of prior
unemployment experience as these are mechanically related to the unemployment duration. I also exclude
unemployment insurance (UI) benefits because UI benefits cannot be determined in weeks other than the interview
week. The estimates are not sensitive to these exclusions.
20
wage and search intensity—effects that work in opposite directions where the exit rate from
unemployment is concerned. Because there is no reason to expect these offsetting effects to
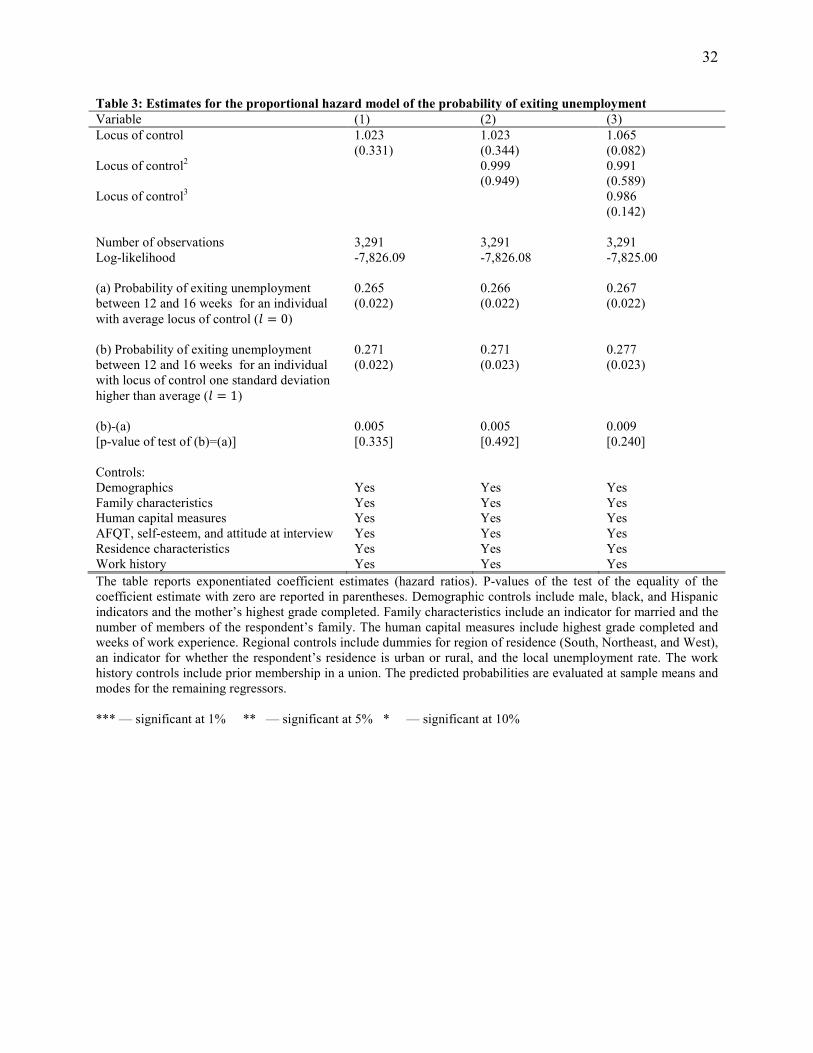
result in a linear relationship between internality and the exit rate from unemployment, table 3
reports the estimated hazard ratios for locus of control in which locus of control enters linearly
(column 1), as part of a quadratic (column 2), and as part of a cubic (column 3).13 The estimates
imply that a one-standard deviation increase in internality is associated with predicted increases
in the probability of exiting unemployment conditional on having been unemployed for 12 weeks
ranging from 0.5 percentage points in the linear specification to 0.9 percentage points in the
cubic specification, but none of these estimates is statistically significant. By contrast, one
standard deviation increases in cognitive ability, “conscientiousness,” and “cooperativeness” are
associated with predicted increases in the probability of exiting unemployment of 5.8, 2.2, and
2.3 percentage points, respectively, in column 1—effects which are precisely estimated. While
cognitive ability, personality and other noncognitive factors evidently matter to unemployment
durations, the competing effects of locus of control on reservation wages and search intensity
appear to offset each other where the exit rate from unemployment is concerned.
D. Alternative roles for locus of control in job search models
Locus of control influences re-employment wages (����) directly if employers pay for
internality and through reservation wages. To illustrate, consider a simple, two equation model:
ln(��� ) = ��� + ��à + ��
ln(����) = ��� + ��Θ + � ln(��
� ) + ��
I estimate the reduced-form log-reemployment wage model
ln(����) = ���� + �� + ��
13 Even more flexible specifications lead to similar conclusions.
21
As a function of the structural parameters, the reduced form coefficient of locus of control is
�� = � + ��. Reservation wages should be positively related to re-employment wages (� > 0),
while the estimates in table 2 (as well as the model) indicate that internality is positively related
to reservation wages (i.e., � > 0). Thus the reduced-form estimate �� provides an upper-bound
on the direct effect of internality on the wages paid by employers to new hires (�).
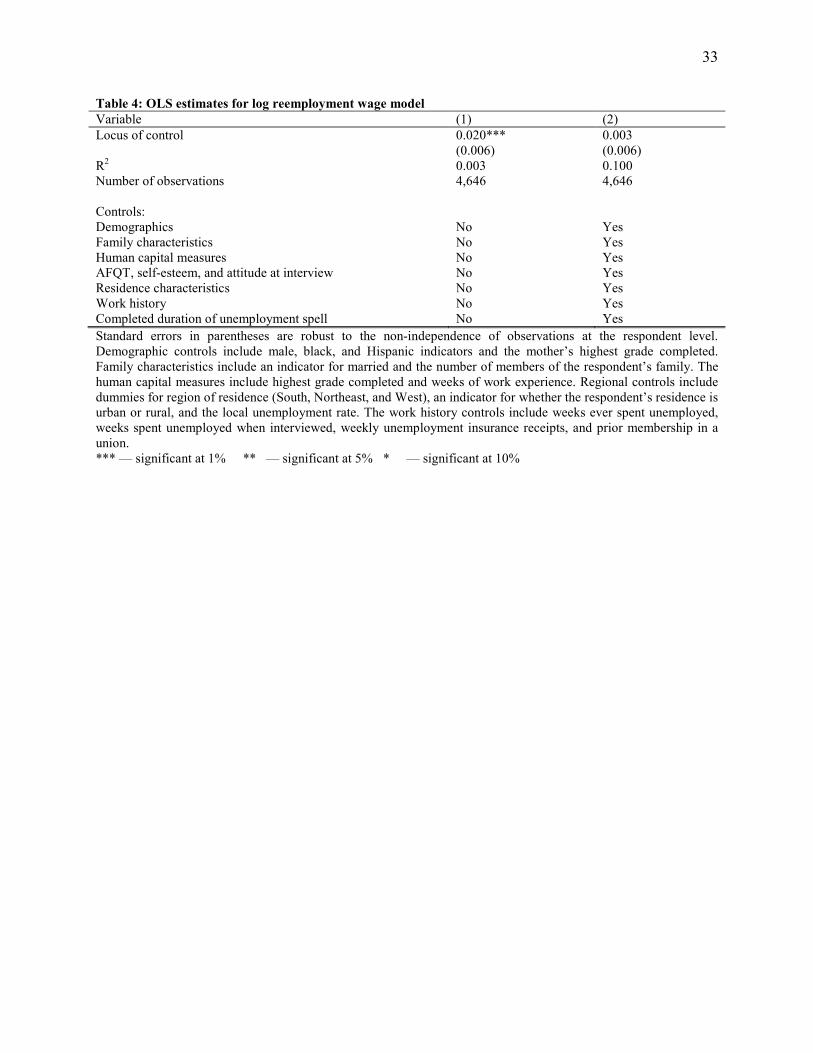
Table 4 reports the coefficient estimates for the reemployment wage model. Without
other controls in column 1, a one standard deviation increase in internality is associated with an
estimated increase in reemployment wages of 2.0%, but the estimated coefficient falls to 0.003
once the controls are added in column 2. Given that this near-zero estimate represents an upper-
bound on the direct effect of internality on wages, one can conclude that either employers do not
pay new hires for internality (� ≅ 0) or that employers value externality in new employees
(� < 0).14 The latter may be the case if, for instance, external workers are viewed as more
willing to take direction, but the notion that externality is a skill valued by employers is difficult
to square with the positive correlation between internality and reservation wages. By contrast,
the respondent’s highest grade completed, experience, and AFQT score are positively and
significantly related to re-employment wages. That internality is unrelated to re-employment
wages is surprising given that internality has been shown to be positively correlated with wages
in general (Andrisani 1977, 1981; Osborne-Groves 2005). One possibility is that internal workers
may pursue more aggressively opportunities for advancement or training once hired and enjoy
larger returns to tenure as a result. Alternatively, more internal workers may be more active in
job search while employed and experience larger wage gains from mobility than their less
14 Internality’s effect through reservation wages on re-employment wages may be small if reservation wages have
little effect on re-employment wages (i.e., � is small), an effect which depends on the distribution of wages.
22
internal peers. A study of whether the returns to tenure and mobility vary with psychological
factors would be useful to shed light on these issues.
Section III.C also discusses alternative job search models that could incorporate roles for
locus of control. One possibility is that internal workers enjoy a comparative advantage in some
occupations or industries and direct their search toward these industries and occupations. If job
seekers engage in this directed search, internality should be correlated with particular industries
or occupations in which job seekers find employment. In table 5, I add controls for the industry
(column 1) and occupation (column 2) in which the respondent ultimately finds employment to
the log-reservation wage and search intensity models in column 2 of table 2. The estimated
coefficients of locus of control are virtually identical to those in table 2 even while the
coefficients of the industry and occupation dummies are statistically different from zero—
suggesting that locus of control is uncorrelated with industry and occupation upon re-
employment in contrast to what one would expect in a directed search model. If internal workers
hold out for higher wages only when directing their search towards industries or occupations in
which they enjoy a comparative advantage, then more appropriate models of reservation wages
and search hours include interactions between locus of control and re-employment industry or
occupation. In such specifications, however, I fail to reject the equality of locus of control’s
relationships with reservation wages and search hours across re-employment industries and
occupations (estimates available from the author).15 On the whole, the estimates do not support
the notion that internal workers direct their search towards particular industries or occupations.
Alternatively, internality might improve a searcher’s efficiency using some job search
15 I also estimated multinomial logit models and found no significant relationships between locus of control and the
probability of finding employment in any particular industry or occupation.
23
methods but not others. I examine whether internality is related to how job seekers spend their
time by estimating the search intensity model in column 2 of table 2 separately for hours spent
contacting employers directly (column 3 of table 5) and for hours spent using all other methods
of looking for work (column 4). While internality is unrelated to the number of hours a job
seeker spends contacting employers directly—the search method to which job seekers devote the
most time—internality is positively related to the number of hours job seekers spend on tasks
such as contacting friends and relatives, looking in newspapers, visiting employment agencies,
and so on. The entire increase in search hours associated with a one-standard deviation increase
in internality reported in table 2 appears to result from an increase in time spent using methods
other than directly contacting employers.
What remains to be determined is whether internal job seekers spend more time searching
using these other methods because they merely believe these methods to be more effective than
do external job seekers (as in section II.A) or because they actually are better at converting
search hours into job offers. To examine this issue, I estimate a linear probability model of the
probability of receiving a job offer conditional on search hours:
Pr("##�$ = 1|'�) = ()�� + *+'� + *�'� ∙ �� + -�)
If *� > 0, then internal workers are more effective at converting search hours into job offers.
Table 6 reports the coefficient estimates for different specifications of this linear
probability model. Column 1 controls only for the number hours spent looking for work. Each
hour spent searching is associated with an estimated increase in the probability of receiving an
offer by 0.8 percentage points. Column 2 allows the returns to time spent directly contacting
employers and time spent using other search methods to differ. The estimated return to directly
contacting employers is considerably higher than (though not statistically different from) that of
24
other search methods—which perhaps explains why it is the search method to which respondents
devote the most time. Column 3 allows the return to total search hours to depend on one’s locus
of control, while column 4 allows the returns to time spent directly contacting employers and
time spent using other search methods to depend on locus of control. In both columns, the
interactions between locus of control and time spent looking for work are negative.16 Internal
searchers do not appear to enjoy a comparative advantage in their ability to convert time spent
looking for work into job offers both overall and for particular search activities.17
That internal job seekers spend more time doing things other than directly contacting
employers even though they appear to be no better at converting this time into job offers than
other searchers suggests either that these job seekers (incorrectly) believe the returns to these
activities to be higher than do more external job seekers or that they find these tasks less taxing.
The absence of a measure of search costs in my data leave me unable to rule out the possibility
that internal job seekers experience lower costs of job search. McGee and McGee (2011),
however, report results from a lab experiment in which subjects produce “offers” by exerting real
effort. In one treatment, subjects know the return to this effort, while in the other subjects have
no such information. They find that locus of control is positively correlated with effort and
reservation wages only when subjects are not informed about the return to effort, which is
inconsistent with locus of control affecting search through effort costs given that the nature of
16 The estimates in table 6 are robust to the inclusion of the full set of controls (��).
17 A potential explanation for this finding is that the actual search technology—in contrast to the model in II.A—
exhibits diminishing marginal productivity of search hours. In this case, the average (and marginal) search
productivity for internal job seekers would be lower than for other searchers because internal job seekers spend more
time searching. Specifications with nonlinear functions of search hours, however, indicate that the probability of
having received an offer is, if not a linear function, then a convex function of search hours.
25
the effort exerted is the same in both treatments.
Another possibility that my study cannot address is that the estimated effects of locus of
control might result from its correlation with economic preferences and personality traits
unobserved in my data (Becker, Deckers, Dohmen, Falk, and Kosse 2012). McGee and McGee
and Caliendo et al., however, show that the relationships between locus of control and
reservation wages and search effort are robust to controlling for risk preferences and personality
traits.18
V. Conclusions
I consider how locus of control influences the reservation wages and search intensity of
unemployed job seekers. In the model, internal individuals who believe that outcomes depend on
their own efforts are more likely to believe that their search effort will translate into a job offer
than are external individuals who believe that outcomes have little to do with their efforts. As a
result, internal individuals search more intensively than their external counterparts—but internal
individuals also set higher reservation wages because they believe offers are more likely
conditional on search effort. These predictions are mostly borne out in the NLSY79 data. Unlike
other cognitive and noncognitive factors, locus of control is not systematically related to the
probability of exiting unemployment—likely because of the competing nature of its effects on
reservation wages and search intensity
I also consider the possibility that locus of control is simply correlated with factors
affecting on-the-job or search productivity by estimating the relationships between locus of
18 Measures of risk and time preferences were first collected in the NLSY79 in 1993 and 2006, respectively. I do not
control for these measures given that they are observed long after the unemployment spells in my sample end, but
the estimated relationships between locus of control and reservation wages and search hours are robust to the
inclusion of these controls (estimates available from the author).
26
control and reemployment wages and the search technology. I find that more internal workers
earn no more than their peers upon being re-employed despite internality’s effect on reservation
wages, indicating that internality is not a skill for which employers are willing to pay. Similarly,
I find no evidence that internal searchers are better than their peers at converting search effort
into offers. Internal searchers may believe themselves to be better searchers than their peers, but
the data indicate that, in fact, they are not.
The findings suggest that searchers rely in part on their general locus of control when
forming beliefs about the return to search effort. While job seekers informed by their locus of
control maximize their expected utility given their beliefs, interventions leading them to
correctly assess the return to search effort would be welfare-enhancing. Counseling and
mentoring programs that provide unemployed job seekers with information regarding the job
market have the potential to reduce individuals’ reliance on general locus of control beliefs and
avoid miscalculations in choosing search effort and reservation wages. Furthermore, locus of
control beliefs may be used by unemployment assistance programs to identify job seekers at risk
of becoming discouraged and to tailor their assistance with internal individuals being encouraged
not to hold out for perfect jobs where acceptable jobs will do and external individuals being
assisted in using job search methods beyond directly contacting employers.

27
References
Anderson, Patricia M. 1992. Time-varying effects of recall expectation, a reemployment bonus, and job counseling on unemployment durations. Journal of Labor Economics, 10(1): 99-115.
Andrisani, Paul J. 1977. Internal-external attitudes, personal initiative, and the labor market
experience of black and white men. Journal of Human Resources, 12(3): 308-328. Andrisani, Paul J. 1981. Internal-external attitudes, sense of efficacy, and labor market
experience: A reply to Duncan and Morgan. Journal of Human Resources, 16(4): 658-666. Antecol, Heather and Deborah A. Cobb-Clark. 2013. Do psychosocial traits help explain gender
segregation in young people’s occupations? Labour Economics, 21: 59–73. Bar-Tal, Daniel and Yaakov Bar-Zohar. 1977. The relationship between perception of locus
control and academic achievement. Contemporary Educational Psychology, 2(2): 181-199. Becker, Anke, Thomas Deckers, Thomas Dohmen, Armin Falk, and Fabian Kosse. 2012. The
relationship between economic preferences and psychological personality measures. Annual Review of Economics, 4: 453-478.
Bell, David and David Branchflower. 2011. Young people and the Great Recession. Oxford
Review of Economic Policy, 27 (Summer 2): 241-267. Borghans, Lex, Bas ter Weel, and Bruce A. Weinberg. 2008. Interpersonal styles and labor
market outcomes. Journal of Human Resources 43(4): 815–858. Bowles, Samuel, Herbert Gintis, and Melissa Osborne. 2001. Incentive-enhancing preferences:
Personality, behavior and earnings. AEA Papers and Proceedings, 91(2): 155-158. Buchele, Robert. 1983. Economic achievement and the power of positive thinking. Journal of
Human Resources, 18(3): 441-449. Burdett, Kenneth and Tara Vishwanath. 1988. Declining reservation wages and learning. Review
of Economic Studies, 55(4): 655-666. Caliendo, Marco, Deborah Cobb-Clark, and Arne Uhlendorff. 2012. Locus of control and job
search strategies. Working paper. Chalkley, Martin. 1984. Adaptive job search and null offers: A model of quantity constrained
search. Economic Journal, 94: 148-157. Cobb-Clark, Deborah and Stefanie Schurer. 2013. Two economists’ musings on the stability of
locus of control. The Economic Journal, 123(570): F358–F400. Coleman, Margo and Thomas DeLeire. 2003. An economic model of locus of control and the
28
human capital investment decision. Journal of Human Resources, 38(3): 701-21. Della Vigna, Stefano and M. Daniel Paserman. 2005. Job search and impatience. Journal of
Labor Economics, 23(3): 527-588. Falk, Armin, David Huffman and Uwe Sunde. 2006. Do I have what it takes? Equilibrium search
with type uncertainty and non-participation. IZA Discussion Paper No. 2531. Feather, N. T. and Gordon E. O’Brien. 1987. Looking for employment: An expectancy valence
analysis of job-seeking behavior among young people. British Journal of Psychology, 78(2): 251-272.
Friedrich, James R. 1987. Perceived control and decision making in a job hunting context. Basic
and Applied Social Psychology, 8(1-2): 163-176. Heaven, Patrick C. L. 1995. Job-search strategies among teenagers: Attributions, work beliefs,
and gender. Journal of Adolescence, 18(2): 217-228. Heckman, James, Jora Stixrud, and Sergio Urzua. 2006. The effects of cognitive and
noncognitive abilities on labor market outcomes and social behavior. Journal of Labor Economics, 24(3): 411-482.
Judge, Timothy A., Amir Erez, Joyce E. Bono, and Carl J. Thoresen. 2002. Are measures of self-
esteem, neuroticism, locus of control, and generalized self-efficacy indicators of a common core construct? Journal of Personality and Social Psychology, 83(3): 693-710.
Kanfer, Ruth, Connie R. Wanberg, and Tracy M. Kantrowitz. 2001. Job search and employment:
A personality-motivational analysis and meta-analytic review. Journal of Applied
Psychology, 86(5): 837-855. Kuhn, Peter and Catherine Weinberger. 2005. Leadership skills and wages. Journal of Labor
Economics, 23(3): 395-436.
Lam, Desmond and Dick Mizerski. 2007. The effects of locus of control on word‐of‐mouth communication. Journal of Marketing Communications, 11(3): 215-228.
Lundberg, Shelly. 2013. The college type: Personality and educational inequality. IZA
Discussion Paper No. 7305. McGee, Andrew and Peter McGee. 2011. Search, effort, and locus of control. IZA Discussion
Paper No. 5948. Morgan, Peter B. 1985. Distributions of the duration and value of job search with learning.
Econometrica, 53(5): 1199-1232. Mortensen, Dale T. 1976. Unemployment insurance and job search decisions. Industrial and

29
Labor Relations Review, 30: 505-517. Mortensen, Dale T. 1986. Job search and labor market analysis. In O.C. Ashenfelter and R.
Layard (eds.), Handbook of Labor Economics, Vol. II. North Holland, Amsterdam, pp. 849-919.
Phares, E. Jerry. 1976. Locus of Control in Personality. Morristown, New Jersey: General
Learning Press. Piatek, Remi and Pia Pinger. 2010. Maintaining (locus of) control? Assessing the impact of locus
of control on education decisions and wages. IZA Discussion Paper No. 5289. Plumly, L. Wayne and John E. Oliver. 1987. The locus of control attribute and the job search
process. Psychological Reports, 61(3): 907-910. Osborne-Groves, Melissa. 2005. How important is your personality? Labor market returns to
personality for women in the US and UK. Journal of Economic Psychology, 26(6): 827-841. Rotter, Julian B. 1966. Generalized expectancies for internal versus external control of
reinforcement. Psychological Monographs, 80(1). Saks, Alan M. and Blake E. Ashforth. 1999. Effects of individual differences and job search
behaviors on the unemployment status of recent university graduates. Journal of Vocational Behavior, 54(2): 335-349.
Segal, Carmit. 2008. Motivation, test scores, and economic Success. Universitat Pompeu Fabra
Department of Business and Economics working paper 1124. Sherman, Lawrence. 1984. Development of children’s perception of internal locus of control: A
cross-sectional and longitudinal analysis. Journal of Personality, 52(4): 338–54. Smith, Jeffrey. 1998. Can public job training reduce youth unemployment? Policy Options,
19(3): 26-29. Spector, Paul E. 1982. Behavior in organizations as a function of employee’s locus of control.
Psychological Bulletin, 91(3): 482-497. Spinnewijn, Johannes. 2009. Unemployed but optimistic: optimal insurance design with biased
beliefs. Working paper. Srinivasan, Narasimhan and Surinder Tikoo. 1992. Effect of locus of control on information
search behavior. Advances in Consumer Research, 19(1): 498-504.
30
Table 1: Summary Statistics
Reservation wage sample Variable Mean Standard deviation
Reservation wage (in 1979 dollars) 3.11 1.28 Residual locus of control score -0.13 1.02 Residual AFQT score -0.33 0.94 Highest grade completed 11.49 1.76 Work experience (weeks) 54.37 64.78 1 if black 0.41 1 if Hispanic 0.16 1 if male 0.53 Mother’s highest grade completed 9.40 4.61 1 if married 0.14 Family size 4.26 2.33 1 if lives in South 0.38 1 if lives in Northeast 0.17 1 if lives in West 0.18 1 if urban residence 0.59 County unemployment rate (percent) 9.39 3.58 Weeks unemployed at interview date 12.27 14.53 Total weeks of prior unemployment experience 36.71 41.77 Unemployment insurance (UI) compensation ($ per week) 13.93 108.12 1 if previous job in union 0.11 Residual coding test score -0.14 0.97 Attitude at interview -0.13 1.01 Residual self-esteem score -0.12 1.01 Number of observations 5,615 Number of individuals 3,291 1981 search hours sample Variable Mean Standard deviation
Hours per week spent searching 6.44 9.17 Direct search hours 1.64 3.79 Non-direct search hours 4.81 7.47 Percentage receiving offers 0.24 Number of individuals 386 Unemployment duration sample Variable Mean Standard deviation
Unemployment duration (in weeks) 30.77 39.07 Number of individuals 3,215 Reemployment wage sample Variable Mean Standard deviation
Reemployment wage (in 1979 dollars) 3.37 1.71 Number of observations 4,646 Number of individuals 3,157
31
Table 2: OLS estimates for log reservation wage and search hours models
(1) (2) (3) (4) (5) (6) Variable Dependent variable: Log reservation wages
Locus of control score 0.024*** 0.011*** 0.010** 0.010* 0.016*** 0.013*** (0.004) (0.004) (0.004) (0.005) (0.005) (0.004) R2 0.008 0.146 0.106 0.161 0.148 0.148 Number of observations 5,615 5,615 5,615 2,894 3,046 3,291 Variable Dependent variable: Total search hours in the previous week
Locus of control score 0.351 0.418 0.497 -0.100 -0.162 (0.466) (0.486) (0.488) (0.944) (0.602) R2 0.001 0.087 0.047 0.141 0.139 Number of observations 386 386 386 128 215 Controls: Demographics No Yes Yes Yes Yes Yes Family characteristics No Yes No Yes Yes Yes Human capital measures No Yes No Yes Yes Yes AFQT, self-esteem, and attitude at interview
No Yes Yes Yes Yes Yes
Residence characteristics No Yes Yes Yes Yes Yes Work history No Yes No Yes Yes Yes Standard errors in parentheses are robust to the non-independence of observations at the respondent level. Demographic controls include male, black, and Hispanic indicators and the mother’s highest grade completed. Family characteristics include an indicator for married and the number of members of the respondent’s family. The human capital measures include highest grade completed and weeks of work experience. Regional controls include dummies for region of residence (South, Northeast, and West), an indicator for whether the respondent’s residence is urban or rural, and the local unemployment rate. The work history controls include weeks ever spent unemployed, weeks spent unemployed when interviewed, weekly unemployment insurance receipts, and prior membership in a union. Columns 4, 5 and 6 report estimates from specification identical to that in column 2 when the sample is restricted to individuals who had never been unemployed when interviewed in 1979 (column 4), respondents who had been unemployed for six weeks or less when interviewed (column 5), and the first observation from each respondent (column 6). *** — significant at 1% ** — significant at 5% * — significant at 10%
32
Table 3: Estimates for the proportional hazard model of the probability of exiting unemployment
Variable (1) (2) (3)
Locus of control 1.023 1.023 1.065 (0.331) (0.344) (0.082) Locus of control2 0.999 0.991 (0.949) (0.589) Locus of control3 0.986 (0.142) Number of observations 3,291 3,291 3,291 Log-likelihood -7,826.09 -7,826.08 -7,825.00 (a) Probability of exiting unemployment between 12 and 16 weeks for an individual
with average locus of control (� = 0)
0.265 (0.022)
0.266 (0.022)
0.267 (0.022)
(b) Probability of exiting unemployment between 12 and 16 weeks for an individual with locus of control one standard deviation
higher than average (� = 1)
0.271 (0.022)
0.271 (0.023)
0.277 (0.023)
(b)-(a) [p-value of test of (b)=(a)]
0.005 [0.335]
0.005 [0.492]
0.009 [0.240]
Controls: Demographics Yes Yes Yes Family characteristics Yes Yes Yes Human capital measures Yes Yes Yes AFQT, self-esteem, and attitude at interview Yes Yes Yes Residence characteristics Yes Yes Yes Work history Yes Yes Yes The table reports exponentiated coefficient estimates (hazard ratios). P-values of the test of the equality of the coefficient estimate with zero are reported in parentheses. Demographic controls include male, black, and Hispanic indicators and the mother’s highest grade completed. Family characteristics include an indicator for married and the number of members of the respondent’s family. The human capital measures include highest grade completed and weeks of work experience. Regional controls include dummies for region of residence (South, Northeast, and West), an indicator for whether the respondent’s residence is urban or rural, and the local unemployment rate. The work history controls include prior membership in a union. The predicted probabilities are evaluated at sample means and modes for the remaining regressors. *** — significant at 1% ** — significant at 5% * — significant at 10%
33
Table 4: OLS estimates for log reemployment wage model
Variable (1) (2)
Locus of control 0.020*** 0.003 (0.006) (0.006) R2 0.003 0.100 Number of observations 4,646 4,646 Controls: Demographics No Yes Family characteristics No Yes Human capital measures No Yes AFQT, self-esteem, and attitude at interview No Yes Residence characteristics No Yes Work history No Yes Completed duration of unemployment spell No Yes
Standard errors in parentheses are robust to the non-independence of observations at the respondent level. Demographic controls include male, black, and Hispanic indicators and the mother’s highest grade completed. Family characteristics include an indicator for married and the number of members of the respondent’s family. The human capital measures include highest grade completed and weeks of work experience. Regional controls include dummies for region of residence (South, Northeast, and West), an indicator for whether the respondent’s residence is urban or rural, and the local unemployment rate. The work history controls include weeks ever spent unemployed, weeks spent unemployed when interviewed, weekly unemployment insurance receipts, and prior membership in a union. *** — significant at 1% ** — significant at 5% * — significant at 10%

34
Table 5: Additional specifications of the log-reservation wage and search hour models
(1) (2) (3) (4) Variable Dependent variable: Log-reservation wage
Locus of control 0.011*** 0.010*** (0.004) (0.004) R2 0.157 0.159 Number of observations 5,615 5,615 Variable
Dependent variable in columns 1-2: Total search hours in the previous week Dependent variable in column 3: Hours spent directly contacting employers Dependent variable in column 4: Hours spent using all other search methods
Locus of control 0.426 0.451 -0.064 0.482 (0.519) (0.508) (0.200) (0.400) R2 0.105 0.102 0.091 0.071 Number of observations 386 386 386 386 Controls: Demographics Yes Yes Yes Yes Family characteristics Yes Yes Yes Yes Human capital measures Yes Yes Yes Yes AFQT, self-esteem, and attitude at interview
Yes Yes Yes Yes
Residence characteristics Yes Yes Yes Yes Work history Yes Yes Yes Yes Industry when re-employed Yes No No No Occupation when re-employed No Yes No No
Standard errors in parentheses are robust to the non-independence of observations at the respondent level. Demographic controls include male, black, and Hispanic indicators and the mother’s highest grade completed. Family characteristics include an indicator for married and the number of members of the respondent’s family. The human capital measures include highest grade completed and weeks of work experience. Regional controls include dummies for region of residence (South, Northeast, and West), an indicator for whether the respondent’s residence is urban or rural, and the local unemployment rate. The work history controls include weeks ever spent unemployed, weeks spent unemployed when interviewed, weekly unemployment insurance receipts, and prior membership in a union. *** — significant at 1% ** — significant at 5% * — significant at 10%

35
Table 6: Estimates from linear probability models of the probability of receiving a job offer
Variable (1) (2) (3) (4)
Search hours 0.008*** 0.008*** (0.002) (0.002) Direct search hours 0.011* 0.010 (0.006) (0.006) Non-direct search hours 0.007** 0.008** (0.003) (0.003) Locus of control score 0.029 0.028 (0.026) (0.026) Locus of control score* Search hours -0.004 (0.002) Locus of control score* Direct search hours -0.003 (0.006) Locus of control score* Non-direct search hours -0.004 (0.003) R2 0.028 0.029 0.034 0.034 Number of observations 386 386 386 386 Controls: Demographics No No No No Family characteristics No No No No Human capital measures No No No No AFQT, self-esteem, and attitude at interview No No No No Residence characteristics No No No No Work history No No No No
*** — significant at 1% ** — significant at 5% * — significant at 10%
36
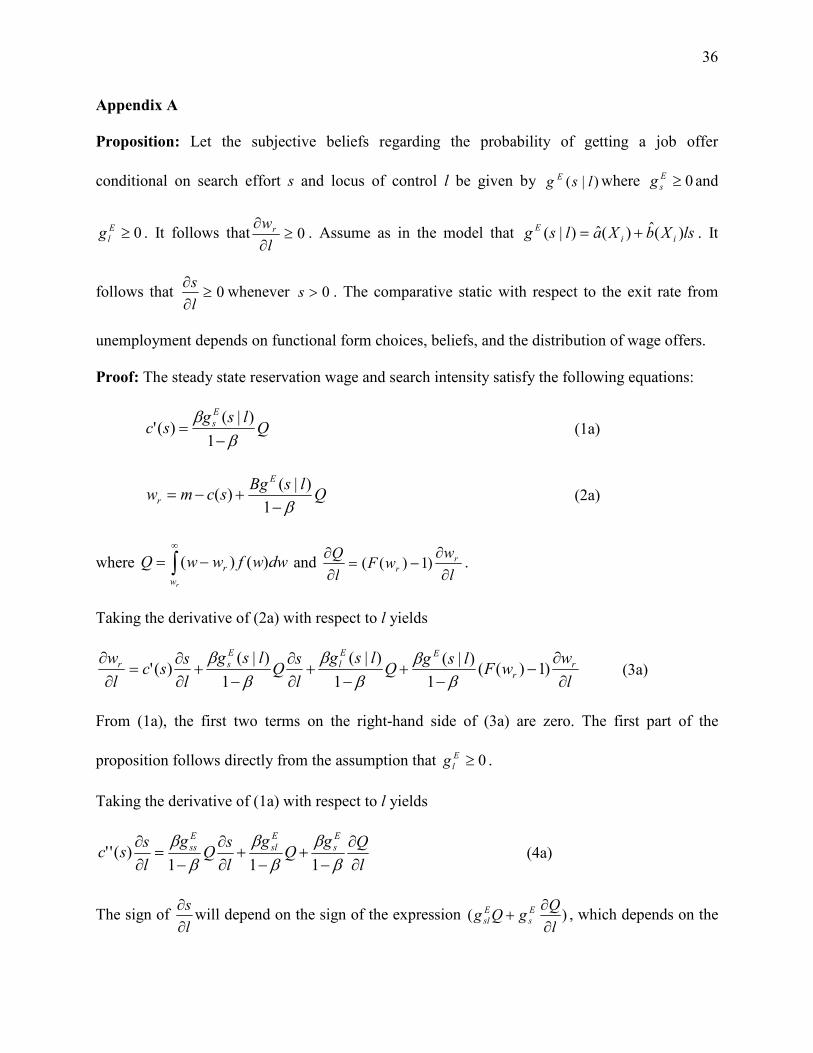
Appendix A
Proposition: Let the subjective beliefs regarding the probability of getting a job offer
conditional on search effort s and locus of control l be given by )|( lsg E where 0≥E
sg and
0≥E
lg . It follows that 0≥∂
∂
l
wr . Assume as in the model that lsXbXalsg ii
E )(ˆ)(ˆ)|( += . It
follows that 0≥∂
∂
l
swhenever 0>s . The comparative static with respect to the exit rate from
unemployment depends on functional form choices, beliefs, and the distribution of wage offers.
Proof: The steady state reservation wage and search intensity satisfy the following equations:
Qlsg
scE
s
ββ
−=
1
)|()(' (1a)
QlsBg
scmwE
r β−+−=
1
)|()( (2a)
where ∫∞
−=rw
r dwwfwwQ )()( and l
wwF
l
Q rr ∂
∂−=
∂
∂)1)(( .
Taking the derivative of (2a) with respect to l yields
l
wwF
lsgQ
lsg
l
sQ
lsg
l
ssc
l
w rr
EE
l
E
sr
∂
∂−
−+
−+
∂
∂
−+
∂
∂=
∂
∂)1)((
1
)|(
1
)|(
1
)|()('
ββ
ββ
ββ
(3a)
From (1a), the first two terms on the right-hand side of (3a) are zero. The first part of the
proposition follows directly from the assumption that 0≥E
lg .
Taking the derivative of (1a) with respect to l yields
l
QgQ
g
l
sQ
g
l
ssc
E
s
E
sl
E
ss
∂
∂
−+
−+
∂
∂
−=
∂
∂
ββ
ββ
ββ
111)('' (4a)
The sign of l
s
∂
∂will depend on the sign of the expression )(
l
QgQg E
s
E
sl ∂
∂+ , which depends on the

37
functional form of Eg . Letting lsXbXalsg ii
E )(ˆ)(ˆ)|( += and taking the derivative of (1a) with
respect to lyields
l
QlXbQ
Xb
l
ssc ii
∂
∂
−+
−=
∂
∂
ββ
ββ
1
)(ˆ
1
)(ˆ)('' (5a)
Given the functional form of Eg ,
QsXb
l
wwF
lsXbXa
l
w irr
iir
ββ
ββ
−+
∂
∂−
−
+=
∂
∂
1
)(ˆ)1)((
1
))(ˆ)(ˆ(
which implies that
01
)(ˆ)1)((
1
)(ˆ))(1(
1
)(ˆ≥
−+
∂
∂−
−=
∂
∂−
−+
∂
∂Q
sXb
l
wwF
lsXb
l
wwF
Xa
l
w irr
irr
ir
ββ
ββ
ββ
We can make a substitution on the right-hand side of (5a) giving us
0
))(1(1
)(ˆ
)('' ≥∂
∂−
−+
∂
∂
=∂
∂
s
l
wwF
Xa
l
w
l
ssc
rr
ir
ββ
whenever 0>s . Because by assumption 0)('' >sc , it follows that 0>∂
∂
l
s.
The last part of the proposition follows directly from the definition of the per period exit rate
from unemployment given by
)Pr()|1Pr(),( **
rr wwsOfferwsh ≥== (6a)
Taking the derivative of (6a) with respect to l yields
l
w
w
wsh
l
s
s
wsh
l
wsh r
r
rrr
∂
∂
∂
∂+
∂
∂
∂
∂=
∂
∂ ),(),(),( **
*
**
Given that 0),(
*
*
>∂
∂
s
wsh r and 0),( *
<∂
∂
r
r
w
wsh, the sign of
l
wsh r
∂
∂ ),( *
will depend on the
functional form choices, beliefs, and the distribution of wage offers. □

38
APPENDIX B
Abbreviated 4-item Rotter Internal-External Locus of Control Scale
A. What happens to me is my own doing. B. Sometimes I feel that I don’t have enough control over the direction my life is taking. A. When I make plans, I am almost certain that I can make them work. B. It is not always wise to plan too far ahead because many things turn out to be a matter of good or bad fortune. A. In my case getting what I want has little or nothing to do with luck. B. Many times we might just as well decide what to do by flipping a coin. A. Many times I feel that I have little influence over the things that happen to me. B. It is impossible for me to believe that chance or luck plays an important role in my life.
39
Appendix C: Supplementary coefficient estimates
Dependent Variable Variable
Reservation wage
Search hours
Exit rate from unemployment
Reemployment wage
AFQT score 0.004 -0.878 1.249 0.014◊ (0.006) (0.736) [0.000] (0.009) Highest grade completed 0.020*** 0.181 1.036 0.027*** (0.003) (0.384) [0.042] (0.005) Work experience (weeks) 0.0007*** -0.002 1.002 0.0006*** (0.00008) (0.015) [0.000] (0.0001) 1 if black 0.010 2.152* 0.578 -0.016 (0.011) (1.286) [0.000] (0.016) 1 if Hispanic -0.018 ◊ 3.164** 1.027 -0.002 (0.013) (1.512) [0.718] (0.018) Mother’s highest grade completed 0.000 -0.047 1.018 -0.001 (0.001) (0.119) [0.003] (0.001) 1 if male 0.095*** 1.831* 1.016 0.121*** (0.009) (1.044) [0.752] (0.012) 1 if married 0.012 3.095* 0.949 0.026◊ (0.010) (1.641) [0.469] (0.017) Family size 0.003◊ -0.366* 1.013 -0.004◊ (0.002) (0.202) [0.236] (0.002) 1 if urban 0.007* 1.093 1.043 -0.000 (0.004) (1.287) [0.081] (0.006) County unemployment rate (%) -0.010*** -0.222 0.944 -0.010*** (0.001) (0.201) [0.000] (0.002) Weeks unemployed at interview date 0.0002 -0.021 -0.0007◊ (0.0003) (0.040) (0.0004) Weeks ever spent unemployed -0.0008*** 0.060** -0.0001 (0.0001) (0.026) (0.0002) UI compensation ($/week) 0.0001** 5.050◊ 0.0001 (0.0001) (3.162) (0.0001) 1 if previous job in union 0.036*** 1.851 0.961 0.038** (0.013) (1.414) [0.583] (0.017) Coding test score -0.001 0.822 1.099 0.010 (0.005) (0.636) [0.002] (0.008) Attitude at interview -0.007 ◊ 0.476 1.101 -0.017*** (0.004) (0.485) [0.000] (0.006) Self-esteem score 0.011*** -0.455 0.988 0.021*** (0.004) (0.495) [0.627] (0.006)
Column 3 reports hazard ratios (exponentiated coefficients). Robust standard errors are reported in parentheses except for column 3, which reports p-values of the test of equality of the coefficient with zero in brackets. From left to right, the columns report the estimates for the specifications in column 2 of table 2 (top panel), column 2 of table 2 (bottom panel), column 1 of table 3, and column 3 of table 4. All regressions also included indicators for region of residence. *** — significant at 1% ** — significant at 5% * — significant at 10% ◊ — significant at 15%