Embed Size (px)
Citation preview

How the Fed Sets the Federal Funds Rate Target
by
Dale Bremmer Professor of Economics
HSS Department Rose-Hulman Institute of Technology
and
Randy Kesselring
Professor of Economics Department of Economics and Finance
Arkansas State University
April 2005
Presented During the Topics In Macroeconomics Session 47th Annual Conference of the Western Social Science Association
Albuquerque, New Mexico Friday, April 15, 2005

Page 1
How the Fed Sets the Federal Funds Rate Target I. Introduction
One of the rare moments of high drama in economics is when the Federal Reserve or the Fed
announces its decision about a change in the federal funds rate. Headlines in the New York Times have
cautioned “Wall Street May See Volatile Week.”1 The recent search for a neutral federal funds rate that
is neither expansionary nor contractionary has prompted headlines like “Neutral Isn’t Easy to Define.”2
Uncertainty over the actions of the Federal Open Market Committee (FOMC) has prompted analysts to
publish advice columns entitled “Interest Rate Turbulence: What’s a Bond Investor to Do?”3 Finally,
the Federal Reserve’s decision carries an announcement effect that may signal the Fed’s intentions
whether future monetary policy will be tight or easy. However, as headlines like “Fed’s Restrained Pace
on Rates Inspires Only a Limp Rally” attest, the Fed’s actions seldom please everyone.4
This paper reports the results of a statistical model that describes how the Fed changes its target
for the federal funds rate. Past research of Fed behavior has used the Taylor rule which models the
actual federal funds rate as a function of inflation, unemployment, and the gap between potential and
actual GDP.5 Rather than explaining the actual federal funds rate, this paper estimates several
regression models that explain changes in the target that the Fed sets for the federal funds rate.
The data sample consists of 254 decisions made by the FOMC between July 27, 1983 and
February 2, 2005. In 142 of these meetings, the FOMC decided to change its target for the federal funds
rate. This sample coincides with the time when the Fed returned to targeting the federal funds rate after
it had experimented with targeting nonborrowed reserves between October 1979 and October 1982.
During this time period, there was a change in the chairman of the Board of Governors and the FOMC.
1 New York Times, March 28, 2005. 2 New York Times, March 20, 2005. 3 New York Times, Mach 6, 2005. 4 New York Times, February 3, 2005. 5 See Taylor (1993).

Page 2
Paul Volker was chairman of the Board of Governors and the FOMC until August 11, 1987. After that
date, Alan Greenspan began his term as chairman of the Board of Governors and the FOMC.
Regression results show that the Fed changes its target for the federal funds rate in response to
changes in unemployment and inflation. The paper presents statistical evidence that the change in the
Fed’s target for the federal funds rate is inversely related to changes in the unemployment rate since the
last FOMC meeting. There is also considerable statistical evidence that the Fed’s federal funds target is
directly related to measures that signal future inflation such as changes in the yield on long-term
government bonds, changes in the real oil price, and changes in consumer confidence.
There is evidence of policy persistence and rigidity in setting targets as positive changes in the
target are more likely to follow past positive changes and reductions in the targeted rate are more likely
to follow a previous reduction. The change in the federal funds target is directly related to the gap
between the current federal funds rate and the target set at the previous FOMC meeting. For example, if
the current federal funds rate is significantly greater than the targeted level, it is more likely the FOMC
will increase the target. However, other variables of interest, such as the percentage change in the Dow
Jones Industrial index, the actual change in the inflation rate, and the change in the gap between actual
and long-run disposable income have no statistically significant effect on changes in the targeted level of
the federal funds rate.
Following this introduction, the second section of this paper reviews the literature regarding Fed
behavior and setting a target for the federal funds rate. The third section of the paper describes how the
targeted level of the federal funds rate has changed over the last twenty years. Data and model
specifications are described in the fourth section of the paper, while the fifth section of the paper
presents the estimation results. The final section of the paper contains a brief summary of the results
and some concluding thoughts.

Page 3
II. Literature Review
Rudebusch (1995) proposes a model that attempts to reconcile term structure evidence with the
Fed’s targeting behavior. His results indicate that the Fed’s targeting behavior can be described by four
important characteristics. First, deviations of the spot federal funds rate from the target rate do occur but
tend to disappear within one day. Second, targets tend to be adjusted slowly and are seldom reversed.
So, for example, if a target increase has occurred there is a greater probability that an additional increase
will follow. Third, the Fed tends to set the target at a level that it expects to maintain, and fourth, the
target is set in accordance with the long-run economic objectives of the Fed. These long-run objectives
can be many and varied. As the goal of this investigation was primarily aimed at reconciling the
information available from the term structure with the Fed’s targeting behavior, Rudebusch opted not to
model long-run economic objectives, choosing instead to simulate an entire term structure from his
observations of and resulting assumptions about the Fed’s targeting behavior. The periods examined
were September 1974 to September 1979 and March 1984 to September 1992.
Michael Dueker (1999) used an ordered probit technique based on a Taylor-rule model with a
partial adjustment mechanism to predict target changes in the Fed funds rate. His model which used
monthly observations for the period between January 1985 and December 1998 was compared to a
similar, linear model. Both models produced results indicating the importance of the output gap in
predicting target changes and both also showed evidence that the target is changed in a way that Taylor
defines as inflation fighting (i.e. the long-run response of the target rate to a one unit change in inflation
is greater than 1). However, the estimated coefficient for inflation in the ordered probit model was
significant while it was insignificant in the linear model.
In a working paper, Hamilton and Jorda (2000) use a variation on the ACD (autoregressive
conditional duration) model to predict the timing of a change in the federal funds rate target. Difficulties
with estimation created the necessity of splitting the estimation into two distinct time periods. First, for
the period between March 1, 1984 and November 23, 1989, the only variables found to significantly

Page 4
affect the probability of a change in the Fed funds target (other than simple lagged durations) were the
occurrence of an FOMC meeting in the prior week and the lagged value of the effective Federal funds
rate. For the period between November 30, 1989 and June 5, 1997 the significant variables were the
occurrence of an FOMC meeting during the week in question and the absolute value of the spread
between the effective Federal Funds rate and the six month Treasury bill rate. For the ordered probit,
all changes in the target were collapsed into five categories—two positive, two negative and zero.
Interestingly, they found that most of the variables that affected the timing of a change had no
significant effect on the size of the change. Instead, the two variables that had the most influence on the
size of the change were: (1) a previous change in the target (i.e. if the target had been previously
increased, the likelihood of a current increase is greatly elevated), and (2) the lagged spread between the
Fed funds rate and the six month Treasury bill rate. For the most part, variables representing long-run
economic objectives were of little statistical value in the various specifications.
Khoury (1990) attempted to make sense of a large number of studies purporting to clarify the
Fed’s reaction to changes in various measures of economic conditions. What separates Khoury’s effort
from those previously described is his willingness to test a large number of variables often used to
describe macroeconomic conditions and his singular emphasis on macroeconomic indicators. The
articles described above tend to emphasize the importance of the timing of decisions and the Fed’s
desire to smooth out changes in the target by stepping through small increments (sometimes referred to
as “inertial” behavior). Khoury used a technique by Leamer (1978) called “specification search” to
determine the robustness of various macroeconomic indicators. After application of the technique, only
one variable, GDP, was found to be a robust indicator of Fed behavior. It should, however, be
mentioned that of 42 reaction function studies examined by Khoury, only one used the federal funds
target rate as a dependent variable.
Thornton (2000) investigates quite a different question regarding the federal funds rate target.
The primary purpose of his research was to determine whether the market responds to actual changes in
Page 5
the federal funds target rate or if it is simply the market’s belief that the target has changed that
generates observed changes in market interest rates. His conclusions in this regard are not encouraging.
He finds that market rates are not determined by open market operations and, hence, not determined by
the setting of the federal funds rate target. In addition he finds that they are not determined by
announcement effects (he refers to this as open mouth operations). His conclusion is that some target
changes are endogenous and some are exogenous making analysis of the relationship between the target
rate and the federal funds rate quite complex and, consequently, difficult to untangle.
III. Meetings of the FOMC and Changes in the Target Federal Funds Rate: 1983–2005
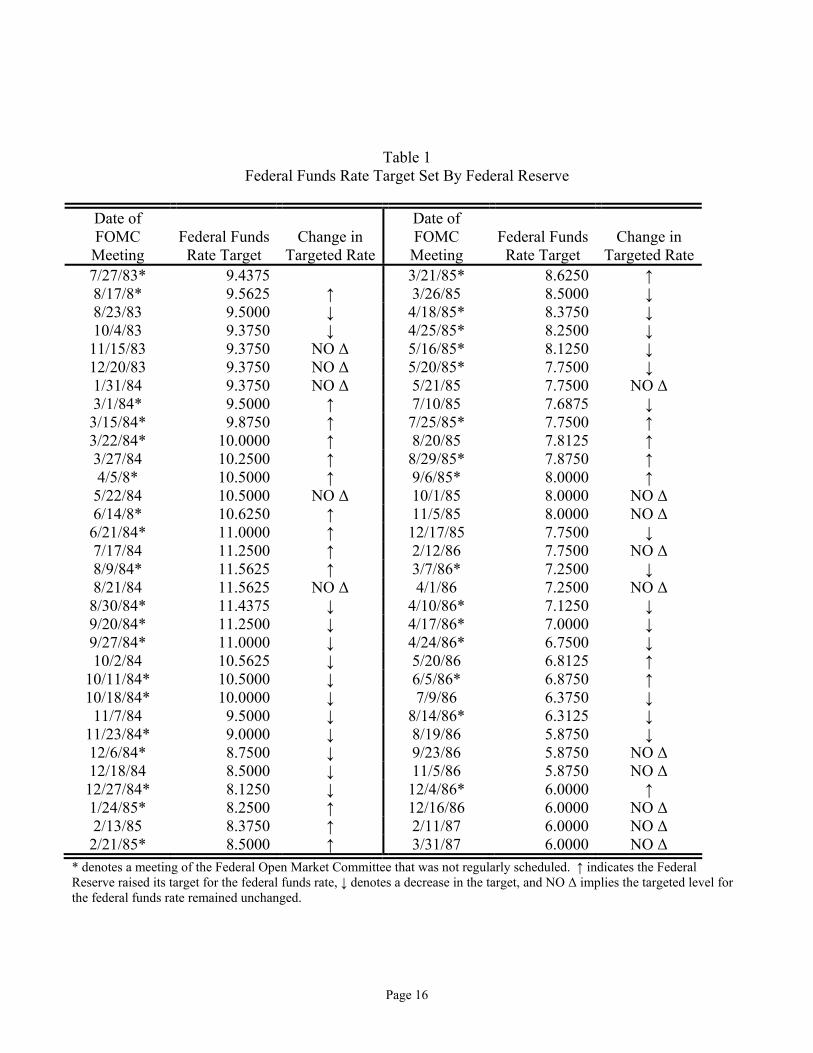
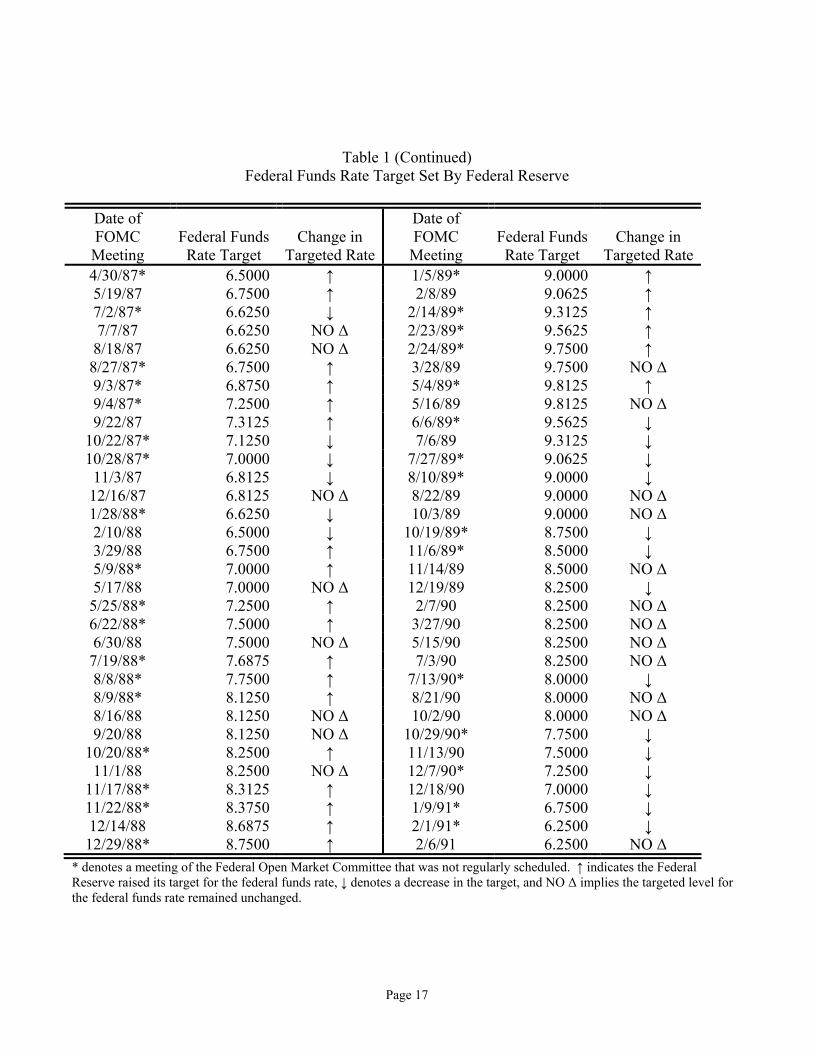
Table 1 lists the dates of the 254 FOMC meetings between July 1983 and February 2005. Also
listed in Table 1 is the target that the FOMC set for the federal funds rate during its meeting and whether
this target level has increased, decreased, or remained unchanged from the previous FOMC meeting.6
The largest federal funds rate target was the one of 11.5625 percent set on August 9, 1984. The smallest
target that the FOMC set for the federal funds rate was the 1 percent level that was in place between
June 25, 2003 and June 30, 2004. During this time period, the actual federal funds rate was the lowest it
had been in over forty years.
Most of these meetings occurred on regularly scheduled dates specified in advance.7 Federal law
requires the FOMC to meet in Washington D.C. at least four times a year and since the 1980s, the
FOMC has usually had eight regularly scheduled meetings a year. Pressing economic problems has
sometimes prompted the FOMC to hold an unscheduled meeting either in person or over the phone.
Table 1 denotes these unscheduled meetings with an asterisk by the date of the meeting.
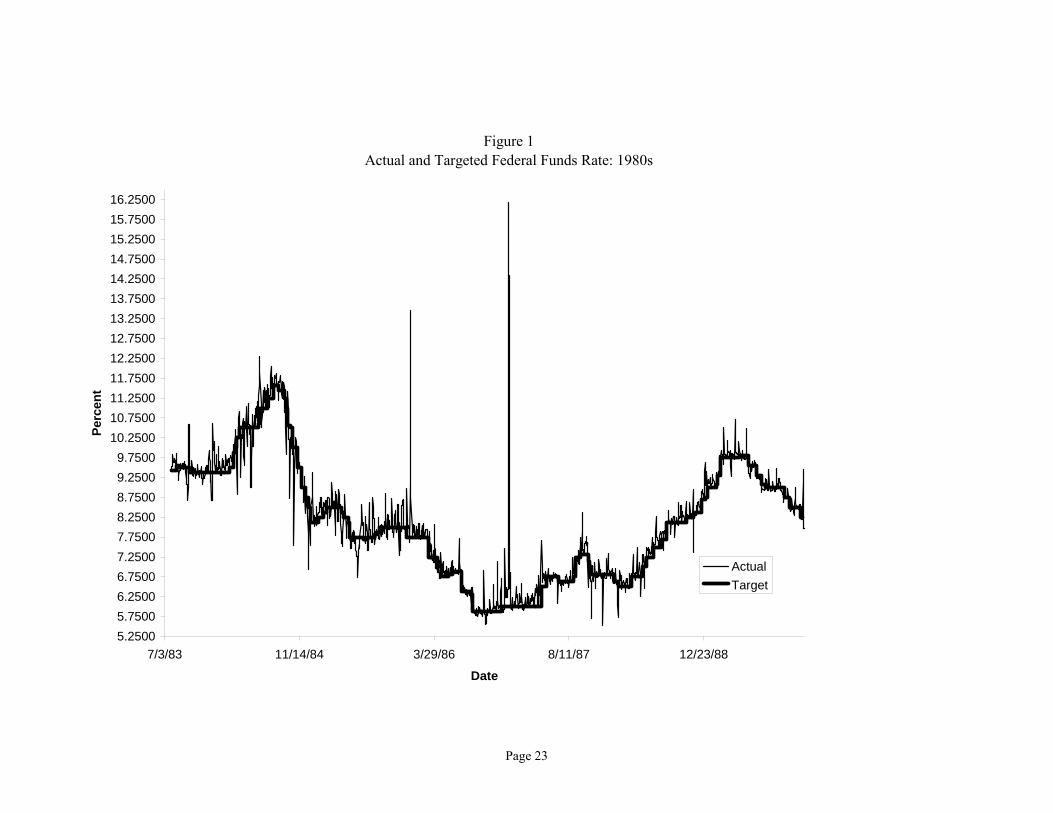
Charts showing the daily effective federal funds rate and the targeted level of the federal funds
rate are found in Figures 1 - 3. Figure 1 shows the actual daily federal funds rate and its targeted level
6 The dates of the meetings and the level of the federal funds rate target come from Rudebusch (1995), Thornton (2000), Hamilton (2000), and the Federal reserve’s webpage, http://www.federalreserve.gov/fomc/fundsrate.htm. 7 See http://www.minneapolisfed.org/info/policy/dates-hist.cfm for the dates of regularly scheduled FOMC meetings between 1970 and now.

Page 6
for the 1980s. Likewise, Figure 2 shows the data for the 1990s, while the data for the last five years are
plotted in Figure 3.
The frequency of meetings and how often the federal funds target is changed depends on the
underlying economic conditions and membership of the FOMC. For example, during 1984 when Paul
Volker was chair, the FOMC met 23 times and it changed its federal funds target in 20 of those
meetings. On the other hand, during 1993 under Alan Greenspan’s chairmanship, the FOMC only met
during its eight regularly scheduled meetings, and it never changed its targeted federal funds rate of 3
percent.
Table 1 clearly shows how the business cycle affects targeting of the federal funds rate. During
the recessionary period of 1991, the FOMC met 18 times and it cut the federal funds target 10 times
from 6.75 percent to 4 percent. The terrorist attacks on 9-11 were bracketed by the recession of 2001.
During that year, the FOMC met 11 times and it cut the federal finds target every time reducing it from
6 percent to 1.75 percent.
III. Model Specification and Data
A simple theoretical model to motivate discussion
Assume the Fed sets the federal funds rate target in an attempt to minimize a loss function. For
simplicity, assume the loss function penalizes diverging from a desired inflation rate (πd) and a desired
unemployment rate (ud). Both πd and ud are set at levels that are conducive to achieving the Federal
Reserve’s often mutually exclusive goals of high employment, economic growth, price stability, stable
financial and foreign exchange market stability and interest rate stability. The loss function, L, is
2 2t T d t T dL = α[u (r , ) - u ] + β[π (r , ) - π ]δγ (1)
where α and β are two positive, exogenous parameters. Referring to equation (1), ut is the actual
unemployment rate and πt is the actual inflation rate, both of which are functions of the Fed’s target for
the federal funds rate, Tr . The actual unemployment rate is also a function of γ , a vector of exogenous

Page 7
variables, and the actual inflation rate is also a function ofδ , another vector of exogenous variables. It is
possible that both γ andδ contain common exogenous variables. The bracketed terms in equation (1) are
both squared to equally punish actual unemployment and inflation rates that are either too high or too
low relative to their desired levels.
The FOMC sets its federal funds rate target ( Tr ) to minimize its loss function. The first order
condition is
t T d t T t T d t TT
dL = 2α[u (r , ) - u ]u (r , ) + 2β[π (r , ) - π ]π (r , ) = 0 .dr
′ ′γ γ δ δ (2)
The FOMC’s optimal target for the federal funds rate is *Tr which minimizes the loss function and is a
function of the model’s exogenous variables or *T d dr = r(α,β,δ,γ,u ,π ) . As the Fed receives information
that that indicates changes in the actual unemployment or inflation rate, it changes its federal funds
target to reduce the deviation from either ud or πd.
Two possible endogenous variables
To find the factors that influence changes in the Federal Reserve’s targeted level of the federal
funds rate, two different dependent variables are used. The first dependent variable, DTARGET,
measures the change in the targeted level of the federal funds rate from the previous FOMC meeting to
the current FOMC meeting. If *Tr is the federal funds target set during the current meeting and *
T, -1r was
the target set during the previous FOMC meeting, then DTARGET = *Tr - *
T, -1r .
However, if the Fed reduced its federal funds target 50 basis points from 6.50 percent to 6.00
percent, it may not have the same effect if the Fed’s 50 basis point reduction was from 1.50 percent to
1.00 percent. It may be easier and more likely for the Fed to reduce its target federal funds rate by 1
percent or 100 basis points if the current federal funds rate was 5.50 percent rather than 1.50 percent.
Since the change in the federal funds rate target may be determined by its current level, another possible

Page 8
dependent variable is the percentage change in the targeted level of the federal funds rate since the
previous FOMC meeting or PDTARGET. Here PDTARGET is defined as
* *T T,-1
*T,-1
r - rPDTARGET = 100 × .
r (3)
Specifying two regression models
The set of explanatory variables that explain changes in the FOMC’s target federal funds rate is
not known with certainty. This paper tests a series of explanatory variables that theoretically affect the
Fed’s target for the federal funds rate. These variables capture changes in the unemployment rate,
changes in the inflation rate, the rigidity of monetary policy, and whether the economy is experiencing
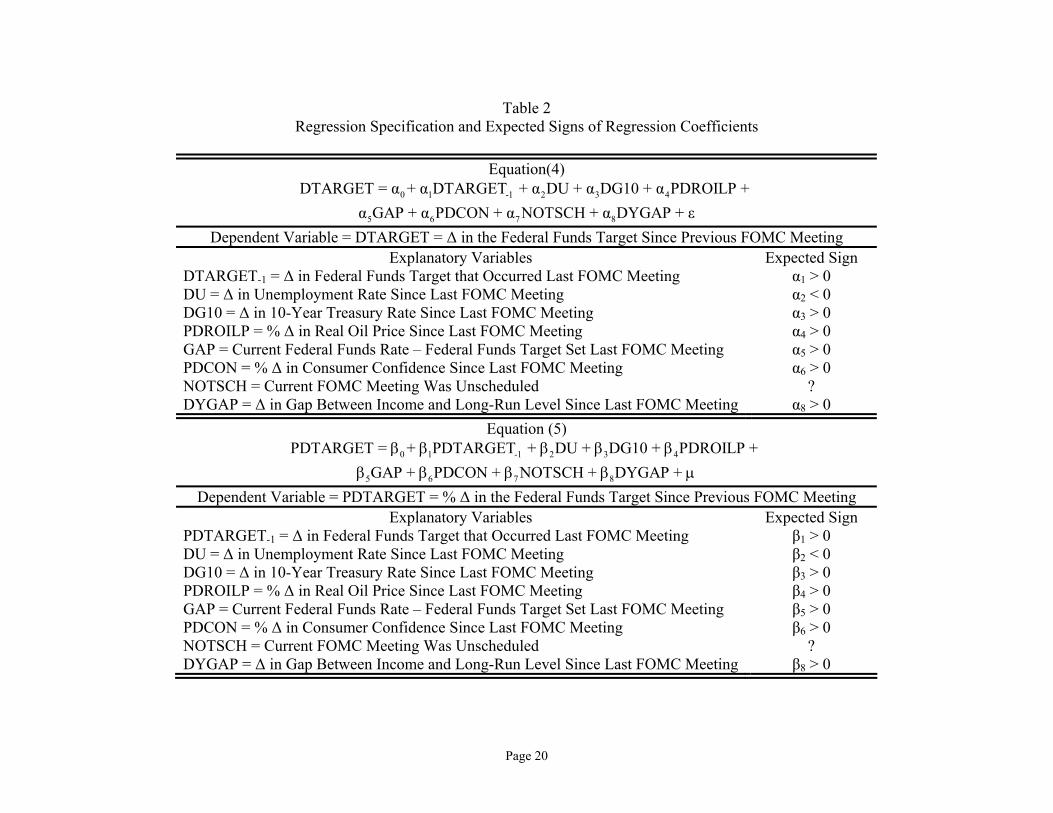
expansion or contraction. Using the first dependent variable introduced above, DTARGET, the first set
of equations estimated have the following general functional form
0 1 -1 2 3 4
5 6 7 8
DTARGET = α + α DTARGET + α DU + α DG10 + α PDROILP + α GAP + α PDCON + α NOTSCH + α DYGAP + ε.
(4)
In the above equation, DTARGET-1 is the change in the targeted level of the federal funds rate that
occurred during the previous meeting of the FOMC.
The second set of equations was estimated using the second dependent variable discussed above,
PDTARGET. These regressions have the same independent variables as equation (4) or
0 1 -1 2 3 4
5 6 7 8
PDTARGET = + PDTARGET + DU + DG10 + PDROILP + GAP + PDCON + NOTSCH + DYGAP + .
β β β β ββ β β β µ
(5)
PDTARGET-1 equals the percentage change in the targeted level of the federal funds rate that was
chosen during the previous FOMC meeting. The independent variables used in equations (4) and (5)
will be defined below and the a priori signs of estimated slope coefficients will be discussed.
The effect of policy persistence and unscheduled FOMC meetings
Both Rudebusch and Hamilton argue the Fed’s behavior exhibits policy persistence and rigidity.
This implies that an increase in the federal funds targeted rate is more likely to follow a previous
Page 9
increase and a decrease in the federal funds target follows a previous decrease in the target. Therefore
DTARGET and DTARGET-1 should be directly related, as are PDTARGET and PDTARGET-1, and
both α1 and β1 are expected to be positive.
Theory can not predict the sign of the regression coefficient associated with NOTSCH, the
binary variable indicating the FOMC meeting wasn’t regularly scheduled. The FOMC is equally likely
to have an emergency meeting to raise interest rates in an attempt to slow the economy down and avoid
inflation or to lower interest rates to stimulate the economy during recessionary periods. Consequently
the signs associated with both α7 and β7 are indeterminate.
The gap between the actual and targeted level of the federal funds rate
One measure that indicates the willingness of the Fed to change its targeted level of the federal
funds rate is how far the current federal funds rate diverges from the targeted federal funds rate adopted
during the previous FOMC meeting. The independent variable GAP equals the actual federal funds rate
on the day prior to the current FOMC meeting minus the targeted level of the federal funds rate set at the
previous meeting.
As GAP increases, this is evidence of further inflationary pressures and a need for the Fed to
further tighten the money supply. Likewise, a falling or negative gap signals the need for easier
monetary policy and the Fed will reduce its federal fund’s target. Consequently the dependent variables
in equations (4) and (5) should be directly related to GAP and both α5 and β5 are expected to be positive.
The effect of changes in unemployment
DU measures the change in the unemployment rate between the current and previous FOMC
meeting.8 Changes in the Fed’s target for the federal funds rate and changes in the unemployment rate
should be inversely related. Significant increase in the unemployment rate suggests the Fed will
stimulate the economy with open market purchases that increases reserves and reduces the federal funds
8 The monthly unemployment date was obtained from FRED at the Federal Reserve Bank of St. Louis webpage at http://research.stlouisfed.org/fred2/.

Page 10
rate. Conversely, as the unemployment rate falls to new lower levels, the resulting tighter labor market
leads to higher wages and an increase in inflation. The Fed will counter this potential increase in
inflation by conducting open market sales that reduce the amount of reserves and increases the federal
funds rate. The predicted inverse relationship between the unemployment rate and the Fed’ target for
the federal funds rate suggests that both α2 and β2 are less than zero.
The effect of changes in inflation
The model specified in equations (4) and (5) include several variables measuring the change in
inflation. The variable DG10 measures the change in the interest rate on the federal government’s 10-
year bond between the current and previous meetings of the FOMC. An increase in DG10 suggests the
bond market predicts inflation in the long run. To counter this future inflation, the Fed will raise its
target for the federal funds rate.
Another measure of potential inflation is the PDROILP, the percentage change in real oil prices
between the current and the previous FOMC meetings. Increases in the real price of oil signals future
inflation, and the Fed will mitigate these inflation pressures by increasing interest rates. One may argue
that higher real oil prices are a negative supply shock which results in a higher price level and a lower
level of real GDP similar to the stagflation experienced in the 1970s. In this case, one would expect the
Fed to counter a contractionary gap by reducing interest rates. However, in the current sample, higher
oil prices are less likely to derail an economic recovery and more likely to result in inflationary
pressures, implying that the Fed will raise interest rates to counter the rising inflation.
Another signal of future inflation may be an increase in consumer confidence. An increase in
consumer confidence leads to increased spending and upward pressure on prices. PDCON measures the
percentage change in the index of consumer confidence since the last FOMC meeting. Again the Fed
will offset the inflationary pressures of increased consumer confidence by increasing interest rates.
The last measure of potential inflation included in equation (3) is DYGAP which measures the
change in the percentage difference between the actual and long-run value of real monthly disposable

Page 11
income.9 This monthly data series should work like the quarterly estimates of the gap between actual
and potential GDP. If actual monthly income exceeds its long-run value, then the Fed will increase
interest rates to reduce inflationary pressures. Conversely, if the actual level of monthly income is
below its long-run level, the Fed will stimulate the economy by conducting open market purchases that
reduces interest rates.
Therefore, the Fed’s response to changes in inflation is captured in the model by including
variables that measure the change in long-term interest rates (DG10), the change in real oil prices
(DROILP), the percentage change in consumer confidence (PDCON), and the change in the percentage
gap between actual and long-run monthly real disposable income (DYGAP). The change in the Fed’s
target for the federal funds rate should be directly related to each of these variables. Consequently, four
of the regression slope parameters in equation (4) - - α3, α4, α6, and α8 - - are all expected to be positive,
as are β3, β5, β6, and β8, the regression slope parameters associated with variables that capturing the
effects of inflation in equation (5).10 Table 2 lists the variables listed in equations (4) and (5) and
summarizes the discussion regarding the a priori signs that are expected for each regression coefficient.
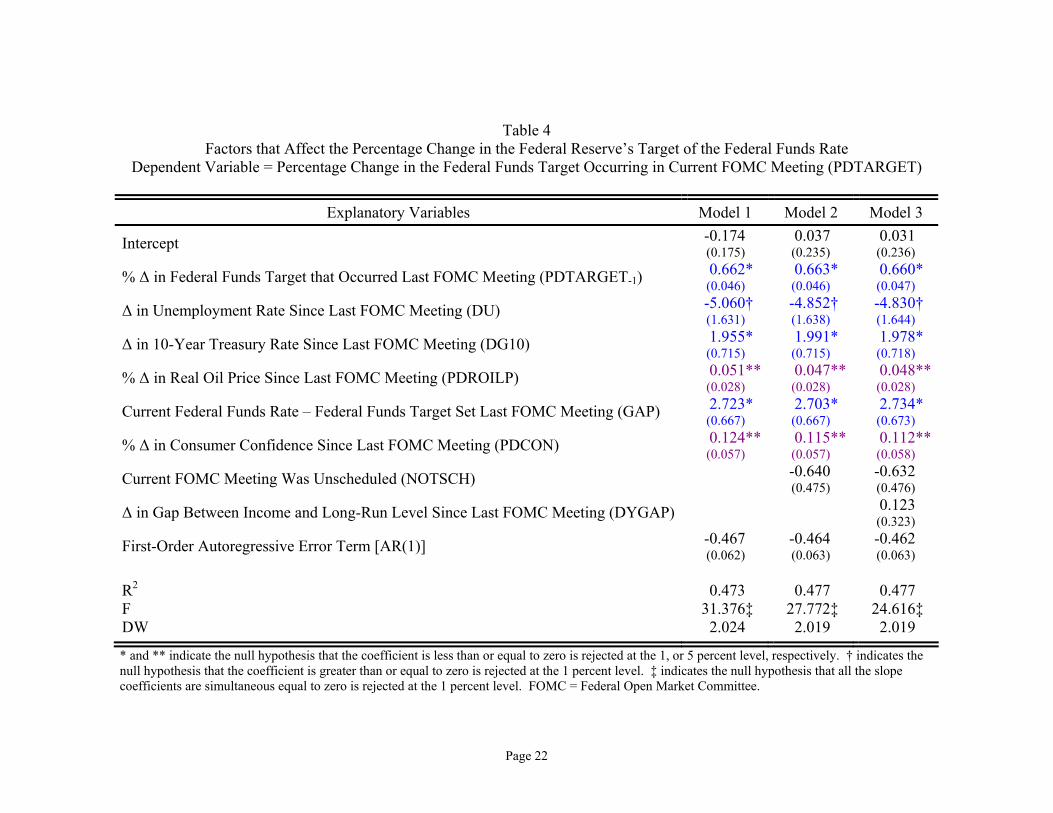
The estimation results for equation (4) are reported in Table 3 while the estimation results for equation
(5) are listed in Table 4.
IV. Estimation Results
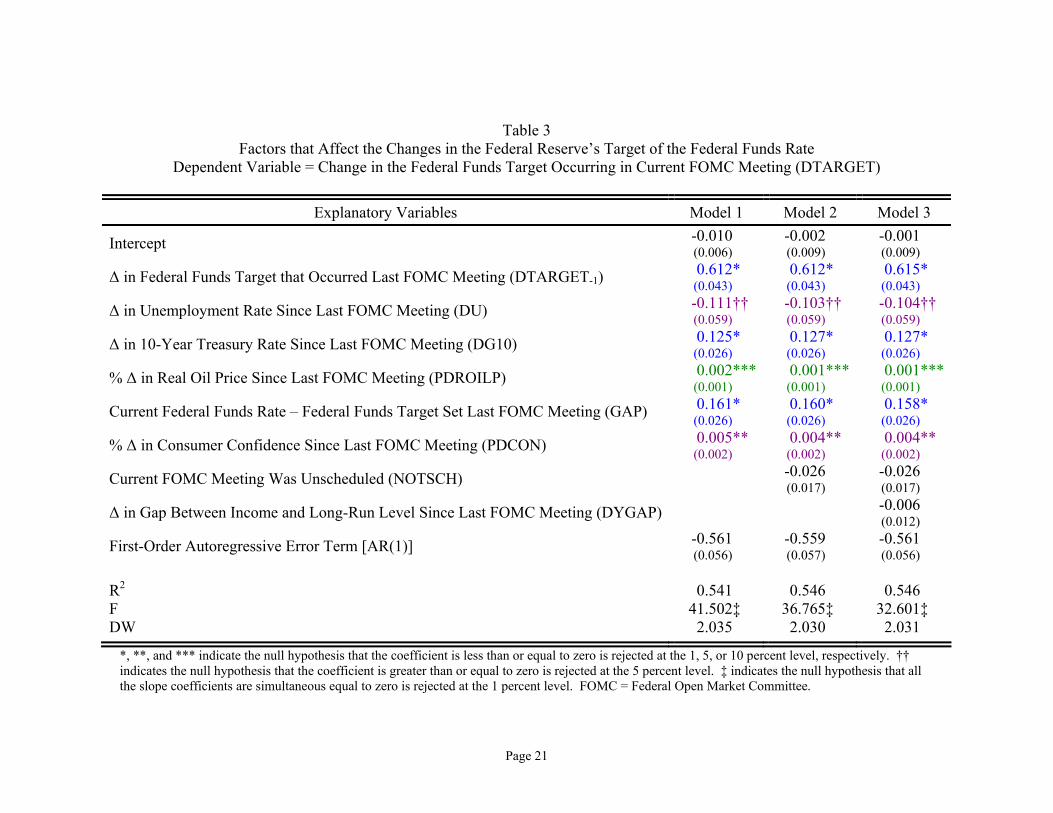
Tables 3 and 4 provide statistical evidence that changes in unemployment and expected inflation
causes the FOMC to alter its target for the federal funds rate. The six regressions reported in Tables 3
and 4 exhibit remarkable explanatory power. R2s range from 0.473 to 0.546 which is high considering
the limited range of the dependent variables and the number of times the dependent variable was equal
9 Estimates of the long-run values of monthly disposable income were found by applying a Hodrick-Prescott (1997) filter to the actual time series of monthly real disposable income. 10 Monthly data for the yield for the federal government’s constant maturity ten-year bond, oil prices, the index of consumer confidence, and real monthly disposable income were once again obtained from the Federal Reserve Bank of St. Louis’ FRED database at http://research.stlouisfed.org/fred2/.
Page 12
to zero. The F-tests that all the slope coefficients are simultaneously equal to zero are always rejected at
the one-percent level. The regressions are corrected for first-order autocorrelation.
Changes in the targeted level of the federal funds rate is directly related to changes in the
following variables: (1) the yield on long-term government bonds, (2) the percentage change in
consumer confidence, and (3) the gap between the current federal funds rater and the previous target.
As reported in Tables 3 and 4, the regression slope coefficients associated with these explanatory
variables are statistically significant at the five-percent level or better. Changes in the target for the
federal funds rate are also directly related to changes in the real price of oil. Using a one-tail test, the
null hypothesis that the slope coefficient for this independent variable is nonpositive is rejected at the ten
percent level or better.
The slope coefficient for changes in the unemployment rate is also negative, as expected. The
null hypothesis that these slope is nonnegative is rejected at the five-percent level for the regressions
reported in Table 3 and at the one-percent level for the regressions reported in Table 4. The current
change in the federal funds target is directly related to the previous change in the targeted level. This
coefficient ranged between -0.612 and -0.615 in Table 3 and the null hypothesis that this variable is
nonnegative is rejected at the five-percent level. The coefficient for the same independent variable
ranges between 0.660 and 0.662 in Table 4. The null hypothesis that these slope estimates are
nonnegative is rejected at the one-percent level.
Referring once again to Tables 3 and 4, when the binary variable indicating a nonscheduled
FOMC meeting is included in the regression, its slope coefficient is not statistically different from zero.
When the difference between actual monthly income and estimates of the long-run level of monthly
income is included in the model specification, the slope coefficient is also not statistically significant.
Other theoretically plausible independent variables were included in the regressions; however,
these variables never had a statistically significant impact. When inflation was calculated using the CPI
for all items and urban consumers, the change in the inflation rate was always statistically insignificant.

Page 13
The percentage change in the Dow Jones Industrials was always statistically insignificant. Between two
FOMC meetings, the daily federal funds rate was regressed on time in a univariate regression model that
estimated an intercept and slope coefficients. When either the estimate of the slope coefficient or its t-
statistic was included in the models estimated in Tables 3 and 4, the resulting slope coefficient wasn’t
statistically different from zero.
V. Concluding Thoughts
The Fed changes its targeted level of the federal funds rate in response to changes in economic
data. During periods of heightened inflationary pressures, the Fed raises its target for the federal funds
rate, signaling tighter monetary policy. Rising unemployment rates and falling real GDP imply the Fed
will respond with an easier monetary policy, signaled by a decrease in its federal funds target. Using
statistical evidence from simple regressions, this paper shows that the targeted level of the federal funds
rate is inversely related to changes in the unemployment rate. There is also statistical evidence that the
Fed will increase its target for the federal funds rate in the face of rising inflation. This is evidenced by
the statistically significant, direct relationship between changes in the targeted level and changes in
long-term interest rates, changes in the real price of oil, and the percentage change in consumer
confidence. If the current federal funds rate significant drifts away from its previously targeted level,
the Fed will adjust its target accordingly. Finally, persistence and rigidity in monetary policy is found as
there is a direct relationship between the current and previous changes in the target.
While this paper answers some initial questions, further work is needed. The determinants of
changes in the federal funds rate need to be estimated using real time data available to decision makers
at the time targets were set. The correct specification and the proper set of independent variables can be
finalized using the sensitivity analysis suggested by Leamer (1978). One needs to determine whether
increases and decreases in the targeted level of the federal funds rate are symmetric. In other words, will
an increase in the unemployment rate from 5 to 6 percent cause the same change in the federal funds
target in absolute value as a fall in the unemployment rate from 5 to 4 percent? Finally, the unique

Page 14
statistical characteristics of changes in the federal funds rate target deserve additional thought. For
example, a different estimation technique, one that corrects for the limited nature of the dependent
variables, might provide better results. Nonetheless, this initial effort reveals that the Fed does follow
rules, and it changes the targeted level of the federal funds rate in a predictable way.

Page 15
References
Dueker, Michael, “Measuring Monetary Policy Inertia in Target Fed Funds Rate Changes,” Review 81 (1999), 3-9.
Hamilton, James D. and Oscar Jorda, “A Model for the Federal Funds Rate Target,” NBER Working
Paper Series, Working Paper 7847, http://www.nber.org/papers/w7847 (August 2000), 1-46. Hodrick, R. J. and E. C. Prescott, “Postwar U.S. Business Cycles: An Empirical Investigation,” Journal
of Money, Credit, and Banking, 29 (1977), 1 – 16. Khoury, Salwa S., “The Federal Reserve Reaction Function: A Specification Search,” in The Political
Economy of American Monetary Policy, Thomas Mayer, ed., Cambridge University Press, 1990, pp. 27-49.
Leamer, Edward, Specification Searches, Ad Hoc Inference with Nonexperimental Data, New York:
Wiley Publishers, 1978. Rudebusch, Glenn D., “Federal Reserve Interest Rate Targeting, Rational Expectations, and the Term
Structure,” Journal of Monetary Economics 35 (1995), 245-274. Rudebusch, Glenn D., “Erratum,” Journal of Monetary Economics 36 (1995), 679. Taylor, John, “Discretion Versus Policy Rules in Practice,” Carnegie-Rochester Conference Series on
Public Policy, 39 (1993), 195-214. Thornton, Daniel L., “The Relationship Between the Federal Funds Rate and the Fed’s Federal Funds
Rate Target: Is it Open Market or Open Mouth Operations?” Working Paper 1999-022B, Federal Reserve Bank of St. Louis (December 2000), 1-51.
Thornton, Daniel L. and David Wheelock, “A History of the Asymmetric Policy Directive,” Federal
Reserve Bank of St. Louis Review, (September/October 2000), 1-16.
Page 16
Table 1 Federal Funds Rate Target Set By Federal Reserve
Date of FOMC
Meeting Federal Funds
Rate Target
Change in
Targeted Rate
Date of FOMC
Meeting Federal Funds
Rate Target
Change in
Targeted Rate 7/27/83* 9.4375 3/21/85* 8.6250 ↑ 8/17/8* 9.5625 ↑ 3/26/85 8.5000 ↓ 8/23/83 9.5000 ↓ 4/18/85* 8.3750 ↓ 10/4/83 9.3750 ↓ 4/25/85* 8.2500 ↓ 11/15/83 9.3750 NO ∆ 5/16/85* 8.1250 ↓ 12/20/83 9.3750 NO ∆ 5/20/85* 7.7500 ↓ 1/31/84 9.3750 NO ∆ 5/21/85 7.7500 NO ∆ 3/1/84* 9.5000 ↑ 7/10/85 7.6875 ↓ 3/15/84* 9.8750 ↑ 7/25/85* 7.7500 ↑ 3/22/84* 10.0000 ↑ 8/20/85 7.8125 ↑ 3/27/84 10.2500 ↑ 8/29/85* 7.8750 ↑ 4/5/8* 10.5000 ↑ 9/6/85* 8.0000 ↑ 5/22/84 10.5000 NO ∆ 10/1/85 8.0000 NO ∆ 6/14/8* 10.6250 ↑ 11/5/85 8.0000 NO ∆ 6/21/84* 11.0000 ↑ 12/17/85 7.7500 ↓ 7/17/84 11.2500 ↑ 2/12/86 7.7500 NO ∆ 8/9/84* 11.5625 ↑ 3/7/86* 7.2500 ↓ 8/21/84 11.5625 NO ∆ 4/1/86 7.2500 NO ∆ 8/30/84* 11.4375 ↓ 4/10/86* 7.1250 ↓ 9/20/84* 11.2500 ↓ 4/17/86* 7.0000 ↓ 9/27/84* 11.0000 ↓ 4/24/86* 6.7500 ↓ 10/2/84 10.5625 ↓ 5/20/86 6.8125 ↑
10/11/84* 10.5000 ↓ 6/5/86* 6.8750 ↑ 10/18/84* 10.0000 ↓ 7/9/86 6.3750 ↓ 11/7/84 9.5000 ↓ 8/14/86* 6.3125 ↓
11/23/84* 9.0000 ↓ 8/19/86 5.8750 ↓ 12/6/84* 8.7500 ↓ 9/23/86 5.8750 NO ∆ 12/18/84 8.5000 ↓ 11/5/86 5.8750 NO ∆ 12/27/84* 8.1250 ↓ 12/4/86* 6.0000 ↑ 1/24/85* 8.2500 ↑ 12/16/86 6.0000 NO ∆ 2/13/85 8.3750 ↑ 2/11/87 6.0000 NO ∆ 2/21/85* 8.5000 ↑ 3/31/87 6.0000 NO ∆
* denotes a meeting of the Federal Open Market Committee that was not regularly scheduled. ↑ indicates the Federal Reserve raised its target for the federal funds rate, ↓ denotes a decrease in the target, and NO ∆ implies the targeted level for the federal funds rate remained unchanged.
Page 17
Table 1 (Continued) Federal Funds Rate Target Set By Federal Reserve
Date of FOMC
Meeting Federal Funds
Rate Target
Change in
Targeted Rate
Date of FOMC
Meeting Federal Funds
Rate Target
Change in
Targeted Rate 4/30/87* 6.5000 ↑ 1/5/89* 9.0000 ↑ 5/19/87 6.7500 ↑ 2/8/89 9.0625 ↑ 7/2/87* 6.6250 ↓ 2/14/89* 9.3125 ↑ 7/7/87 6.6250 NO ∆ 2/23/89* 9.5625 ↑ 8/18/87 6.6250 NO ∆ 2/24/89* 9.7500 ↑ 8/27/87* 6.7500 ↑ 3/28/89 9.7500 NO ∆ 9/3/87* 6.8750 ↑ 5/4/89* 9.8125 ↑ 9/4/87* 7.2500 ↑ 5/16/89 9.8125 NO ∆ 9/22/87 7.3125 ↑ 6/6/89* 9.5625 ↓
10/22/87* 7.1250 ↓ 7/6/89 9.3125 ↓ 10/28/87* 7.0000 ↓ 7/27/89* 9.0625 ↓ 11/3/87 6.8125 ↓ 8/10/89* 9.0000 ↓ 12/16/87 6.8125 NO ∆ 8/22/89 9.0000 NO ∆ 1/28/88* 6.6250 ↓ 10/3/89 9.0000 NO ∆ 2/10/88 6.5000 ↓ 10/19/89* 8.7500 ↓ 3/29/88 6.7500 ↑ 11/6/89* 8.5000 ↓ 5/9/88* 7.0000 ↑ 11/14/89 8.5000 NO ∆ 5/17/88 7.0000 NO ∆ 12/19/89 8.2500 ↓ 5/25/88* 7.2500 ↑ 2/7/90 8.2500 NO ∆ 6/22/88* 7.5000 ↑ 3/27/90 8.2500 NO ∆ 6/30/88 7.5000 NO ∆ 5/15/90 8.2500 NO ∆ 7/19/88* 7.6875 ↑ 7/3/90 8.2500 NO ∆ 8/8/88* 7.7500 ↑ 7/13/90* 8.0000 ↓ 8/9/88* 8.1250 ↑ 8/21/90 8.0000 NO ∆ 8/16/88 8.1250 NO ∆ 10/2/90 8.0000 NO ∆ 9/20/88 8.1250 NO ∆ 10/29/90* 7.7500 ↓
10/20/88* 8.2500 ↑ 11/13/90 7.5000 ↓ 11/1/88 8.2500 NO ∆ 12/7/90* 7.2500 ↓
11/17/88* 8.3125 ↑ 12/18/90 7.0000 ↓ 11/22/88* 8.3750 ↑ 1/9/91* 6.7500 ↓ 12/14/88 8.6875 ↑ 2/1/91* 6.2500 ↓ 12/29/88* 8.7500 ↑ 2/6/91 6.2500 NO ∆
* denotes a meeting of the Federal Open Market Committee that was not regularly scheduled. ↑ indicates the Federal Reserve raised its target for the federal funds rate, ↓ denotes a decrease in the target, and NO ∆ implies the targeted level for the federal funds rate remained unchanged.

Page 18
Table 1 (Continued) Federal Funds Rate Target Set By Federal Reserve
Date of FOMC
Meeting Federal Funds
Rate Target
Change in
Targeted Rate
Date of FOMC
Meeting Federal Funds
Rate Target
Change in
Targeted Rate 3/8/91* 6.0000 ↓ 11/16/93 3.0000 NO ∆ 3/26/91 6.0000 NO ∆ 12/21/93 3.0000 NO ∆ 4/30/91* 5.7500 ↓ 2/4/94 3.2500 ↑ 5/14/91 5.7500 NO ∆ 3/22/94 3.5000 ↑ 7/3/91 5.7500 NO ∆ 4/18/94* 3.7500 ↑ 8/6/91* 5.5000 ↓ 5/17/94 4.2500 ↑ 8/20/91 5.5000 NO ∆ 7/6/94 4.2500 NO ∆ 9/19/91* 5.2500 ↓ 8/16/94 4.7500 ↑ 10/1/91 5.2500 NO ∆ 9/27/94 4.7500 NO ∆
10/31/91* 5.0000 ↓ 11/15/94 5.5000 ↑ 11/5/91 5.0000 NO ∆ 12/20/94 5.5000 NO ∆ 11/6/91* 4.7500 ↓ 2/1/95 6.0000 ↑ 12/6/91* 4.5000 ↓ 3/28/95 6.0000 NO ∆ 12/17/91 4.5000 NO ∆ 5/23/95 6.0000 NO ∆ 12/20/91* 4.0000 ↓ 7/6/95 5.7500 ↓
2/5/92 4.0000 NO ∆ 8/22/95 5.7500 NO ∆ 3/31/92 4.0000 NO ∆ 9/26/95 5.7500 NO ∆ 4/9/92* 3.7500 ↓ 11/15/95 5.7500 NO ∆ 5/19/92 3.7500 NO ∆ 12/19/95 5.5000 ↓ 7/1/92 3.7500 NO ∆ 1/31/96 5.2500 ↓ 7/2/92* 3.2500 ↓ 3/26/96 5.2500 NO ∆ 8/18/92 3.2500 NO ∆ 5/21/96 5.2500 NO ∆ 9/4/92* 3.0000 ↓ 7/3/96 5.2500 NO ∆ 10/6/92 3.0000 NO ∆ 8/20/96 5.2500 NO ∆ 11/17/92 3.0000 NO ∆ 9/24/96 5.2500 NO ∆ 12/22/92 3.0000 NO ∆ 11/13/96 5.2500 NO ∆ 2/3/93 3.0000 NO ∆ 12/17/96 5.2500 NO ∆ 3/23/93 3.0000 NO ∆ 2/5/97 5.2500 NO ∆ 5/18/93 3.0000 NO ∆ 3/25/97 5.5000 ↑ 7/7/93 3.0000 NO ∆ 5/20/97 5.5000 NO ∆ 8/17/93 3.0000 NO ∆ 7/2/97 5.5000 NO ∆ 9/23/93 3.0000 NO ∆ 8/19/97 5.5000 NO ∆
* denotes a meeting of the Federal Open Market Committee that was not regularly scheduled. ↑ indicates the Federal Reserve raised its target for the federal funds rate, ↓ denotes a decrease in the target, and NO ∆ implies the targeted level for the federal funds rate remained unchanged.

Page 19
Table 1 (Continued) Federal Funds Rate Target Set By Federal Reserve
Date of FOMC
Meeting Federal Funds
Rate Target
Change in
Targeted Rate
Date of FOMC
Meeting Federal Funds
Rate Target
Change in
Targeted Rate 9/30/97 5.5000 NO ∆ 5/15/01 4.0000 ↓ 11/12/97 5.5000 NO ∆ 6/27/01 3.7500 ↓ 12/16/97 5.5000 NO ∆ 8/21/01 3.5000 ↓ 2/4/98 5.5000 NO ∆ 9/17/01* 3.0000 ↓ 3/31/98 5.5000 NO ∆ 10/2/01 2.5000 ↓ 5/19/98 5.5000 NO ∆ 11/6/01 2.0000 ↓ 7/1/98 5.5000 NO ∆ 12/11/01 1.7500 ↓ 8/18/98 5.5000 NO ∆ 1/30/02 1.7500 NO ∆ 9/29/98 5.2500 ↓ 3/19/02 1.7500 NO ∆
10/18/98* 5.0000 ↓ 5/7/02 1.7500 NO ∆ 11/17/98 4.7500 ↓ 6/26/02 1.7500 NO ∆ 12/22/98 4.7500 NO ∆ 8/13/02 1.7500 NO ∆ 2/3/99 4.7500 NO ∆ 9/24/02 1.7500 NO ∆ 3/30/99 4.7500 NO ∆ 11/6/02 1.2500 ↓ 5/18/99 4.7500 NO ∆ 12/10/02 1.2500 NO ∆ 6/30/99 5.0000 ↑ 1/29/03 1.2500 NO ∆ 8/24/99 5.2500 ↑ 3/18/03 1.2500 NO ∆ 10/5/99 5.2500 NO ∆ 5/6/03 1.2500 NO ∆ 11/16/99 5.5000 ↑ 6/25/03 1.0000 ↓ 12/21/99 5.5000 NO ∆ 8/12/03 1.0000 NO ∆ 2/2/00 5.7500 ↑ 9/16/03 1.0000 NO ∆ 3/21/00 6.0000 ↑ 10/28/03 1.0000 NO ∆ 5/16/00 6.5000 ↑ 12/9/03 1.0000 NO ∆ 6/28/00 6.5000 NO ∆ 1/28/04 1.0000 NO ∆ 8/22/00 6.5000 NO ∆ 3/16/04 1.0000 NO ∆ 10/3/00 6.5000 NO ∆ 5/4/04 1.0000 NO ∆ 11/15/00 6.5000 NO ∆ 6/30/04 1.2500 ↑ 12/19/00 6.5000 NO ∆ 8/10/04 1.5000 ↑ 1/3/01* 6.0000 ↓ 9/21/04 1.7500 ↑ 1/31/01 5.5000 ↓ 11/10/04 2.0000 ↑ 3/20/01 5.0000 ↓ 12/14/04 2.2500 ↑ 4/18/01* 4.5000 ↓ 2/2/05 2.5000 ↑
* denotes a meeting of the Federal Open Market Committee that was not regularly scheduled. ↑ indicates the Federal Reserve raised its target for the federal funds rate, ↓ denotes a decrease in the target, and NO ∆ implies the targeted level for the federal funds rate remained unchanged.
Page 20
Table 2 Regression Specification and Expected Signs of Regression Coefficients
Equation(4)
0 1 -1 2 3 4
5 6 7 8
DTARGET = α + α DTARGET + α DU + α DG10 + α PDROILP + α GAP + α PDCON + α NOTSCH + α DYGAP + ε
Dependent Variable = DTARGET = ∆ in the Federal Funds Target Since Previous FOMC Meeting Explanatory Variables Expected Sign
DTARGET-1 = ∆ in Federal Funds Target that Occurred Last FOMC Meeting α1 > 0 DU = ∆ in Unemployment Rate Since Last FOMC Meeting α2 < 0 DG10 = ∆ in 10-Year Treasury Rate Since Last FOMC Meeting α3 > 0 PDROILP = % ∆ in Real Oil Price Since Last FOMC Meeting α4 > 0 GAP = Current Federal Funds Rate – Federal Funds Target Set Last FOMC Meeting α5 > 0 PDCON = % ∆ in Consumer Confidence Since Last FOMC Meeting α6 > 0 NOTSCH = Current FOMC Meeting Was Unscheduled ? DYGAP = ∆ in Gap Between Income and Long-Run Level Since Last FOMC Meeting α8 > 0
Equation (5) 0 1 -1 2 3 4
5 6 7 8
PDTARGET = + PDTARGET + DU + DG10 + PDROILP + GAP + PDCON + NOTSCH + DYGAP +
β β β β ββ β β β µ
Dependent Variable = PDTARGET = % ∆ in the Federal Funds Target Since Previous FOMC Meeting Explanatory Variables Expected Sign
PDTARGET-1 = ∆ in Federal Funds Target that Occurred Last FOMC Meeting β1 > 0 DU = ∆ in Unemployment Rate Since Last FOMC Meeting β2 < 0 DG10 = ∆ in 10-Year Treasury Rate Since Last FOMC Meeting β3 > 0 PDROILP = % ∆ in Real Oil Price Since Last FOMC Meeting β4 > 0 GAP = Current Federal Funds Rate – Federal Funds Target Set Last FOMC Meeting β5 > 0 PDCON = % ∆ in Consumer Confidence Since Last FOMC Meeting β6 > 0 NOTSCH = Current FOMC Meeting Was Unscheduled ? DYGAP = ∆ in Gap Between Income and Long-Run Level Since Last FOMC Meeting β8 > 0
Page 21
Table 3 Factors that Affect the Changes in the Federal Reserve’s Target of the Federal Funds Rate
Dependent Variable = Change in the Federal Funds Target Occurring in Current FOMC Meeting (DTARGET)
Explanatory Variables Model 1 Model 2 Model 3
Intercept -0.010 (0.006)
-0.002 (0.009)
-0.001 (0.009)
∆ in Federal Funds Target that Occurred Last FOMC Meeting (DTARGET-1) 0.612* (0.043)
0.612* (0.043)
0.615* (0.043)
∆ in Unemployment Rate Since Last FOMC Meeting (DU) -0.111†† (0.059)
-0.103†† (0.059)
-0.104†† (0.059)
∆ in 10-Year Treasury Rate Since Last FOMC Meeting (DG10) 0.125* (0.026)
0.127* (0.026)
0.127* (0.026)
% ∆ in Real Oil Price Since Last FOMC Meeting (PDROILP) 0.002*** (0.001)
0.001*** (0.001)
0.001*** (0.001)
Current Federal Funds Rate – Federal Funds Target Set Last FOMC Meeting (GAP) 0.161* (0.026)
0.160* (0.026)
0.158* (0.026)
% ∆ in Consumer Confidence Since Last FOMC Meeting (PDCON) 0.005** (0.002)
0.004** (0.002)
0.004** (0.002)
Current FOMC Meeting Was Unscheduled (NOTSCH) -0.026 (0.017)
-0.026 (0.017)
∆ in Gap Between Income and Long-Run Level Since Last FOMC Meeting (DYGAP) -0.006 (0.012)
First-Order Autoregressive Error Term [AR(1)] -0.561 (0.056)
-0.559 (0.057)
-0.561 (0.056)
R2 0.541 0.546 0.546 F 41.502‡ 36.765‡ 32.601‡ DW 2.035 2.030 2.031
*, **, and *** indicate the null hypothesis that the coefficient is less than or equal to zero is rejected at the 1, 5, or 10 percent level, respectively. †† indicates the null hypothesis that the coefficient is greater than or equal to zero is rejected at the 5 percent level. ‡ indicates the null hypothesis that all the slope coefficients are simultaneous equal to zero is rejected at the 1 percent level. FOMC = Federal Open Market Committee.
Page 22
Table 4 Factors that Affect the Percentage Change in the Federal Reserve’s Target of the Federal Funds Rate
Dependent Variable = Percentage Change in the Federal Funds Target Occurring in Current FOMC Meeting (PDTARGET)
Explanatory Variables Model 1 Model 2 Model 3
Intercept -0.174 (0.175)
0.037 (0.235)
0.031 (0.236)
% ∆ in Federal Funds Target that Occurred Last FOMC Meeting (PDTARGET-1) 0.662* (0.046)
0.663* (0.046)
0.660* (0.047)
∆ in Unemployment Rate Since Last FOMC Meeting (DU) -5.060† (1.631)
-4.852† (1.638)
-4.830† (1.644)
∆ in 10-Year Treasury Rate Since Last FOMC Meeting (DG10) 1.955* (0.715)
1.991* (0.715)
1.978* (0.718)
% ∆ in Real Oil Price Since Last FOMC Meeting (PDROILP) 0.051** (0.028)
0.047** (0.028)
0.048** (0.028)
Current Federal Funds Rate – Federal Funds Target Set Last FOMC Meeting (GAP) 2.723* (0.667)
2.703* (0.667)
2.734* (0.673)
% ∆ in Consumer Confidence Since Last FOMC Meeting (PDCON) 0.124** (0.057)
0.115** (0.057)
0.112** (0.058)
Current FOMC Meeting Was Unscheduled (NOTSCH) -0.640 (0.475)
-0.632 (0.476)
∆ in Gap Between Income and Long-Run Level Since Last FOMC Meeting (DYGAP) 0.123 (0.323)
First-Order Autoregressive Error Term [AR(1)] -0.467 (0.062)
-0.464 (0.063)
-0.462 (0.063)
R2 0.473 0.477 0.477 F 31.376‡ 27.772‡ 24.616‡ DW 2.024 2.019 2.019
* and ** indicate the null hypothesis that the coefficient is less than or equal to zero is rejected at the 1, or 5 percent level, respectively. † indicates the null hypothesis that the coefficient is greater than or equal to zero is rejected at the 1 percent level. ‡ indicates the null hypothesis that all the slope coefficients are simultaneous equal to zero is rejected at the 1 percent level. FOMC = Federal Open Market Committee.
Page 23
Figure 1Actual and Targeted Federal Funds Rate: 1980s
5.25005.75006.25006.75007.25007.75008.25008.75009.25009.7500
10.250010.750011.250011.750012.250012.750013.250013.750014.250014.750015.250015.750016.2500
7/3/83 11/14/84 3/29/86 8/11/87 12/23/88
Date
Perc
ent
ActualTarget

Page 24
Figure 2Actual and Targeted Federal Funds Rate:1990s
2.5000
3.0000
3.5000
4.0000
4.5000
5.0000
5.5000
6.0000
6.5000
7.0000
7.5000
8.0000
8.5000
9.0000
9.5000
10.0000
10.5000
1/1/90 1/1/91 1/1/92 12/31/92 12/31/93 12/31/94 12/31/95 12/30/96 12/30/97 12/30/98 12/30/99
Date
Perc
ent
ActualTarget

Page 25
Figure 3Actual and Targeted Federal Funds Rate: 2000s
0.75001.00001.25001.50001.75002.00002.25002.50002.75003.00003.25003.50003.75004.00004.25004.50004.75005.00005.25005.50005.75006.00006.25006.50006.75007.00007.25007.5000
1/1/00 6/29/00 12/26/00 6/24/01 12/21/01 6/19/02 12/16/02 6/14/03 12/11/03 6/8/04 12/5/04
Date
Perc
ent
ActualTarget