Embed Size (px)
Citation preview

How the analysts reacted to the first Solvency II
disclosures
Nick Ford
23 November 2017
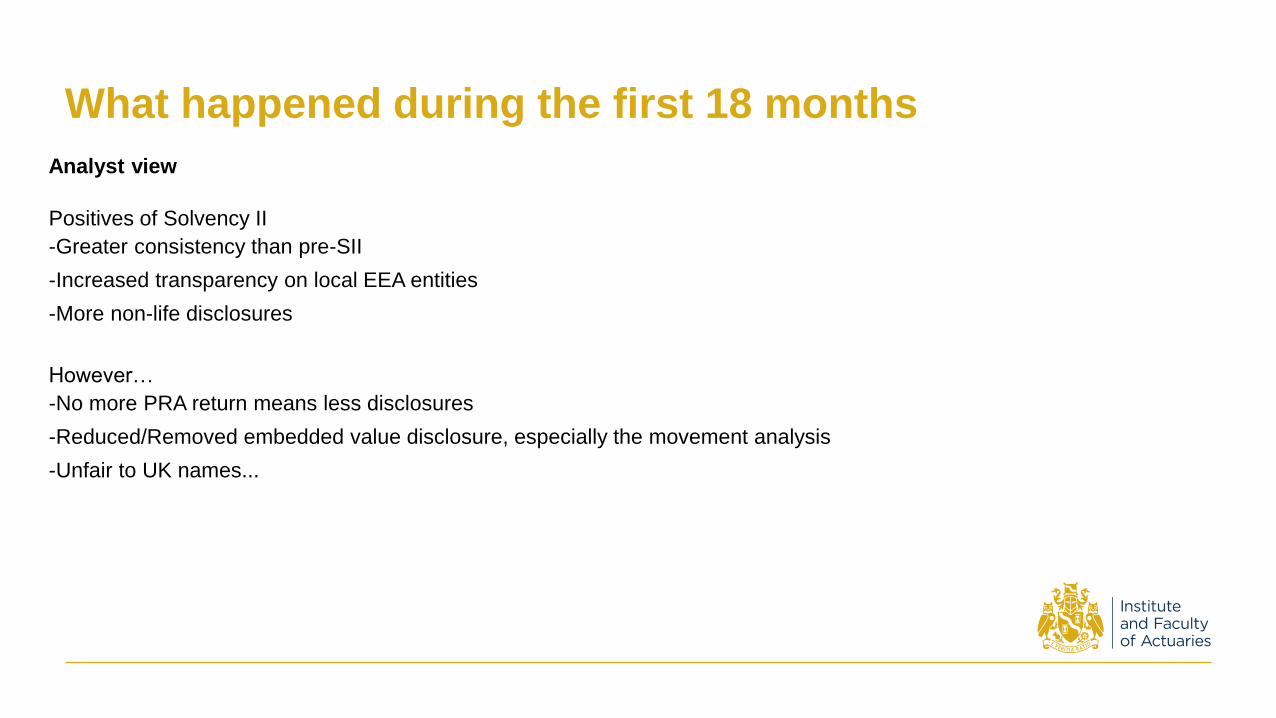
What happened during the first 18 months
Analyst view
Positives of Solvency II
-Greater consistency than pre-SII
-Increased transparency on local EEA entities
-More non-life disclosures
However…
-No more PRA return means less disclosures
-Reduced/Removed embedded value disclosure, especially the movement analysis
-Unfair to UK names...

SFCR publication was less eventful than expected
SFCRL&G
Source: Bloomberg

SFCR publication was less eventful than expected
Aviva SFCR
Source: Bloomberg

SFCR publication was less eventful than expected
Pru SFCR
Source: Bloomberg

267%
197%
178%
157%177% 165% 167%
164%151%
155%
143%
123% 122%
261%
202%201%
188%
185% 182%180%
170%
162%150% 149%
147% 137%
130%
100%
150%
200%
250%
300%
Solvency II cover ratios and target ranges
Note: ND = not disclosed
(a) Please note that the information presented here was disclosed in EUR and converted to GBP at the exchange rate as at 30 June 2017.
(b) The ratio disclosed for these companies includes a TMTP recalculation for HY 2017.
(c) The results are stated as being estimated. In reality, it is likely that all results are estimated but other companied did not explicitly disclose this.
(d) Results for Prudential presented on a ‘shareholder view’ basis which excludes the contribution from the with-profits funds (WPF) and staff pension schemes.
(e) Results for Phoenix represent a pro forma position which includes the impacts of the US$500 million Tier 2 bond issued in July 2017.
Source: Analysis using public market disclosures
Solvency II cover ratios (Own funds over SCR) ranked by HY 17 decreasing order and target ranges.
HY 2017
results
£bn
Mu
nic
h R
e
Pru
de
nti
al(
b,d
)
AX
A(a
)
Gen
era
li
Aeg
on
Sta
nd
ard
Lif
e
L&
G(b
)
Aviv
a(b
,c)
PIC
Ju
st
Gro
up
Ro
yal
Lo
nd
on
Gro
up
LB
G
Ph
oe
nix
(b,e
)
Old
Mu
tua
l
Own
funds ND 25.6
51.5 NDND
6.715.2 28.9 3.4 2.1 5.8 ND 6.5 7.3
SCR ND 12.7 25.7 ND ND 3.7 8.5 17 2.1 1.4 3.9 ND 4.8 5.6
Surplus ND 12.9 25.8 ND ND 3.0 6.7 11.9 1.3 0.7 1.9 ND 1.7 1.7
Target range
Minimum target
YE16
HY17
Other view (HY17 and YE16)
Shareholder view
as regulatory
view not
disclosed
201%

Solvency II capital generation – HY17£bn or % Opening Operating
return
Market
movements
Dividends
/ debt
payments
Management
actions
Regulatory /
model
changes
Other Closing
Aegon 157% +3% +3% n/d +7% +15% - 185%
Aviva 11.3 0.9 (0.2) (1.0) 0.4 - - 11.4
AXA 197% +9% +1% -5% n/d n/d -2% 201%
L&G 5.7 0.9 0.1 (0.6) 0.6 - - 6.7
Old
Mutual
122% n/d n/d n/d 11% - -3% 130%
Phoenix 1.1 0.2 (0.1) (0.2) 0.2 - 0.5 1.7
Prudential 12.5 1.7 - (0.8) - - (0.5) 12.9
Inconsistency examples
•Operating return includes capital actions and amortisation of TMTP for some companies but not others – some gave very
little insight behind the operating return. Classification of debt and corporate centre costs was also inconsistent.
•Some included notional dividend payments for the first half of 2017
Source: Analysis using public market disclosures

Solvency II capital generation – analyst view
Av
era
ge o
pen
ing
S2 r
ati
o
193%
at
1stJan
2016
Ordinary dividend
-13ppts
Av
era
ge o
pen
ing
S2 r
ati
o
197%
at
30
thJu
ne 2
017
25
ppts
Op. capital generation
Net sub-debt
2 ppts
Market movement
-3 ppts
Buyback
Special divi
-4 pptsOther
-3 ppts
Aviva
Prudential plc.
Source: Company data

Wish list - movement analysis
Op
en
ing
S2
Su
rplu
s
Unwind of VA/UFR
(B)
Amortisation of transitional
arrangement (G)
Clo
sin
g S
2 S
urp
lus
Excess spread over risk free
(A) New business (C)
Unwind of risk margin (D)
Variances / mkt moves (F)
Dividend (H)
Unwind of SCR (E)

Recalculation of TMTP – disclosure at HY17HY17 Aviva L&G Prudential Phoenix
Standard
Life
Royal
LondonPIC Just Group
Allow for HY17 recalc for market
changesP P P P O O O O
Allow amortisation of half year P P P O O O n/d P
Included disclosure of run off of
TMTPO O O O O O O O
Stated size of TMTP O O P (£2.1bn) O O P (9%) O O
Stated impact of HY17 recalcP
(£0.5bn)
P
(£0.2bn)
P
(£0.7bn)O O O
P
(marginal)
P
(£63m or 5%)
Source: Analysis using public market disclosures
YE16Aviva L&G Prudential Phoenix Standard
Life
Royal
London
PIC Just Group
Allow for YE16 recalc for market
changes
P P P P P O O O
Allow amortisation of one year P P P P P n/d n/d P
Included disclosure of run off of
TMTP
O O P P P O O O
Stated size of TMTP O O P
(£2.5bn)
P
(£1.9bn)
P
(£1.5bn)
P
(10%)
O O
Stated impact of YE16 recalc P
(£0.4bn)
O P
(£0.4bn)
P
(£0.3bn)
O O O P (2-3%)

Selected TMTP, MA and VA impacts – from SFCRs
Source:Analysis based on S.22.01 QRT from SFCRs

Solvency II cover ratios (different views)
Solvency II shareholder/investor view vs regulatory view
Shareholder/Investor view Regulatory view
HY17 YE16 HY17 YE16
Standard Life 220% 214% 182% 177%
Royal London 203% 232% 149% 155%
Prudential 202% 201% ND ND
Aviva 193% 189% 170% 167%
L&G 186% 171% 180% 165%
Phoenix 166% 139% 137% 123%
LBG 152% 147% 147% 143%
Solvency II Pillar 2 ratios
Generali, L&G and Just Group continue to
present a Pillar 2 view as well.
Additional information
• Restrictions removed include:
• With profits funds
• Pension Schemes
• Other unrecognised capital (e.g. fungibility / transferability restrictions)
• Some companies allow for other ‘proforma’ adjustments that they cannot allow for in the regulatory view – e.g. internal model change that
hadn’t been approved at valuation date
• Most companies provide the restrictions in £ amounts as well
• The regulatory view presented in this table is from the market disclosure, not from the SFCR. There are some differences between these –
likely due to an estimate being used in the market disclosure.

SCR by risk type and diversification benefit – YE16
0%
20%
40%
60%
80%
100%
SC
OR
Old
Mu
tual
RS
A
NN
Gro
up
Mu
nic
h R
e
Ag
eas
Hannover R
e
Aviv
a
CN
P
Allia
nz
Genera
li
Pru
dentia
l
Pru
dentia
l
Dire
ct L
ine G
roup
Ph
oenix
Axa
L&
G
Sta
ndard
Life
PIC
Bu
pa
Investment Risk Life Insurance Risk Non-Life Insurance Risk Operational Risk Other Risk
Diversified
Pre-diversified
% Div. Benefit 49% 42% 40% 39% 36% 33%(a)
31% 30%(b)
26% 25% 19%(a)
n/d n/d n/d n/d n/d n/d n/d n/d
Note: (a) Based on their internal SII view. (b) Based on their shareholder SII view.
Pre / Post - Diversified capital YE16 rank by % size of Div. Benefit
Source: Analysis using public market disclosures
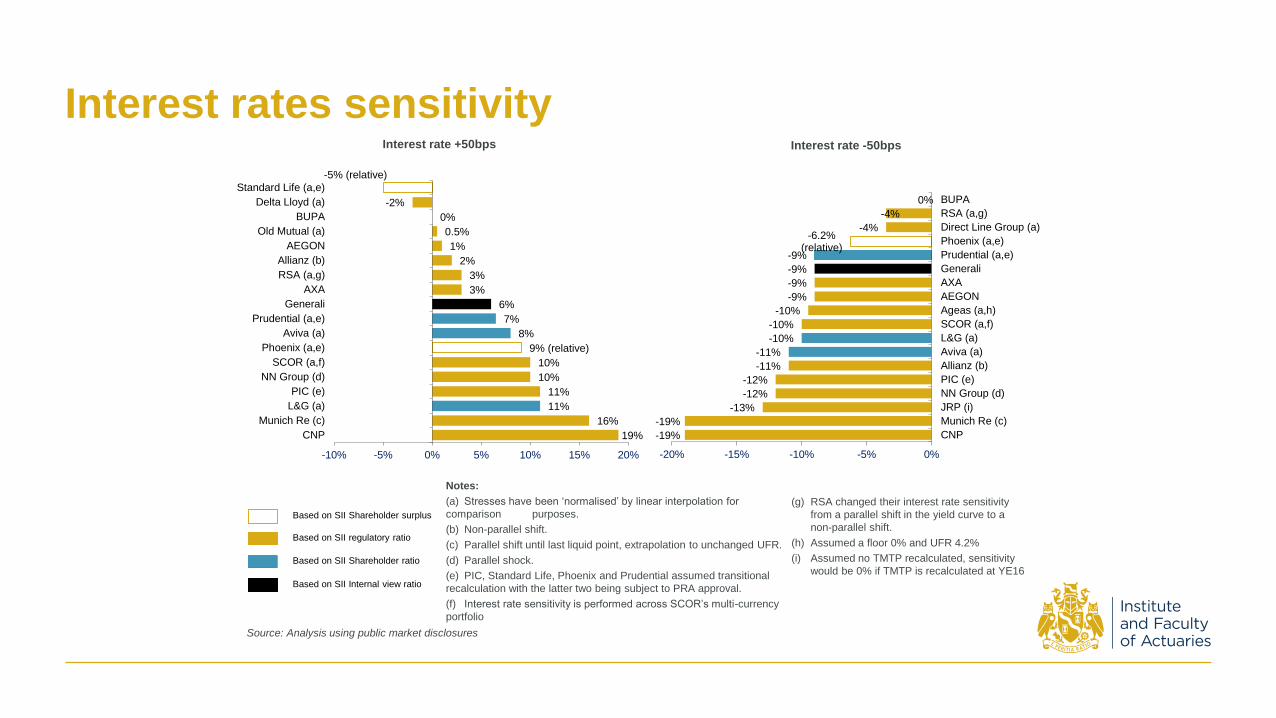
Interest rates sensitivity
19%
16%
11%
11%
10%
10%
9% (relative)
8%
7%
6%
3%
3%
2%
1%
0.5%
0%
-2%
-5% (relative)
-10% -5% 0% 5% 10% 15% 20%
CNP
Munich Re (c)
L&G (a)
PIC (e)
NN Group (d)
SCOR (a,f)
Phoenix (a,e)
Aviva (a)
Prudential (a,e)
Generali
AXA
RSA (a,g)
Allianz (b)
AEGON
Old Mutual (a)
BUPA
Delta Lloyd (a)
Standard Life (a,e)
Interest rate +50bps
Notes:
(a) Stresses have been ‘normalised’ by linear interpolation for
comparison purposes.
(b) Non-parallel shift.
(c) Parallel shift until last liquid point, extrapolation to unchanged UFR.
(d) Parallel shock.
(e) PIC, Standard Life, Phoenix and Prudential assumed transitional
recalculation with the latter two being subject to PRA approval.
(f) Interest rate sensitivity is performed across SCOR’s multi-currency
portfolio
Based on SII Shareholder surplus
Based on SII regulatory ratio
Based on SII Shareholder ratio
Based on SII Internal view ratio
(g) RSA changed their interest rate sensitivity
from a parallel shift in the yield curve to a
non-parallel shift.
(h) Assumed a floor 0% and UFR 4.2%
(i) Assumed no TMTP recalculated, sensitivity
would be 0% if TMTP is recalculated at YE16
-19%
-19%
-13%
-12%
-12%
-11%
-11%
-10%
-10%
-10%
-9%
-9%
-9%
-9%
-6.2%(relative)
-4%
-4%
0%
-20% -15% -10% -5% 0%
CNP
Munich Re (c)
JRP (i)
NN Group (d)
PIC (e)
Allianz (b)
Aviva (a)
L&G (a)
SCOR (a,f)
Ageas (a,h)
AEGON
AXA
Generali
Prudential (a,e)
Phoenix (a,e)
Direct Line Group (a)
RSA (a,g)
BUPA
Interest rate -50bps
Source: Analysis using public market disclosures

Credit Corporate sensitivity
Notes:
(a) Stresses have been ‘normalised’ by linear interpolation for
comparison purposes.
(b) Delta Lloyd Included movement in VA. For all credit spreads (excl.
mortgages).
(c) L&G assumed a level addition to all ratings.
(d) Munich Re widen both government and corporate bonds
Based on SII shareholder surplus
Based on SII regulatory ratio
Based on SII Shareholder ratio
Based on SII Internal view ratio
(e) Old Mutual assumes a 100bps increase in
credit spreads is generally assumed to be a
one notch downgrade from BBB to BB- rating
and a two notch downgrade on lower graded
investments.
(f) BUPA assumed no credit transaction.
(g) RSA used a parallel shift.
18%
15%
5%
3%
1%
0%
0%
0%
0%
-1%
-1%
-2%
-2%
-3%
-4%
-5%
-11%
-14%
-23%
-25% -20% -15% -10% -5% 0% 5% 10% 15% 20%
RSA (a,g)
NN Group
L&G (a,c)
JRP (a)
Aegon
Allianz
Aviva
BUPA (f)
Standard Life
Old Mutual (a,e)
AXA (a)
Generali (a)
Prudential (a)
Phoenix (a)
Direct Line Group (a)
SCOR (a)
CNP (a)
Munich Re (a,d)
Delta Lloyd (b)
Credit Corporate +50bps
Source: Analysis using public market disclosures
A spread narrowing was also disclosed by:
RSA
Delta Lloyd
Standard Life
Aviva
L&G

16% relative
13%
13%
9%
6%
6%
5%
5%
1%
-1%
-5% 0% 5% 10% 15% 20%
Standard Life(a)
Delta Lloyd (a)
Munich Re (a)
Generali (a)
L&G (a)
AXA
Allianz (a)
Aviva (a)
Old Mutual
Aegon (a)
Equity Risk +25%
Equity risk sensitivity
Notes:
(a) Stresses have been ‘normalised’ by linear interpolation for comparison purposes.
Based on SII shareholder surplus
Based on SII regulatory ratio
Based on SII Shareholder ratio
Based on SII Internal view ratio
-16% relative
-13%
-13%
-13%
-12%
-12%
-9%
-8%
-7%
-6%
-4%
-4%
-3%
-2%
0%
-20% -15% -10% -5% 0%
Standard Life (a)
Munich Re (a)
RSA (a)
Delta Lloyd (a)
CNP
NN Group
Generali (a)
Aegon (a)
AXA
L&G (a)
Aviva (a)
Prudential (a)
SCOR (a)
Allianz (a)
Phoenix
Equity Risk -25%
Source: Analysis using public market disclosures

Risk Margin metrics
Source:Analysis from QRTs within SFCRs

Loss absorbing capacity
Source:Analysis from S.25 QRTs from SFCRs

Total
OF
(£bn) Ae
go
n
Aviv
a
AX
A
CN
P
De
lta
Llo
yd
Ge
ne
rali
Ha
nn
ove
r R
e
L&
G (
a)
Mu
nic
h R
e
NN
Gro
up
Old
Mu
tua
l
Ph
oe
nix
Pru
den
tia
l(a)
Sta
nd
ard
Lif
e
Ag
ea
s
BU
PA
Dir
ec
t L
ine
PIC
RS
A
YE16 15.5 24.0 49.4 20.2 3.4 30.4 11.0 13.6 34.2 11.2 6.9 6.8 24.8 7.2 6.9 4.2 2.3 3.1 2.9
YE15 14.8 21.8 43.7 17.0 2.9 30.5 9.3 13.5 30.0 9.8 6.1 5.7 20.1 5.5 8.0 3.1 2.5 2.4 2.9
Quality of capital
Note: n/d = Not disclosed (a) Shareholder view
Source: Analysis using public market disclosures

Embedded value & new business
EV VNB
Aegon n/a MCVNB
Allianz MCEV / SII based SII/MCEV
Aviva n/a Adjusted SII
AXA EEV / Adjusted SII EEV
CNP MCEV / SII based MCEV
Delta Lloyd n/a SII
Generali MCEV / SII based SII / MCEV
Hannover Re n/a SII
JRP IFRS based EEV
L&G n/a Adjusted SII
Munich Re n/a SII
NN Group n/a Internal
Old Mutual EM MCEV MCEV
PIC EEV + MCEV / SII based EEV
Prudential EEV EEV
St James’s Place EEV EEV
• EV disclosures continue to decrease – particular in UK
• Various different definitions of EV used, including some
based from SII as a starting point
• Similarly, various different measures for new business

Analyst further wish list
• Solvency 2 vs. IFRS earnings
• Embedded guarantees to policyholders
• Comparability of 1-in-200 scenarios, especially the macro risks
• More understanding of longevity risk
• Consistency...

20 March 2018 22
The views expressed in this presentation are those of invited contributors and not necessarily those of the IFoA. The IFoA do not endorse any of the views
stated, nor any claims or representations made in this presentation and accept no responsibility or liability to any person for loss or damage suffered as a
consequence of their placing reliance upon any view, claim or representation made in this presentation.
The information and expressions of opinion contained in this presentation are not intended to be a comprehensive study, nor to provide actuarial advice or
advice of any nature and should not be treated as a substitute for specific advice concerning individual situations. On no account may any part of this
presentation be reproduced without the written permission of the IFoA or authors.
Questions Comments