Embed Size (px)
Citation preview
1
How Sukuk Shapes Firm Performance#
Paul-Olivier Klein
University of Strasbourg
Strasbourg, France
Laurent Weill+
EM Strasbourg Business School, University of Strasbourg
Strasbourg, France
Christophe J. Godlewski
University of Haute Alsace & EM Strasbourg Business School
Strasbourg, France
Abstract
With the large expansion of Islamic finance in the recent years, sukuk, which are the Sharia-
compliant substitute to conventional bonds, are now becoming more prominent. The aim of
this study is to examine the impact of sukuk issuance on firm performance. To do so, we
analyze how stock market performance and operating performance are influenced by issuance
of sukuk and bonds on a sample of Malaysian listed companies. We consider the short-term
and medium-term stock market reaction through the computation of cumulative abnormal
returns and buy-and-hold abnormal returns. We investigate the impact on operating
performance by performing regressions and by calculating abnormal operating performance
so that we can compare how issuance affects similar firms. We find that sukuk issuance
generates a negative stock market reaction both in the short-term and in the medium-term. We
also find evidence that issuing sukuk hampers operating performance. The analysis of
abnormal operating performance shows that sukuk issuers have better performance than their
matched bond issuers, but that sukuk contributes to reduce the gap in performance over time.
Overall our results support the view that sukuk issuance hampers stock market performance,
but that it is not attributable to a signaling effect on the bad financial situation of the issuer.
We interpret our findings as evidence of adverse selection taking place on the financed
projects and agency problems stemming from the specific sukuk structuring with stock market
investors more reluctant to invest in sukuk issuers.
JEL Codes: G14, P51.
Keywords: Debt instruments, Islamic finance, Emerging countries.
# We thank Iana Zborshchyk, Jens Jackwerth, Günter Franke, Axel Kind, Patrick Roger and participants at the
Workshop on Banking and Finance in Koenigsfeld (November 2014) and the FEBS Conference in Nantes (June
2015) for their comments and suggestions. + Corresponding author. Address: Institut d’Etudes Politiques, 47 avenue de la Forêt Noire, 67082 Strasbourg
Cedex, France. Phone : 33-3-68-85-81-38. E-mail: [email protected].

2
1. Introduction
There was an impressive development of Islamic financial activities in the world in the
last decade, with worldwide Islamic financial assets rising from USD 150 billion in the mid-
1990s to USD 1.8 trillion by end of 2013.1 This trend has been driven by the growth of
Islamic banking activities but also by the expansion of sukuk. By end of 2013 worldwide
value of outstanding sukuk was USD 270 billion, representing 14.6% of global Islamic
financial assets.
What are sukuk? They are the alternative mode of financing to bonds that is compliant
with the Islamic law (shari’a). Sukuk are investment certificates which can be issued by
companies and countries, with similarities and differences with bonds. Like bonds, sukuk have
a maturity date and provide income flows over the life of the security with a payment at
maturity to their holders. Unlike bonds, the value of sukuk is not based on the
creditworthiness of the issuer, as holding sukuk shares represents the ownership in tangible
assets, usufruct, or services of revenue-generating issuers. As a consequence, sukuk prices can
vary both with the creditworthiness of the issuer and with the market value of the underlying
asset.
Sukuk can be structured like debt-based instruments or partnership contracts. Debt-
based instruments such as Ijara (rental/lease agreement) and Murabaha (cost-plus sale) do not
contain stricto sensu interest but they pay a predetermined rate of return to investors.
Musharaka and Mudaraba are partnership contracts in which the financier and the
entrepreneur share profits based on pre-agreed ratios whereas losses are commensurate to
their contribution to the partnership.
Given the expansion of sukuk, it appears as a surprise that research remains scarce on
this issue. Godlewski, Turk-Ariss, and Weill (2013) use an event study methodology to
compare the stock market reaction to the announcements of sukuk and bond issues of
companies in Malaysia. They find that the stock market reaction is neutral to the
announcement of bonds but that investors react negatively to the announcement of sukuk. The
negative implications of sukuk issues are attributed to two reasons. First, an adverse selection
mechanism can be at work, as borrowers with the lowest return expectations may favor the
issuance of profit-and-loss sharing sukuk structures over conventional interest-based bonds.
Second, there is an excessive demand for sukuk coming from Islamic institutions. As a result,
1 All figures on Islamic finance activities come from Kuwait Finance House (2014)
3
it can be easier for a firm to issue and sell sukuk relative to bonds. Issuing sukuk would then
be interpreted as a way to obtain financing when the company is unable to issue a bond.
Godlewski, Turk-Ariss, and Weill (2016) prolong this work by examining the impact of
two key features of sukuk on the stock market reaction: the type of sukuk, and the certification
by shari’a scholars. Sukuk must be certified by these scholars to guarantee their compliance
with shari’a. By performing the analysis on a sample of eight countries, they find that debt-
like sukuk favor a positive stock market relation in comparison to partnership contracts. This
result is observed in particular for Ijara sukuk, the most commonly used sukuk structure. They
explain this finding by the lower shari’a compliance risk of Ijara compared to other structures
but also by the adverse selection mechanism that hampers the issuance of profit-and-loss
sharing sukuk. They also show that the choice of scholars can influence the stock market
reaction to sukuk issuance.
Our objective is to extend these works by providing a broader analysis of the impact of
sukuk issuance on the performance of the issuing firm. Godlewski, Turk-Ariss and Weill
(2013) have analyzed the stock market reaction to sukuk issuance but they restrict their study
to the short-term stock market performance. We can however wonder if issuing sukuk exerts
an influence on medium-term stock market performance and on operating performance. The
analysis of the medium-term stock-market reaction is of use to check if the negative stock
market reaction persists over time.
By examining operating performance, we have a better view of all consequences of the
issuance of sukuk for a firm. In line with the theoretical arguments on the influence of debt
issuance on firm performance, we can check if sukuk issuance exerts a similar impact than
bond issuance. The study of operating performance helps also understanding the reasons of
the negative stock market reaction following sukuk issuance. Namely the negative stock
market reaction to sukuk issuance suggests that stock market investors consider this event as
bad news for the evolution of the firm performance. To issue sukuk would act as a signal of
the bad financial shape of the issuer, in line with the adverse selection argument stressed
before. Alternatively, it can also contribute to deteriorate the situation of the firm if such event
is more costly than the issuance of a bond.
To answer these questions, we perform for the first time a broad analysis of the impact
of sukuk issuance on firm performance. We consider a sample of 114 Malaysian listed
companies that issued 164 sukuk (47 issuers) and 604 bonds (67 issuers) from 2002 to 2010.
Our focus is on Malaysia, as this country is by far the world’s biggest country of issuance for
corporate sukuk. In addition, the volume of issued corporate bonds is substantial and allows a

4
comparison between the issuance of corporate sukuk and bonds. The focus on the Malaysian
market also allows avoiding the influence of tax rules between sukuk and bonds, as taxation
rules for sukuk in Malaysia aim at guaranteeing the fiscal neutrality between both types of
instruments.2Understanding how sukuk issuance influences firm performance has major
interest for the analysis of sukuk markets. It contributes to explain the stock market reaction
by analyzing how the operating performance of the firm evolves after the issuance. Namely,
stock market performance is supposed to be influenced, notably, by the expected evolution of
operating performance. So by looking simultaneously at the stock market and the operating
performances, we bring a comprehensive view of the investor perception. It also provides
some perspectives on the evolution of sukuk markets, as investor valuation and influence on
operating performance can affect the decisions of firms to issue sukuk.
Our empirical analysis is composed of four parts. First, we analyze the stock market
reaction to sukuk and bond issuance to provide evidence on the stock market performance in
the short-term. It is a first step in our analysis to check if the result from Godlewski, Turk-
Ariss and Weill (2013) stands for our sample before examining how sukuk issuance influences
operating performance and medium-term stock performance. Second, we calculate abnormal
operating performance to study how issuance can affect operating performance of similar
firms. We create pairs of similar firms with one sukuk issuer and one bond issuer. We can
then examine if a sukuk issuer performs better than its matched bond issuer. Third, we
examine how sukuk and bond issuance influences operating performance and thus may
explain the first reaction of stock market investors. To do so, we perform regressions of
operating performance indicators. We are then able to investigate if issuing sukuk leads to a
deterioration of operating performance. In other words, we can check if the negative stock
market reaction can be explained by the expectation that this event hampers the financial
situation of the firm. Fourth, we examine medium-term stock market reaction to sukuk
issuance. We then compute the buy-and-hold abnormal return to study the stock market
reaction in the three years following the issuance.
The rest of the article is structured as follows. Section 2 presents theory and testable
hypotheses. Section 3 describes the data. Section 4 presents the methodology. Section 5
provides the results. Section 6 concludes.
2 See for additional information the website of Securities Commission Malaysia: http://www.sc.com.my/general-
section/special-incentives/islamic-capital-market/ and http://www.sc.com.my/general-section/special-incentives/bond-
market/.

5
2. Theory and testable hypotheses
In this section, we explain why firm performance is differently influenced by sukuk or
bond issuance. To this aim, we first develop the arguments why debt issuance should
influence firm performance. Then we explain how these arguments can act in a different way
following sukuk issuance in comparison to bond issuance.
2.1 Debt issuance and firm performance
Theoretical literature provides opposing arguments on the impact of debt issue on firm
performance. Two hypotheses may explain a positive impact on firm performance. First,
issuing debt is a signal solving adverse selection issues. Namely, information asymmetries
between firm insiders and outsiders create an adverse selection issue. High-quality firms have
then incentives to send a signal to show their quality. Debt represents a credible signal.
Issuing a debt is more costly for firm’s insiders in a low-quality firm than in a high-quality
firm, due to the probability of default in case of bad performances (Leland and Pyle, 1977;
Ross, 1977). Shareholders are then expected to react positively to a bond issue which reveals
promising prospects for the firm’s profitability.
Second, issuing debt contributes to reduce agency costs created by conflicts of interest
between shareholders and managers. The separation of ownership and management creates
diverging objectives between shareholders and managers, and as such contributes to favor
moral hazard behavior of managers tempted to take actions that benefit themselves at the
expense of firm value. This behavior can take place through waste of firm resources or
through minimization of effort. In any case, it contributes to deteriorate firm value. However
debt financing disciplines managers. It reduces the “free cash-flow” at the disposal of
managers (Jensen, 1986): debt implies interest payment obligations that must be satisfied by
firm managers as not satisfying firm obligations would lead to bankruptcy of the firm. It also
strengthens the incentives of managers to perform well since they face personal costs in case
of firm bankruptcy (Grossman and Hart, 1982). Hence the disciplining role of debt should
favor positive stock market reaction and operating performance.
Two hypotheses can also be proposed to predict a negative influence of debt issuance on
firm performance. On the one hand, issuing debt enhances agency costs created by conflicts
of interest between shareholders and debtholders. Shareholders have incentives to act in their
interests at the expense of debtholders. This divergence of interests can appear through
6
different forms. Shareholders can favor investment in riskier projects than those preferred by
debtholders, with such “asset substitution” caused by the asymmetry of gains for shareholders
(Jensen and Meckling, 1976).
On the other hand, debt issuance increases the probability of bankruptcy for the issuing
firm. A greater leverage enhances the risk that a firm will not be able to meet its
commitments. As such, debt issuance raises the likelihood of this event which represents
losses for shareholders. But without going to the extreme situation of bankruptcy, greater
leverage also enhances the probability of financial distress and then the costs associated with
this situation.
2.2 Sukuk vs. bond issuance and firm performance: testable hypotheses
The above arguments explain how debt issuance can influence firm performance. We
now present the main reasons why sukuk issuance can exert a different impact on firm
performance than bond issuance. These reasons are related to the formerly presented
arguments and to the features of sukuk.
Differences in structuring between sukuk and bonds can influence the expectations of
stock market investors. Sukuk are vehicles for which the income given to holders is not
generated by the issuing firm but by the asset on which sukuk is backed. Then the firm does
not have interest repayment obligations and the rights of sukuk holders differ from those of
creditors.
However, in the large majority of cases sukuk flows are paid by the issuer itself. For
instance, for Ijara sukuk (rental / lease agreement), rental payments are often paid by the
issuer through a sale and lease-back (El-Gamal, 2006). Similarly, for Murabaha sukuk (cost-
plus sales), the issuer provides an income to the holders of the vehicle. In addition, the
majority of sukuk includes ex-ante defined rates of return.
Once these elements on sukuk practice are given, we can gather the motives for a
differentiated impact of sukuk issue on firm performance in three broad arguments.
First, sukuk can contribute to solve information asymmetries in a different way than
bonds. A key principle of Islamic finance is profit and loss sharing. As a consequence, Islamic
financial products are particularly sensitive to adverse selection and moral hazard behavior of
borrowers. However all forms of sukuk do not follow this ethical principle. Mudaraba and
Musharaka are partnership contracts which are fully compliant with profit and loss sharing

7
principle. Nonetheless the majority of sukuk are based on debt-like forms, with the use of
Ijara and to a lesser degree Murabaha.
However adverse selection is a major concern for partnership contracts. Profits and
losses generated by the project are shared between investors. This type of financial
instruments has advantages for firms in bad shape. Such firms have incentives to finance a
very risky project with this type of contract. Symmetrically, good issuers have incentives to
choose conventional financial contracts so that they can keep a greater share of generated
profits.
Hence sukuk issuers can be low-quality firms. As a consequence, the issuance of sukuk
would not help solving adverse selection. In other words, we should observe a negative stock
market reaction to sukuk issue relative to bond issue, and also to a negative influence of sukuk
issue on the operating performance of the issuer.
The negative market response to sukuk issue can even be strengthened by the
oversubscription of sukuk. As stressed by Godlewski, Turk-Ariss and Weill (2013), we
observe an excess demand for sukuk because of the coexistence of a strong demand from
Islamic banks looking for liquid Sharia-compliant assets and of a limited supply of these
instruments.
Second, sukuk issuance can generate different costs than bond issuance of two kinds. On
the one hand, the costs of financial distress can differ between both types of issuance. These
costs increase with debt issuance and as such contribute to a negative impact on firm
performance. In theory, sukuk holders own the underlying asset. However practice shows that
these rights can become uncertain in case of financial difficulties for the company, as pointed
out by van Wijnbergen and Zaheer (2013) in recent cases. Sukuk makes more complex the
rights of all investors during the liquidation of the company. As a consequence, costs of
financial distress can be greater for sukuk issuers than for bond issuers.
On the other hand, to issue sukuk can be more costly than a bond issuance. Sukuk
structuring requires several additional operations in comparison to the issuance of bonds. A
special purpose vehicle has to be established, which has to be managed. All in all, Storck and
Cekici (2011) have counted between twenty and thirty contractual documents for the issuance
of sukuk. Each document needs also the compliance with the law of the country but also with
shari’a, which creates greater legal costs for sukuk relative to bonds, even if financial
differences between both types of securities are minor.
8
Both sets of arguments related to different costs for issuances are then in favor of a
more negative stock market reaction following sukuk issuance than bond issuance in the short-
term but also in the medium-term.
Third, the disciplining role of debt can differ when a firm decides to issue sukuk or
bond. Some arguments support the view that the disciplining role of debt would be lower
when sukuk is issued. On the one hand, sukuk is based on the establishment of a special
purpose vehicle, which is legally independent of the issuer and does not mean tight return
obligations as these returns are generated by the assets on which sukuk is backed. On the other
hand, profit and loss sharing principle means that managers do not have obligations to pay
interest payments not related to the returns of the company, and that they do not face the same
personal costs in case of bankruptcy, given that sharing profits and losses means to risk of
bankruptcy.
Thus managers should be less disciplined by debt when sukuk are issued, which would
favor their moral hazard behavior at the expense of shareholders. As a consequence, firms
using sukuk should choose investment projects with lower returns, leading to reduced
profitability of sukuk issuers. We should also observe sukuk-issuing firms accumulating
greater free cash flows. Then the reduction of the disciplining role of debt with sukuk issue
could have a negative influence on the stock market and the operating performances of firms.
We have presented the reasons why sukuk issuance can have a different influence on the
performance of the issuing firm than bond issuance. They motivate the five following
hypotheses.
Hypothesis 1: the stock market reaction is more negative following sukuk issuance
than following bond issuance.
Hypothesis 2: sukuk issuance has a negative impact on the operating performance of
issuing firms.
Hypothesis 3: sukuk-issuing firms have worse operating performance than bond-
issuing firms.
Hypothesis 4: sukuk issuance leads to retention of free cash flows by the issuer.
Hypothesis 5: medium-term abnormal returns of sukuk issuers are lower than those of
bond issuers.

9
3. Data
We use data covering sukuk and bond issuances in Malaysia from 2002 to 2010, while
accounting and stock data span from 2001 to end 2013. Data are extracted from the
Bloomberg Professional Terminal Server (Bloomberg). The sample gathers 164 sukuk
issuances and 645 bond issuances taking place between the 1st of January 2002 and the 31st of
December 2010. By taking into account all maturities for securities on Malaysia debt market
(sukuk and bonds), we extend the sample in comparison to Godlewski, Turk-Ariss and Weill
(2013, 2016).The distribution of issues by industry and by year is displayed in Table 1. Table
2 displays descriptive statistics on our sample of securities classified by issue type. We can
point out that bonds are on average larger than sukuk, and are associated with a longer
maturity. A larger size for bond issues can be partly due to the fact that sukuk issues decrease
in recent years whereas bond issues increase. It mechanically leads to a higher nominal value
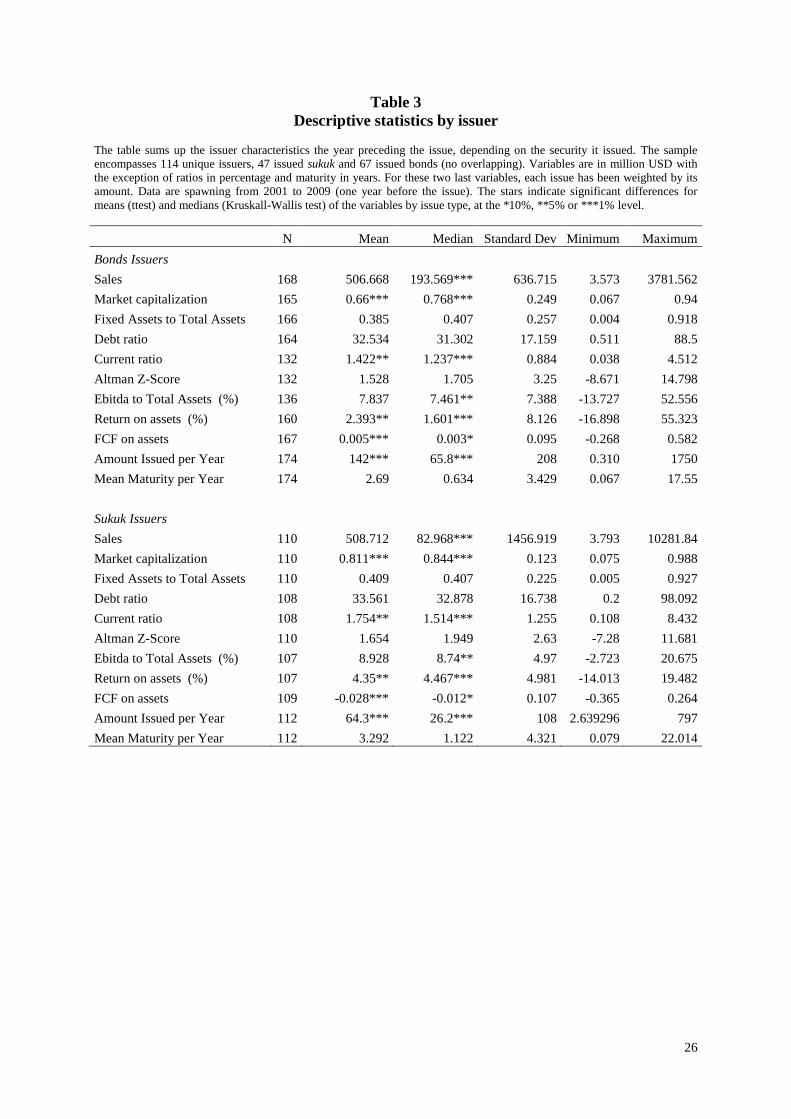
for bonds. Table 3 reports the descriptive statistics by issuer. The table reports the statistics by
considering the year preceding the issue.
We have considered a period of five years for each issue, with the year preceding the
issue, the issuance year and the three following years. To prevent any overlapping issue, the
sample encompasses only issuers that issued only bonds or sukuk over the whole period of
study. We have then a sample of 114 single issuers including 47 sukuk issuers and 67 bond
issuers. Several striking facts emerge from the comparison of both types of issuers. First,
sukuk issuers appear to have a smaller median size measured by their sales and to issue
smaller amount than bond issuers. Second sukuk issuers have a higher market capitalization
normalized to assets and a greater current ratio. Third, profitability is better for sukuk issuers.
They have greater Ebitda to total assets (median) and ROA. Fourth, sukuk issuers display
significantly lower free cash-flows. In a nutshell, the analysis of the firms issuing sukuk and
bond shows that sukuk issuers do not have a worse financial situation for the year preceding
the issue but rather tend to be in better financial shape.
4. Methodology
We perform four analyses to provide a broad view of how sukuk issue can influence
the performance of the issuing firm.
First, we study the reaction of stock market investors following the issuing of a sukuk
or a bond. In this aim, we compute the average abnormal return of the company in the days
10
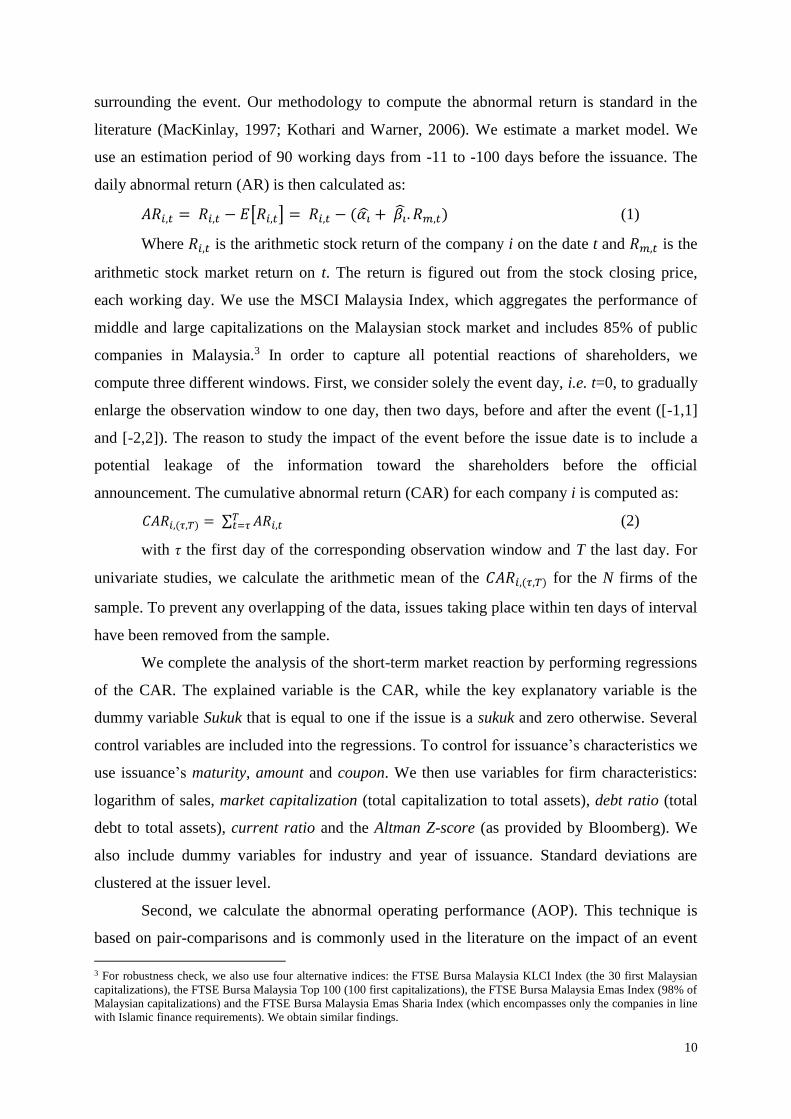
surrounding the event. Our methodology to compute the abnormal return is standard in the
literature (MacKinlay, 1997; Kothari and Warner, 2006). We estimate a market model. We
use an estimation period of 90 working days from -11 to -100 days before the issuance. The
daily abnormal return (AR) is then calculated as:
𝐴𝑅𝑖,𝑡 = 𝑅𝑖,𝑡 − 𝐸[𝑅𝑖,𝑡] = 𝑅𝑖,𝑡 − (𝛼�̂� + 𝛽�̂�. 𝑅𝑚,𝑡) (1)
Where 𝑅𝑖,𝑡 is the arithmetic stock return of the company i on the date t and 𝑅𝑚,𝑡 is the
arithmetic stock market return on t. The return is figured out from the stock closing price,
each working day. We use the MSCI Malaysia Index, which aggregates the performance of
middle and large capitalizations on the Malaysian stock market and includes 85% of public
companies in Malaysia.3 In order to capture all potential reactions of shareholders, we
compute three different windows. First, we consider solely the event day, i.e. t=0, to gradually
enlarge the observation window to one day, then two days, before and after the event ([-1,1]
and [-2,2]). The reason to study the impact of the event before the issue date is to include a
potential leakage of the information toward the shareholders before the official
announcement. The cumulative abnormal return (CAR) for each company i is computed as:
𝐶𝐴𝑅𝑖,(𝜏,𝑇) = ∑ 𝐴𝑅𝑖,𝑡𝑇𝑡=𝜏 (2)
with τ the first day of the corresponding observation window and T the last day. For
univariate studies, we calculate the arithmetic mean of the 𝐶𝐴𝑅𝑖,(𝜏,𝑇) for the N firms of the
sample. To prevent any overlapping of the data, issues taking place within ten days of interval
have been removed from the sample.
We complete the analysis of the short-term market reaction by performing regressions
of the CAR. The explained variable is the CAR, while the key explanatory variable is the
dummy variable Sukuk that is equal to one if the issue is a sukuk and zero otherwise. Several
control variables are included into the regressions. To control for issuance’s characteristics we
use issuance’s maturity, amount and coupon. We then use variables for firm characteristics:
logarithm of sales, market capitalization (total capitalization to total assets), debt ratio (total
debt to total assets), current ratio and the Altman Z-score (as provided by Bloomberg). We
also include dummy variables for industry and year of issuance. Standard deviations are
clustered at the issuer level.
Second, we calculate the abnormal operating performance (AOP). This technique is
based on pair-comparisons and is commonly used in the literature on the impact of an event
3 For robustness check, we also use four alternative indices: the FTSE Bursa Malaysia KLCI Index (the 30 first Malaysian
capitalizations), the FTSE Bursa Malaysia Top 100 (100 first capitalizations), the FTSE Bursa Malaysia Emas Index (98% of
Malaysian capitalizations) and the FTSE Bursa Malaysia Emas Sharia Index (which encompasses only the companies in line
with Islamic finance requirements). We obtain similar findings.

11
on operating performance.4 The reasoning is to match firms according to common features the
year preceding the issue and then to compare both the difference of operating performance
and its evolution the years following the issue. We consider two variables for profitability.
First, we use the Earnings before Interest, Taxes and Depreciation scaled by total assets
(Ebitda). This variable provides an indicator of operational performance before taking into
account amortization policy and extraordinary performance and the influence of financial
expenses. It then allows analyzing the impact on firm performance of bond or sukuk without
being influenced by the potential difference in financial costs between both types of
instruments. Second, we use the Return on Assets (ROA) to have an overall view of the firm
performance, following the recommendations of Barber and Lyon (1996).
To test the free cash-flow hypothesis, we use the free cash-flows to the firm scaled by
total assets (FCF). The issuers are matched in order to create homogenous couples, composed
of one firm which issued a sukuk and one which issued a bond. Following Eberhart, Maxwell
and Siddique (2004), the firms should be in the same industry and issue the debt security the
same year. Then, it should be the closest firm in terms of size (measured by total assets) the
year preceding the issuance in the sample (Nohel and Tarhan, 1998). Last, the couple is
matched according to Ebitda the year preceding the issuance, since this indicator of
performance is not polluted by past financial performances. For each criterion, the matching is
carried out by minimizing the squared difference of the variable between both groups of firms
(sukuk or bond issuers).
When the pairs are formed, the abnormal operating performance (AOP) of a sukuk
issuer is the difference between its performance and its expected performance, i.e. the
performance of its matched firm (who issued a bond). To capture growth dynamics, we follow
Barber and Lyon (1996) who advocate to use the difference of the variation of performance.
In this case, the expected operating performance (OP) of the firm i the year y becomes :
𝐸(𝑂𝑃𝑖,𝑦) = 𝑂𝑃𝑖,𝑦−1 + (𝑂𝑃𝑗,𝑦 − 𝑂𝑃𝑗,𝑦−1 ) = 𝑂𝑃𝑖,𝑦−1 + ∆𝑂𝑃𝑗,𝑦 (3)
with j the matched firm (who issued a bond).
We generate a cumulative abnormal operating performance (CAOP) depending on the
number of years following the event we were screening, namely up to three years. We
compute both the mean and the median of AOP. This choice is motivated by the common
observation in the literature that the median is more appropriate than the mean for the results
4 See among others Barber and Lyon (1996), Lie (2001), Eberhart, Maxwell, and Siddique (2004), Williams and Tang (2009) and Lemmon et al. (2014).

12
given the dissymmetry of the distribution of performance indicators (Barber and Lyon, 1996;
Eberhart, Maxwell and Siddique, 2004; Lie, 2001).
Third, we analyze how issuance of sukuk and bonds can influence the operating
performance of issuing firms. To do so, we perform panel regressions with random effects of
the three operating performance indicators: Ebitda, ROA, and FCF. We cluster standard
deviations at the issuer level. To study all the potential effects of the type of issue on the firm,
we use all these variables from one to three years after the issue. As stressed by Williams and
Tang (2009), the effects of an event may take some time to occur. To examine potential
variation effects, we also compute the cumulative variations of these indicators during the
three years following the event.5 Thus we use accounting data spanning from 2001 (one year
before issues for 2002) to 2013 (three years after issues for 2010). The key independent
variable is Sukuk defined as a dummy variable equal to one in the case of a sukuk issuer and
zero otherwise. We use the same set of control variables at the firm level than for explaining
the CAR. We also add the total amount issued by the firm and the mean maturity for the
corresponding year. Last, we include dummies to control for the sectors and years.
Fourth, we examine the medium-term abnormal stock returns of firms. We investigate
if the immediate reaction of stock market investors is persistent over time, but also if the
medium-term stock market performance of firms is consistent with their operating
performance. We compute the buy-and-hold abnormal returns (BHAR) following the
methodology of Lyon, Barber, and Tsai (1999). It was used by Ahmad-Zaluki and Wan-
Hussin (2010), Ahmad-Zaluki and Wan-Hussin (2010) and How et al. (2007) among others.
The BHAR can be defined as the difference between the realized and expected buy-and-hold
benchmark. The BHAR of a firm i on the period (τ,T) is defined as:
𝐵𝐻𝐴𝑅𝑖,(𝜏,𝑇) = [∏ (1 + 𝑅𝑖,𝑡) − 1𝑇𝑡=𝜏 ] − [∏ (1 + 𝐸(𝑅𝑖,𝑡)) − 1𝑇
𝑡=𝜏 ] (4)
Where 𝑅𝑖,𝑡 is the arithmetic return of the firm i on the date t and 𝐸(𝑅𝑖,𝑡) = 𝑅𝑚,𝑡, i.e.
the arithmetic return of the market portfolio on the date t. The same indices than those
adopted for computing CAR have been used to proxy the market portfolio. We define three
observation periods (τ,T): (0,252), (0,504) and (0,756), namely one, two and three years in
working days after the announcement date. We compute these returns relative to the MSCI
Malaysia Index. Again, for the univariate analysis, we calculated the arithmetic mean of the
𝐵𝐻𝐴𝑅𝑖,(𝜏,𝑇) for the N firms of the sample. As for CAR, we perform regressions of BHAR
with clustered standard errors at the issuer level to provide multivariate results.
5 For instance, the cumulative variation of the ROA of the firm i is generated as ∆𝑅𝑂𝐴𝑖 = ∑ (3
𝑦=0 𝑅𝑂𝐴𝑖,𝑦 − 𝑅𝑂𝐴𝑖,𝑦−1), with
y = 0 the year of the issue.

13
5. Results
5.1 Short-term stock market reaction
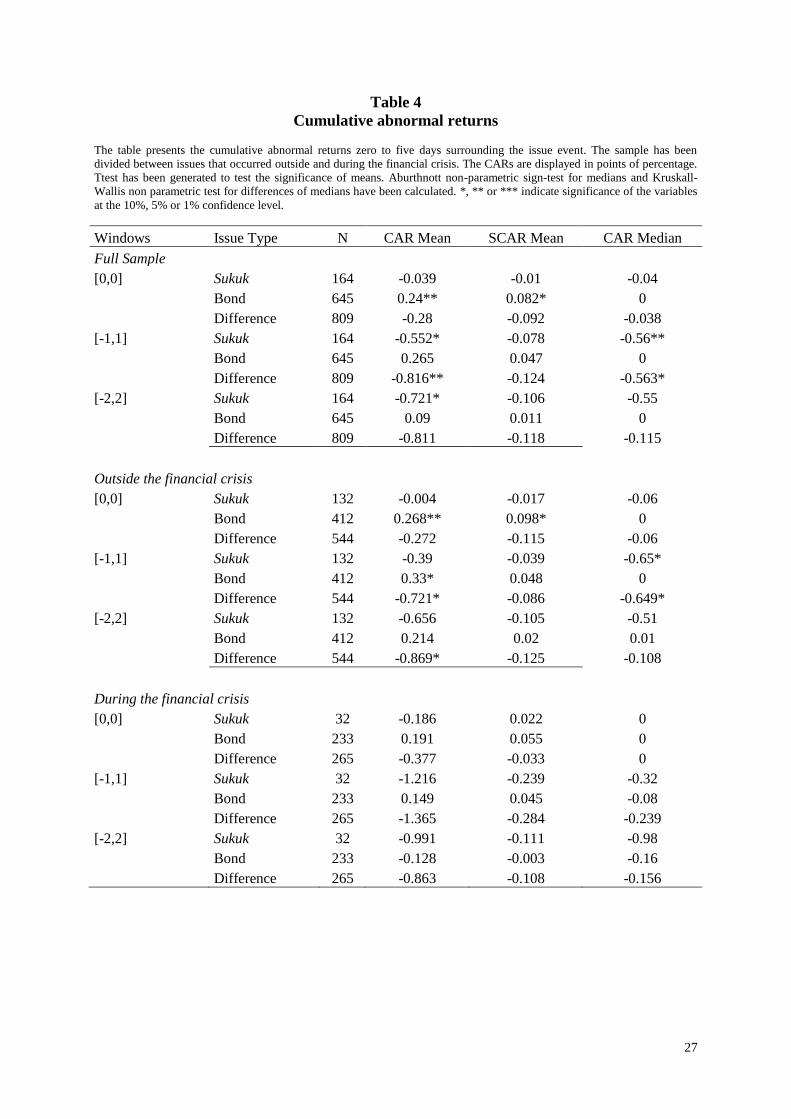
We begin the analysis by examining the stock market reaction to sukuk and bond
issuance announcement. Table 4 displays the mean and median CAR by type of security issue
(sukuk or bond). The analysis of the results for the full sample shows that the mean and
median CARs of sukuk issues are significantly negative for all event windows, with the
exception of the event window [0,0] for which the mean CAR is negative but not significant.
In the case of bond issues, the mean CAR is not significant or significantly positive depending
on the event window. These first results tend to suggest a more detrimental market response
for sukuk issues than for bond issues which accords with evidence from Godlewski, Turk-
Ariss and Weill (2013).
We then check if the stock market reaction is significantly different for a sukuk issue
and a bond issue. The difference is always negative for all event windows and significantly
negative for the event windows [-1,1] Hence these results tend to show that the stock market
investors react differently to the type of issue.
To gain further insight, we examine if the stock market reaction to sukuk and bond
issues is influenced by the period of study. Namely, our period includes the financial crisis as
it goes from 2002 to 2010. We define the crisis period as year 2008 and 2009 in line with the
fall of Malaysian GDP during both years. The results are displayed by splitting the full sample
between both periods. We find a major difference between both periods. Before the crisis we
find again that the difference is significantly negative between sukuk and bond issues in most
cases. However during the crisis, we cannot conclude to a different perception of investors of
both types of issues. Even if the difference is negative, it is not significant in all cases.
Thus our findings support the view that stock market investors have a different
perception of sukuk and bond issues. Investors appear to be reluctant to invest in sukuk issuers
in favor of firms opting for bond. Thus, a sukuk issuance consists in a particularly bad signal
for investors.
We complete the analysis of the market response to sukuk and bond announcements by
performing regressions of the CAR. The explained variables are the CAR[-1,1] and the CAR[-
2,2], while the key explanatory variable is the dummy variable Sukuk that is equal to one if the
issue is a sukuk and zero otherwise.

14
The results are presented in Table 5. When the full period is considered, Sukuk is
negative and significant for both windows. So we can conclude to a different perception of
stock market investors to sukuk and bond issues even once issuer and issue characteristics are
controlled.
The results by distinguishing before and during the crisis do not provide any new
insight. Sukuk is negative but not significant when dividing the sample between the issuance
occurring during and outside the crisis. Stock market investors do not appear to react
differently within or outside the financial crisis.6
Thus, the main conclusion of the analysis of the short-term reaction of stock markets is
that sukuk issues lead to a negative reaction significantly different than bond. This conclusion
is broadly supportive of the results reported by Godlewski, Turk-Ariss and Weill (2013) who
find that the stock market reaction to sukuk issues can be negative. We then provide support to
Hypothesis 1 according to which the stock market has a more negative reaction to sukuk
issues than to bond issues.
5.2 Abnormal operating performance
We investigate how issuance of a sukuk or a bond can influence operating
performance of comparable firms by computing abnormal operating performance (AOP)
measures. We create homogenous pairs by matching sukuk and bond issuing firms one by
one.
We have to remind that the use of AOP provides very different insights than the
regressions of operating performance indicators when it comes to examine the impact of
sukuk issuance. Regressions provide information on the impact after t years of sukuk issuance
on operating performance. With AOP, we are able to analyze the difference in the joint
evolution of two firms, with one issuing sukuk and the other issuing bond, with similar
characteristics over the years. AOP then informs on the evolution over time of the operating
performance of a sukuk issuer relative to similar firms and not only on the impact of sukuk
issuance on operating performance. We can have a sukuk issuer performing better than its
matched bond issuer, while at the same time we do not observe a positive link between sukuk
issuance and operating performance, as regressions do not match similar firms.
6 We use a more conservative definition of outside financial crisis by removing the issues which occurred after
the crisis (i.e. in 2010). It does not change the results.

15
Table 6 displays the results for the mean and median cumulative abnormal operating
performance (CAOP) for the three years following the issue. The results are in percentage
points for the difference with the matched firm, with a positive figure meaning a better
performance of the sukuk-issuing firm. We use the Student test of mean and the non-
parametric Wilcoxon test of median to check the significance of the difference. Two
noteworthy results emerge.
First, we find support for a better performance of sukuk issuers relative to their
matched firms. When considering AOP for one year to three years, we observe significantly
better performance for sukuk issuers with ROA However, sukuk do not outperform bond
issuers on operating performance with a non-significant difference in Ebitda. Second, we
observe that sukuk issuers tend to have slightly higher (median) free cash flows than bond
issuers.
Thus the main conclusion emerging from these results is the overall better operating
performance for sukuk issuers than for firms issuing bonds. Moreover sukuk issuers appear to
retain slightly more free cash flows.
Our results are based on the standard expectancy. However this computation mode is
associated with inertia and does not allow detecting a slowdown in performance. A firm
outperforming others can then be interpreted or considered as keeping or increasing the gap in
performance. Following Barber and Lyon (1996), we consider next the difference of the
variation in performance to take this issue into account.
We present also these results in Table 6. The main finding is the incremental reduction
of the median difference for the variation in Ebitda and ROA during the second and third
years following the issue. If sukuk issuers perform better than bond issuers, the difference in
operating performance gradually decreases over time. Sukuk seems to act as if it slows down
growth of Ebitda and ROA. On the contrary, the FCF increases during the second year,
underlying once more some retention issues.
We can then provide a first explanation of the negative stock market reaction
following sukuk issuance. Investors react negatively to the expected slowdown of
performance resulting from the use of sukuk by firms, while the better performance of these
firms issuing sukuk has already been reflected in their stock prices.
Our findings on AOP may also be influenced by the period of study. Namely the
financial crisis can have influenced the impact of sukuk issuance on operating performance.
As a consequence, we examine if the findings on AOP stand for both periods before and

16
during the crisis. We then compare the mean and median results for both periods. We define
sukuk issuance to take place during the crisis if the issuance takes place in 2008 or 2009
again.
Our first finding of a better performance (ROA) of sukuk issuers relative to their
matched firms is observed outside the crisis and during the crisis. As for the full sample,
Ebitda proves to be non-significant. Our second finding is higher free cash flows for sukuk
issuers the third year during the crisis. As for the full sample, we find no significant difference
before the crisis.
We also compare the results for the variation in performance before and during the
crisis to check if the dynamics of these indicators has changed between both periods. The
main finding over the period was the incremental reduction of the median difference for the
variation in ROA during the three years following the issue. We find evidence in favor of this
result for the years outside the crisis. The positive gap in ROA for sukuk issuers is gradually
reduced over time and the Ebitda is reducing too. However, during the crisis, the gap of the
Ebitda is increasing, even if it eventually does not lead to a higher variation of ROA. Last, the
gap of free cash-flows is widening outside the financial crisis.
All in all, our main findings on AOP, i.e. outperforming sukuk issuers are not
influenced by the period of the study. They seem rather consistent over time and are not
strongly affected by the financial crisis. On the other hand, the variation of the gaps is mainly
driven by years outside the crisis period.
These findings do not contradict the observation of a better performance for sukuk
issuers. They only show that this gap in performance is reduced over time following the
issuance. This event seems to act as an obstacle for issuers to increase their performance.
The better performance we observe for sukuk issuers should not be overinterpreted.
The computation of abnormal returns does not show better performance caused by sukuk
issuance. The advantage in performance appears to exist before the issuance. Indeed, sukuk
issuers present a higher ROA the year preceding the issuance and a higher Ebitda the year of
the issuance. However the reduction of this gap in performance only occurs the years further
to the issuance underlying a potential effect of sukuk issuance on the firm.
The fact that we observe a better operating performance for sukuk issuers is a finding
of particular interest. As highlighted by Kuran (2004) and Godlewski, Turk-Ariss and Weill
(2013), sukuk issuers could be less-healthy firms which prefer sukuk in the form of profit-and-
loss sharing financing schemes over bond. The argument is that companies with low profit
expectations do not opt for bonds with fixed repayments. Our evidence rejects the hypothesis

17
that firms in poor financial situation tend to prefer sukuk. Firms opting for sukuk are not the
ones with worse financial condition. We even tend to find that they are in better financial
situation than those opting for bonds when we compute AOP.
However the choice to issue sukuk contributes to deteriorate their short-term stock
market performance and even their operating performance. We can then question the reasons
of this choice, as they would have incentives to opt for bonds so that they can signal their
better quality. We attribute this behavior to an adverse selection mechanism taking place on
the projects and not on the issuing firms. Namely, firms with low-return project have
incentives to opt for sukuk to finance this project because of the profit and loss sharing
principle. As such, the use of sukuk would deteriorate the operating performance of the issuer.
From the stock market perspective, the expectation that issuing sukuk will contribute to
reduce operating performance leads to a negative stock market reaction.
Hence we reject Hypothesis 3 according to which sukuk-issuing firms have better
operating performance than those opting for bonds. However, we support Hypothesis 4 that
issuing sukuk would lead to retention of free cash flows by the issuers.
5.3 Operating performance
We have shown that stock market investors react differently to the announcements of
sukuk and bond issues. To determine the interpretations of this finding, we investigate the
impact of issuances of sukuk and bonds on operating performance of firms. We want to
analyze if the stock market reaction is motivated by the expected impact of security issue on
operating performance of the issuing firm. To this end, we perform regressions of operating
performance measures. We consider the operating performance of the issuer 1, 2, or 3 years
after the issue. We also examine the variation of the three indicators of operating performance
between the year of issuance and three years later. We report the results of the estimations in
Table 7 for performance indicators and Table 8 for free cash-flows.
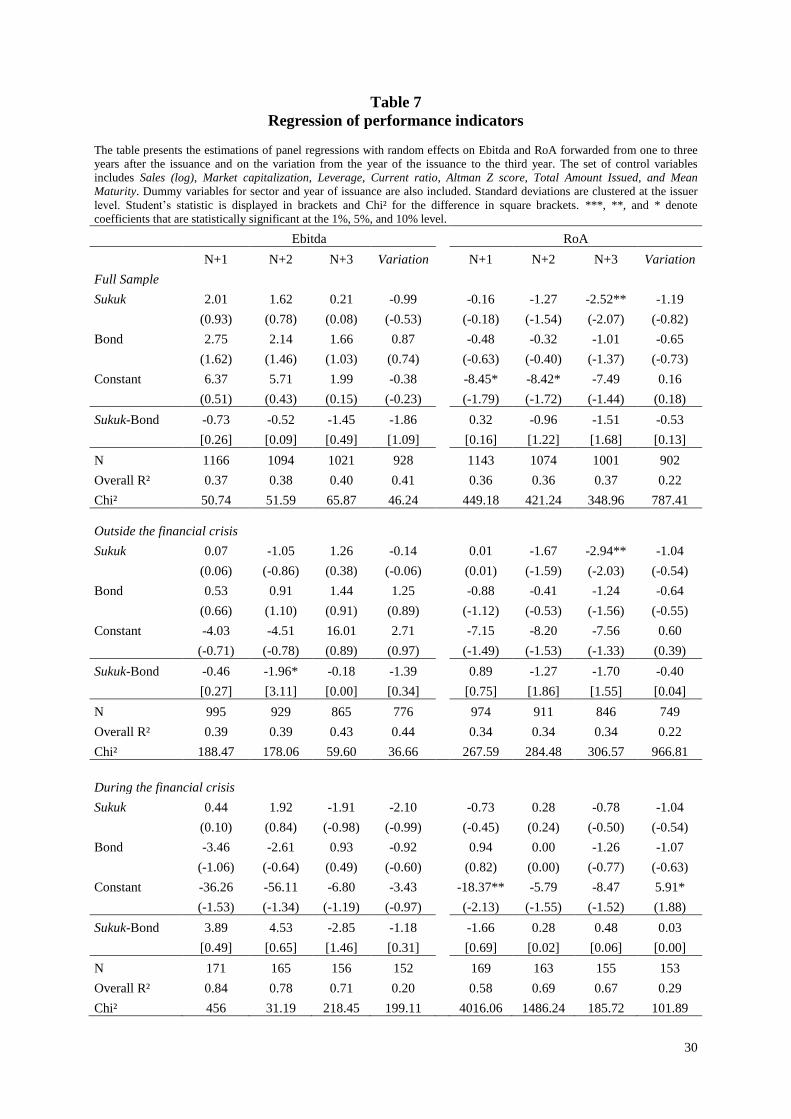
Our main finding is that sukuk issuance tends to hamper operating performance. Sukuk
coefficient has a negative and significant impact on ROA the third year following the
issuance. We dig deeper this question by considering separately the periods before and during
the crisis. We aim to check if the impact of sukuk issuance on operating performance differs
with the period. We observe that the result of a significant and negative influence of Sukuk
when explaining ROA only stands for the period outside the financial crisis. During the crisis,
the effect proves to be non-significant.

18
To compare sukuk impact on performance with bonds’ impacts, we also include in the
panel regression a dummy for bond issuers and calculate the difference in coefficients. Bond
issuance does not hamper operating performance. Moreover the difference in the impact of
sukuk and bond on Ebitda is significantly negative for sukuk the second year outside the crisis.
It appears that sukuk issuance tends to hamper operating performance whereas bond issuance
does not exert any impact.
We also investigate the impact of sukuk issuance on free cash-flows. These results are
displayed in Table 8. Sukuk issuance significantly increases free cash-flows of the firm the
second and third year following an issuance. Moreover, it also fosters the pace of free cash-
flows’ retention over the three year. Once more, these results hold for the period outside the
financial crisis.
The difference of sukuk and bond issuances impact on free cash-flow also proves to be
significantly positive on the full sample. Sukuk issuance appears to increase cash-flows’
retention whereas bond issuance does not impact free cash-flows.
Thus our main conclusion is that sukuk issuance hampers the operating performance of
the issuer and generates retention of free cash-flows. Hypothesis 2 according to which it
should deteriorate this performance is supported. Hypothesis 4 assuming that sukuk issuance
generates retention of free cash flows by the issuer is also accepted.
5.4 Medium-term stock market reaction
To shed light on the impact of sukuk issuance on the medium-term stock performance,
we use the buy-and-hold abnormal returns. This method is based on the measurement of the
stock return of a firm to which we subtract the return of the market portfolio over a certain
period. We consider three observation periods, namely one, two, and three years after the
announcement.
Table 9 displays the medium-term abnormal returns. We observe significantly
negative returns for sukuk issuers and significantly positive returns for bond issuers. More
precisely, the abnormal return for a bond issue is positive and significant during the three
years following the issue. For a sukuk, the abnormal return is negative on the second and third
years. The difference in medium-term abnormal returns between sukuk and bonds appears to
be significant over the whole period. The underperformance of sukuk issuers lasts for the three
years following the issuance. Thus, the medium-term reaction of stock markets tends to be

19
similar to the short-term one: sukuk issuance generates a detrimental market response and
firms perform worse than their counterparts for both horizons.
We interpret this result by the fact that sukuk issuers have a better operating
performance but lowering over time, due to sukuk issuance. On the contrary, their greater
operating performance the year preceding the issuance is already incorporated in their stock
price. Hence, sukuk issuers have a negative stock market performance the years following the
issuance.
We extend the analysis of medium-term abnormal returns by considering separately
issuances taking place before and during the financial crisis. We observe that the results in
difference are essentially the same outside and during the financial crisis.
A striking result is that the abnormal returns comparing to the market index are no
longer significant for sukuk issuers during the financial crisis. We interpret it as the
consequence of the strong decline of the index during the financial crisis. The difference
between both issuers is however much higher than during the rest of the period, since bond
issuers substantially outperform the index during the crisis. This finding is robust, as we
observe it for the mean and for the median, and it persists for all three years of study.
This negative reaction suggests that stock market investors sanction Islamic financial
whatever the period: they dislike it in normal time and prefer bond issuers during the financial
crisis. This behavior may be driven by the peculiarity of these instruments.
These results are of particular interest for the debate on the resilience of Islamic
finance during the financial crisis. Ho et al. (2014) finds evidence in favor of better resilience
of Islamic finance during that period. This study is based on Islamic indices which have the
key feature of including companies with low indebtedness. As a consequence, this dimension
makes them more resilient in period of financial difficulties. However the majority of these
companies do not participate actively to Islamic finance. The fact to belong to an Islamic
index does not require some specific efforts of companies. In opposition, our study uses a
sample of companies which have made a financial decision specifically Islamic by issuing
sukuk. These companies have seen their stock returns shrinking with the crisis significantly
more than the bond-issuing companies. Our results then complete those from Girard and
Kabir Hassan (2008) who do not find any significant difference between Islamic indices and
conventional indices.

20
We complete our univariate analysis with regressions of medium-term abnormal
returns to check the robustness of our findings. The results are reported in Table 10. We
obtain the same conclusions than for the univariate analysis. We find that the decision to issue
sukuk does exert a significant negative impact on the returns the second and third years over
the full period and outside the financial crisis. Hence, sukuk issuance proves to be detrimental
to firm’s stock performance, even when firm’s and issuance’s characteristics are taken into
account.
The study of medium-term abnormal returns then provides support to the view that the
medium-term stock market reaction to sukuk issuance is negative relative to bond issuance.
Thus we find evidence to support Hypothesis 5 according to which sukuk issuers are lower
medium-term abnormal returns than bond issuers.
6. Conclusion
In this paper we examine how sukuk issuance influences firm performance. We consider
the impact on stock market and operating performances to provide a broad perspective of the
effects of issuing sukuk.
We obtain several findings. First, we find that sukuk issuance generates a negative stock
market reaction. We observe this conclusion for both the short-term and the medium-term
stock market reaction. This result is consistent with the negative short-term market response
found by Godlewski, Turk-Ariss and Weill (2013), but completes it for the medium-term
horizon.
Second, we find that sukuk are issued by more profitable firms. However this better
financial situation cannot be the result of the sukuk issue. Sukuk issuers are more profitable
before the issue while the issuance lowers their operating performance. We also observe that
sukuk issuers do not hold excessive free cash-flow before the issue but that sukuk issuance
leads to retention of free cash-flows by the firm. Why would such firms take then the risk to
issue sukuk and not to opt for bond to signal their quality and avoid bad performance? An
interpretation is that slowdown companies without new outperforming investment projects
head toward sukuk. The reason can be the oversubscription of these Islamic instruments, and
the use of special purpose vehicle which does not directly hamper issuer’s balance sheet if the
project turns to be defective. An additional interpretation is the role of sukuk structuring
which diminishes profitability of projects by enhancing costs and moral hazard through
21
retention of free cash-flows. In either case sukuk is a bad signal: it signals losing speed firms,
with moral hazard issues and/or flawed projects or future flawed projects.
From a positive perspective, we contribute to have a better understanding of the reasons
of the negative stock market reaction following sukuk issuance observed in the literature
(Godlewski, Turk-Ariss and Weill, 2013). Our findings support the view that adverse
selection does not take place at the firm level but at the investment project level. Namely
sukuk are issued by losing speed firms with less profitable investment projects. These firms
might hope that their positive financial reputation will cover this peculiar choice of debt.
Thus, issuing a sukuk does signal this specific type of firm. Moreover, issuing sukuk directly
hampers firm performance and increases agency problems. These effects can be attributed to
the peculiar features of these instruments. All in all, our findings contribute to understand the
implications of sukuk issuance and then of the expansion of sukuk markets.

22
References
Ahmad-Zaluki, N., and W. Wan-Hussin, 2010. Corporate Governance and Earnings Forecasts
Accuracy, Asian Review of Accounting 18, 50–67.
Barber, B., and J. Lyon, 1996. Detecting Abnormal Operating Performance: The Empirical
Power and Specification of Test Statistics, Journal of Financial Economics 41, 359–
399.
Brown, S., and J. Warner, 1980. Measuring Security Price Performance, Journal of Financial
Economics 8, 205–258.
Brown, S., and J. Warner, 1985. Using Daily Stock Returns: The Case of Event Studies,
Journal of Financial Economics 14, 3–31.
Di Mauro, F., Caristi, P., Couderc, S., Di Maria, A., Ho, L., and B. Kaur Grewal, 2013.
Islamic Finance in Europe. Occasional Paper Series No. 146. European Central Bank.
Eberhart, A., Maxwell, W., and A. Siddique, 2004. An Examination of Long-Term Abnormal
Stock Returns and Operating Performance Following R&D Increases, Journal of
Finance 59, 623–650.
El-Gamal, M., 2006. Islamic Finance: Law, Economics, and Practice. Cambridge University
Press.
Fuller, K., J. Netter, and M. Stegemoller, 2002. What Do Returns to Acquiring Firms Tell Us?
Evidence from Firms That Make Many Acquisitions, Journal of Finance 57, 1763–
1793.
Girard, E. and M. Kabir Hassan, 2008. Is There a Cost to Faith-Based Investing: Evidence
from FTSE Islamic Indices, Journal of Investing 17, 112-121.
Godlewski, C.J., R. Turk-Ariss, and L. Weill, 2013. Sukuk vs. Conventional Bonds: A Stock
Market Perspective, Journal of Comparative Economics 41, 745–761.
Godlewski, C.J., R. Turk-Ariss, and L. Weill, 2016. Do the Type of Sukuk and Choice of
Shari’a Scholar Matter? Journal of Economic Behavior and Organization,
forthcoming.
Grossman, S. and O. Hart, 1982. Corporate Financial Structure and Managerial Incentives, in
J. McCall, The Economics of Information and Uncertainty, University of Chicago
Press, Chicago.
Ho, C., Rahman, N., Yusuf, M. and Z. Zamzamin, 2014. Performance of Global Islamic
versus Conventional Share Indices: International Evidence, Pacific-Basin Finance
Journal 28, 110-121.

23
How, J., R. Jelic, B. Saadouni, and P. Verhoeven, 2007. Share Allocations and Performance
of KLSE Second Board IPOs, Pacific-Basin Finance Journal 15, 292–314.
Jensen, M., 1986. Agency Costs of Free Cash Flow, Corporate Finance, and Takeovers,
American Economic Association Papers and Proceedings 76, 323-329.
Jensen, M. and W. Meckling, 1976. Theory of the Firm: Managerial Behavior, Agency Costs,
and Capital Structure, Journal of Financial Economics 3, 305-360.
Kothari, S., and J. Warner, 2006. Econometrics of Event Studies, Handbook of Empirical
Corporate Finance 1, 3–36.
Kuran, T., 2004. Islam and Mammon: The Economic Predicaments of Islamism (Princeton
University Press).
Kuwait Finance House, 2014. Islamic Finance Outlook 2014, January 2014.
Leland, H., and D. Pyle. 1977. Information Asymmetries, Financial Structure and Financial
Intermediation, Journal of Finance 32, 371-387.
Lemmon, M., L.X. Liu, M. Q. Mao and Nini, G., 2014, Securitization and Capital Structure in
Nonfinancial Firms: An Empirical Investigation, Journal of Finance 69, 4, 1787-1825.
Lie, E., 2001. Detecting Abnormal Operating Performance: Revisited, Financial Management
30, 77–91.
Lyon, J., B. Barber, and C. Tsai, 1999. Improved Methods for Tests of Long-Run Abnormal
Stock Returns, Journal of Finance 54, 165–201.
MacKinlay, A., 1997. Event Studies in Economics and Finance, Journal of Economic
Literature 35, 13–39.
Nohel, T., and V. Tarhan, 1998. Share Repurchases and Firm Performance: New Evidence on
the Agency Costs of Free Cash Flow, Journal of Financial Economics 49, 187–222.
Ross, S., 1977. The Determination of Financial Structure: The Incentive Signalling Approach,
Bell Journal of Economics 8, 23-40.
Storck, M. and I. Cekici, 2011. Les Sukuk: Aspects de Droit Français et de Droit Musulman,
Revue de Droit Bancaire et Financier 2, 38-42.
Van Wijnbergen, S. and S. Zaheer, 2013. Sukuk Defaults: On Distress Resolution in Islamic
Finance, Tinbergen Institute Discussion Paper 13-087/VI.
Williams, J., and A. Tang, 2009. Private Placements of Convertible Securities: Stock Returns,
Operating Performance and Abnormal Accruals, Accounting & Finance 49, 873–899.

24
Table 1
Sample distribution of issuances by industry and by year
The table gives the composition of the sample by industry and by year.
Bonds Sukuk
Years
2002 3 2
2003 8 5
2004 47 11
2005 70 22
2006 79 42
2007 99 37
2008 90 23
2009 143 9
2010 106 13
Sectors
Basic Materials 29 15
Communications 18 0
Consumer, Cyclical 62 43
Consumer, Non-cyclical 116 8
Diversified 30 3
Energy 4 0
Financial 231 45
Industrial 133 47
Utilities 22 3
Total 645 164

25
Table 2
Descriptive statistics by issue type
The table provides the mean, median, standard deviation, minimum and maximum of issuances in the sample. Amount issued
is in USD, issue price and coupon are in percent of the nominal, and maturity is in years. If the issuance includes several
tranches, the amounts have been aggregated and the issue price, coupon and maturity have been aggregated with each tranche
weighted by the amount of the tranche to the amount of the issue. The stars indicate significant differences for means (ttest)
and medians (Kruskall-Wallis test) of the variables by issue type, at the *10%, **5% or ***1% level.
N Mean Median Standard Dev Minimum Maximum
Sukuk issuances
Amount issued 164 26,700,000 7,406,357** 62,200,000 789,473.7 594,000,000
Issue price 94 97.697 98.984 9.559 6.802 100
Coupon 164 1.515*** 0*** 2.618 0 8.805
Maturity 164 2.172*** 0.499*** 3.705 0.068 22.014
Bond issuances
Amount issued 645 28,100,000 11,500,000** 63,400,000 293,599.5 718,000,000
Issue price 274 98.443 99.118 6.443 26.316 100
Coupon 645 0.578*** 0*** 1.677 0 7.7
Maturity 645 0.83*** 0.249*** 1.959 0.077 17.55
26
Table 3
Descriptive statistics by issuer
The table sums up the issuer characteristics the year preceding the issue, depending on the security it issued. The sample
encompasses 114 unique issuers, 47 issued sukuk and 67 issued bonds (no overlapping). Variables are in million USD with
the exception of ratios in percentage and maturity in years. For these two last variables, each issue has been weighted by its
amount. Data are spawning from 2001 to 2009 (one year before the issue). The stars indicate significant differences for
means (ttest) and medians (Kruskall-Wallis test) of the variables by issue type, at the *10%, **5% or ***1% level.
N Mean Median Standard Dev Minimum Maximum
Bonds Issuers
Sales 168 506.668 193.569*** 636.715 3.573 3781.562
Market capitalization 165 0.66*** 0.768*** 0.249 0.067 0.94
Fixed Assets to Total Assets 166 0.385 0.407 0.257 0.004 0.918
Debt ratio 164 32.534 31.302 17.159 0.511 88.5
Current ratio 132 1.422** 1.237*** 0.884 0.038 4.512
Altman Z-Score 132 1.528 1.705 3.25 -8.671 14.798
Ebitda to Total Assets (%) 136 7.837 7.461** 7.388 -13.727 52.556
Return on assets (%) 160 2.393** 1.601*** 8.126 -16.898 55.323
FCF on assets 167 0.005*** 0.003* 0.095 -0.268 0.582
Amount Issued per Year 174 142*** 65.8*** 208 0.310 1750
Mean Maturity per Year 174 2.69 0.634 3.429 0.067 17.55
Sukuk Issuers
Sales 110 508.712 82.968*** 1456.919 3.793 10281.84
Market capitalization 110 0.811*** 0.844*** 0.123 0.075 0.988
Fixed Assets to Total Assets 110 0.409 0.407 0.225 0.005 0.927
Debt ratio 108 33.561 32.878 16.738 0.2 98.092
Current ratio 108 1.754** 1.514*** 1.255 0.108 8.432
Altman Z-Score 110 1.654 1.949 2.63 -7.28 11.681
Ebitda to Total Assets (%) 107 8.928 8.74** 4.97 -2.723 20.675
Return on assets (%) 107 4.35** 4.467*** 4.981 -14.013 19.482
FCF on assets 109 -0.028*** -0.012* 0.107 -0.365 0.264
Amount Issued per Year 112 64.3*** 26.2*** 108 2.639296 797
Mean Maturity per Year 112 3.292 1.122 4.321 0.079 22.014
27
Table 4
Cumulative abnormal returns
The table presents the cumulative abnormal returns zero to five days surrounding the issue event. The sample has been
divided between issues that occurred outside and during the financial crisis. The CARs are displayed in points of percentage.
Ttest has been generated to test the significance of means. Aburthnott non-parametric sign-test for medians and Kruskall-
Wallis non parametric test for differences of medians have been calculated. *, ** or *** indicate significance of the variables
at the 10%, 5% or 1% confidence level.
Windows Issue Type N CAR Mean SCAR Mean CAR Median
Full Sample
[0,0] Sukuk 164 -0.039 -0.01 -0.04
Bond 645 0.24** 0.082* 0
Difference 809 -0.28 -0.092 -0.038
[-1,1] Sukuk 164 -0.552* -0.078 -0.56**
Bond 645 0.265 0.047 0
Difference 809 -0.816** -0.124 -0.563*
[-2,2] Sukuk 164 -0.721* -0.106 -0.55
Bond 645 0.09 0.011 0
Difference 809 -0.811 -0.118 -0.115
Outside the financial crisis
[0,0] Sukuk 132 -0.004 -0.017 -0.06
Bond 412 0.268** 0.098* 0
Difference 544 -0.272 -0.115 -0.06
[-1,1] Sukuk 132 -0.39 -0.039 -0.65*
Bond 412 0.33* 0.048 0
Difference 544 -0.721* -0.086 -0.649*
[-2,2] Sukuk 132 -0.656 -0.105 -0.51
Bond 412 0.214 0.02 0.01
Difference 544 -0.869* -0.125 -0.108
During the financial crisis
[0,0] Sukuk 32 -0.186 0.022 0
Bond 233 0.191 0.055 0
Difference 265 -0.377 -0.033 0
[-1,1] Sukuk 32 -1.216 -0.239 -0.32
Bond 233 0.149 0.045 -0.08
Difference 265 -1.365 -0.284 -0.239
[-2,2] Sukuk 32 -0.991 -0.111 -0.98
Bond 233 -0.128 -0.003 -0.16
Difference 265 -0.863 -0.108 -0.156

28
Table 5
Regression of cumulative abnormal returns
The table presents the estimations of OLS regressions of cumulative abnormal returns (CAR). Dummy variables for sector
and year of issuance are also included but not reported. Standard deviations are clustered at the issuer level. The sample is
divided between issues that occurred outside and during the financial crisis. Student’s statistic is displayed in brackets. ***,
**, and * denote coefficients that are statistically significant at the 1%, 5%, and 10% level.
CAR[-1,1] CAR[-2,2]
Full Sample
Outside Crisis
During Crisis Full
Sample
Outside
Crisis
During
Crisis
Sukuk -0.55** -0.36 -1.19 -0.68** -0.50 -0.19
(-2.35) (-1.39) (-1.44) (-2.05) (-1.15) (-0.18)
Amount issued -0.006* -0.007* -0.004 -0.006** -0.004 -0.008**
(-1.98) (-1.95) (-0.99) (-2.18) (-0.87) (-2.32)
Coupon -0.09 0.01 -0.43 -0.18 -0.10 -0.18
(-0.98) (0.12) (-0.66) (-1.66) (-0.68) (-0.32)
Maturity 0.04 0.01 0.13 0.12* 0.08 0.08
(0.62) (0.18) (0.31) (1.83) (1.12) (0.22)
Sales (log) -0.04 0.17 -0.35 -0.03 0.02 -0.32
(-0.32) (1.44) (-0.57) (-0.22) (0.13) (-0.55)
Market capitalization 1.32 4.61** -2.93 -1.02 0.60 1.31
(0.49) (2.25) (-0.21) (-0.37) (0.21) (0.09)
Debt ratio -0.00 -0.01 0.01 0.01 0.01 -0.03
(-0.23) (-0.31) (0.23) (0.22) (0.36) (-0.64)
Current ratio -0.04 -0.31 1.10 0.12 -0.06 0.74
(-0.24) (-1.60) (0.85) (0.59) (-0.27) (0.60)
Altman Z score 0.19*** 0.23*** 0.37** 0.23** 0.28* 0.18
(3.68) (3.03) (2.21) (2.03) (1.93) (1.04)
Constant 1.02 -2.02 2.46 4.20* 3.84 -1.01
(0.42) (-0.91) (0.24) (1.73) (1.40) (-0.10)
Sectors Fixed Effects Yes Yes Yes Yes Yes Yes
Years Fixed Effects Yes Yes Yes Yes Yes Yes
N 697 490 207 697 490 207
Nb of Issuers (clusters) 65 61 22 65 61 22
R² 0.02 0.05 0.03 0.02 0.04 0.02

29
Table 6
Abnormal Operating Performance
The table presents the means and medians of cumulated (Cltd) abnormal operating performance proxied by three different
performance indicators. The sample has been divided between issues that occurred outside and during the financial crisis.
Two types of expectancy calculations are displayed. Wilcoxon non-parametric test has been used to test significance of
medians. *, ** or *** indicate significance of the variables at the 10%, 5% or 1% confidence level.
Full Sample Outside Crisis Crisis
N Mean Median N Mean Median N Mean Median
Ebitda
Standard Expectancy
N-1 96 0.725 0.025 71 1.215 1.467 25 -0.665 -1.429
Current 101 1.257* 0.981 76 1.387 0.967 25 0.859 1.013
Cltd N+1 100 1.685 2.913 76 1.753 2.65 24 1.468 3.026
Cltd N+2 93 1.849 1.227 69 1.331 0.192 24 3.338 3.745
Cltd N+3 87 0.872 1.461 63 -0.307 -3.737 24 3.969 2.784
Variation Expectancy
Current 96 0.462 0.354 71 0.088 0.082 25 1.523* 2.185
Cltd N+1 95 -0.37 -0.004 71 -1.08 -1.05 24 1.731 1.304
Cltd N+2 88 -0.477 -0.855 64 -1.674* -1.34 24 2.714* 3.487
Cltd N+3 84 -1.657* -1.708 60 -2.91** -2.753** 24 1.475 2.809
ROA
Standard Expectancy
N-1 98 1.672* 1.868** 75 1.69 2.421** 23 1.614* 1.22
Current 101 0.859 1.22*** 76 0.485 1.129* 25 1.997* 2.354
Cltd N+1 99 2.957* 4.141*** 75 2.44 3.168** 24 4.571** 4.611*
Cltd N+2 89 4.756** 6.646*** 65 3.865 5.955** 24 7.169** 8.519*
Cltd N+3 84 5.627* 8.753** 60 4.585 8.564* 24 8.23* 11.244
Variation Expectancy
Current 98 -1.002 -0.244 75 -1.39 -0.506 23 0.26 0.399
Cltd N+1 96 0.145 0.095 74 -0.038 -0.426 22 0.759 1.868
Cltd N+2 86 -1.549* -0.551 64 -2.341** -2.289** 22 0.756 2.315
Cltd N+3 81 -1.447 0.242 59 -1.643 -0.312 22 -0.922 0.873
FCF
Standard Expectancy
N-1 100 -0.017 -0.007 75 -0.024 -0.007 25 0.003 0.003
Current 105 -0.02* -0.002 80 -0.024* -0.005 25 -0.005 -0.002
Cltd N+1 105 -0.028 0.004 80 -0.036 0.005 25 -0.005 -0.019
Cltd N+2 96 -0.015 0.032 72 -0.028 0.021 24 0.026 0.051
Cltd N+3 93 -0.015 0.043* 69 -0.045 0.034 24 0.07* 0.061*
Variation Expectancy
Current 100 -0.007 -0.022 75 -0.006 -0.007 25 -0.008 -0.036
Cltd N+1 100 0.008 0.018 75 0.012 0.021 25 -0.004 0.004
Cltd N+2 91 0.025* 0.02 67 0.029* 0.022 24 0.016 0.011
Cltd N+3 90 0.021 0.027 66 0.015 0.013 24 0.037 0.036
30
Table 7
Regression of performance indicators
The table presents the estimations of panel regressions with random effects on Ebitda and RoA forwarded from one to three
years after the issuance and on the variation from the year of the issuance to the third year. The set of control variables
includes Sales (log), Market capitalization, Leverage, Current ratio, Altman Z score, Total Amount Issued, and Mean
Maturity. Dummy variables for sector and year of issuance are also included. Standard deviations are clustered at the issuer
level. Student’s statistic is displayed in brackets and Chi² for the difference in square brackets. ***, **, and * denote
coefficients that are statistically significant at the 1%, 5%, and 10% level.
Ebitda RoA
N+1 N+2 N+3 Variation N+1 N+2 N+3 Variation
Full Sample
Sukuk 2.01 1.62 0.21 -0.99
-0.16 -1.27 -2.52** -1.19
(0.93) (0.78) (0.08) (-0.53)
(-0.18) (-1.54) (-2.07) (-0.82)
Bond 2.75 2.14 1.66 0.87
-0.48 -0.32 -1.01 -0.65
(1.62) (1.46) (1.03) (0.74)
(-0.63) (-0.40) (-1.37) (-0.73)
Constant 6.37 5.71 1.99 -0.38
-8.45* -8.42* -7.49 0.16
(0.51) (0.43) (0.15) (-0.23)
(-1.79) (-1.72) (-1.44) (0.18)
Sukuk-Bond -0.73 -0.52 -1.45 -1.86
0.32 -0.96 -1.51 -0.53
[0.26] [0.09] [0.49] [1.09]
[0.16] [1.22] [1.68] [0.13]
N 1166 1094 1021 928
1143 1074 1001 902
Overall R² 0.37 0.38 0.40 0.41
0.36 0.36 0.37 0.22
Chi² 50.74 51.59 65.87 46.24
449.18 421.24 348.96 787.41
Outside the financial crisis
Sukuk 0.07 -1.05 1.26 -0.14
0.01 -1.67 -2.94** -1.04
(0.06) (-0.86) (0.38) (-0.06)
(0.01) (-1.59) (-2.03) (-0.54)
Bond 0.53 0.91 1.44 1.25
-0.88 -0.41 -1.24 -0.64
(0.66) (1.10) (0.91) (0.89)
(-1.12) (-0.53) (-1.56) (-0.55)
Constant -4.03 -4.51 16.01 2.71
-7.15 -8.20 -7.56 0.60
(-0.71) (-0.78) (0.89) (0.97)
(-1.49) (-1.53) (-1.33) (0.39)
Sukuk-Bond -0.46 -1.96* -0.18 -1.39
0.89 -1.27 -1.70 -0.40
[0.27] [3.11] [0.00] [0.34]
[0.75] [1.86] [1.55] [0.04]
N 995 929 865 776
974 911 846 749
Overall R² 0.39 0.39 0.43 0.44
0.34 0.34 0.34 0.22
Chi² 188.47 178.06 59.60 36.66
267.59 284.48 306.57 966.81
During the financial crisis
Sukuk 0.44 1.92 -1.91 -2.10
-0.73 0.28 -0.78 -1.04
(0.10) (0.84) (-0.98) (-0.99)
(-0.45) (0.24) (-0.50) (-0.54)
Bond -3.46 -2.61 0.93 -0.92
0.94 0.00 -1.26 -1.07
(-1.06) (-0.64) (0.49) (-0.60)
(0.82) (0.00) (-0.77) (-0.63)
Constant -36.26 -56.11 -6.80 -3.43
-18.37** -5.79 -8.47 5.91*
(-1.53) (-1.34) (-1.19) (-0.97)
(-2.13) (-1.55) (-1.52) (1.88)
Sukuk-Bond 3.89 4.53 -2.85 -1.18
-1.66 0.28 0.48 0.03
[0.49] [0.65] [1.46] [0.31]
[0.69] [0.02] [0.06] [0.00]
N 171 165 156 152
169 163 155 153
Overall R² 0.84 0.78 0.71 0.20
0.58 0.69 0.67 0.29
Chi² 456 31.19 218.45 199.11
4016.06 1486.24 185.72 101.89

31
Table 8
Regression of free cash-flows indicator
The table presents the estimations of panel regressions with random effects on free cash-flows forwaded from one to three
years after the issuance and on the variation from the third year to the year of the issuance. The set of control variables
includes Sales (log), Market capitalization, Leverage, Current ratio, Altman Z score, Amount Issued and Maturity. Dummy
variables for sector and year of issuance are also included. Standard deviations are clustered at the issuer level. Student’s
statistic is displayed in brackets and Chi² for the difference in square brackets. ***, **, and * denote coefficients that are
statistically significant at the 1%, 5%, and 10% level.
FCF
N+1 N+2 N+3 Variation
Full Sample
Sukuk 0.003 0.03*** 0.03*** 0.05***
(0.33) (2.95) (3.28) (3.44)
Bond 0.01 0.01 0.01 0.01
(1.21) (1.00) (0.88) (0.87)
Constant 0.06* 0.06* 0.05 -0.01
(1.74) (1.79) (1.42) (-0.56)
Sukuk-Bond -0.01 0.02* 0.02* 0.04**
[0.54] [3.09] [3.56] [5.40]
N 1168 1097 1024 932
Overall R² 0.33 0.34 0.34 0.11
Outside the financial crisis
Sukuk 0.002 0.02** 0.03** 0.06***
(0.14) (2.29) (2.13) (3.31)
Bond 0.01 0.01 0.01 0.02*
(0.90) (0.82) (1.02) (1.84)
Constant 0.02 0.03 0.09** 0.01
(0.46) (0.77) (2.14) (0.67)
Sukuk-Bond -0.01 0.02 0.02 0.04**
[0.30] [2.17] [1.55] [4.45]
N 996 932 868 778
Overall R² 0.31 0.32 0.35 0.13
During the financial crisis
Sukuk -0.03 0.01 0.02 -0.01
(-1.13) (0.53) (0.78) (-0.19)
Bond -0.02 -0.00 -0.01 -0.03
(-1.09) (-0.07) (-0.50) (-1.03)
Constant -0.05 -0.02 -0.03 0.01
(-0.88) (-0.32) (-0.46) (0.26)
Sukuk-Bond -0.01 0.01 0.03 0.02
[0.23] [0.24] [0.96] [0.37]
N 172 165 156 154
Overall R² 0.56 0.63 0.39 0.15

32
Table 9
Buy and Hold Abnormal Returns
The table presents the buy and hold abnormal returns one to three years after the issuance event. The sample has been divided
between issues that occurred outside and during the financial crisis. The BHARs are displayed in points of percentage. Ttest
has been generated to test the significance of means. Aburthnott non-parametric sign-test for medians and Kruskall-Wallis
non parametric test for differences of medians have been calculated. *, ** or *** indicate significance of the variables at the
10%, 5% or 1% confidence level.
Years Issue Type N Mean BHAR Median BHAR
Full Sample
1 Sukuk 164 -0.19 -11.48***
Bond 645 13.6*** 10.14***
Difference 809 -13.79*** -21.62***
2 Sukuk 164 -14.1*** -22.67***
Bond 645 34.04*** 21.86***
Difference 809 -48.13*** -44.53***
3 Sukuk 164 -20.11*** -35.02***
Bond 645 66.86*** 42.29***
Difference 809 -86.97*** -77.31***
Outside the financial crisis
1 Sukuk 132 -1.09 -13.34***
Bond 412 6.59*** 3.45
Difference 544 -7.68 -16.79***
2 Sukuk 132 -17.4*** -26.97***
Bond 412 19.32*** 17.3***
Difference 544 -36.72*** -44.27***
3 Sukuk 132 -27.93*** -39.39***
Bond 412 57.13*** 38.33***
Difference 544 -85.07*** -77.71***
During the financial crisis
1 Sukuk 32 3.52 -3.62
Bond 233 26*** 21.51***
Difference 265 -22.47** -25.13***
2 Sukuk 32 -0.47 -9.66
Bond 233 60.06*** 51.98***
Difference 265 -60.53*** -61.65***
3 Sukuk 32 12.18 5.64
Bond 233 84.07*** 58.37***
Difference 265 -71.89*** -52.73***
33
Table 10
Regression of buy and hold abnormal returns
The table presents the estimations of OLS regressions of BHARs. We only report the key independent variable Sukuk in the
table. The set of control variables includes Sales (log), Market capitalization, Leverage, Current ratio, Altman Z score,
Amount Issued, Coupon and Maturity . Dummy variables for sector and year of issuance are also included. Standard
deviations are clustered at the issuer level. The sample is divided between issues that occurred outside or during the financial
crisis. Student’s statistic is displayed in brackets. ***, **, and * denote coefficients that are statistically significant at the 1%,
5%, and 10% level.
BHAR
Years 1 2 3
Full Sample
Sukuk -11.15 -39.87*** -72.82***
(-1.53) (-3.71) (-3.75)
Constant -124.51 -95.72 -283.93**
(-1.66) (-1.46) (-2.09)
Firm Variables Yes Yes Yes
Issuance Variables Yes Yes Yes
Sectors Fixed Effects Yes Yes Yes
Years Fixed Effects Yes Yes Yes
N 700 690 678
Nb of Issuers (clusters) 65 63 63
R² 0.30 0.52 0.63
BHAR
BHAR
Years 1 2 3 1 2 3
Outside Financial Crisis
During Financial Crisis
Sukuk -6.74 -36.44*** -75.22***
-9.91 29.16 74.16
(-0.83) (-3.27) (-4.00)
(-0.53) (0.56) (0.68)
Constant -138.20 -154.78** -298.25***
-62.62 262.53 289.92
(-1.45) (-2.50) (-2.96)
(-0.75) (1.44) (1.13)
Firm variables Yes Yes Yes
Yes Yes Yes
Issuance Variables Yes Yes Yes
Yes Yes Yes
Sectors Fixed Effects Yes Yes Yes
Yes Yes Yes
Years Fixed Effects Yes Yes Yes
Yes Yes Yes
N 487 478 466
213 212 212
Nb of Issuers (clusters) 61 60 60
22 21 21
R² 0.25 0.40 0.58
0.53 0.77 0.82