Embed Size (px)
Citation preview
1
How statistics shaped microfinance
Jonathan Morduch1 New York University and Institute for Advanced Study
November 17, 2016
If banking in poor communities was easy, banks would already be there in large numbers.
The big global banks would have blanketed the world with branch offices and automatic
teller machines, competing vigorously with local banks for poor customers. There would
be no need for a vocabulary of “microfinance” or “financial inclusion,” and no global
microfinance campaigns.
But banking in poor communities is not generally easy. The big banks stayed
away from communities served by microfinance for understandable reasons. Economists
point to now-familiar problems in credit markets created by information asymmetries;
moral hazard and adverse selection emerge especially in contexts where few assets can be
used as collateral. Creating mechanisms that substituted for the use of collateral
(especially group lending and installment lending) was the key technical innovation of
microfinance.2 It took the global microfinance movement to transform and popularize
thesenew approaches to banking in poor communities.
1 New York University Wagner Graduate School of Public Service. This essay was written for the 4th Fourth IMF Statistical Forum “Lifting the Small Boats: Statistics for Inclusive Growth,” November 17-18, 2016. The essay was written during a year as the Roger W. Ferguson. Jr. and Annette L. Nazareth member at the Institute for Advanced Study, Princeton NJ. The views are my own. 2 For an overview of microfinance innovations, see Armendariz and Morduch (2010).
2
The starting date of the global microfinance movement is debated. Some look to
antecedents in 19th century credit cooperatives.3 Others point to seeds in informal
financial mechanisms like rotating saving and credit institutions.4 But the modern
microfinance movement dates to Muhammad Yunus’s early microcredit experiments in
1976, forty years ago. Those experiments led to the establishment of Grameen Bank in
Bangladesh under an official ordinance in 1983, which in turn inspired the first global
Microcredit Summit in 1997 and, eventually, today’s worldwide efforts to promote
financial inclusion.5
Statistics have been central to the global growth of microfinance. Most important,
statistics have established regional benchmarks and documented progress over time. By
choosing which numbers to collect and publish (and which not), advocacy organizations
have also used statistics to tilt debates, not always subtly. The collection and publication
of particular data can thus be seen as a reflection of internal tensions between social and
commercial goals within the microfinance sector. In short, data have played both
scientific and political roles.
Seen from the outside, the statistics on microfinance reinforce the sense that
microfinance is a cohesive sector, with microfinance institutions driven by the shared
belief that social goals and commercial imperatives can be pursued harmoniously within
the same financial institutions. The idea builds from the notion that microfinance
providers can earn profits while serving the needy. Microfinance has been pitched as a
3 See, for example, Banerjee, et al. (1994). 4 See, for example, Rutherford (2009). 5 I will use the words “microcredit” and “microfinance” interchangeably here, although Grameen Bank was originally focused mainly on credit and used the term “microcredit” as a mark of distinction to signify a pro-poor orientation.
3
win-win, “you can have it all” proposition.6 The win-win vision creates the possibility of
rapid, organic growth, freed from the constraints of donor-driven expansion. Subsidies
are seen as start-up funding, not permanent support.
Yet, from the start, microfinance has seen fundamental—and largely
constructive—debates. The conflicts center on the priority to be given to social goals like
poverty reduction versus commercial goals like profitability and the expansion of
banking systems. Although most of the rhetoric of microfinance suggests that the goals
are not in conflict, economics (and statistics) show that conflicts are inevitable.
In this essay, I describe key elements of microfinance as seen through four very
different statistical efforts, each of which leads to (and is informed by) a fundamentally
different view of the ultimate goals of microfinance. Only when the statistical efforts are
viewed together does a full picture of microfinance emerge, a picture that reveals tensions
within a sector in flux.
The first focus is data on the rapid growth (and pro-poor orientation) of
microfinance documented by the Microcredit Summit Campaign, a grassroots advocacy
organization closely tied to Muhammad Yunus’s vision. The second, in contrast, is data
on the profitability (and commercial orientation) of microfinance documented by the
Microfinance Information Exchange (MIX Market), an organization created by
international donors. The third is data on social impacts, mainly involving randomized
controlled trials (RCTs), largely implemented by research-oriented economists. The
RCTs shift focus to household outcomes like income and consumption (and have found
only modest impacts). The fourth is financial diaries data—intensive studies of the
6 For more and a discussion of the “microfinance schism,” see Morduch (2000).
4
finances of households in poor communities—carried out mainly by independent
researchers. Using the tools of close observation, the diaries shift the focus once again,
creating an argument that poor families mainly seek tools for basic money management
rather than, as Yunus had originally argued, business investment. This “cash flow”
perspective would bring microfinance closer to meeting the goals that most people the
world over seek in financial access.
1. The rapid growth (and pro-poor orientation) of microfinance:
The Microcredit Summit Campaign
The Microcredit Summit Campaign was launched in February 1997 at a global summit in
Washington, DC, attended by over 2,900 delegates from 137 countries. At that point, just
13 million microfinance customers were counted globally. The summit featured the start
of a nine-year campaign to reach “100 million of the world’s poorest families” by 2005.
In line with Yunus’s emphases, the focus was on women especially, and explicitly on
“credit for self-employment and other financial and business services.”
The 1997 summit has been followed by 17 annual summits. Having met the goal
set in 1997, the November 2006 summit in Halifax ended with two new goals: First:
“Reaching 175 million of the poorest families with credit for self-employment and other
financial and business services.” Second: “Helping 100 million families lift themselves
out of extreme poverty.”7
7 See details on the Microcredit Summit website. http://www.microcreditsummit.org/about-the-campaign2.html.
5
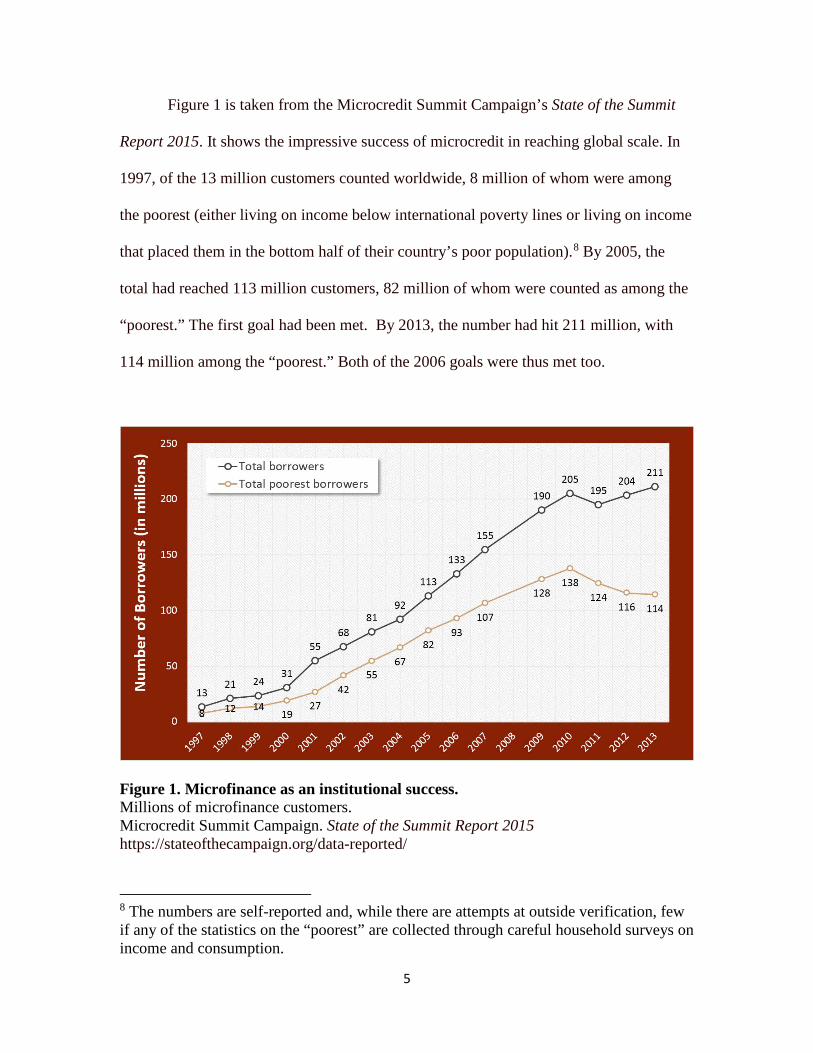
Figure 1 is taken from the Microcredit Summit Campaign’s State of the Summit
Report 2015. It shows the impressive success of microcredit in reaching global scale. In
1997, of the 13 million customers counted worldwide, 8 million of whom were among
the poorest (either living on income below international poverty lines or living on income
that placed them in the bottom half of their country’s poor population).8 By 2005, the
total had reached 113 million customers, 82 million of whom were counted as among the
“poorest.” The first goal had been met. By 2013, the number had hit 211 million, with
114 million among the “poorest.” Both of the 2006 goals were thus met too.
Figure 1. Microfinance as an institutional success. Millions of microfinance customers. Microcredit Summit Campaign. State of the Summit Report 2015 https://stateofthecampaign.org/data-reported/
8 The numbers are self-reported and, while there are attempts at outside verification, few if any of the statistics on the “poorest” are collected through careful household surveys on income and consumption.
6
The statistics show the rapid rise of microfinance and the ability to reach scale.
Three elements are worth noting. First, the social orientation of the Microcredit Summit
meant that the “headline” numbers counted people, rather than the size of loan portfolios
or the growth of lenders’ assets. Financial data were not highlighted. The numbers were
driven by large lenders in Asia, even if they were not leaders on commercial dimensions.
Second, by counting poor customers and building poverty targets explicitly into
goals, the social dimension was again underscored, an idea that lines up with Yunus’s
aim to be a “banker to the poor.” Third, the trajectories of total borrowers and the
“poorest” borrowers diverges from 2010 onward. The Microcredit Summit started to see
both a relative and absolute decline in the orientation toward poor customers.
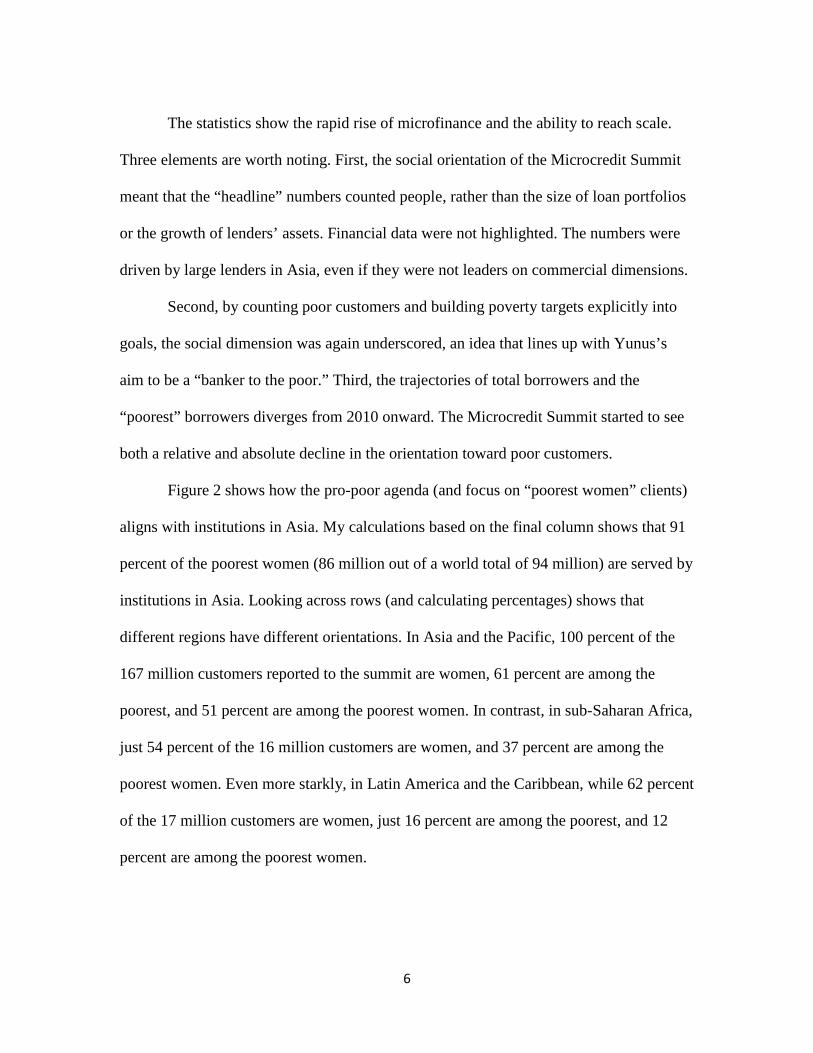
Figure 2 shows how the pro-poor agenda (and focus on “poorest women” clients)
aligns with institutions in Asia. My calculations based on the final column shows that 91
percent of the poorest women (86 million out of a world total of 94 million) are served by
institutions in Asia. Looking across rows (and calculating percentages) shows that
different regions have different orientations. In Asia and the Pacific, 100 percent of the
167 million customers reported to the summit are women, 61 percent are among the
poorest, and 51 percent are among the poorest women. In contrast, in sub-Saharan Africa,
just 54 percent of the 16 million customers are women, and 37 percent are among the
poorest women. Even more starkly, in Latin America and the Caribbean, while 62 percent
of the 17 million customers are women, just 16 percent are among the poorest, and 12
percent are among the poorest women.
7
Figure 2. Microfinance heterogeneity Customers by region, gender, and poverty level Microcredit Summit Campaign, State of the Summit Report 2015 https://stateofthecampaign.org/data-reported/
2. The commercialization of microfinance and continued dependence on subsidy:
MIX Market database.
While the Microcredit Summit Campaign aimed to keep an eye on the global
human reach of microfinance, with a particular focus on poor women, international
donors worked to shift attention to the commercial prospects for microfinance.
The new credit contracts, like group lending and installment lending, proved
insufficient for microfinance to succeed and expand on a commercial basis. The success
of microfinance also depended on a political argument that embraced the raising of
interest rates for microfinance customers to levels that were considerably higher than the
rates charged to (richer) customers of traditional banks. The case was made along several
related lines: that the higher interest rates would still be much lower than rates charged by
8
moneylenders, that illiquid households sought access rather than cheap credit, and that
the financial returns to cash-starved entrepreneurs were so high that interest rates were a
minor concern. The arguments came together to create a broad defense of
commercialization in social terms: High interest rates were necessary for a microfinance
institution’s profitability and, in principle, that would then attract investment to allow
portfolio growth and far greater reach. It would also free donors of the need to
perpetually support the sector.9
International donors, guided by the consortium CGAP (originally, the
“Consultative Group to Assist the Poorest”), created the MIX Market, an independent
organization to collect financial data on microfinance institutions.10 The focus shifted to
cost structures, revenues, loan losses, and various measures of profit.11
The MIX Market database remains the largest industry data source on the finances
of microfinance institutions, and the analysis here is from analyses of MIX data by Cull,
et al. (2016).12 They analyze the data on MFIs between 2005 and 2009, drawing on a
database that includes 3845 institution-years, reflecting 291 million borrower-years. The
9 As Armendariz and Morduch (2010) show, the new contractual innovations played a role here by allowing lenders to raise interest rates while mitigating incentive problems connected to information asymmetries. 10 See Helms (2006) for an overview of the donor vision from CGAP. 11 The MIX Market now collects data on social outcomes, although it did not do so initially. 12 As noted by Cull, et al. (2016): “Participation in the MIX database is voluntary, and the microfinance institutions in the sample tend to feature institutions that stress financial objectives and profitability (though the database has become more broadly representative as it has expanded over time). The skew is shown by Bauchet and Morduch (2010) who calculate that the average operational self-sufficiency ratio (a measure of organizational efficiency) of institutions reporting to the larger, socially-focused Microcredit Summit Campaign database is 95 percent, compared to 115 percent for institutions reporting to the MIX Market. Scores above 100 percent reflect ‘operational self-sufficiency.’”
9
2009 data include 930 institutions with a combined 80.1 million borrowers. Their focus is
on variation among for-profit microfinance banks, credit unions and cooperatives, NGOs,
non-bank financial institutions (NBFIs), and public-sector rural banks. Non-bank
financial institutions are a broad range of institutions that span the space between NGOs
and banks.
The central finding of Cull et al. (2016) is that, while most firms earn positive
accounting profits, only a minority earn economic profit (which accounts fully for the
opportunity costs of inputs). Accounting profit reflects an institution’s ability to cover its
costs with its revenues. It is a helpful statistic, but it does not account for implicit grants
and subsidies. Cull, et al. (2016) find that two-thirds percent of microfinance institutions
were profitable on an accounting basis (weighted by the number of borrowers per
institution). Turning instead to economic profit (using the local prime interest rate as the
alternative cost of capital), they find that only about one third percent of institutions were
above the profit bar (weighted by the number of borrowers per institution).
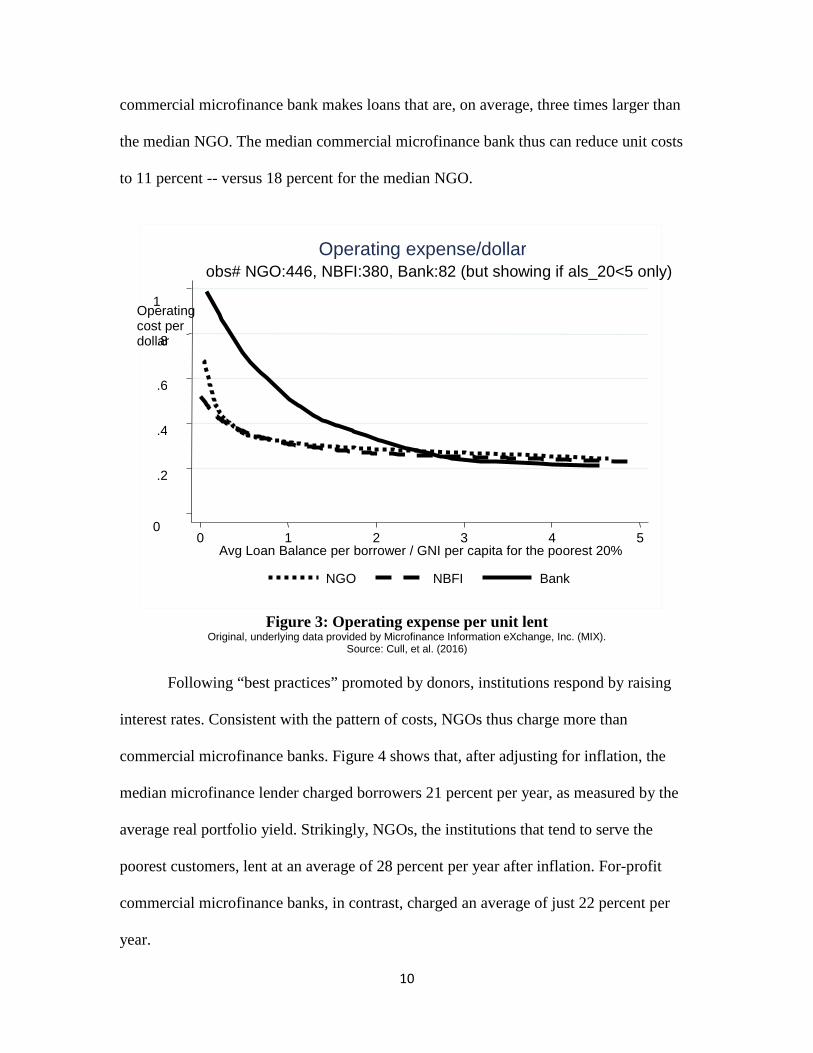
The Cull et al. (2016) analysis highlights the challenge created by high fixed costs
in lending. The need to raise interest rates was due to a more fundamental problem than
information asymmetries: the basic costs of microfinance lending were high. Cull, et al.
(2016) estimate a median unit cost of $14 in operating expenses for each $100 of loans
outstanding. The distribution of unit costs, are skewed, though, as seen in Figure 3.
Institutions making small loans face particularly high unit costs. The horizontal axis
measures average loan sizes normalized by the income per capita at the 20th percentile of
the income distribution in an institution’s country. High fixed costs imply cost
advantages when making larger loans (holding all else the same). The median
10
commercial microfinance bank makes loans that are, on average, three times larger than
the median NGO. The median commercial microfinance bank thus can reduce unit costs
to 11 percent -- versus 18 percent for the median NGO.
Figure 3: Operating expense per unit lent
Original, underlying data provided by Microfinance Information eXchange, Inc. (MIX). Source: Cull, et al. (2016)
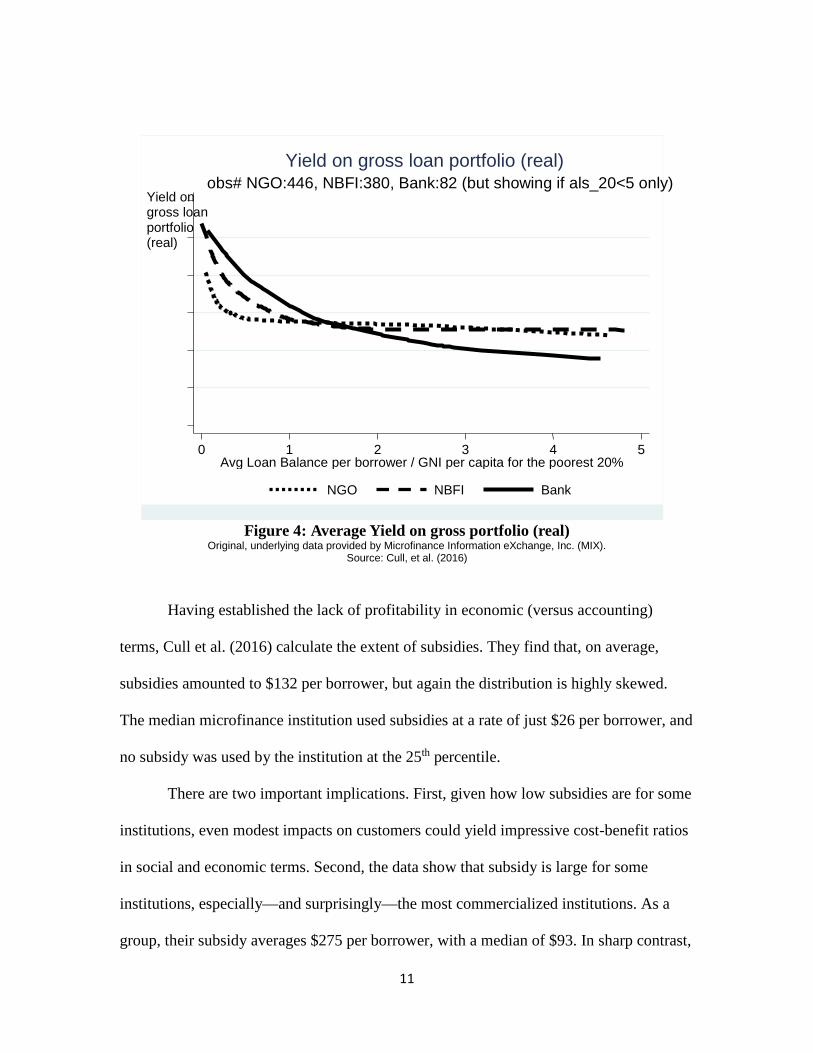
Following “best practices” promoted by donors, institutions respond by raising
interest rates. Consistent with the pattern of costs, NGOs thus charge more than
commercial microfinance banks. Figure 4 shows that, after adjusting for inflation, the
median microfinance lender charged borrowers 21 percent per year, as measured by the
average real portfolio yield. Strikingly, NGOs, the institutions that tend to serve the
poorest customers, lent at an average of 28 percent per year after inflation. For-profit
commercial microfinance banks, in contrast, charged an average of just 22 percent per
year.
0
.2
.4
.6
.8
1
0 1 2 3 4 5 Avg Loan Balance per borrower / GNI per capita for the poorest 20%
NGO NBFI Bank
obs# NGO:446, NBFI:380, Bank:82 (but showing if als_20<5 only) Operating expense/dollar
Operating cost per dollar
11
Figure 4: Average Yield on gross portfolio (real)
Original, underlying data provided by Microfinance Information eXchange, Inc. (MIX). Source: Cull, et al. (2016)
Having established the lack of profitability in economic (versus accounting)
terms, Cull et al. (2016) calculate the extent of subsidies. They find that, on average,
subsidies amounted to $132 per borrower, but again the distribution is highly skewed.
The median microfinance institution used subsidies at a rate of just $26 per borrower, and
no subsidy was used by the institution at the 25th percentile.
There are two important implications. First, given how low subsidies are for some
institutions, even modest impacts on customers could yield impressive cost-benefit ratios
in social and economic terms. Second, the data show that subsidy is large for some
institutions, especially—and surprisingly—the most commercialized institutions. As a
group, their subsidy averages $275 per borrower, with a median of $93. In sharp contrast,
0 1 2 3 4 5 Avg Loan Balance per borrower / GNI per capita for the poorest 20%
NGO NBFI Bank
obs# NGO:446, NBFI:380, Bank:82 (but showing if als_20<5 only) Yield on gross loan portfolio (real)
Yield on gross loan portfolio (real)
12
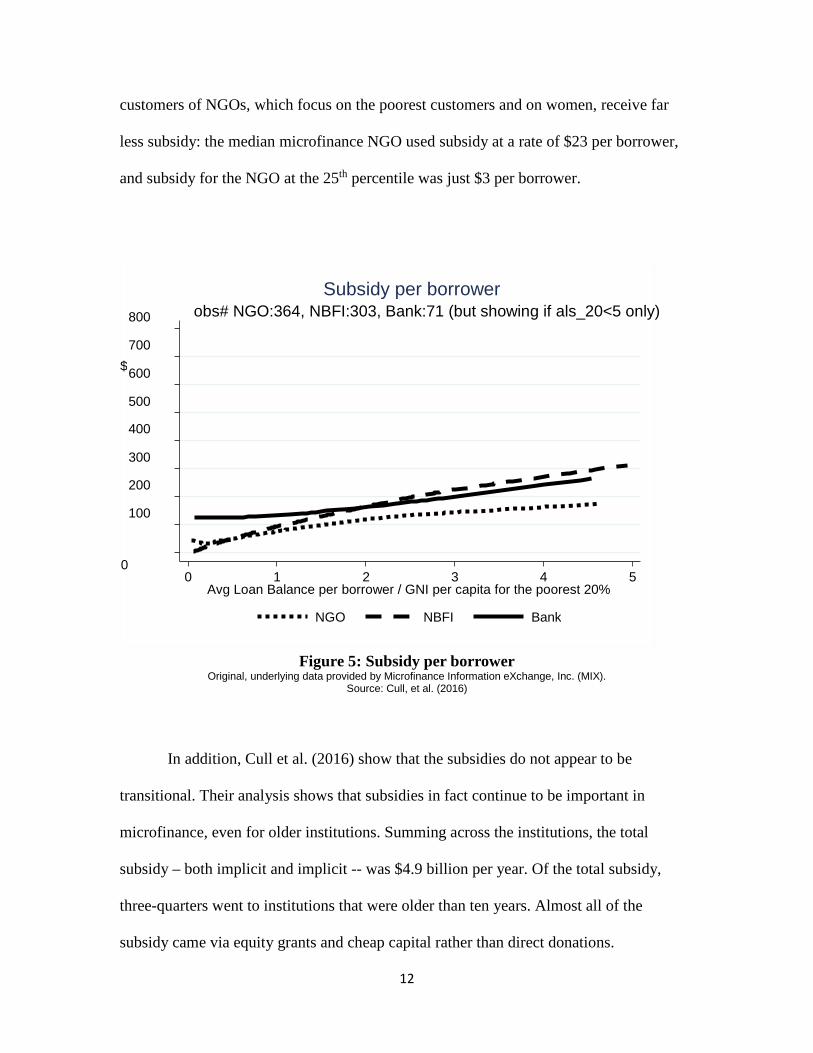
customers of NGOs, which focus on the poorest customers and on women, receive far
less subsidy: the median microfinance NGO used subsidy at a rate of $23 per borrower,
and subsidy for the NGO at the 25th percentile was just $3 per borrower.
Figure 5: Subsidy per borrower
Original, underlying data provided by Microfinance Information eXchange, Inc. (MIX). Source: Cull, et al. (2016)
In addition, Cull et al. (2016) show that the subsidies do not appear to be
transitional. Their analysis shows that subsidies in fact continue to be important in
microfinance, even for older institutions. Summing across the institutions, the total
subsidy – both implicit and implicit -- was $4.9 billion per year. Of the total subsidy,
three-quarters went to institutions that were older than ten years. Almost all of the
subsidy came via equity grants and cheap capital rather than direct donations.
0
100
200
300
400
500
600
700
800
$
0 1 2 3 4 5 Avg Loan Balance per borrower / GNI per capita for the poorest 20%
NGO NBFI Bank
obs# NGO:364, NBFI:303, Bank:71 (but showing if als_20<5 only) Subsidy per borrower
13
3. Social and Economic Impacts Randomized Controlled Trials (RCTs)
The Cull et al. (2016) findings on subsidy suggest that the conversation needs to shift
toward measured impact so the costs analyzed by Cull et al. (2016) can be compared to
benefits. Ultimately, for policymakers, cost-benefit ratios are of key interest.
Impact measurement, though, has been hampered by selection bias. This is a
particular problem in microcredit given the likely heterogeneity of impact and the
endogeneity of participation. Measured impacts will be over-stated if outcomes for
microcredit borrowers are compared to outcomes for non-borrowers without fully
accounting for the ways that participants may have advantages from the outset.
Borrowers, for example, may be more industrious and better connected to market
networks, and many of these dimensions are hard to control for in standard statistical
frameworks. In contrast, there are cases when biases go the other way, when, for
example, microfinance institutions targets the most disadvantaged populations.13
These concerns have led researchers to turn to randomized controlled trials in
which access to microcredit depends in part on a randomization process. Usually, lenders
select some communities (treatment) and not others (control) on using a random number
13 For a review of the statistical issues, see Armendáriz and Morduch (2010).
14
generator. Researchers then compare the outcomes in treatment and control communities
after a few years.14
Here, I focus on six studies published in American Economic Journal: Applied
Economics 2014 (the studies are from India, Ethiopia, Bosnia-Herzegovina, Mexico,
Morocco, and Mongolia). As a group, the papers show strong increases in borrowing but
modest impacts of microfinance.15
The studies show the power of randomization together with its limits. To give an
example, the paper from India investigates an urban microcredit program in South India.
Researchers found that small business investment and profits of existing businesses
increased, but not average consumption by households. No significant impacts were
found on health, education, or women’s empowerment. A follow-up two years later (after
14 Earlier papers addressed selection bias through other methods. See, for example, Mark M. Pitt and Shahidur R. Khandker, (1998) “The Impact of Group-Based Credit on Poor Households in Bangladesh: Does the Gender of Participants Matter?” Journal of Political Economy 106(5), pp. 958–96. A replication and critique of the paper can be found in David Roodman and Jonathan Morduch. 2014. “The Impact of Microcredit on the Poor in Bangladesh: Revisiting the Evidence.” Journal of Development Studies 50 (4), April: 583-604. 15 The six studies published in the American Economic Journal: Applied Economics are: Banerjee, Abhijit V., Esther Duflo, Rachel Glennerster, and Cynthia Kinnan: “The Miracle of Microfinance? Evidence from a Randomized Evaluation”; Angelucci, Manuela; Karlan, Dean and Zinman, Jonathan: “Microcredit Impacts: Evidence from a Randomized Microcredit Program Placement Experiment by Compartamos Banco”; Orazio Attanasio, Britta Augsburg, Ralph De Haas, Emla Fitzsimons and Heike Harmgart: “The Impacts of Microfinance: Evidence from Joint-Liability Lending in Mongolia”; Britta Augsburg, Ralph De Haas, Heike Harmgart and Costas Meghir: “The Impacts of Microcredit: Evidence from Bosnia and Herzegovina”; Bruno Crépon, Florencia Devoto, Esther Duflo, and William Pariente: “Estimating the Impact of Microcredit on Those who Take It Up: Evidence from a Randomized Experiment in Morocco”; and Alessandro Tarozzi, Jaikishan Desai, and Kristin Johnson: “The Impacts of Microcredit: Evidence from Ethiopia.”
15
the area had been more widely covered by microcredit) found very few significant
differences between the original treatment and control groups. The findings point to some
positive changes (especially in business investment) but not on the main household
economic and social indicators. The study measures the impact of an expansion (into an
urban area) but can say nothing about the impact of the microfinance institution on
customers in its core rural locations. The impacts are on marginal customers, who are one
group of interest in understanding the impact of expansions. The measures, though, can
say nothing clear about impacts on infra-marginal customers, who form the majority of
customers.
In Mexico, researchers tracked the expansion of the country’s largest microlender
(one that uses established microcredit lending methods and targets low-income women
but which charges very high interest rates). After an average of two years of microcredit
access, the researchers “find no evidence of transformative impacts on 37 outcomes
(although some estimates have large confidence intervals).” The outcomes considered
include micro-entrepreneurship, income, labor supply, expenditures, social status, and
subjective well-being. Again, the study is useful, but it documents the impact of an
expansion into new (and, in this case, recently-violent) territory, and cannot speak to the
impact on the majority of (infra-marginal) customers in the institution’s original
locations.
In rural Mongolia, the researchers find positive impacts on the entrepreneurship of
women and on food consumption by their households, but not on total working hours or
household income. In Bosnia, with a better-off sample of customers, the researchers find
positive impacts on self-employment and inventories, and, with that, a drop in wage
16
work. While the researchers find “some evidence of increases in profits” they also find
that consumption and savings fall, and find no impact on average household income. In
Morocco, the researchers also find an increase in self-employment coupled with a drop in
other forms of labor. The increase in business profit was thus offset by falling income
from other labor, leaving no net gain in average household income and consumption. In
rural Ethiopia, researchers investigated impacts on income from agriculture, animal
husbandry, nonfarm self-employment, labor supply, schooling, and indicators of women's
empowerment. They find that “despite substantial increases in borrowing in areas
assigned to treatment the null of no impact cannot be rejected for a large majority of
outcomes.”
One cannot generalize to all cases from just these six studies, but they align with
results from a wider set of studies surveyed by Armendáriz and Morduch (2010). The
summary view is that, in terms of studies that pass muster with academic economists, the
empirical case that credit has a strong role in reducing measured poverty is weak. The
studies show a few bright spots, and they show that microcredit generally helps
businesses. But the studies show that the links are not strong from business investment to
broader measures of welfare.
4. Shifting to a Cash Flow View: Financial Diaries
The statistics above pose a large challenge for microfinance. Indeed, microfinance is at a
crossroads. The data show modest subsidies and modest impacts. They show growing
scale, but a shift away from the poorest. And they show regional differences in the kinds
17
of populations served by microfinance. If microfinance has been a clear success
institutionally, its ultimate impact on customers is far less clear.
Part of the dilemma ties back to limitations of the original vision. Stepping way
from microfinance for a moment, households generally seek finance to make large
purchases that would otherwise be difficult and to help with basic, week-by-week
financial management. The original vision for microfinance, however, rested on the
notion that finance for the poor meant only finance for business. The kinds of questions
that researchers asked with RCTs followed suit, mainly focusing on impacts on business
profits and household income. The same perspective was carried forward by both the
Microcredit Summit Campaign and CGAP.
An alternative view emerges from financial diaries. The diaries are most closely
associated with the work of Collins et al. (2009), which details the financial lives of low-
income families in Bangladesh, India, and South Africa. Stepping away from large-scale
statistical efforts, Collins et al. (2009) take a close-to-the-ground approach, aiming to
track the entire financial lives of a small set of households in both rural and urban areas.
They use the tools of empirical corporate finance to create linked balance sheets and
income statements for the households.16 Their focus is on the complete set of household
financial transactions connected to earning, spending, saving, borrowing, and informal
sharing. Rather than test hypotheses emerging from the economics literature, the
researchers’ goal was to watch and listen, and only then try to make sense (inductively)
of households’ observed choices.
16 For a related method see the important work of Samphantharak and Townsend (2009).
18
The picture that emerges is very different from the early microfinance vision.
Collins et al. (2009) find that even if microfinance does not raise income or launch
businesses, it may help households cope with the ups and downs of incomes and needs
that arise through the year. A central finding of Collins et al. (2009) can be boiled down
in terms of global poverty statistics: the hidden burden of living on $1 a day per person
(or wherever the global poverty line is set), is that rarely does anyone actually receive $1
per person each and every day. Instead, farmers have high and low seasons, laborers have
better and worse months, and many people are vulnerable to the ups and downs created
by boom and bust economic business cycles. The financial problem of being poor, then,
is both an issue of low resources on average and an issue of the uncertainty and
unpredictability of those resources. Microfinance can then be an important asset in
smoothing consumption in the sense of Deaton (1992), not just for investment. Not
surprisingly, this is how Stuart Rutherford observes microfinance customers actually
using their money (Collins et al. 2009, chapter 6).
Put another way, even if poverty rates (defined by a given level of average
income) are not noticeably affected by microfinance access, some of the consequences of
being poor – such as having difficulty finding funds to meet health crises -- may be
ameliorated by having access to extra money when needed. Such access may be vital
during emergencies (and are due more attention from policymakers and researchers), but
it is a very different story from the standard narrative upon which the microfinance sector
was built. Indeed, it is a very different story from that behind efforts to address global
poverty.
19
To the extent that this is so, microfinance has been vastly undersold and has perhaps
been missing its biggest market, the billions of wage-workers who have no interest in
(nor time for) self-employment but whose needs for finance are fundamental to their
well-being. This is not an argument for abandoning the aim to serve the poor: some of the
poorest workers anywhere are wage-workers. The argument is instead to think differently
and bigger, while not losing grasp of the original vision (and tensions) of microfinance.
5. Conclusion
Microfinance has been a global success, duly celebrated by the 2006 Nobel Peace Prize.
Beyond demonstrating the possibility of new kinds of financial institutions, it has
demonstrated new ideas adopted in other sectors, including health, education, and energy.
Early efforts to build social businesses and foster social investment owe their inspiration
to the pioneers of microfinance (Conning and Morduch 2011).
Yet microfinance was always a contested idea, and statistics were collected to
highlight and promote some strands of thought over others. The notable divides were
along social versus commercial lines. New empirical work, taking an inductive approach
rather than a deductive one, calls into question the original premise of microfinance as a
way to help customers start small businesses. Instead, new data from financial diaries
suggest a broader view of household financial needs focused on cash flow management.
The conflicts within microfinance have largely been constructive, but the statistics
have both revealed and (implicitly) concealed parts of the debate. In terms of statistics
and data, the history of microfinance shows that a full view is only possible when very
different kinds of data are brought together. The full picture cannot be seen from just
20
reading tables documenting the numbers reached, nor spreadsheets of financial
performance, nor randomized controlled trials of economis and social impacts, nor
financial diaries giving an on-the-ground view.
Investors and entrepreneurs have difficult choices to make in enabling the next
steps for microfinance. One vision, provoked by the financial diaries, opens up the
possibility of extending the ideas of microfinance to hundreds of millions of potential
customers, many in urban areas and most with jobs, who lack a strong interest in business
investment. They instead seek finance to help manage cash flows and seize opportunities
requiring lumpy sums. The evidence from RCTs, though, suggest that such financial
access can be an important step in expanding the choices of households but it is unlikely,
in itself, to be socially transformative. The data from the Microcredit Summit suggest that
this can be achieved at mass scale, while the (re-examined) data from the MIX Market
suggest that, absent radical ways to slash costs, enduring subsidy is likely to be an
integral part of microfinance business models for institutions serving poor communities.
21
References Armendàriz, Beatriz and Jonathan Morduch (2010). The Economics of Microfinance,
Second edition. Cambridge, MA: MIT Press. Banerjee, Abhijit, Timothy Besley, and Timothy Guinnane (1994). “Thy neighbor’s
keeper: The design of a credit cooperative with theory and a test.” Quarterly Journal of Economics 109(2): May: 491–515.
Banerjee, Abhijit, Dean Karlan, and Jonathan Zinman (2015). “Six Randomized
Evaluations of Microcredit: Introduction and Further Steps.” American Economic Journal: Applied Economics 7(1): 1–21.
Bauchet, Jonathan and Jonathan Morduch (2010). “Selective Knowledge: Reporting Bias
in Microfinance Data.” Perspectives on Global Development and Technology 9 (3-4): 240-269.
Collins, Daryl, Jonathan Morduch, Stuart Rutherford, and Orlanda Ruthven (2009).
Portfolios of the Poor: How the World’s Poor Live on $2 a Day. Princeton, NJ: Princeton University Press.
Conning, Jonathan and Jonathan Morduch (2011). “Microfinance and Social Investment.”
Annual Review of Financial Economics, vol. 3, ed. Robert Merton and Andrew Lo. 2011: 407-434.
Cull, Robert, Asli Demirgüç-Kunt, and Jonathan Morduch (2009). “Microfinance Meets
the Market.” Journal of Economic Perspectives 23(1) ,Winter: 167-192. Cull, Robert, Asli Demirgüç-Kunt, and Jonathan Morduch (2016). “The Microfinance
Business Model: Enduring Subsidy and Modest Profit.” World Bank Policy Research Working Paper 7786.
Deaton, Angus. 1992. Understanding Consumption. Oxford: Oxford University
Press/Clarendon.
Helms, Brigit. 2006. Access for All: Building Inclusive Financial Systems (An Excerpt). Washington DC: CGAP.
Morduch, Jonathan. 2000. “The microfinance schism.” World Development 28(4) (April):
617–629.
Rutherford, Stuart with Sukhwinder Arora. 2009. The Poor and their Money, 2nd edition. Bourton on Dunsmore, Warwickshire, UK: Practical Action Publishing.
Samphantharak, Krislert and Robert Townsend. 2009. Households as Corporate Firms: An Analysis of Household Finance Using Integrated Household Surveys and
22
Corporate Financial Accounting. Cambridge, UK: Cambridge University Press/Econometric Society.
Schreiner, Mark and Jacob Yaron (2001). Development Finance Institutions: Measuring their Subsidy. Washington, DC: The World Bank.
Yaron, Jacob (1994), “What makes Rural Finance Institutions Successful?” World Bank
Research Observer 9 (1), January.