Embed Size (px)
Citation preview
Rev. Integr. Bus. Econ. Res. Vol 5(4) 280
Copyright 2016 GMP Press and Printing (http://buscompress.com/journal-home.html) ISSN: 2304-1013 (Online); 2304-1269 (CDROM); 2414-6722 (Print)
How Should Suppliers Respond to Economic Crises? Lessons from the Japanese Auto Parts Industry
Atsushi Inuzuka Nagoya University
ABSTRACT The aim of this paper is to describe the effect of suppliers’ choices of either limiting or broadening their customer base as well as their product lines. To identify the choices made, I used information on the transaction volume of auto parts shipped to each of the Japanese automakers over 2005-2012, a period that included the financial crises of the Lehman Crash (the bankruptcy of Lehman Brothers) and the Great East Japan Earthquake. The effects on current profit ratios showed that suppliers’ choices to diversify their customer base worked positively in general, although this effect disappeared during crises. Handling many product lines had almost no effect on suppliers. Additional analysis showed that suppliers that changed their main customer during a crisis failed to recover their profit ratios after the crisis. These findings teach us how suppliers should maintain relationships during economic crisis. Keywords: Automobile Industry, Supplier, Transaction Volume, Economic Crisis. 1. INTRODUCTION
Contingency theory advises us that a company should seek a proper “fit” to its environment in order to survive (Burns and Stalker, 1961). This ideal has not been so easy to achieve for most companies after economic crises such as the Lehman Crash (the bankruptcy of Lehman Brothers) in 2008; it has been especially hard for most Japanese companies, because they experienced the further crisis of the Great East Japan Earthquake in 2011.
The Japanese automobile industry was one of the sectors that was badly damaged by these crises. Toyota and Nissan both fell into deficit and their downsizing by laying off part-time and temp workers became a public issue. A major tsunami that hit the Hokuriku region in Japan right after the earthquake forced many automakers to close their operations. Despite this series of hardships, Japanese automakers recovered their positions among the top-selling vehicle manufacturers in the world. Behind this feat, there must have been tremendous efforts by auto-parts suppliers; however, little has been shed light on how these suppliers survived these crises.
Literature on handling business crises stresses the importance of “better management” (Champion 1999; Goad 1999), but does not specify what this might
Rev. Integr. Bus. Econ. Res. Vol 5(4) 281
Copyright 2016 GMP Press and Printing (http://buscompress.com/journal-home.html) ISSN: 2304-1013 (Online); 2304-1269 (CDROM); 2414-6722 (Print)
entail. Of the many managerial actions the suppliers could have taken, this paper will focus on their choices in transactions. Japanese auto-parts suppliers are known to maintain close ties with their respective automakers. These cohesive ties often play a role in creating high barriers to entry, leaving automakers few choices for substitutions. For this reason, suppliers have found it difficult to take conspicuous actions like adding other product lines for rival automakers or increasing shipping volumes to them.
However, during the crises in question, suppliers would have felt relatively free to take strategic actions, because their main customers could not pressure them, due to their relatively small current orders. In other words, these times of crisis might provide suppliers with unique opportunities to change their main customers. Under crisis, how did suppliers built transactional relationships with automakers and how well did this work? Is this process different from situations when there is no crisis? This paper seeks to answer these questions. 2. BACKGROUND
Japan’s automobile industry is unique in that major automakers have developed their own keiretsu system. Under this system, auto-parts suppliers maintain long-term and corporative ties with their customers, the automakers. Making transactions in this situation does not merely mean shipping products. The suppliers’ ties with automakers contribute to their accumulation of knowledge, know-how, and technology. This process can be promoted by suppliers making strategic choices in limiting their transactions to deal only with their main automakers. Research has demonstrated the advantages of suppliers having these long-term corporative relationships with automakers in the Japanese automobile industry (Dore, 1983; Asanuma, 1985; Clark and Fujimoto, 1991).
This notion of keiretsu sometimes creates misunderstandings. Despite the long-term and corporative ties with automakers, the number of automakers with which tier-1 auto-parts suppliers transact is not usually limited to one. Put in another way, normal suppliers have built long-term and corporative relationships not only with their main automaker, but also with its rival automakers. Automakers sometimes try to intervene in various ways to exclude their suppliers from transacting with other automakers, for fear of leaking their specific know-how or trade secrets, etc.
Porter (1980) argued that too much dependence on a few large customers, which tend to stress low transaction prices, will contribute to low profitability. According to this idea, suppliers can gain high profitability by diversifying their transaction volume in order to avoid negotiation pressure from their customers, the automakers. As long as they have superior technology, some suppliers can become “independent” by diversifying their customer base so as to avoid such harsh conditions, particularly in terms of price. Successful suppliers can then earn better profits than others.
Rev. Integr. Bus. Econ. Res. Vol 5(4) 282
Copyright 2016 GMP Press and Printing (http://buscompress.com/journal-home.html) ISSN: 2304-1013 (Online); 2304-1269 (CDROM); 2414-6722 (Print)
H1: The less concentrated the ratio of transaction volume a supplier has with automakers, the higher its profit ratio will be.
The condition mentioned in the paragraph above—that the suppliers have superior technology—implies that H1 could be supported only when suppliers have technologies that are not easily substituted by others. One way for suppliers to gain this technological competitiveness is to achieve economies of scope (Panzar and Willig, 1977; 1981). Having a variety of product lines would allow them to achieve this.
H2: The more product lines a supplier has with automakers, the higher its profit ratio will be.
Suppliers having many product lines can easily take action to be independent from their automakers, which may in turn result in higher profits. In other words, suppliers having many product lines, as well as diversifying transaction volumes with automakers, are likely to gain better profits.
H3: The effect on a supplier’s profit of having many product lines is mediated by the concentration ratio of its transaction volume with automakers. That is, a better profit ratio is achieved by a supplier when it has many product lines and low concentrations of transaction volumes with automakers.
The process of hypothesis testing will be outlined in the following section. 3. METHOD 3.1 Data Source
For hypothesis testing, I relied on the data book series, “Survey on Production and Distribution of 200 Main Automobile Parts (Jidosya buhin 200 hinmoku no seisan ryutsu chousa [in Japanese]” published by IRC Co., Ltd. Books in this series (hereafter, “the books of 200-parts”) are issued every two or three years. In this paper, I used the books published in 2005, 2008, 2010, and 2012.
The books of 200-parts contain information on transaction volumes for each of 200 auto parts sold to 12 major Japanese automakers: Toyota, Nissan, Mitsubishi Motors, Honda, Mazda, Suzuki, Daihatsu, Fuji Heavy Industries (Subaru), Isuzu, Hino, Nissan Diesel, and Mitsubishi-Fuso (Fuso). The last four automakers mainly produce commercial vehicles only (buses, trucks, etc.). All the suppliers in this book are so-called tier-1 suppliers for the automakers. When referring to the suppliers’ corporate history, I regard a supplier that changed its company name only (not including corporate merger, acquisition, or integration) as the same supplier.

Rev. Integr. Bus. Econ. Res. Vol 5(4) 283
Copyright 2016 GMP Press and Printing (http://buscompress.com/journal-home.html) ISSN: 2304-1013 (Online); 2304-1269 (CDROM); 2414-6722 (Print)
Table 1. List of the 181 auto parts tracked.
■ENGINE BODY PARTS ■ENGINE VALVE SYSTEM ■ENGINE FUEL SYSTEM■ENGINE INTAKE AND EXHAUSTSYSTEM
engine block (cylinder block) camshaft fuel injector (gasoline) air cleanercylinder liner rocker arm throttle body (gasoline) intake manifoldcrankshaft engine valve pressure regulator turbo chargerconnecting rod valve spring electric fuel indector (diesel) intercoolercrank-shaft bearing metal valve sheet fuel tube exhaust manifoldpiston valve guide fuel filter exhaust pipepiston pin valve lifter fuel gasoline pump EGR valvepiston ring timing belt fuel tank O2 sensorcylinder head timing chain canister catalystcylinder head cover timing crank pully catalystic convertercylinder head gasket timing cam pully mufflerVee belts variable valve timing unitcrankshaft pulley timing auto tensionerflywheel timing belt (chain) coverdrive plate ring gearcylinder head boltengine a'ssy
■ENGINE LUBRICATION /COOLING
■ENGINE ELECTRICALEQUIPMENT
■POWER TRAIN ■STEERING COMPONENT
oil pan ignition coil clutch cover hydraulic power steeringoil strainer igniter clutch disk electric power steeringoil pump spark plug clutch facing hydraulic power steering pumpoil filter glow plug clutch master cylinder electric power steering motoroil seal (engine) starter clutch release cylinder power sterring hoseradiator alternator MT steering wheelwater pump MT shift lever steering columnthermostat shift folk steering column covercooling fan synchronizer ring steering shaftcooling fan driving device AT steering joint
CVT steering link systemtorque converter steering knuckleAT shift leverAT control cabletransferdifferentialmechanical LSDelectric 4WD motorpropellter shaftpropellter shaft joint yokeconstant velocity universal jointsboots for constant velocity universaljoints
■SUSPENSION ■BRAKE ■WHEEL TIRE
coil spring brake disc rotor steel wheelleaf spring disc brake caliper aluminum foilshock absorber disc brake pad full wheel coverstabilizer brake shoe a'ssy tiresuspension ball joint brake drum
brake liningbrake master cylinderbrake wheel cylinderbrake boosterproportioning valvebrake hosebrake tubeABSESCparking brake level pedal
■EXTERIOR EQUIPMENT ■INTERIOR EQUIPMENT ■BODY ELECTRICAL EQUIPMENT ■SUPPLIES
engine mount sheet keyless entry system car air conditionerglass haedrest smart key car heaterfront window molding seat track immobilizer system car audioresin bumper seat recliner head lamp navigation systemrear roof spoiler seat belt rear combination lampsunroof seat belt pretensioner high-mount stop lamproof rail electric pretensioner flasheroutside mirror instrument panel hornradiator grille glove box metermark emblem ashtray lever combination switchwiper a'ssy door trim wire harnesswiper blade molded headerwindow washer sun visordoor handle inner mirrordoor hinge rear package traydoor weather strip accelerator pedaldoor lock (for side doors) clutch pedalwind reglator brake pedal
air bag module (for sides)air bag module (for driver's seats)air bag module (for passenger seats)air bag module (for curtain rail sides)
Note: A part, retarder, was eliminated because it is the part only used for commertial commercial vehicles.
Rev. Integr. Bus. Econ. Res. Vol 5(4) 284
Copyright 2016 GMP Press and Printing (http://buscompress.com/journal-home.html) ISSN: 2304-1013 (Online); 2304-1269 (CDROM); 2414-6722 (Print)
In terms of auto parts, I tracked 181 such parts that appeared in common in all issues of the book of 200-parts. They are listed in Table 1.
3.2 Dependent Variables
Suppliers’ profit ratios were obtained from three resources. The first is “Current Status of the Japanese Automobile Part Suppliers Industry (Nihon no Jidosya Buhin Sangyo no Jittai [in Japanese])” by IRC Co., Ltd (hereafter, “the books of current status”). This series includes information on over 1,000 auto-parts suppliers, including their sales figures and current profits.
I used the books of current status issued in 2004, 2007, 2010, and 2013 (this series is also published periodically, appearing every three to four years) and linked the information in these books with corresponding data in the books of 200-parts by company name. Around 70% of the suppliers appeared in both book series. For those suppliers whose sales and profit figures were not indicated in the books of current status, I turned to another data series, “Japanese Automotive Parts Industry (Nihon no Jidosya Buhin Kogyo [in Japanese]), published almost every year by the Japan Auto Parts Industries Association. Additionally, for suppliers listed on the stock exchange, missing figures were substituted by a commercial database, the EOL. This being done, I limited the sample to suppliers with at least one year’s profit in the publication year of a particular book of 200-parts or its successive year. For example, when I used the books of 200-parts in 2005 for an analysis, current profit ratios of the suppliers in 2005 and 2006 were collected and then averaged (a few suppliers with either extremely high profit ratios of 40% or above, or very low ratios of −40% or be low, were eliminated in advance). The final numbers of suppliers I obtained were 296 in 2005, 261 in 2008, 238 in 2010, and 209 in 2013. 3.3 Independent Variables
The information for independent variables was all taken from the books of 200-parts.
The first independent variable is the concentration of transaction volume of suppliers (for testing H1). Suppose a supplier ships two different parts to Toyota and Daihatsu. If it ships part A to Toyota only, with a volume of 200, the transaction volume ratio of this part is 100% with Toyota. If it ships part B to Toyota with a volume of 300 and to Daihatsu with a volume of 100, the transaction volume ratio of this part becomes 75% for Toyota and 25% for Daihatsu. Each transaction volume ratio is then averaged by the number of auto parts the supplier shipped. In this case, it becomes 0.875 (= (1 + 0.75) / 2) for Toyota and 0.125 (= (0 + 0.25) / 2) for Daihatsu. The HHI (Herfindahl- Hirschman Index) is then made from these numbers, resulting in 0.78125 (=0.8752 + 0.1252).
The next variable is the number of product lines (for testing H2). It is made by simply counting the number of product lines a supplier produced among the 182 parts

Rev. Integr. Bus. Econ. Res. Vol 5(4) 285
Copyright 2016 GMP Press and Printing (http://buscompress.com/journal-home.html) ISSN: 2304-1013 (Online); 2304-1269 (CDROM); 2414-6722 (Print)
that are tracked in this study. Since the number obtained was highly skewed (mean: 2.86, min: 1, max: 33), a natural log was taken before the analysis.
The interaction term, the final variable, is made with standardized numbers of the above two variables. 3.4 Controls
Since the suppliers’ profit ratios could be affected by the characteristics of the particular automakers with which they mainly transacted, their average ratios of transaction (shipping) volume in the above process were input as control variables. In order to take the economic situation into consideration, year dummies were also inserted as control variables.
In addition, because the number of auto parts produced by a supplier was assumed to correlate with company size, a natural log of sales in the same period for the dependent variables was added into the analysis (I did not use the number of employees for this measure, because not all suppliers supplied this figure). 4. RESULTS
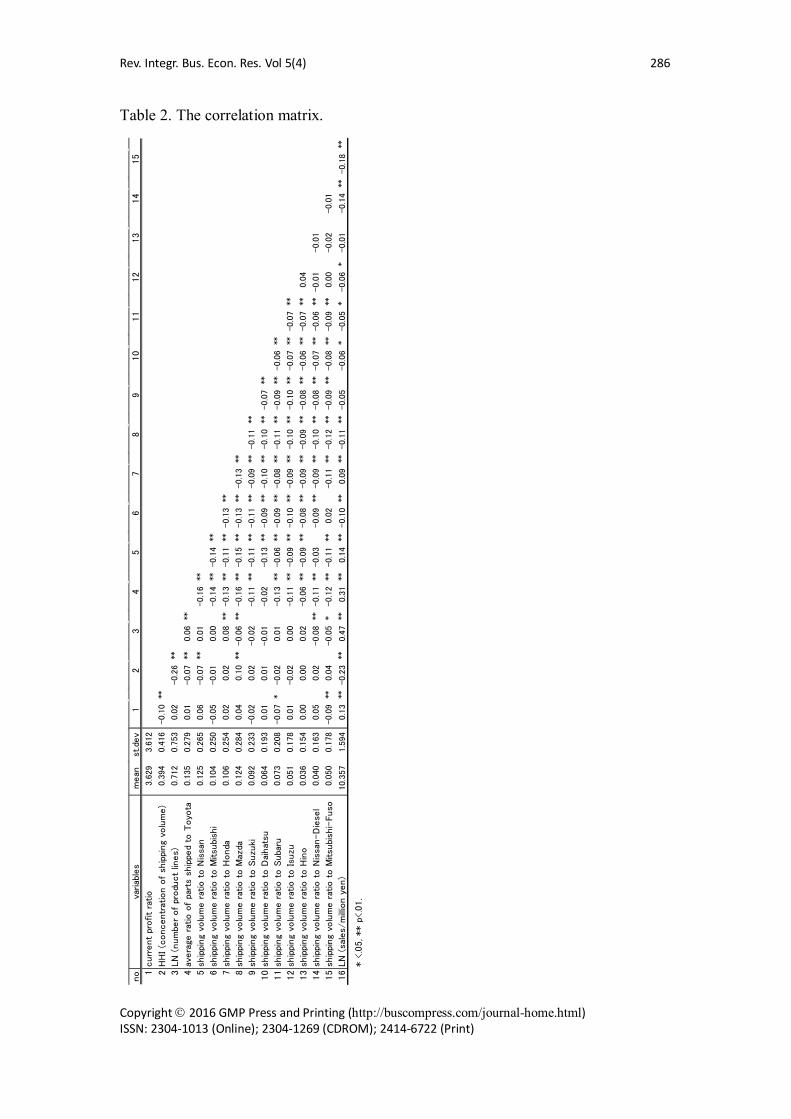
Table 2 shows the correlation matrix among the variables. No strong correlations over 0.5 were found among independent variables. I then set regression models with data over the whole duration, as well as in each observation year. The results are summarized in Table 3.
From the column “all periods,” it is clear that the coefficient of the HHI was negative and significant, showing that diversifying transaction volume among automakers results in higher profit (H1 is supported). The results show that diversifying the transaction volume among automakers generally worked well, which is consistent with the findings of Nobeoka (1996) and Ikeuchi et al. (2005). On the other hand, the coefficient of the number of product lines (different auto parts treated) was negative, rejecting H2. This implies that economies of scope are not likely to be established by simply increasing the number of product lines. This should rather be accomplished by broadening the customer base. H3 is also confirmed, because the coefficient of the interactive term was negative and significant.
However, the effect on the interactive term was limited. Looking into the details, the interaction term between the HHI and the number of parts treated is significant only in 2005. Although the signs on the coefficients are all negative, it is safe to say that H3 is not always supported, maybe due to the rejection of H2 (the absolute value on the interactive term was slightly large when the ones on the number of product lines are positive). H1 is also not universal. The negative effect on the HHI is once mitigated in 2008 and 2010, and reappears in 2012.
Rev. Integr. Bus. Econ. Res. Vol 5(4) 286
Copyright 2016 GMP Press and Printing (http://buscompress.com/journal-home.html) ISSN: 2304-1013 (Online); 2304-1269 (CDROM); 2414-6722 (Print)
Table 2. The correlation matrix.
no
variab
les
mean
st.d
ev
1curr
ent
profit
ratio
3.6
29
3.6
12
2H
HI (c
oncentr
atio
n o
f sh
ippi
ng
volu
me)
0.3
94
0.4
16
-0.1
0**
3LN
(num
ber
of
produ
ct
lines)
0.7
12
0.7
53
0.0
2-0.2
6**
4av
era
ge r
atio
of
part
s sh
ippe
d to
Toyo
ta0.1
35
0.2
79
0.0
1-0.0
7**
0.0
6**
5sh
ippi
ng
volu
me r
atio
to N
issa
n0.1
25
0.2
65
0.0
6-0.0
7**
0.0
1-0.1
6**
6sh
ippi
ng
volu
me r
atio
to M
itsu
bish
i0.1
04
0.2
50
-0.0
5-0.0
10.0
0-0.1
4**
-0.1
4**
7sh
ippi
ng
volu
me r
atio
to H
onda
0.1
06
0.2
54
0.0
20.0
20.0
8**
-0.1
3**
-0.1
1**
-0.1
3**
8sh
ippi
ng
volu
me r
atio
to M
azda
0.1
24
0.2
84
0.0
40.1
0**
-0.0
6**
-0.1
6**
-0.1
5**
-0.1
3**
-0.1
3**
9sh
ippi
ng
volu
me r
atio
to S
uzu
ki0.0
92
0.2
33
-0.0
20.0
2-0.0
2-0.1
1**
-0.1
1**
-0.1
1**
-0.0
9**
-0.1
1**
10
ship
ping
volu
me r
atio
to D
aihat
su0.0
64
0.1
93
0.0
10.0
1-0.0
1-0.0
2-0.1
3**
-0.0
9**
-0.1
0**
-0.1
0**
-0.0
7**
11
ship
ping
volu
me r
atio
to S
uba
ru0.0
73
0.2
08
-0.0
7*
-0.0
20.0
1-0.1
3**
-0.0
6**
-0.0
9**
-0.0
8**
-0.1
1**
-0.0
9**
-0.0
6**
12
ship
ping
volu
me r
atio
to Isu
zu0.0
51
0.1
78
0.0
1-0.0
20.0
0-0.1
1**
-0.0
9**
-0.1
0**
-0.0
9**
-0.1
0**
-0.1
0**
-0.0
7**
-0.0
7**
13
ship
ping
volu
me r
atio
to H
ino
0.0
36
0.1
54
0.0
00.0
00.0
2-0.0
6**
-0.0
9**
-0.0
8**
-0.0
9**
-0.0
9**
-0.0
8**
-0.0
6**
-0.0
7**
0.0
4
14
ship
ping
volu
me r
atio
to N
issa
n-D
iese
l0.0
40
0.1
63
0.0
50.0
2-0.0
8**
-0.1
1**
-0.0
3-0.0
9**
-0.0
9**
-0.1
0**
-0.0
8**
-0.0
7**
-0.0
6**
-0.0
1-0.0
1
15
ship
ping
volu
me r
atio
to M
itsu
bish
i-Fuso
0.0
50
0.1
78
-0.0
9**
0.0
4-0.0
5*
-0.1
2**
-0.1
1**
0.0
2-0.1
1**
-0.1
2**
-0.0
9**
-0.0
8**
-0.0
9**
0.0
0-0.0
2-0.0
1
16
LN
(sa
les/
millio
n y
en)
10.3
57
1.5
94
0.1
3**
-0.2
3**
0.4
7**
0.3
1**
0.1
4**
-0.1
0**
0.0
9**
-0.1
1**
-0.0
5-0.0
6*
-0.0
5*
-0.0
6*
-0.0
1-0.1
4**
-0.1
8**
* <
.05, ** p
<.0
1.
67
89
10
11
12
13
14
15
12
34
5

Rev. Integr. Bus. Econ. Res. Vol 5(4) 287
Copyright 2016 GMP Press and Printing (http://buscompress.com/journal-home.html) ISSN: 2304-1013 (Online); 2304-1269 (CDROM); 2414-6722 (Print)
Table 3. Results of multiple regression analysis.
no variables1 HHI (concentration of shipping volume) -0.123 *** -0.187 ** -0.046 -0.095 -0.190 **
2 LN (number of product lines) 0.010 0.048 0.067 -0.021 -0.0773 interaction term (1 x 2) -0.098 ** -0.181 ** -0.096 -0.075 -0.0354 shipping volume ratio to Toyota ― ― ― ― ― 5 shipping volume ratio to Nissan 0.044 -0.041 0.055 0.121 0.0786 shipping volume ratio to Mitsubishi -0.031 -0.145 * 0.117 -0.018 -0.0787 shipping volume ratio to Honda 0.055 0.014 0.137 0.064 0.0308 shipping volume ratio to Mazda 0.051 0.005 0.126 0.071 0.0169 shipping volume ratio to Suzuki -0.020 -0.069 0.081 -0.015 -0.081
10 shipping volume ratio to Daihatsu 0.021 -0.067 0.107 0.060 0.00111 shipping volume ratio to Subaru -0.050 -0.107 0.039 -0.019 -0.13612 shipping volume ratio to Isuzu 0.023 0.012 0.111 -0.036 -0.00713 shipping volume ratio to Hino 0.020 -0.058 0.138 * -0.040 0.04614 shipping volume ratio to Nissan-Diesel 0.064 * 0.074 0.134 * -0.036 0.11215 shipping volume ratio to Mitsubishi-Fuso -0.060 -0.136 * -0.073 0.005 -0.03016 LN (sales) 0.100 ** 0.037 0.182 * 0.075 0.12517 dummy on year 2005 -0.019 ― ― ― ― 18 dummy on year 2008 -0.330 *** ― ― ― ― 19 dummy on year 2010 -0.154 *** ― ― ― ― 20 dummy on year 2012 ― ― ― ― ―
0.155 0.126 0.101 0.058 0.12310.0 *** 2.7 ** 1.8 * 0.9 1.8 *
1,004 296 261 238 209
Note: Numeric numbers represent standadized partial coefficients (* p<.05, ** p<.01, *** p<.001). The maximum value of VIF is 1.726.
all periods 2005 2008 2010 2012
R2
Fnumber of observations
5. DISCUSSION 5.1 Additional Analysis
I would like to consider the fact that the effect on the HHI disappeared in the years 2008 and 2010. The implies that the Lehman Crash in 2008 triggered modifications of the transaction process, but that the Great East Japan Earthquake in 2011 did not have a strong impact on suppliers’ choices in transactions. Rather, in facing the earthquake, Japanese automakers and their auto-parts suppliers appear to have acted to strengthen their unity to survive the hardships.
By contrast, right after the Lehman Crash, there seems to be no clear strategy that worked for the suppliers. Reflecting this, indicators of the fitness of the regression models (i.e., R2 or F) in these periods are quite low. Thinking about it in another way, the crisis could have provided a chance for many suppliers that wanted to change their main customers. Successful suppliers might have gained relatively better profits by changing their customers during this crisis. I will continue this discussion by putting forward the following hypothesis with an additional analysis.
H4: The more a supplier changed its transaction volume or product lines during the crisis, the better its profits after the crisis will be.
5.2 Dependent Variable

Rev. Integr. Bus. Econ. Res. Vol 5(4) 288
Copyright 2016 GMP Press and Printing (http://buscompress.com/journal-home.html) ISSN: 2304-1013 (Online); 2304-1269 (CDROM); 2414-6722 (Print)
From Figure 1, as I will show later, the suppliers’ profits after the crisis seemed to recover during and after 2011. I then averaged current profit ratios from 2011 to 2013 to obtain a dependent variable.
5.3.1 Change of customer concentration
The HHI index was used to construct the change of customer concentration. The variables were set as the difference between the HHI in a given year from that in the next observation year. Using the HHI in 2005, 2008, 2010, and 2012, the following variables were made:
yyeartheinifirmaofindexHHItheofnumberyHHIwhere
HHIHHIionconcentratcustomerofChangeHHIHHIionconcentratcustomerofChangeHHIHHIionconcentratcustomerofChange
i
iii
iii
iii
__:)(
)2010()2012()20122010()2008()2010()20102008()2005()2008()20082005(
−=−−=−−=−
5.3.2 Change of number of product lines
The changes of the number of product lines were made by subtracting the number of product lines a supplier had in a year from the one in the next observation year.
yyeartheinifirmaoflinesproductofnumbertheofLNyplwhere
plpllinesproductofnumofChangeplpllinesproductofnumofChangeplpllinesproductofnumofChange
i
iii
iii
iii
__:)(
)2010()2012()20122010(__)2008()2010()20102008(__)2005()2008()20082005(__
−=−−=−−=−
5.3.3 Absolute change of transaction volume ratio
The change of transaction volume ration was determined by the absolute value of subtraction of the difference between the transaction volume ratios in a given year from the ones in the next observation year.
yyeartheinifirmaofcarcustomeratovolumentransactioofratioytrawhere
tratraratiovolumentransactioofchangeAbsolute
tratraratiovolumentransactioofchangeAbsolute
tratraratiovolumentransactioofchangeAbsolute
icar
caricaricari
caricaricari
caricaricari
__)(:)(
)2010()2012()20122010(
)2008()2010()20102008(
)2005()2008()20082005(
,
,,
,,
,,
∑
∑
∑
−=−
−=−
−=−

Rev. Integr. Bus. Econ. Res. Vol 5(4) 289
Copyright 2016 GMP Press and Printing (http://buscompress.com/journal-home.html) ISSN: 2304-1013 (Online); 2304-1269 (CDROM); 2414-6722 (Print)
5.3.4 Dummy for the change of main customer
Using the average ratios of transaction volume, the main customers for each supplier (those automakers having the highest transaction volume ratio for a supplier) were detected. When two or more automakers had the same highest ratio, all of them were regarded as the supplier’s main customers. Comparing the main customers in a year with the ones in the next observation year, for cases where the former included at least one of the latter (i.e., when a supplier retained at least one of its main customers), a dummy variable was set to 0 (otherwise, 1). Like the former variables, these dummies were constructed over 2005-2008, 2008-2010, and 2010-2012.
5.3.5 Control
As in the former analysis, a natural log of sales during 2011-2013 (the same period for the dependent variable) was added to the analysis as a control variable.
5.4 Results of the additional analysis
Since these variables require transaction volume in successive observation years, I limit the analysis to suppliers that had shipped at least one auto part in all observation years (2005, 2008, 2010, and 2012). The results of the additional analysis are summarized in Table 4.
These results show that there is no strong positive effect of any these variables on profits. The only variable with a significant level except the control variable was the dummy on the change of main customer in 2008-2010, in the midst of the Lehman Crash. This shows that changing main customers during the crisis was harmful to them.
Table 4. Results of the analysis (predicting average current profit ratios in 2011-13).
depandent variables std coeff pChange of customer concentration (2005-2008) 0.009 0.902Change of customer concentration (2008-2010) 0.008 0.910Change of customer concentration (2010-2012) -0.070 0.351Change of number of product lines (2005-2008) -0.021 0.759Change of number of product lines (2008-2010) -0.056 0.421Change of number of product lines (2010-2012) -0.034 0.629Absolute change of transaction volume ratio (2005-2008) -0.103 0.308Absolute change of transaction volume ratio (2008-2010) 0.135 0.093Absolute change of transaction volume ratio (2010-2012) 0.139 0.148Dummy for the change of main customer (2005-2008) 0.153 0.152Dummy for the change of main customer (2008-2010) -0.165 0.039 *
Dummy for the change of main customer (2010-2012) -0.046 0.589LN average sales (2011-2013) 0.173 0.011 *
R2 0.085F 1.5
Note: N=223. The maximum value of VIF = 2.574.

Rev. Integr. Bus. Econ. Res. Vol 5(4) 290
Copyright 2016 GMP Press and Printing (http://buscompress.com/journal-home.html) ISSN: 2304-1013 (Online); 2304-1269 (CDROM); 2414-6722 (Print)
5.5 Interpretation
Contrary to expectations, taking strategic actions (changing their main customers) during the crisis was not a good choice for the suppliers. To confirm this, I compared the average profit ratios of the suppliers that changed their main customers between 2008 and 2010 with ones that did not.
The main reason for suppliers to change their main customers in the crisis may have been that they could earn near-term profits in the crisis. Seeing the average profit ratio in 2009 in Fig 1, this tactic seemed to work in the midst of the crisis (the average profit ratio of the suppliers that changed their main customers is higher than that of the suppliers that did not). However, this group experienced a slower recovery after the crisis.
These findings suggest that suppliers’ opportunistic behavior, especially in a crisis, ended up in ruining confidence from their customers. They might not have been able regain sufficient support from their former main customers; or changing main customers might have required them to acquire new knowledge about the new customer. The background of this phenomenon remains to be seen, but damaging the faith of customers, especially in hard times, did not work in the long run in the Japanese automobile industry.
0
1
2
3
4
5
6
2005 2006 2007 2008 2009 2010 2011 2012 2013
averagecurrentprofit
ratio (%)
year
not changedchanged
Fig 1. Current profit ratios of suppliers that either changed or did not change their main customers between 2008-2010.
6. CONCLUSION
Previous studies have reported beneficial effects for suppliers that diversify their customer base. In this respect, this paper added a new perspective in viewing the same effect longitudinally. The results revealed that this effect worked only when the economic situation was good. This paper also revealed that the number of product lines that suppliers carried had almost no effect on their performance, which was

Rev. Integr. Bus. Econ. Res. Vol 5(4) 291
Copyright 2016 GMP Press and Printing (http://buscompress.com/journal-home.html) ISSN: 2304-1013 (Online); 2304-1269 (CDROM); 2414-6722 (Print)
contrary to our expectations. Suppliers’ economies of scope are not likely be achieved by simply adding more product lines. These findings show that we need to pay more attention to suppliers’ strategic choices.
Focusing especially on the Lehman Crash, the suppliers seem to have searched for alternative strategies to gain near-term income. However, the additional analysis showed us that such suppliers should not take opportunistic actions that could undermine the confidence that had been built up with their customers.
This paper has several limitations. The most serious one may arise from the data sources. Although I endeavored to collect as many samples as possible using the four resources, some suppliers that did not appear in these sources could not be taken into account. In addition, among the suppliers in this paper, there were some big companies like Panasonic whose main domain was not in the auto parts industry. To get a more precise perspective, I have to consider carefully which suppliers should be tested.
Given these limitations, I am now planning to add further information to this data set. When this process is complete, I will undertake the next inquiry.
ACKNOWLEDGEMENT
This research is partially supported by the Nagai Foundation for Science & Technology. I would like to express my gratitude to a fellow researcher, Dr. Tomomi Hamada for her support throughout the project.
REFERENCES
[1] Asanuma, B. (1985), “The organization of parts purchases in the Japanese automotive industry”, Japanese Economic Studies, Summer, 32-53.
[2] Burns, T. and Stalker, G. (1961), The Management of Innovation, London, England: Tavistock.
[3] Champion, D.(1999), “The Asian crisis: The price of under- management”, Harvard Business Review, 77 (March/April): 14-15.
[4] Clark, K., and Fujimoto, T. (1991), Product Development Performance, Harvard Business Press.
[5] Dore, R. (1983), “Goodwill and the spirit of market capitalism”, British Journal of Sociology, 34(4): 459-482.
[6] Goad, G. Pierre (1999), “Playing by new rules”, Far Eastern Economic Review, 162 (May), 38-40.
[7] Ikeuchi, K. Fukao, K., Goko, H. Kim, Y, and Kwon, H. U.(2015), “The investigation of the effect of openness in trade on its productivity in Japanese automobile industry”, RIETI Discussion Paper Series,15-J-017 (in Japanese).
[8] IRC, Co, Ltd. (2005 ; 2008 ; 2010 ; 2012 ; 2014), Survey on Production and Distribution of 200 Automotive Parts, IRC, Co, Ltd (in Japanese).

Rev. Integr. Bus. Econ. Res. Vol 5(4) 292
Copyright 2016 GMP Press and Printing (http://buscompress.com/journal-home.html) ISSN: 2304-1013 (Online); 2304-1269 (CDROM); 2414-6722 (Print)
[9] IRC, Co, Ltd. (2004 ; 2007 ; 2010 ; 2013), Current Status of the Japanese Automobile Part Suppliers Industry, IRC, Co, Ltd (in Japanese).
[10] Japan Auto Parts Industries Association (2005 ; 2006 ; 2007 ; 2008 ; 2010 ; 2011 ; 2012 ; 2014; 2015), Japanese Automotive Parts Industry, Japan Auto Parts Industries Association (in Japanese).
[11] Nobeoka, K. (1996), “The influence of economies of customer scope on supplier's performance”, Journal of Economics & Business Administration (The Kokumin-Keizai Zasshi), 173(6): 83-100 (in Japanese).
[12] Panzar, J. C., and Willig, R. D. (1977), “Economies of scale in multi-output production”, Quarterly Journal of Economics, 91(3): 481-493.
[13] Panzar, J. C., and Willig, R. D. (1981), “Economies of scope”, American Economic Review, 71(2): 268-272.
[14] Porter, M. E. (1980), Competitive Strategy, NY: Free Press