Embed Size (px)
Citation preview

HOW SALES AND SERVICES TAX (SST)
BRINGS SOCIAL AND ECONOMIC
IMPACT COMPARED TO GOODS AND
SERVICES TAX (GST) IN MALAYSIA?

How Sales and Services Tax (SST) brings social and economic impact compared to Goods
and Services Tax (GST) in Malaysia?
MSC IN INTERNATIONAL ACCOUNTING AND FINANCE
MASTER DISSERTION
TITLE OF TOPIC:
HOW SALES AND SERVICES TAX (SST) BRINGS SOCIAL
AND ECONOMIC IMPACT COMPARED TO GOODS AND
SERVICES TAX (GST) IN MALAYSIA?
Angeline Sing Yee Lim 10354941
DUBLIN BUSINESS SCHOOL

How Sales and Services Tax (SST) brings social and economic impact compared to Goods
and Services Tax (GST) in Malaysia?
I
Declaration
I hereby declare that this Postgraduate dissertation entitled “How Sales and Services Tax
(SST) brings social and economic impact compared to Goods and Services Tax (GST) in
Malaysia?” was carried out by me for the degree of Master of Science in International
Accounting and Finance. This thesis is a presentation of my original research work.
Wherever contributions of others are involved, every effort is made to indicate this clearly,
with due reference to the literature, and acknowledgement of collaborative research and
discussion. This work was done under the guidance and supervision of Mr. Andrew Quinn,
Dublin Business School.
For the present dissertation, which I am submitting to Dublin Business School, no degree or
diploma or distinction has been conferred on me before, either in this way or in an other
University.
Angeline Lim
Date: 20 August 2019

How Sales and Services Tax (SST) brings social and economic impact compared to Goods
and Services Tax (GST) in Malaysia?
II
Acknowledgement
First of all, I submit my hearties gratitude to my respected dissertation supervisor Andrew
Quinn, for his sincere guidance, help and advice during the research process for completing
this dissertation.
I am deeply indebted to my lecturers and staff in Dublin Business School for their invaluable
help in preparing this dissertation.
I revere the patronage and moral support extended with love, by my parents whose financial
support and passionate encouragement made it possible for me to complete this project.
My joy knows no bound in expressing my cordial gratitude to my father Jason Lim. His keen
interest and encouragement were a great help throughout the course of this research work. I
thank my fellow best friends: Wong Yiit and Aun Kee, thanks for keeping me company on
long walks.
Last but not least, I humbly extend my thanks to all concerned persons who co-operated with
me in this regard.

How Sales and Services Tax (SST) brings social and economic impact compared to Goods
and Services Tax (GST) in Malaysia?
III
Abstract
There are various reactions, arguments and opinions among the society as a result of the
government reintroduce the Sales and Services Tax (SST) from 1st of September this year.
Some of them gave positive responds as the implementation resulted in increasing savings
and others responded with negative feedbacks as this tax implementation may cause burden
to people. It implies that people were still blurred and did not fully understand what SST 2.0
is all about, and many are actually ignorant. Therefore, this research investigates the views of
tax payers in Malaysia on the implementation of Sales and Services Tax (SST) which brings
social and economic impact. It also analyses the overall economy of Malaysia in the past 40
years, in the aspects of tax changes. A pragmatic approach is taken into consideration in order
to offer more flexibility. Survey questionnaires were sent and results collected from
diversified industries and professionals. Collectively, the results revealed that most of the tax
payers are supporting SST. The sample selection was made randomly. The outcome of this
study shows a positive relationship between the behavior and support of Sales and Services
Tax (SST) compared to Goods and Services Tax (GST). In short, people are willing to accept
the change to implement SST.
Keywords: Sales and Services Tax (SST), Impact, Malaysia.

How Sales and Services Tax (SST) brings social and economic impact compared to Goods
and Services Tax (GST) in Malaysia?
IV
TABLE OF CONTENTS
Chapter No. Content Page Number
Declaration I
Acknowledgements II
Abstracts III
Table of Contents IV-VI
List of Tables VII-VIII
List of Figures IX-X
List of Abbreviations XI
Chapter 1 INTRODUCTION
1.0 Introduction 1
Chapter 2 LITERATURE REVIEW
2.0 Introduction 2
2.1 Sales and Services (SST) 2.0
2.1.1 Concept and Meaning of SST 3
2.1.2 Registration of SST 4
2.1.3 Computation of SST 5-6
2.2
Distinction between Goods and Services Tax (GST) and Sales
and Services Tax (SST)
2.2.1 Basic understanding 7-11
2.2.2 Tax system 12
2.2.3 Taxable goods and services 13
2.2.4 Payment of tax and periods of accounting 13
2.2.5 Advantages 13
2.2.6 Disadvantages 14
2.3 Application of GST Governance in the world
2.3.1 Introduction 15
2.3.2 Countries adopted GST 15-17
2.3.3 Conclusion 18
2.4 Consequences of Goods and Services Tax (GST)
2.4.1 Nature of GST 19
2.4.2 Inflation 19-22
2.4.3 Tax group 23
2.4.4 Economic of Malaysia 24
2.4.5 Conclusion 25
2.5 Theoretical Framework

How Sales and Services Tax (SST) brings social and economic impact compared to Goods
and Services Tax (GST) in Malaysia?
V
2.5.1 Conceptual Framework 26
2.5.2 Theory of Planned Behaviour 27-30
2.5.3 Financial Self-Interest Expanded Model 31-33
2.5.4 Conclusion 34
2.6 Background of Goods and Services Tax (GST)
2.6.1 Introduction 35
2.6.2 History of GST 35
2.6.3 What is GST? 36
2.6.4 GST Mechanism 37
2.6.5 Malaysia Government Revenue before re-introduce of
SST 38
Chapter 3 RESEARCH METHODOLOGY
3.0 Introduction 39
3.1 Research Design 39
3.2 Research Questions 39
3.2.1 Proposed Methodology 40
3.3 Research Philosophy 41
3.4 Research Approach 42
3.5 Research Strategy 43
3.6 Research Choices 44
3.6.1 Qualitative methods 44
3.6.2 Quantitative methods 45
3.7 Time Horizon 46
3.8 Sampling 47
3.9 Data Analysis Techniques and Procedures 48
3.10 Research Ethics 48
3.11 Limitations of Methodology 49
Chapter 4 SURVEY FINDINGS AND ANALYSIS
4.0 Introduction 50
4.1 Findings and Analysis of the Results of Questionnaire 50-73
4.2 Further Analysis 73-76
Chapter 5 CONCLUSIONS AND RECOMMENDATIONS
5.1 Conclusions 77-78
5.2 Recommendations 78-79
5.3 Personal Reflections 80
5.4 Suggestions for Further Research 81
Chapter 6 REFERENCES 82-86

How Sales and Services Tax (SST) brings social and economic impact compared to Goods
and Services Tax (GST) in Malaysia?
VI
Chapter 7 APPENDICES
Cover Letter for Questionnaire 87-89
Survey Questionnaire 90-96
Informed Consent Form 97-98
Poster Design 99

How Sales and Services Tax (SST) brings social and economic impact compared to Goods
and Services Tax (GST) in Malaysia?
VII
LIST OF TABLES
Chapter 2 - Literature Review
Table 1.1 Goods exempted from Sales Tax 4
Table 1.2 Sales Tax 5
Table 1.3 Services Tax 6
Table 1.4 Difference between SST and GST 7-8
Table 1.5 Comparison GST and SST 10-11
Table 1.6 Number of countries based on regions adopted GST 15
Table 1.7 Selected countries and current rate of GST 16
Table 1.8 Current GST rate and inflation rate in each country 20-21
Table 1.9 Different tax groups and tax rate 23
Table 1.10 Tax groups and their average inflation rate and tax rate 24
Table 1.11 History of GST 35
Table 1.12 Example of taxable supply and non-taxable supply 36-37
Chapter 3- Research Methodology
Table 2.1 Positivism and interpretivism 43
Table 2.2 Weekly planned timeline of research 46
Table 2.3 Proposed surveyors 47
Chapter 4 - Survey Findings and Analysis
Table 3.1 Business sector or industry 51
Table 3.2 Current classification 52
Table 3.3 Role in organization 53
Table 3.4 Duration in industry 54
Table 3.5 Education 55
Table 3.6 Annual income after tax 56
Table 3.7 Choices of staying in a country with SST 57
Table 3.8 Knowledge of SST 58
Table 3.9 Awareness of replacement 59
Table 3.10 View of SST a fair and just tax 60

How Sales and Services Tax (SST) brings social and economic impact compared to Goods
and Services Tax (GST) in Malaysia?
VIII
Table 3.11 Fairness of SST 61
Table 3.12 View of fundamental structural problem in tax system 62
Table 3.13 Major cause of structural problem 63
Table 3.14 Necessity to introduce a new tax system 64
Table 3.15 Impact on Malaysia economy 65
Table 3.16 Expectation of the introduction of SST to be revenue neutral 66
Table 3.17 Expectation of tax rate in 5 years times 67
Table 3.18 Agreement with the implementation of SST 68
Table 3.19 Agree with SST implementation 69
Table 3.20 Disagree with SST implementation 70
Table 3.21 Appropriateness of SST tax rate 71

How Sales and Services Tax (SST) brings social and economic impact compared to Goods
and Services Tax (GST) in Malaysia?
IX
LIST OF FIGURES
Chapter 2 - Literature Review
Figure 1.1 Comparison SST and GST 9
Figure 1.2
Changes in inflation rate between year before and after the
implementation of GST 21
Figure 1.3
Changes in inflation rate between current and year after the
implementation of GST 22
Figure 1.4 Annual GDP growth for Malaysia in year 2017 25
Figure 1.5 Annual GDP growth for Malaysia in year 2018 25
Figure 1.6 Theoretical framework 26
Figure 1.7 Theory of Reasoned Action (TRA) 27
Figure 1.8 Theory of Planned Behaviour (TPB) 28
Figure 1.9 Theory of Planned Behaviour (TPB) 30
Figure 1.10 Financial Self-Interest Model 31
Figure 1.11 Expanded Model 32
Figure 1.12 Malaysia Government Revenue 38
Chapter 3 - Research Methodology
Figure 2.1 Research Onion 40
Chapter 4 - Survey Findings and Analysis
Figure 3.1 Business sector or industry 52
Figure 3.2 Current classification 52
Figure 3.3 Role in organization 53
Figure 3.4 Duration in industry 54
Figure 3.5 Education 55
Figure 3.6 Annual income after tax 56
Figure 3.7 Choices of staying in a country with SST 57
Figure 3.8 Knowledge of SST 58
Figure 3.9 Awareness of replacement 59
Figure 3.10 View of SST a fair and just tax 60
Figure 3.11 Fairness of SST 61

How Sales and Services Tax (SST) brings social and economic impact compared to Goods
and Services Tax (GST) in Malaysia?
X
Figure 3.12 View of fundamental structural problem in tax system 62
Figure 3.13 Major cause of structural problem 63
Figure 3.14 Necessity to introduce a new tax system 64
Figure 3.15 Impact on Malaysia economy 65
Figure 3.16 Expectation of the introduction of SST to be revenue neutral 66
Figure 3.17 Expectation of tax rate in 5 years times 67
Figure 3.18 Agreement with the implementation of SST 68
Figure 3.19 Agree with SST implementation 70
Figure 3.20 Disagree with SST implementation 71
Figure 3.21 Appropriateness of SST tax rate 72
Figure 3.22 Annual income vs the view to implement SST 73
Figure 3.23 Education and view to implement SST 74
Figure 3.24 Annual income and appropriateness of tax 75
Figure 3.25 Financial services and banking and view to implement SST 76
How Sales and Services Tax (SST) brings social and economic impact compared to Goods
and Services Tax (GST) in Malaysia?
XI
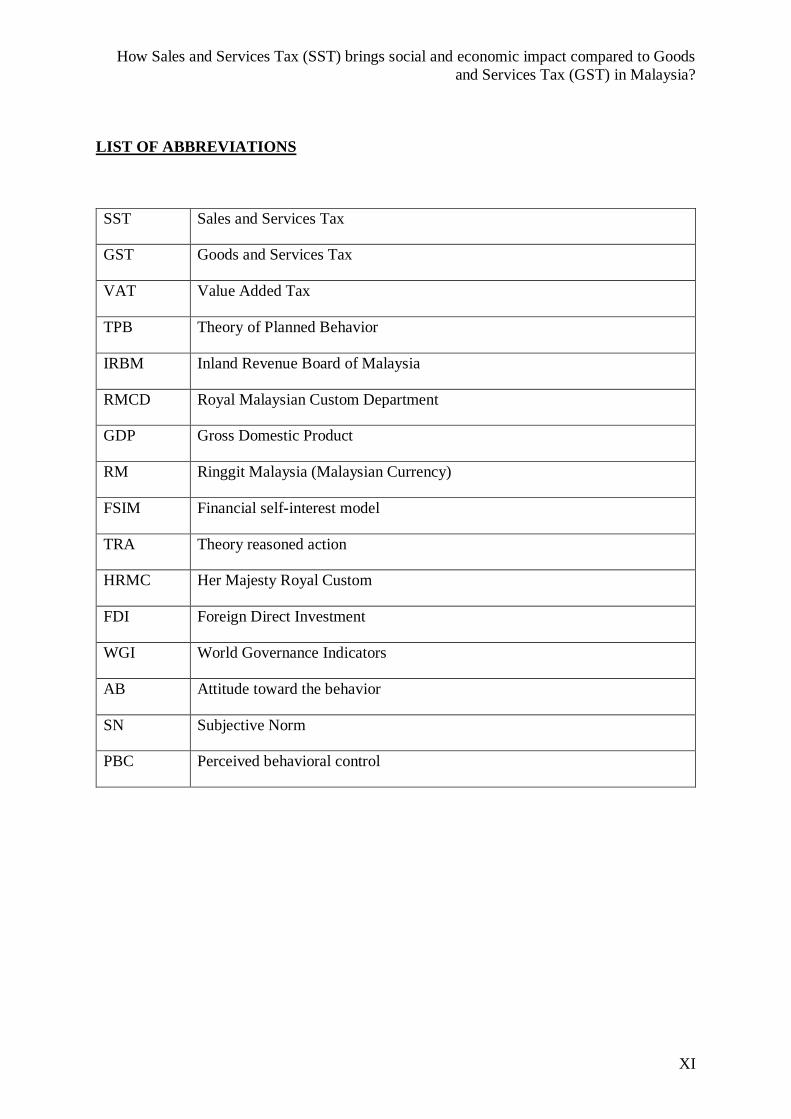
LIST OF ABBREVIATIONS
SST Sales and Services Tax
GST Goods and Services Tax
VAT Value Added Tax
TPB Theory of Planned Behavior
IRBM Inland Revenue Board of Malaysia
RMCD Royal Malaysian Custom Department
GDP Gross Domestic Product
RM Ringgit Malaysia (Malaysian Currency)
FSIM Financial self-interest model
TRA Theory reasoned action
HRMC Her Majesty Royal Custom
FDI Foreign Direct Investment
WGI World Governance Indicators
AB Attitude toward the behavior
SN Subjective Norm
PBC Perceived behavioral control

How Sales and Services Tax (SST) brings social and economic impact compared to Goods
and Services Tax (GST) in Malaysia?
1
CHAPTER – 1
INTRODUCTION
1.0 INTRODUCTION
Malaysia has undergone substantial reforms in indirect taxes over the past two
decades and is on the verge of another major reform initiative which will bring this process to
a culmination. As a progressive and welfare oriented country, Malaysia is targeting to
balance the requirements of direct and indirect taxes in a fair manner. Therefore, too much
dependence on direct taxes will be restrictive but at the same time passing a heavy burden to
the general public by way of indirect taxes and will constitute hardships to the common
citizen. The past experience in Malaysia and elsewhere have shown that half-baked reforms
in the name of direct tax, indirect tax and GST have done more harm than good in
introducing a tax system required for a competitive environment. Therefore, it is important to
evaluate how this scenario changes from SST to GST and GST to SST.
Tax in Malaysia was proclaimed by the British into the Federation of Malaya in 1947.
At first, the Income Tax Ordinance 1947 was gazetted as the overwhelming demonstration,
however was in this way restored and at last changed over by the Income Tax Act 1967 (ITA)
which took impact on January 1, 1968. The Malaysian taxation framework is extensively
portion into two: direct and indirect taxes.
Inland Revenue Board of Malaysia (IRBM) is responsible for direct taxes, for
example, individual and business income tax, real property gains tax, petroleum pay
assessment and stamp duty. Royal Malaysian Custom Department (RMCD) organised the
indirect taxes which includes of excise duty, custom duties, service tax and sales tax. From
the government view, tariff is a fundamental financial instrument in light of the fact that it
will be used to manage the economy, to restore monetary development through the giving of
monetary motivations as a significant objective of executing assessment strategies and to
provide funds to development tasks.

How Sales and Services Tax (SST) brings social and economic impact compared to Goods
and Services Tax (GST) in Malaysia?
2
CHAPTER – 2
LITERATURE REVIEW
2.0 INTRODUCTION
This chapter includes the study of the various literature related to the tax structure in
general and SST in particular and critically understands the same with the object whether
there has been any similar study in the past. Research will be made in the past identifies
various gaps in studies.
Literature was reviewed constantly throughout the research, starting with defining the
scope of the project, exploring the deficiency of the literatures, analysis of the findings of the
survey and ended with validating the conclusions. This research investigates the views of
accountants and tax payers towards the SST. That is another means to investigate whether
Malaysia needs a SST in the perspective of accountants and tax payers.
Literature was reviewed to analyse the overall economy and financial policy with an
aim to provide a foundation to analyse the need of a SST. In order to narrow down the scope
from analysing all economic aspects, the tax bases were focused on. After all these
backgrounds and fundamental studies had been analysed, the research turned to the studies of
the effect of SST on the economy. Lastly, we examine the attitude of businessmen and tax
payers after the implementation of SST. To address these objectives, both primary and
secondary sources in documentary evidence were evaluated and analysed.

How Sales and Services Tax (SST) brings social and economic impact compared to Goods
and Services Tax (GST) in Malaysia?
3
2.1 LITERATURE REVIEW ON SALES AND SERVICES TAX (SST) 2.0
(REINTRODUCTION)
2.1.1 Concept and Meaning Of Sales And Services Tax
Sales and Services Tax (SST) was reintroduced back in Malaysia in September 2018
after the election GE-18 (Financial literacy for youth: Malaysia, 2019). SST is a single stage
consumption tax on goods and services which will replace the current multi-stage
consumption tax on goods and services. The difference between GST and SST is in terms of
its scope of charge. In GST, there are a wider range of goods and services were be taxed,
while SST allows more items to be tax-free (PAGERO, 2018).
Sales Tax
Sales Tax (part of the SST) is single-stage tax which is imposed only at the
manufacturing stage and when specific services are provided to the consumer but GST is
levied on the consumption of goods and services at every stage of the supply chain. In other
words, SST is paid directly from manufacturer to the government and no taxes will be
collected from retailer and distributor while GST is paid by each intermediary level to
government. Furthermore, in the terms of tax rate, the sales tax is at a rate of 5% , 10% and at
a specific rate and service tax is at a rate of 6% (The Straits Time, 2018).
Manufacturers of taxable goods with annual turnover exceeding RM500,000 are
defined as taxable persons. However, there are certain manufacturing activities that are
exempted from the sales tax, such as tailoring, jewellery operations, installing goods into the
building (lighting, wiring and etc.) and etc (Financial literacy for youth: Malaysia, 2019).
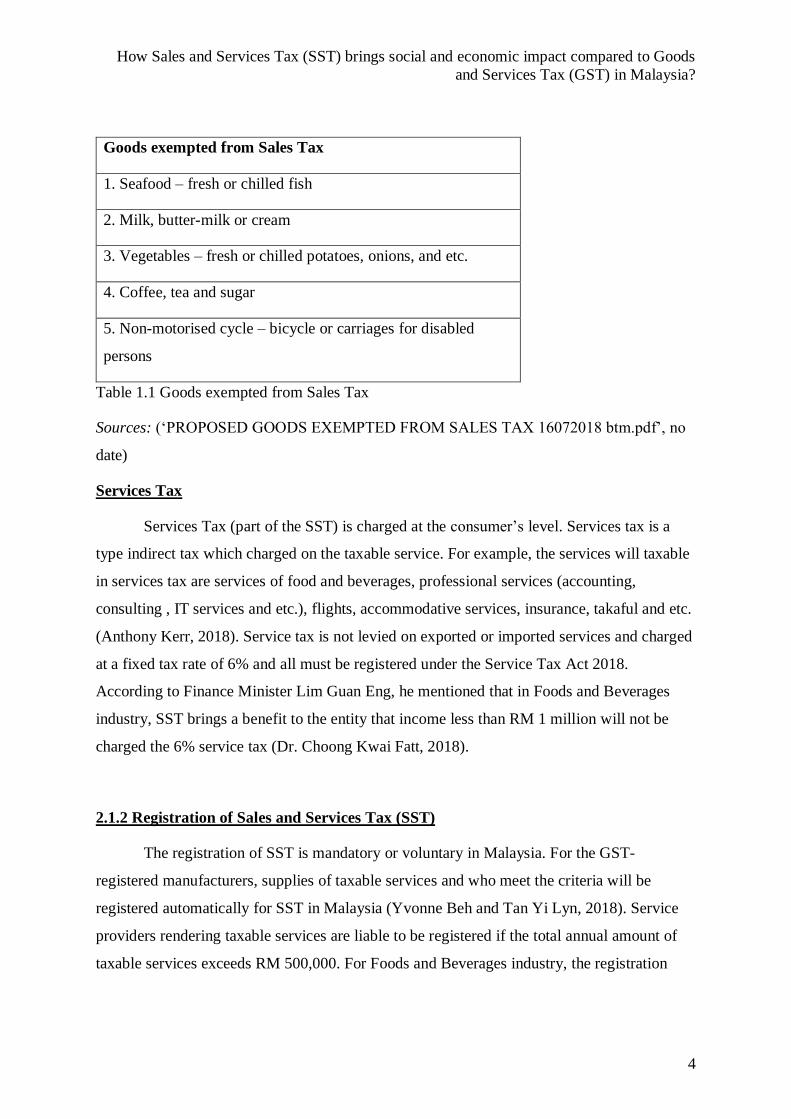
Most of the products will be taxable except for goods listed under Proposed Sales Tax
(Goods Exempted from Sales Tax) Order 2018. For example, live poultry, live fish, milk,
eggs and vegetables are exempted from sales tax (‘PROPOSED GOODS EXEMPTED
FROM SALES TAX 16072018 btm.pdf’, no date). Furthermore, there are a list of goods
exempted from sales tax, which presented in Table 1.1.
How Sales and Services Tax (SST) brings social and economic impact compared to Goods
and Services Tax (GST) in Malaysia?
4
Goods exempted from Sales Tax
1. Seafood – fresh or chilled fish
2. Milk, butter-milk or cream
3. Vegetables – fresh or chilled potatoes, onions, and etc.
4. Coffee, tea and sugar
5. Non-motorised cycle – bicycle or carriages for disabled
persons
Table 1.1 Goods exempted from Sales Tax
Sources: (‘PROPOSED GOODS EXEMPTED FROM SALES TAX 16072018 btm.pdf’, no
date)
Services Tax
Services Tax (part of the SST) is charged at the consumer’s level. Services tax is a
type indirect tax which charged on the taxable service. For example, the services will taxable
in services tax are services of food and beverages, professional services (accounting,
consulting , IT services and etc.), flights, accommodative services, insurance, takaful and etc.
(Anthony Kerr, 2018). Service tax is not levied on exported or imported services and charged
at a fixed tax rate of 6% and all must be registered under the Service Tax Act 2018.
According to Finance Minister Lim Guan Eng, he mentioned that in Foods and Beverages
industry, SST brings a benefit to the entity that income less than RM 1 million will not be
charged the 6% service tax (Dr. Choong Kwai Fatt, 2018).
2.1.2 Registration of Sales and Services Tax (SST)
The registration of SST is mandatory or voluntary in Malaysia. For the GST-
registered manufacturers, supplies of taxable services and who meet the criteria will be
registered automatically for SST in Malaysia (Yvonne Beh and Tan Yi Lyn, 2018). Service
providers rendering taxable services are liable to be registered if the total annual amount of
taxable services exceeds RM 500,000. For Foods and Beverages industry, the registration

How Sales and Services Tax (SST) brings social and economic impact compared to Goods
and Services Tax (GST) in Malaysia?
5
threshold is RM 1 million and no registration threshold is imposed for credit card and charge
card service providers.
Regarding to the return submission and payment, it will be bi-monthly basis
electronically or by post to SST Processing Centre. SST returns has to be submitted
regardless of whether there is any tax to be paid or not. According to the taxable period,
registered taxable persons must declare SST return (SST-01) every two months. Taxable
persons may apply to the Director General for a specific taxable period, in line with the
financial year end. In order to avoid the penalty, SST return need to be submitted no later
than the last day of the following months after the taxable period has ended.
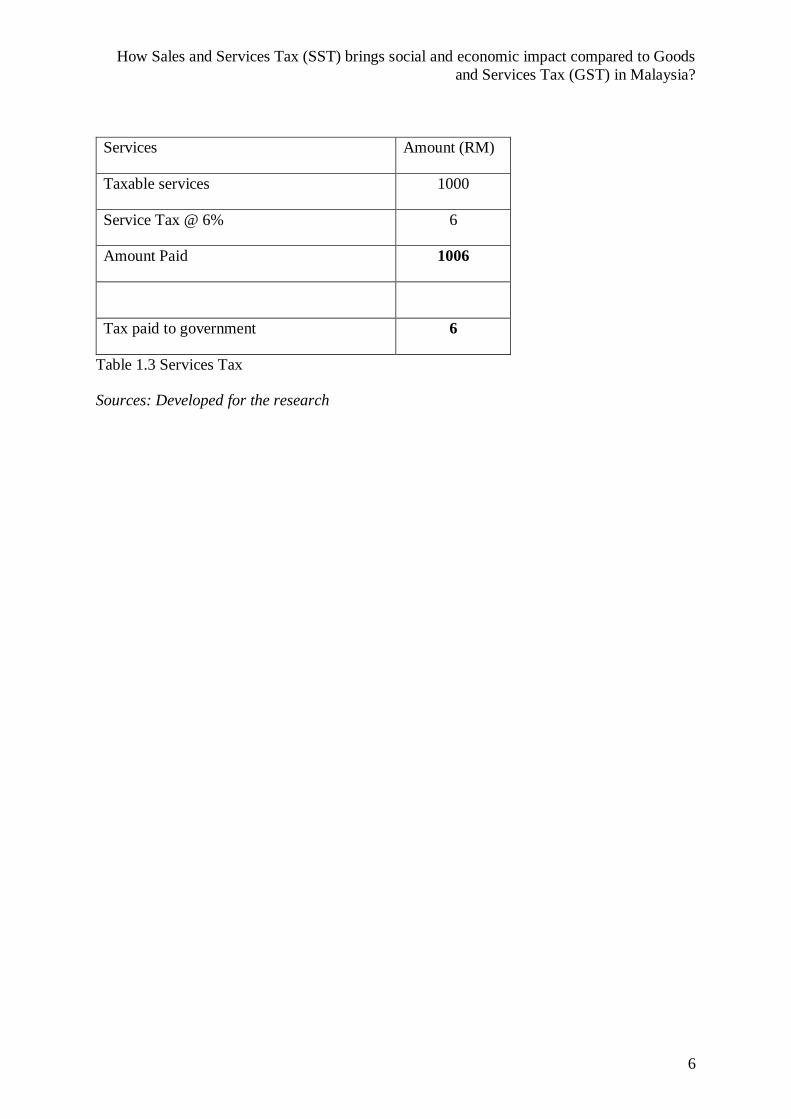
2.1.3 Computation of Sales And Services Tax (SST)
The rate of tax in sales tax are 5%, 10% or a specific rate while rate of tax in services
are 6% and a specific rate for credit cards, which is RM25 (EY, 2018). Computations of sales
and services tax are showed in Table 1.2 and 1.3. Table 1.2 and 1.3 showed the computation
of sales and services tax when the services, products or goods at the price of RM1000.
Item Amount (RM)
Products/ Goods 1000
Sales Tax @ 5% 5
Amount Paid 1005
Tax paid to government 5
Table 1.2 Sales Tax
Sources: Developed for the research
How Sales and Services Tax (SST) brings social and economic impact compared to Goods
and Services Tax (GST) in Malaysia?
6
Services Amount (RM)
Taxable services 1000
Service Tax @ 6% 6
Amount Paid 1006
Tax paid to government 6
Table 1.3 Services Tax
Sources: Developed for the research

How Sales and Services Tax (SST) brings social and economic impact compared to Goods
and Services Tax (GST) in Malaysia?
7
2.2 LITERATURE REVIEW ON DISTINCTION BETWEEN GOODS AND
SERVICES TAX (GST) AND SALES AND SERVICES TAX (SST)
2.2.1 Basic Understanding
Every country will have election for the Prime Minister and after the 2018 Malaysia
election, Malaysian government announced that Sales and Services Tax (SST) will be
officially implemented to replace the Goods and Services Tax (GST) in September 2018
(Soong, 2018). After the election and before September, GST had decreased from 6% to 0%.
In general, they both are taxes, but what is the differences between SST and GST to the
consumers, entrepreneurs and country? Table 1.4 shows the basic understanding of SST and
GST.
Sales and Services Tax (SST)
Goods and Services Tax
(GST)
Background SST started the implementation
in the 1970s and has gone
through some improvements
and makes it better.
In 2014, national budget
firstly mentioned GST and
officially implemented on 1st
of April 2015 after election.
Tax system Sales tax will be levied in
consumer or manufacturer.
Service tax levied on consumer
who use the taxed services.
From the producers to the
consumers, taxes are involved
at every stage.
Scope of tax Taxable goods and services.
(Exemptions are specified)
All goods and services are
taxable. (Exemptions are
specified or not taxable)

How Sales and Services Tax (SST) brings social and economic impact compared to Goods
and Services Tax (GST) in Malaysia?
8
Registration Sales Tax: RM 500,000 within
a 12-month period.
Services Tax: RM 1.5 million
for food and beverages entities.
Compulsory based: Customs
agents and credit card
providers.
Goods and Services Tax:
RM500,000 within a 12-
month period.
Tax rate SST rate will be between 5%
and 10%.
A fixed tax rate of 6%.
Taxable period 2 months Monthly or quarterly
(optional)
Tax credit In supply chain, there is no tax
credit claim.
Input tax credit claimable.
Table 1.4 Difference between SST and GST
Sources: Developed for the research
From Table 1.4, we can see that SST had passed through over 40 years with
improvement and GST had a 4 years history in Malaysia. In different stages, people have to
pay for the taxes. SST had separated the sales tax and services tax while GST taxed on every
stage. GST charged a fixed tax rate of 6% but SST had a range between 5% to 10%.
However, it sounds that a fixed rate will be less expensive compared to different rate, but the
stages charged also difference. It always an argue as sales tax will be applied at the
manufacturing while service tax apply at service providers, and is it would be wrong to
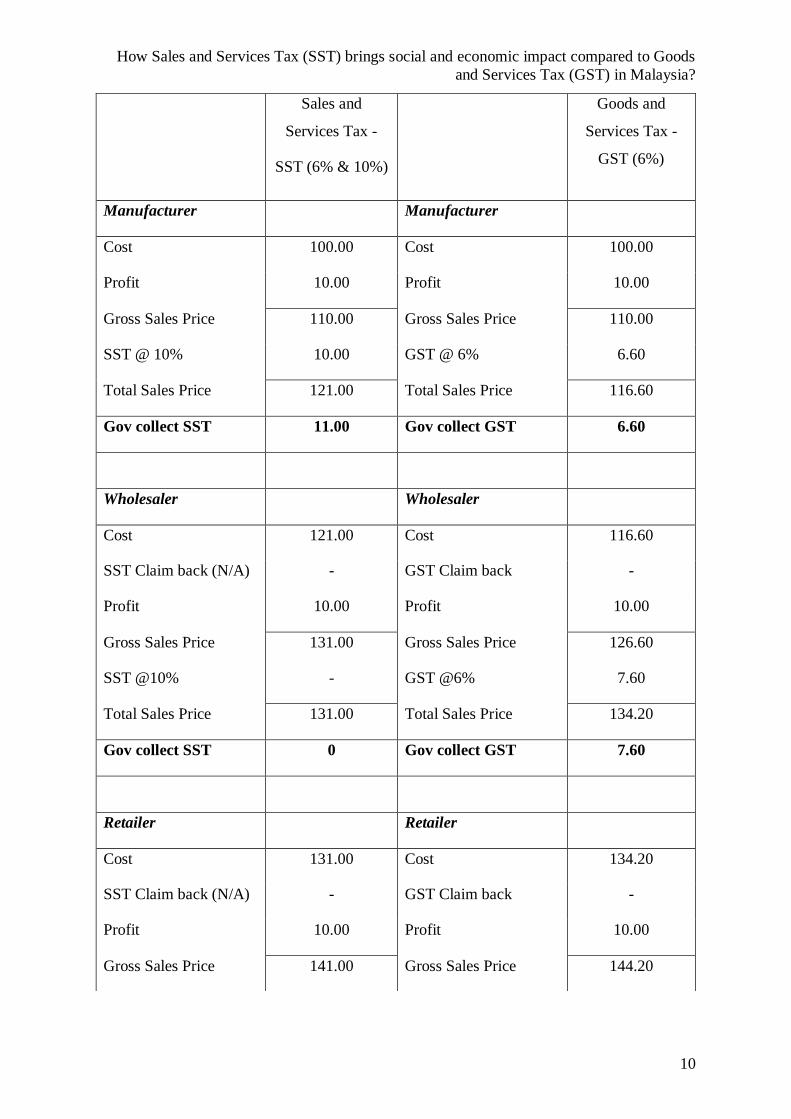
combine and assume it would e 16% of tax rate to be paid (Nisya Aziz, 2019). Figure 1.1
showed the basic picture of how SST and GST involved in business.

How Sales and Services Tax (SST) brings social and economic impact compared to Goods
and Services Tax (GST) in Malaysia?
9
GST 6% 6% 6%
Manufacturer Wholesales Retailers/ Service Consumer
SST 10% Sales Tax 6% Service Tax
Figure 1.1 Comparison SST and GST
Sources: Developed for the research
How Sales and Services Tax (SST) brings social and economic impact compared to Goods
and Services Tax (GST) in Malaysia?
10
Sales and
Services Tax -
SST (6% & 10%)
Goods and
Services Tax -
GST (6%)
Manufacturer Manufacturer
Cost 100.00 Cost 100.00
Profit 10.00 Profit 10.00
Gross Sales Price 110.00 Gross Sales Price 110.00
SST @ 10% 10.00 GST @ 6% 6.60
Total Sales Price 121.00 Total Sales Price 116.60
Gov collect SST 11.00 Gov collect GST 6.60
Wholesaler Wholesaler
Cost 121.00 Cost 116.60
SST Claim back (N/A) - GST Claim back -
Profit 10.00 Profit 10.00
Gross Sales Price 131.00 Gross Sales Price 126.60
SST @10% - GST @6% 7.60
Total Sales Price 131.00 Total Sales Price 134.20
Gov collect SST 0 Gov collect GST 7.60
Retailer Retailer
Cost 131.00 Cost 134.20
SST Claim back (N/A) - GST Claim back -
Profit 10.00 Profit 10.00
Gross Sales Price 141.00 Gross Sales Price 144.20

How Sales and Services Tax (SST) brings social and economic impact compared to Goods
and Services Tax (GST) in Malaysia?
11
Table 1.5 Comparison GST and SST
Sources: Developed for the research
Table 1.5 makes certain assumptions for simplification purposes, just to show the
differences between SST and GST. Both SST and GST had a start at RM100 at cost from
manufacturer, and after the same profit earned, we have the gross sales price of RM110. Due
to the different tax rate applied, the taxes collected will be different. We can see that at start,
government collected more from SST compare to GST. However, when reach wholesaler,
there is no chargers in SST. The total sales prices become different after the taxes, and we
can see that the sales prices in SST will slightly lower than GST. The last stage, both retailers
taxed 6% to the consumer, and slightly get the same prices. By adding up the total taxes
collected and consumer total paid, consumer pay lesser in SST. So depending on the SST
coverage, consumers could be paying the same or slightly lesser for certain items compared
to GST. Overall, the tax burden will be reduced and that is the overall increase in the annual
income after tax for every consumer. Depending on the types of goods and services that will
be subject to the SST, the price impact will vary by income groups. This become one of the
reason why we want to do research on this topic.
SST @6% 8.46 GST @6% 8.65
Total Sales Price 149.46 Total Sales Price 152.85
Gov collect SST 8.46 Gov collect GST 8.65
Consumer Total Paid 149.46 Consumer Total Paid 152.85
Total Tax collected 19.46 Total Tax collected 22.85

How Sales and Services Tax (SST) brings social and economic impact compared to Goods
and Services Tax (GST) in Malaysia?
12
2.2.2 Tax system
Sales and Services Tax (SST) and Goods and Services Tax (GST) had different tax
system.
Sales and Services Tax (SST)
Sales and Services Tax (SST) is a single tax system. Manufacturers in the sales
industry and only service industry need to pay SST when they sell the products or services to
consumer (Soong, 2018). In simple, it means that SST has only one phrase to pay the tax
compared to every stage in the GST system. In SST, peoples do not need to pay taxes when
they purchase or selling any property but GST is needed. For the average people, purchasing
a property is hard enough, but it will become more harder to buy a house if 6% excise tax
need to be paid. In addition, there is more goods to be exempted, which means most of the
daily supplies do not involves SST.
Goods and Services Tax (GST)
Goods and Services Tax (GST) is a multi-level tax system. It covers at all the stages
in the business and industry which involves manufacturers, retailers, wholesalers and
consumers. GST covers a wide range from the start at manufacturers selling the products to
the end of reselling consumers at every stage (Nathan, 2018). GST covers a wide range of
taxes in different level of products, which means most of the things will be levied on GST
unless the items are exempted, such as public transport and healthcare services. From a
business point of view, GST had a proportion of an adverse on them as companies needed to
achieve RM 500,000 per annum in sales in order to claim back the tax. We believe that this
will affect the cost of company and makes the profit lower. However, GST become an
income device for the government as government received higher tax revenue compared to
the old tax system, the SST. A higher tax revenue helps to improve country development and
develop the Malaysian economy because of having additional funds.
How Sales and Services Tax (SST) brings social and economic impact compared to Goods
and Services Tax (GST) in Malaysia?
13
2.2.3 Taxable goods and services
Under the sales tax, all goods are subject to tax except for those goods are specifically
exempted. Under the service tax, the taxable services are those services which are specifically
prescribed. In GST, all goods and services will be taxed. Therefore, this is why it is known as
a broad-based tax.
2.2.4 Payment of tax and periods of accounting
Sales and Services Tax (SST)
Under SST structure, sales tax has to be paid when there is a sale. Service tax become
due only when payment is received. When the payment is not received, businesses are only
required to pay tax at the end of the 12-month period from the date of invoice issued.
Goods and Services Tax (GST)
Under GST structure, one crucial characteristic is ‘time of supply’. It is deciding
when s GST incurred and have to be paid up. When an invoice is issued, any payment is
given to the supplier, a supply which is subject to tax takes place, then a supply is regarded to
have been made.
2.2.5 Advantages
Both SST and GST will bring benefits to consumers or business.
Sales and Services Tax (SST)
1. Simple and straight forward.
SST 2.0 is more simple and straightforward tax structure. SST comprises two legislations,
which are Sales Tax Act 2018 and Service Tax Act 2018. Sales tax imposed on
manufacturing sector while service tax imposed on selected service sectors governed by the
legislations.

How Sales and Services Tax (SST) brings social and economic impact compared to Goods
and Services Tax (GST) in Malaysia?
14
2. People friendly
As SST is a single tax, so the living cost will be lower compared to GST. The daily
consumption of food and beverages would be lower in price and many of the products are
exempted.
Goods and Services Tax (GST)
1. Business friendly
GST charged a 6% services tax to the consumer and makes the company makes more profit.
It never become a business cost to the business as input tax only available upon tax invoice
received.
2.2.6 Disadvantages
Sales and Services Tax (SST)
1. Business cost
SST become a business cost and deduction is only available when there is a sale. To explain
in simple, no sales, no deductions. Sales tax is part of inventory cost and to be deducted as
cost of sales when products are sold, this would also mean that the business cost would be
higher.
Goods and Services Tax (GST)
1. Refund and registration
In GST registration, refund is an issue of the consideration. GST is imposed on the price sold
to customer despite having input tax credit, and it resulted in cascading prices. Claims for the
input tax refunds processed with 14 days in the case of electronically submitted returns.

How Sales and Services Tax (SST) brings social and economic impact compared to Goods
and Services Tax (GST) in Malaysia?
15
2.3 LITERATURE REVIEW APPLICATION OF GST GOVERNANCE IN THE
WORLD
2.3.1 Introduction
A history to be mentioned that Goods and Services Tax (GST) or some countries
called it as Value Added Tax (VAT) had began in France in the 1950s (Modh Salleh, Ainon
Yussof and Irwani Abdulla, 2018). There are a total of 160 countries in the world have
implemented GST as part of their indirect tax collection. To put that into perspective, the
number of countries in the world approximates 200. However, it is difficult to determine how
many countries there are in the world, due not only to the ever-shifting political landscape,
but also the term ‘country’ is somewhat fluid and open to interpretation). It is worth nothing
that the figure will only go get higher, as a number of countries are presently working
towards implementing GST as well.
2.3.2 Countries adopted GST
As discussed earlier that there are total of 160 of countries in the world have
implemented GST. In Table 1.6, it showed the number of countries based on regions that
have adopted GST.
No. Region No. of Country
1 ASEAN 7
2 Asia 19
3 Europe 53
4 Oceania 7
5 Africa 44
6 South America 11
7 Caribbean, Central & North America 19
Table 1.6 Number of countries based on regions adopted GST.
Sources: treasury.gov.my (treasury.gov.my, no date)

How Sales and Services Tax (SST) brings social and economic impact compared to Goods
and Services Tax (GST) in Malaysia?
16
Besides that, we look at some of the countries and the GST tax rate. As we know,
public and policymakers are more concerned about whether the tax rate is lower or higher
with the income level. In order to have better understanding, a table arranged to determine if
there any relationship between the GST rate and the income level of the countries.
Country Current GST rate
(%)
Year of implementation GDP per Capita
(USD) (Statistics
Times, 2019)
Singapore 7.0 1993 62,984
Australia 10.0 2000 57,204
United Kingdom 20.0 1973 42,036
Japan 5.0 1989 41,418
China 17.0 1994 10,099
Thailand 7.0 1992 7,570
Indonesia 10.0 1974 3,971
Philippines 12.0 1998 3,246
Vietnam 10.0 1999 2,788
India 12.5 2005 2,188
Bangladesh 15.0 1991 1,882
Pakistan 16.0 1990 1,456
Cambodia 10.0 1999 1,205
Table 1.7 Selected countries and current rate of GST
Sources: Statistics Times (Statistics Times, 2019)
Table 1.7 showed the income level, the GDP per capita of the countries in descending
order. From the table, we can believe that GST rate in the country is not affected by the
income level. For example, in the Asian country, Singapore and Thailand got the same GST
rate, but Singapore GDP per capita is almost 9 times compared to Thailand. To further
accentuate this point, we compare Singapore with Bangladesh. We can see the huge

How Sales and Services Tax (SST) brings social and economic impact compared to Goods
and Services Tax (GST) in Malaysia?
17
differences in GDP per capital between the two countries, but Bangladesh still have a
relatively high tax rate compared to Singapore.
United Kingdom
In United Kingdom, they are implemented Value Added Tax (VAT). VAT handled by
the Her Majesty Royal Custom (HRMC) and they are required to change for a better process
due to competitiveness in the world market. They have to be concerned with the overseas
traders and foreign direct investment (FDI) if they want to compete with other country. This
will make them able to survive in the competitive world. UK had shifted from existing
indirect tax system to GST on the year 1973 because of the promotion of harmonization. It is
almost similar to our country, Malaysia, which GST might be one of the solutions to promote
harmonization since all its regional partner other than Brunei have already established GST in
their own countries.
Australia
For Australia, they have more complex system than other countries like Singapore
and New Zealand. Australia having a higher marginal tax rate is required to support their
government programs (Bobek, Roberts and Sweeney, 2007). Thus, tax governance shall be
effective and efficient to manage all related process with regards to VAT. It was introduced
in Australia on 1st of July 2000 with the aim to promote economical collection, economics of
growth and efficiency. They wanted to shift from heavy reliance on direct tax to indirect tax.
Singapore
In 1st of April 1994, Singapore introduced GST with the same purpose to shift tax
burden from direct tax to indirect tax. Their rate is currently at 7%. Strong economic
condition with large budgetary surplus helps Singapore to establish a modern and efficient
tax system in the country. Singapore can be a good role model to other countries wishing to
reform their tax system.

How Sales and Services Tax (SST) brings social and economic impact compared to Goods
and Services Tax (GST) in Malaysia?
18
2.3.3 Conclusion
In other developing countries, tax collection might be low because they have an
alternative collection from other sources of finance or due to societies have chosen to limit
the action by their government. It is also shaped by other conditions such as natural disaster
or long-term violent conflicts inside the country. Societies with low level of governance are
particularly hard to believe in terms of their transparency and capable decision making.
According to World Governance Indicators (WGI), the use to determine whether the public
policy and democratic political being are implemented effectively, a few countries such as
Singapore is considered as democratic countries but low on voice and accountability scores.
Lastly, if the tax revenue spends fairly for the sake of society, the confidence level of the
taxpayer will increase and the compliance level will get higher. Therefore, transparency
within the government bodies is very important to build up confidence among the public ad
tax payers.

How Sales and Services Tax (SST) brings social and economic impact compared to Goods
and Services Tax (GST) in Malaysia?
19
2.4 LITERATURE REVIEW ON CONSEQUENCES OF GOODS AND SERVICES
TAX
2.4.1 Nature of Goods and Services Tax
GST was implemented in Malaysia for 3 years before the change to SST. GST can
call as a broad-based tax. As such, it is also typically regarded as a regressive tax. Before
that, we have to know what regressive really means? To explain that in the simple way, a
regressive tax exposes a greater burden on poor people in that it takes a greater percentage
from low-income individuals than the relatively rich one. In regular, the regressive nature of
broad-tax is a matter of grave concern to the policymaker in the country. However, GST has
been introduced in total of 160 countries in the world (treasury.gov.my, no date). Between
these countries, we believe that not all of them are experienced the regressive nature of GST.
For example, some of the Asean countries in the world like Vietnam and Pakistan had faced
progressive GST, as they adopted the zero rating of basic essentials as well as exemptions.
2.4.2 Inflation
As mentioned earlier that GST might become one of the thought of policymakers,
another issue that plagued the thoughts is GST would bring inflation. There can be a lot of
different and important debates over this issue. Furthermore, (Syed A. Basher, 2008) had
discussed that the introduction and implementation of GST would not necessarily brings an
impact to the country economy and result in inflation. He also explained that inflation is
defined as an increasing in average prices of the products over time and does not refer to a
once-and-for-all rising in price (Syed A. Basher, 2008). However, according to
(Mukhopadhyay, 2005), he mentioned that GST can never lead to a sustained increase in the
rate of change in price level by GST itself. From here, we can see that both researchers think
that GST itself cannot brings so much of impacts to a country. However, (Viren and
Kilponen, 2008) discovered that more than one half of the tax increase (GST in this case)
shifts to consumer prices. Before that, we shall look at the implementation of GST/VAT and
the relationship with changes in the inflation rates between the year before and after
implementation.

How Sales and Services Tax (SST) brings social and economic impact compared to Goods
and Services Tax (GST) in Malaysia?
20
Country Year of implementation and inflation rate
(%)
Current
tax rate
(%)
Difference
Before At After Current Before
and After
After and
Current
Australia 1999 2000 2001 2019 10.0 +4.4 -3.4
0.3 2.6 4.7 1.3
Bangladesh 1990 1991 1992 2019 15.0 -3.3 +2.5
6.3 6.6 3.0 5.5
Cambodia 1998 1999 2000 2019 10.0 -13.2 +5.2
10.0 2.0 -3.2 2.0
China 1993 1994 1995 2019 17.0 -3.4 -8.8
14.9 19.7 11.5 2.7
India 2004 2005 2006 2019 12.5 +0.7 -3.2
5.7 4.2 6.4 3.2
Indonesia 1973 1974 1975 2019 10.0 -23.6 -7.9
34.8 46.5 11.2 3.3
Japan 1988 1989 1990 2019 5.0 +2.0 -1.6
0.3 2.2 2.3 0.7
Pakistan 1989 1990 1991 2019 16.0 +1.4 -1.1
8.6 -2.9 10.0 8.9
Philippines 1997 1998 1999 2019 12.0 +0.4 -3.9
6.2 22.4 6.6 2.7
Singapore 1992 1993 1994 2019 7.0 +2.7 -2.8
1.0 3.4 3.7 0.9
Thailand 1991 1992 1993 2019 7.0 -2.4 -2.4

How Sales and Services Tax (SST) brings social and economic impact compared to Goods
and Services Tax (GST) in Malaysia?
21
5.7 4.5 3.3 0.9
United
Kingdom
1972 1973 1974 2019 20.0 +7.0 -13.1
8.0 7.3 15.0 1.9
Vietnam 1998 1999 2000 2019 10.0 +2.8 -9.5
8.8 5.7 11.6 2.1
Malaysia 2014 2015 2016 2019 6.0 -1.0 -1.9
3.1 2.1 2.1 0.2
Table 1.8 Current GST rate and inflation rate in each country
Sources: Trading Economics and Organisation for Economic Co-operation and Development
(Trading Economics, 2019a), (OECD, 2019)
In Table 1.8, we included the year before and after the implementation of GST as well
as the inflation rates in the respective countries we selected. Next, in order to determine the
changes in inflation rate in these countries, we calculate the differences between the year
before and after implementation and between the current year and after implementation GST.
These computation let us understand whether the implementation got improvement in
inflation, ie a positive or negative figure. To compare the positive and negative, we plotted 2
graphs.
Figure 1.2 Changes in inflation rate between year before and after the implementation of GST
-30.0
-25.0
-20.0
-15.0
-10.0
-5.0
0.0
5.0
10.0
Changes in inflation rate between year before and after the implementation of GST

How Sales and Services Tax (SST) brings social and economic impact compared to Goods
and Services Tax (GST) in Malaysia?
22
Source: Developed for the research
Figure 1.2 plotted the changes in inflation rate between year before and after the
implementation of GST. From Figure 1, it appears that there is no significant pattern. There
are 8 countries i.e. Philippines, India, Pakistan, Japan, Vietnam, Singapore, Australia and
United Kingdom experienced positive change in inflation rate, whereas 6 countries i.e.
Indonesia, Cambodia, China, Bangladesh, Thailand and Malaysia experienced the negative
change in the inflation rate between the year before and after implementation.
Figure 1.3 Changes in inflation rate between current and year after the implementation of
GST
Source: Developed for the research
Figure 1.3 plotted the changes in inflation rate between current and year after the
implementation of GST. From the Figure 1.3, we can see that except for Bangladesh and
Cambodia experienced the positive changes, the rest of the countries had experienced the
negative changes.
-15.0
-10.0
-5.0
0.0
5.0
10.0
Changes in inflation rate between current and year after the implementation of GST

How Sales and Services Tax (SST) brings social and economic impact compared to Goods
and Services Tax (GST) in Malaysia?
23
2.4.3 Tax Group
Next, we categorized the 13 countries (excluding Malaysia) into 3 groups, which are:
1. Low tax group,
2. Medium tax group and
3. High tax group.
First, we must obtain the average tax rate of the 13 countries, which is 11.65%. In order to
get the lower tax group, we then computed the rate difference between average tax rate and
standard deviation, which is 11.65% - 4.19% = 7.46%. All countries that fall under the rage
of 0% to 7.46% will be categorized in the low tax group. For the high tax group, we add the
average tax rate and standard deviation together, which is 11.65% + 4.19+ = 15.84%.
Countries which have a tax rate more than 15.84% will be fall in the group of high tax group.
Lastly, the countries in between the rage of 7.46% and 15.84% will be classified as medium
tax group. Table 1.9 constructed to categorized the three different tax groups and find out
whether there is any pattern between the tax groups and inflation rate. After that, by created
Table 1.10, we can find out that whether low tax group will have a lower inflation, high tax
rate will have high inflation, or there is no pattern on it.
Table 1.9 Different Tax groups and Tax rate
Low Tax group
0% - 7.64%
Medium Tax group
7.64% - 15.84%
High Tax group
15.84% and above
Japan – 5%
Singapore – 7%
Thailand – 7%
Australia – 10%
Cambodia – 10%
Indonesia – 10%
Vietnam – 10%
Philippines – 12%
India – 12.5%
Bangladesh – 15%
Pakistan – 16%
China – 17%
United Kingdom – 20%

How Sales and Services Tax (SST) brings social and economic impact compared to Goods
and Services Tax (GST) in Malaysia?
24
Sources: Developed from research
Look at Table 1.10, Japan, Singapore and Thailand fall under the low tax group.
Whereas Pakistan, China and United Kingdom fall under high tax group and the remaining
countries classified as medium tax group.
Tax Groups Average current inflation rate (%) Average tax rate (%)
Low tax group 0.83 6.33
Medium tax group 2.87 11.36
High tax group 4.50 17.67
Table 1.10 Tax groups and their average inflation rate and tax rate
Sources: Developed from research
From Table 1.10, we can see that the lower tax rate will have lower inflation rate
whereas higher tax rate will get the higher inflation rate. However, this is analysed by using
the historical data, additional and updates can produce a more accurate data.
From the literature review, we can see that Malaysia falls under the low tax group
with 6% GST. To ask back the same question, does that mean that Malaysia will have a low
inflation rate? Figure 1.3 already help to answer the question, which is yes.
2.4.4 Economic of Malaysia
According to the World Bank statistic, the annual Gross Domestic Product (GDP)
growth of Malaysia in year 2018 and year 2018 is only 5.9% and 4.7%. From the graph, we
can see that GDP growth stay almost constant until year 2021 (The World Bank, 2019). If the
growth percentage continue increasing, it is possible for Malaysia to achieve develop country
status due to not meet the objective. On 1st April 2015, Malaysia implemented GST. It was
introduced to strengthen Malaysia revenue in order to meet the vision 2020 objective to be
high income country. After the implementation of GST, the GDP growth was increased and
reach the peak of 5.9%, but it decreased again. New introduced SST, also called SST 2.0 is a
better and much more perfect alternative way to boost Malaysia economic growth (Jamie
Chee, 2018).

How Sales and Services Tax (SST) brings social and economic impact compared to Goods
and Services Tax (GST) in Malaysia?
25
Figure 1.4 Figure 1.5
Figure 1.4: Annual GDP Growth for Malaysia in year 2017
Figure 1.5: Annual GDP Growth for Malaysia in year 2018
Source: The World Bank Statistic
However, according to Vijay Velkar, a well-designed GST can boost GDP growth by
at least 2% (Vijay Velkar, 2010). If Malaysia SST 2.0 successfully meet the standard, it
surely can help to improve Malaysia economic and able to exceeding 7% of GDP growth
annually. In the other hand, the implementation seems not achieving a good result and it need
to do in proper way to avoid any mistake during the implementation.
2.4.5 Conclusion
From the data and research, the opponents of GST in Malaysia often based their
claims on 2 points, as following:
1. GST will cause the inflation (Economic)
2. GST will have impact on income distribution (Social)
So, we are interested in this 2 points. Thus, this serves as our motivation of our research, we
want to know whether Malaysia will have any economic impact after the changes to
implement SST.

How Sales and Services Tax (SST) brings social and economic impact compared to Goods
and Services Tax (GST) in Malaysia?
26
2.5 LITERATURE REVIEW THEORETICAL FRAMEWORK
2.5.1 Conceptual Framework
The purpose this research is to study the relationship between tax payers, accountants,
tax consultants and businessman’s behavior and SST compliance. In order to have better
understanding to the behavior, a theoretical framework adopted by (Ajzen, 1991) will be
used, which is the theory of planned behavior. This study will consider on the relationship
between dependent variable on tax. payer’s behavioral intention, which including the
businessman on SST compliance. For the independent variables, we categorized to three-
category such as attitude, subjective norms and perceived behavioral control according to
TPB theory and tax structure and opportunity to avoid under expended financial self-interest
model. The theoretical framework adapted from TPB and financial self- interest expended
model will be shown in Figure 1.6.
Figure 1.6 Theoretical framework
Sources: Developed for the research
Attitude
Subjective Norms
Perceived behavioural
control
Tax payer’s behavioral
Intention
Tax Structure
Level of knowledge
Demographic Factors

How Sales and Services Tax (SST) brings social and economic impact compared to Goods
and Services Tax (GST) in Malaysia?
27
2.5.2 Theory of Planned Behavior
This research will be adopting and adapting the psychological economic that has been
developing by Martin Fishbein and Ajzen (Ajzen, 1991). Theory of planned behavior is
basically an extended theory of reasoned action from Ajzen. Most studies that have been
done previously in relations with society’s behavior or attitude towards compliance and non
compliance of taxation used this psychological economic theory.
The theory of planned behavior (TPB) was developed by Ajzen in 1980. It is a theory
which expand from theory reasoned action (TRA). Figure 1.7 showed the theory of reasoned
action, which is the consideration of the behavior control.
Figure 1.7 Theory of Reasoned Action (TRA)
Source: (Ajzen, 1991)
This TPB theory suggest a model which can measure how human actions are guided.
The main focus of this theory is intention. TPB is an extended theory of reasoned action by
the incorporation of an additional construct, namely and perceived behavioral control.
According to (Ajzen, 1991), TPB models where the behaviour is depending on
behavioral intention and behavioral intention in turn depending on three factors, which are:
1. Attitude toward the behavior (AB);
2. Subjective norms (SN); and
3. Perceived behavioral control (PBC).
Taking into account the writing of the perception of tax payers toward the
implementation of SST, the components are integrated in this research: attitude, subjective
norms and perceived behavioral control. It can see in the figure 1.8.
Attitudes towards
behavior
Subjective norms of
behavior
Behavior Behavior
(Action)

How Sales and Services Tax (SST) brings social and economic impact compared to Goods
and Services Tax (GST) in Malaysia?
28
Figure 1.8 Theory of Planned Behavior
Source: (Ajzen, 1991)
As mentioned earlier, there are three factors existed in directing the behavior
intentions which later on will be the same cause of apparent behavior. Those three factors are
attitude, subjective norms and perceived behavioral control. Behavioural intention refers to
one’s willingness to carry out a particular behavior, and it is proposed to be an antecedent of
a behaviour. The application of this theory of planned behavio
r in the indirect tax such as SST is scarce. Based on the study, they revealed that
attitude, subjective norm and ethics are positively significant towards intention to comply
with the indirect tax. Theory of planned behaviour suggests that a taxpayer is more willing
to pay for the sales and service tax if he or she has a positive attitude towards the
implementation of sales and service tax and comply with other important people’s opinions
on the implementation of SST.
Attitude
Subjective Norms
Perceived Behavioral
Control
Intention Behavior

How Sales and Services Tax (SST) brings social and economic impact compared to Goods
and Services Tax (GST) in Malaysia?
29
Attitudes
Attitude ca be defined as individual’s findings themselves. Attitudes reflect the degree
to which the person has a favorable or unfavourable evaluation or appraisal of the behavior of
interest (Ajzen, 1991). It brings in the consideration of the outcomes or reaction of
performing the behavior. It is how they feel about performing certain behavior, either
positively or negatively. This individual attitude will later develop into their intentions on
performing or not performing certain behavior.
Subjective Norms
The second factor that will contribute to individual’s behavioral intention is subjective
norm. It is a social factor. Subjective norm is the belief about whether the people approve or
disapprove the behavior. In simple, it refers to the social pressure of a person to perform or
not to perform the behavior (Wayne W. LaMorte, 2018). It is also can be view as the social
pressure to the target behavior.
Perceived Behavioral Control
The last factor is perceived behavioral control. Perceived behavioral control varies
across the actions and situations, which means the result may be different in different people
on the situation. This refers to a person’s perception of the ease or difficulty of performing
the behavior of interest, and it is assumed to reflect the past experience (Ajzen, 1991). This
factor is able to lead directly to the individual behavior. It is how much a person has control
over the behavior and how confident a person feels about being able to perform or not
perform the behavior.

How Sales and Services Tax (SST) brings social and economic impact compared to Goods
and Services Tax (GST) in Malaysia?
30
Figure 1.9 Theory of planned behavior
Source : (Wayne W. LaMorte, 2018)
Figure 1.8 and Figure 1.9 displays the relationship between the elements on theory of
planned behavior. For example, in the case of behavior control does not depend on the desire
of the individual, in the other words, if there is any legal sanction, perceived behavior control
can affect the behavior directly (arrow indicated by dashes in Figure 2.6 and 2.7). To
conclude that, TPB reflects the individual’s intentions, together with their perceived control
over behavior, which determine whether or not they will actually engage in the behavior
(Benk, Cakmak and Budak, 2011).
How Sales and Services Tax (SST) brings social and economic impact compared to Goods
and Services Tax (GST) in Malaysia?
31
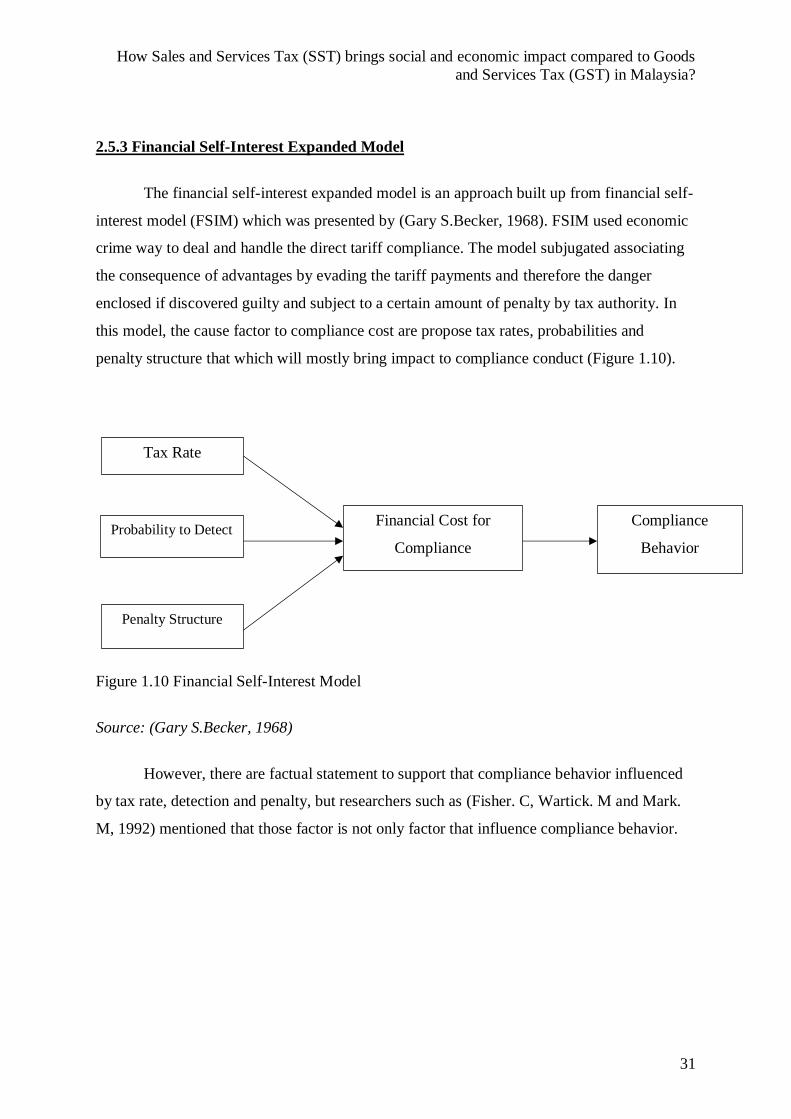
2.5.3 Financial Self-Interest Expanded Model
The financial self-interest expanded model is an approach built up from financial self-
interest model (FSIM) which was presented by (Gary S.Becker, 1968). FSIM used economic
crime way to deal and handle the direct tariff compliance. The model subjugated associating
the consequence of advantages by evading the tariff payments and therefore the danger
enclosed if discovered guilty and subject to a certain amount of penalty by tax authority. In
this model, the cause factor to compliance cost are propose tax rates, probabilities and
penalty structure that which will mostly bring impact to compliance conduct (Figure 1.10).
Figure 1.10 Financial Self-Interest Model
Source: (Gary S.Becker, 1968)
However, there are factual statement to support that compliance behavior influenced
by tax rate, detection and penalty, but researchers such as (Fisher. C, Wartick. M and Mark.
M, 1992) mentioned that those factor is not only factor that influence compliance behavior.
Tax Rate
Probability to Detect
Penalty Structure
Financial Cost for
Compliance
Compliance
Behavior

How Sales and Services Tax (SST) brings social and economic impact compared to Goods
and Services Tax (GST) in Malaysia?
32
Despite the very fact that there are experimental statement to bolster that compliance
behavior influenced by tax rate, detection and penalty, however investigators (Fisher. C,
Wartick. M and Mark. M, 1992) concurred that those component is not just variable that
impact consistence conduct. In this way, financial self-interest model is not portraying the
overall variables that impact obedience conduct. (Jackson. B and Milliron. V, 1986) have
recognized 14 variables that are universally used in compliance behavior study. These
variables are characterized in four groups:
i. Demography
ii. Opportunity to avoid
iii. Attitude and perception
iv. Tax structure
Based on Jackson & Milliron (1986) finding, (Fisher. C, Wartick. M and Mark. M, 1992)
developed financial self-interest expended model, as shown in Figure 1.11.
Figure 1.11 Expanded Model
Source: (Fisher. C, Wartick. M and Mark. M, 1992)
(Fisher. C, Wartick. M and Mark. M, 1992) noticed that there are one indirect group and
three direct group that affect the behavior.
Opportunity to avoid
Attitude and
Perception
Tax Structure
Demographic Compliance
Behavior

How Sales and Services Tax (SST) brings social and economic impact compared to Goods
and Services Tax (GST) in Malaysia?
33
Direct group
1. Opportunity to avoid
This group is most of the researcher investigate the variable of education, income, sources of
income and occupation. It will reflect to compliance conduct and impacts other variables in
the attitude and perception category.
2. Attitude and Perception
Most of the researcher study this variable on the ethics and fair perception in the framework,
which accurately reflect the conduct and behavior of compliance.
3. Tax Structure
This is the variable that researchers examine the complexity of the tax structure, level of
knowledge to tax, tax rate, relationship with the tax authority and penalty structure. It reflects
directly to consistence of behavior and impacts on other variable in attitude and perception
groups.
Indirect group
There is only one component in indirect group, which is the demographic.
Demographic is related to the age and sexual orientation. It is the group which can’t have
direct impact consistence conduct yet it is constantly utilized as a pointer to distinguish other
groups, for example, the opportunity to avoid and attitude and perception.
Despite the fact that, the above models propose combinations of variables that may
influence compliance conduct, however not all has association with sales and service tax
compliance. The accompanying area of this section will discuss about the variables which are
accepted to influence the sales and services tax compliance behavior from Malaysian context.

How Sales and Services Tax (SST) brings social and economic impact compared to Goods
and Services Tax (GST) in Malaysia?
34
2.5.4 Conclusion
Therefore, in this paper, this theory will be adopted and adapted in order for it to
answer the research question and research objectives that have been lined out earlier in this
research. To conclude, this study focuses on the impact of SST towards Malaysia’s economic
and attitudes of tax payers, accountants, tax consultants and businessman towards SST
implementation in Malaysia, i.e. whether he or she would comply with SST when it is
implemented and the willingness and knowledge on SST.
To sum up all the review, theory of planned behavior (TBP) and Financial Self-
interest expanded model are used as the underpinning theories in this study and research. The
conceptual model will be developed in order to understand the tax payer’s perception towards
the re-introduction of SST in Malaysia. This study can concentrate on the attitude, subjective
norm, perceived behavioral control, opportunity to avoid based on the tax knowledge, tax
structure and complexity of the tax system because it contributes to the role in influencing the
human behavior towards implementation of SST. Furthermore, the economic transformation
and GDP in Malaysia will used to analyze the economic after the implementation.

How Sales and Services Tax (SST) brings social and economic impact compared to Goods
and Services Tax (GST) in Malaysia?
35
2.6 LITERATURE REVIEW OF BACKGROUND OF GOODS AND SERVICES TAX
(GST)
2.6.1 Introduction
Taxation is the main source of the revenue for the government. It is a compulsory
charge imposed by the government without any expectation of direct return in benefit.
Therefore, all income of companies and individuals accrued in, derived from or remitted to
Malaysia is liable to tax, which is the Inland Revenue Board of Malaysia. On 1st April 2015,
GST in Malaysia was implemented, which announced by the Prime Minister cum Minister of
Finance during the 2014 Budget Presentation in Parliament. The objectives to introduce GST
is to enhance the revenue collections and GST system used as a mechanism to mitigate
transfer pricing manipulation (Sanusi, Omar and Sanusi, 2015). Both of the objectives are
aiming to reduce the collection leakage happen continuously.
2.6.2 History of GST
GST has been discussed in Malaysia since 1983 and finally implemented on 1st April
2015. The history had showed in Table 1.11.
Year History
1983 New beginning
1988 GST first look
1992-2004 GST budget announcement
2005 Cross-country learning
2009 GST bill read in parliament
2013-2014 GST announced
2015 Implementing
Table 1.11. History of GST
Source: Overview of GST (Mohd Rozlan Mohamed Ali, 2015)

How Sales and Services Tax (SST) brings social and economic impact compared to Goods
and Services Tax (GST) in Malaysia?
36
At the year of 1983, Malaysia sends a research team to study the potential of GST in
implementing a more sustainable, broad-based consumption tax system. This is happened
when SST was implementing. On October 1988, Minister of Finance, Tun Daim Zainuddin
tells the Malaysian public that government is considering implementing GST. Next, when
comes to the year 1992, GST was announced again in 1993 Malaysian budget but it was later
deferred. The next mentioned of GST was in the year of 2004, announced by the Prime
Minister, Dato’ Seri Abdullah bin Ahmad Badawi in 2005 Malaysian budget which would
have come into effect by year 2007. But unfortunately, it was then deferred again to give time
for businesses to adapt to changes in process and training of personal. In the progress,
Malaysia sends a team to visit other countries, such as Australia and New Zealand to further
study for GST. As a stop to developing a more effective and efficient taxation system, the
2009 GST Tax Bill was tabled for reading at the Dewan Rakyat. It was deferred again to
ensure laws and regulations relating to the implementation are all in place and the citizen will
be engaged inclusively. Lastly, after the election in 2013, the new Prime Minister Datuk Seri
Najib Razak declares GST with a tax rate of 6% will be implemented in Malaysia. GST
officially commenced from 1st of April 2015.
2.6.3 What is GST?
Goods and Services Tax (GST) also known as value added tax (VAT) in certain
countries. It is a broad-based consumption tax in the form of value added tax. It is the multi
stage tax based on the net value at each stage of the business transaction up to the retail stage
of distribution in Malaysia (Sanusi, Omar and Sanusi, 2015). It started from the manufacturer
to the retailer, wholesaler and distributor. There are two types of supply in GST, which are
taxable supply and non-taxable supply. Taxable supply consists of standard rated supply of
6% (in Table 1.12) and zero rated supply of 0% (in Table 1.12) , where non-taxable supply
consists of exempted supply (in Table 1.12) and out of scope, which both have no GST.
Taxable Supply Non-taxable Supply
Standard rated - 6% Exempted supply
1. Furnitures – Chairs, tables and etc. 1. Public transportation

How Sales and Services Tax (SST) brings social and economic impact compared to Goods
and Services Tax (GST) in Malaysia?
37
2. Clothing
3. Foods and Beverages
4. Domestic Flights
5. Hotel and Accommodations
2. Health care service
3. Highway and toll bridge
4. Financial services
5. Education services
6. Land for residential, agriculture and
general use
Zero rated – 0%
1. Livestock supplies
2. First 300 units of electricity and water
usage to domestic users
3. Poultry and eggs
4. Seafoods – Fish, crab, oyster and etc
5. Medicine, books and etc.
Table 1.12 Example of Taxable supply and non-taxable supply
Furthermore, SST was implemented from the past 40 years, which stands at 6-10%, and
reaching an all time high at 10%. However, tax rate had a record of low rate of 6% in year
2015 due to the implementation of GST (Trading Economics, 2019).
2.6.4 GST Mechanism
GST mechanism categorized to 2 tax, which are input tax and output tax. Input tax
consists of acquisition and purchases activity, which is all related to payment. Raw materials,
rental and telephone are included in input and the GST on input called input tax. After the
purchases and passed through business, businessman, who are manufacturer, wholesaler and
retailer are able to claim the input tax. Output tax consists of supply and sales activity, which
is all related to the income and payment received. Goods and services are taxable and the
GST on output named as output tax.

How Sales and Services Tax (SST) brings social and economic impact compared to Goods
and Services Tax (GST) in Malaysia?
38
2.6.5 Malaysia Government Revenue before re-introduce of Sales and Services Tax
(SST)
GST had introduced in year 2015 and reach the end of implementation on late July 2019,
after the election.
Figure 1.12 Malaysia Government Revenue (in RM million)
Source: TradingEconomics.com , Central Bank of Malaysia
Figure 1.12 show Malaysia Government Revenue in RM million on quarterly base start from
July 2016 (Trading Economics, 2019b). According to Figure 1.12, we can see that after the
implementation of Sales and Services Tax, the revenue increased from RM 58919.6 million
to RM 67168.6 million. In the second and third quarter of year 2018, the revenue is
decreasing and goes up again after the implementation. From here, we can conclude that SST
makes a boost to Malaysia economic in a quarter year.

How Sales and Services Tax (SST) brings social and economic impact compared to Goods
and Services Tax (GST) in Malaysia?
39
CHAPTER – 3
RESEARCH METHODOLOGY
3.0 METHODOLOGY INTRODUCTION
The methodology of the research which comprises of research design, data collection
instruments, data analysis procedures, research ethics and limitation of methodology will be
discussed in this chapter. First, research philosophy is described as well as the research
approaches. In order to determine the most suitable philosophies and methods for research
and sampling, it was necessary to review all possible options. Below I have discussed the
available research techniques and reasons for choosing specific elements in my research.
3.1 RESEARCH DESIGN
This research adopted both qualitative and quantitative methods. Mainly documentary
analysis and survey by questionnaires including:
1. Literature review of Malaysia economy
2. Literature review of impact of SST on the economy
3. Survey on the responses of accountants and taxpayers towards SST
4. Survey on the attitudes of businessman towards SST.
3.2 RESEARCH QUESTIONS
Government has the reasons to switch from Goods and Services Tax (GST) to Sales
and Services Tax (SST) and the tax payers have their concerns in the implementation of the
SST.
Research Questions:
1. What are the different attitude expressed by tax payers in different groups towards Sales
and Services Tax (SST)?
2. What are the tax payer level of satisfaction towards the implementation of Sales and
Services Tax (SST)?

How Sales and Services Tax (SST) brings social and economic impact compared to Goods
and Services Tax (GST) in Malaysia?
40
3. What is the impact of Sales and Services Tax (SST) to the economy of Malaysia?
The research question helps:
1. To understand SST implemented by Malaysian Government and its effect on the economy.
2. To analyze the view of tax payers towards Sales and Services Tax (SST).
3. To understand the attitudes of tax payer after the implementation of SST.
3.2.1 PROPOSED METHODOLOGY
In this research, we proposed to use research onion from Saunders & Lewis. This
framework helps to explain the research methodology we adopted in our study. There are 6
layers in the research onion. This framework go from the first layer, which is at the outer
layer, the philosophies to last layer, which is the inner layer, the techniques and procedures
(Chidi Rafael, 2016). The research onion presented in Figure 2.1.
Figure 2.1 Research onion
Source: Saunders & Lewis (2012)

How Sales and Services Tax (SST) brings social and economic impact compared to Goods
and Services Tax (GST) in Malaysia?
41
3.3 RESEARCH PHILOSOPHY
The outer layer is the research philosophy. Research philosophy is the belief of the
researchers about the methods in which data and sources should be gathered, analysed and
used. This assumption of the research paradigm providing guidance on how you do your
work, enable researchers to explain the methodology used with own standards on evaluating
the quality of the research, and finally fully understanding the assumption that carry the
techniques researchers use to provide confidence to build on the strengths and offset the
weakness of those techniques. (Ragab and Arisha, 2017). In this research, we had taken
pragmatist research philosophy.
Positivism is a quantifiable observation that will produce a statistical analyse. It
means that the positivism is in accordance with the view from human experiences (Positivism
- Research Methodology, no date). It can be observed and measures without bias using a
standardized instrument. In positivism, the statements only divide in 3 categories, which are
true, false and meaningless. A meaningless statement is the one that is not clear enough to be
tested and no way you could test whether or not it is true, which means it isn’t true or false
(‘Positivism’, 2016). We can conclude that meaningless statement is just nonsense.
Interpretivism, in particular, the interpretivist, it involves researchers to interpret the
elements of the study and including human interest into the study and research
(‘Interpretivism (interpretivist) Research Philosophy’, no date). Accordingly, this
interpretivism philosophy emphasizes qualitative analysis methods more than quantitative
analysis methods.
There were cases where the researchers were neither convinced with the positivism or
interpretivism methods. In such case, researchers had chosen the philosophy of pragmatism,
which located between positivism and interpretivism. This research considered to be
relatively “new” compared to other researchs but this method always become an alternative
research methods for researchers. Pragmatism considers that no single view point can ever
give the entire picture which pragmatism focus more on identifying solutions to the issues
through the studies and uses of theories and framework. Pragmatism researchers use a
different variety set of data collection techniques and analysis procedures.

How Sales and Services Tax (SST) brings social and economic impact compared to Goods
and Services Tax (GST) in Malaysia?
42
3.4 RESEARCH APPROACH
The next layer in the research onion is research approach. In order to develop a new
theory, a dimension of research approaches will be introduced, which are induction approach
or deduction approach.
Inductive approach starts with the observations then proposed towards the end of
research process as a result of theory. Inductive approach involves the search of pattern from
observation, then develop and become theory through series of hypotheses (‘Inductive
Approach (Inductive Reasoning)’, no date). This approach used qualitative approach for the
data collection as objective of this approach is gaining understanding of the phenomena and
develop a theory (Ragab and Arisha, 2017).
Deductive approach starts with a hypothesis based on existing theory, followed by
designing a research strategy to test the hypothesis. Deductive approach follows a highly
structured methodology and investigates the relationships between two variables to explain
and generate a finding or confirmation on the theory (‘Deductive Approach (Deductive
Reasoning)’, no date). This approach focus on the explanation and relationships between
variables, to generate a conclusion, so quantitative approach will be used for data collection
(Ragab and Arisha, 2017).
Deductive research approach is taken to fit our research and research philosophy. In
this research, deductive research approach helps to provide the observations that are needed
in forming the views for the outcomes which fits with our research objectives. A set of
structured questionnaires circulated out in order to collect the data and build a deeper
understanding of the observations in addressing the research questions and get the
conclusion.
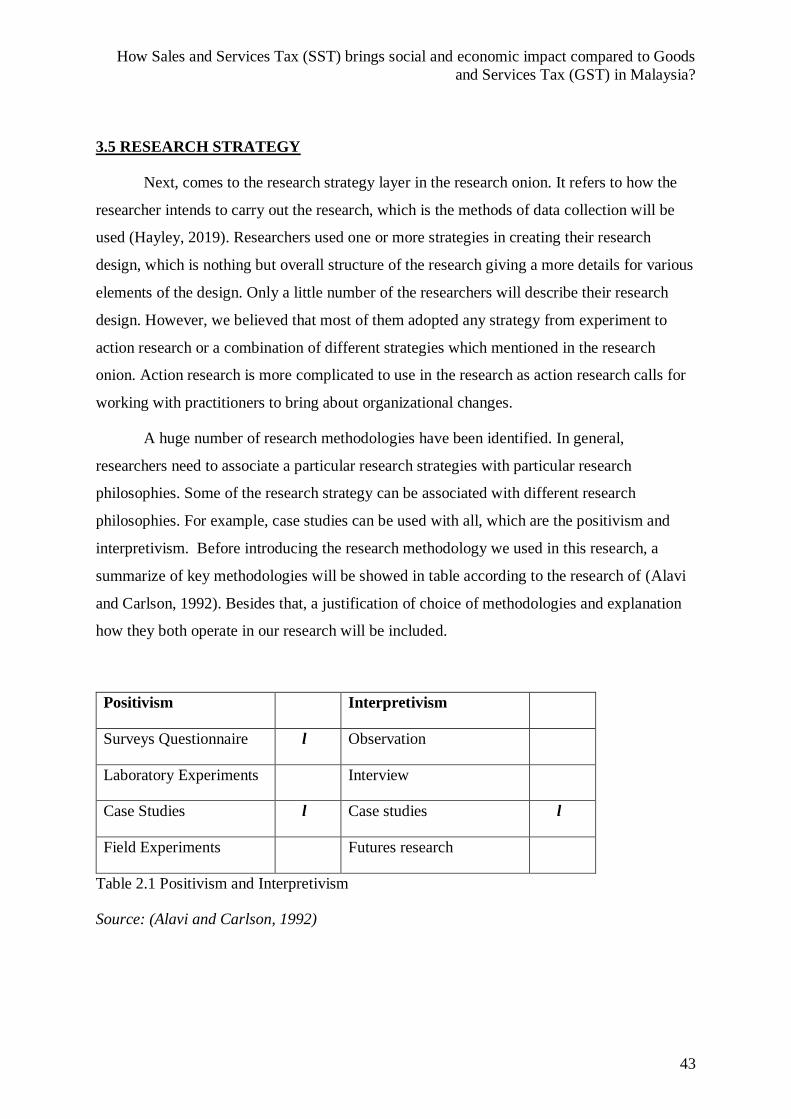
How Sales and Services Tax (SST) brings social and economic impact compared to Goods
and Services Tax (GST) in Malaysia?
43
3.5 RESEARCH STRATEGY
Next, comes to the research strategy layer in the research onion. It refers to how the
researcher intends to carry out the research, which is the methods of data collection will be
used (Hayley, 2019). Researchers used one or more strategies in creating their research
design, which is nothing but overall structure of the research giving a more details for various
elements of the design. Only a little number of the researchers will describe their research
design. However, we believed that most of them adopted any strategy from experiment to
action research or a combination of different strategies which mentioned in the research
onion. Action research is more complicated to use in the research as action research calls for
working with practitioners to bring about organizational changes.
A huge number of research methodologies have been identified. In general,
researchers need to associate a particular research strategies with particular research
philosophies. Some of the research strategy can be associated with different research
philosophies. For example, case studies can be used with all, which are the positivism and
interpretivism. Before introducing the research methodology we used in this research, a
summarize of key methodologies will be showed in table according to the research of (Alavi
and Carlson, 1992). Besides that, a justification of choice of methodologies and explanation
how they both operate in our research will be included.
Positivism Interpretivism
Surveys Questionnaire l Observation
Laboratory Experiments Interview
Case Studies l Case studies l
Field Experiments Futures research
Table 2.1 Positivism and Interpretivism
Source: (Alavi and Carlson, 1992)

How Sales and Services Tax (SST) brings social and economic impact compared to Goods
and Services Tax (GST) in Malaysia?
44
According to (Lancaster, 2012), he argued that positivism theory usually adopt
deductive approach, where as inductive approach is usually link with interpretivism.
Research strategy for this research is the case study approach with the use of a survey
questionnaire. The research will carried out by Primary research and Secondary research.
Primary Research: Survey questionnaires and question interview will used to collect data.
Questionnaires will circulated to tax payers including the businessman.
Secondary Research: Extensive study of secondary data from research reports, journals,
newspaper, government reports and online published information from reliable sources.
3.6 RESEARCH CHOICES
Next layer in the research onion will be the research choice. This choice layer of the
research onion provides option of qualitative approach or quantitative approach. Quantitative
method for data collection was adopted for this study. Quantitative research approach is
consistent with the deductive research approach which we selected. This methods can be
achieved through the survey questionnaires, which is the primary research. The population is
all the individual tax payers, accountants, tax consultants and businessman in Malaysia while
the sample is estimated to 150.
3.6.1 Qualitative Methods
Qualitative methods is primary exploratory research. This research help researchers to
gain understanding of the reasons, opinions, behavior and motivations. This method provides
insights into the research questions and helps to develop an answer for the research
(DeFranzo, 2011). Some of the common methods we can see are group discussions (focus
groups), interviews and observations. This sample is normally small and selected only
particular respondents.

How Sales and Services Tax (SST) brings social and economic impact compared to Goods
and Services Tax (GST) in Malaysia?
45
3.4.2 Quantitative Methods
Quantitative methods enables researcher to test the specific hypotheses and examine
the relationship between the variables. There are some methods, which are online surveys and
paper surveys (DeFranzo, 2011). As the nature of this study is to obtain the attitudes and
behaviour of businessman and tax payer therefore, primary data collection is the most
suitable method as up-to-date information can be collected. The online survey was using the
Google Forms to create the questionnaire and sent 200 online questionnaires to those people
who are working and stay at Malaysia through the email and mass media such as Facebook.
For the questionnaire survey sending to company, a clear inductor cover letter mentioned the
purpose of the study will be attached together with the questionnaire for respondents to have
better understanding on the research. The advantages of using the online questionnaire are
save cost, save time and removal of geographical boundaries.
3.7 TIME HORIZON
Before reaching the core of the research onion, there is a layer named time horizon.
Time horizon refers to the time frame within the research is intended for data collection and
completion. In research onion, there are two types of time horizon, which are cross-sectional
time horizon and the longitudinal.
Cross-sectional time horizon refers to there is a pre-set time established for the
collection of data, which means a time plan is created. When an issue arise in a particular
time and need to be dealt with, a cross-sectional research is undertaken to solve the issue or
answer the questions. In such cases, in the limited time of period, survey, case study or
grounded theory is used. A longitudinal time horizon refers to the collection of date will be
repeated over an extended period. When an issue arise and such that it needs a necessitates
data being collected for a long period of duration, the researchers will consider longitudinal
research.
As cross-sectional time horizon takes shorter period of time compared to longitudinal
time horizon, majority of researchers had undertaken cross-sectional methods. In the case of
research for postgraduate studies as the postgraduate candidate has limited time and

How Sales and Services Tax (SST) brings social and economic impact compared to Goods
and Services Tax (GST) in Malaysia?
46
resources, cross-sectional time horizon method will be undertaken. The research was
conducted over 12 weeks and the activities for each week presented in Table 2.2.
Timing Planned Activities
Week 1 Submit the proposal and presentation to supervisor and start the
research.
Week 2 Review the related literature and start drafting for questionnaire
questions.
Week 3-4 Prepare for primary research and start conducting the survey
questionnaires.
Week 4 Draft the introduction and literature review. Consult with the
supervisor.
Week 5 Review and draft research methodology.
Week 6-7 Summarise the introduction and literature review and draft for data
analysis.
Week 7 Summarise the results collected from respondents and start data
analysis.
Week 8-9 Draft the dissertation from the data collected.
Week 9 Consult with supervisor regarding to the data collected and
analysis.
Week 10 Summarise the data analysis and make conclusions.
Week 11 Finalise the dissertation and check the grammatical errors.
Week 12 Submit the complete dissertation
Table 2.2 Weekly planned timeline of research.
Source: Developed from research
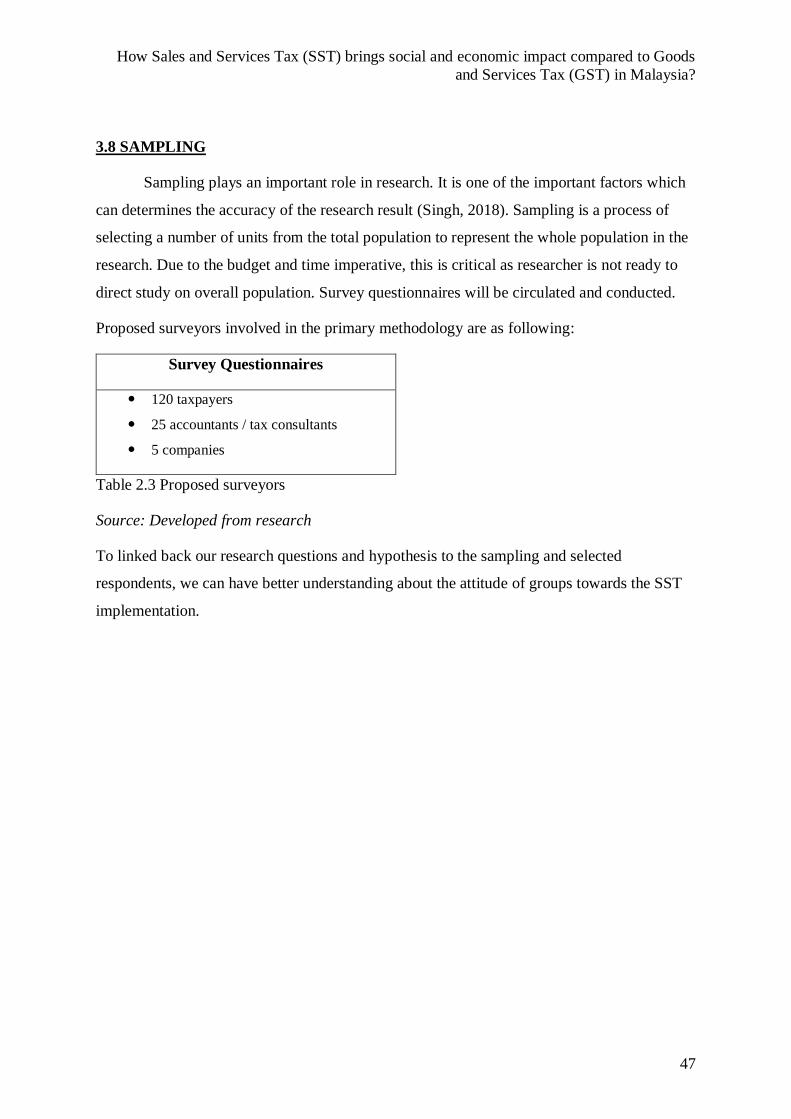
How Sales and Services Tax (SST) brings social and economic impact compared to Goods
and Services Tax (GST) in Malaysia?
47
3.8 SAMPLING
Sampling plays an important role in research. It is one of the important factors which
can determines the accuracy of the research result (Singh, 2018). Sampling is a process of
selecting a number of units from the total population to represent the whole population in the
research. Due to the budget and time imperative, this is critical as researcher is not ready to
direct study on overall population. Survey questionnaires will be circulated and conducted.
Proposed surveyors involved in the primary methodology are as following:
Survey Questionnaires
120 taxpayers
25 accountants / tax consultants
5 companies
Table 2.3 Proposed surveyors
Source: Developed from research
To linked back our research questions and hypothesis to the sampling and selected
respondents, we can have better understanding about the attitude of groups towards the SST
implementation.

How Sales and Services Tax (SST) brings social and economic impact compared to Goods
and Services Tax (GST) in Malaysia?
48
3.9 DATA ANALYSIS TECHNIQUS AND PROCEDURES
The final layer in the research onion is the data analysis techniques and procedures
taken. This is the section which we know how and which methods are undertaking the
research. In this research, we adopted both primary and secondary research. Primary
research is from the survey questionnaires and second research entailed the use of relevant
reports, published articles and academic literature. They are the key research instrument
utilised in the research. Survey questionnaires focused on the behaviour and view to the
implementation of SST. A structured survey questionnaires (closed-ended questions and
open-ended questions) was designed to let the respondents to be answered to collect the data.
The results of questionnaire were being analysed. The objective of this is to analyse
and interpret the data collected throughout the survey. The data collected by using survey
questionnaire will be analysed by using the software of Microsoft Excel to create and present
tables and charts. The result will be analysed and divided into several parts.
3.10 RESEARCH ETHICS
One issue to face in the research is the ethics that how researchers deal with
confidential and unauthorized data. I was no exception. There will be a major ethical issue I
had expected to deal with. First, I was expected for the low response rate. All researchers
would certainly like to receive more responses than less in the surveys. However, the desire
for high response rate should not compromise the ethical principles of a researcher. I might
have some ways to increase the response rate especially when facing the restrictions in
mailing the questionnaires, but they have not been considered because they were not ethical
to me as a researcher and a professional. Furthermore, all responses will be properly kept and
assigned a number upon receipt to avoid any missing copies. All returned questionnaires will
be destroyed after this project is marked.
How Sales and Services Tax (SST) brings social and economic impact compared to Goods
and Services Tax (GST) in Malaysia?
49
3.11 LIMITATIONS OF METHODOLOGY
With the hard work and effort that contributed to this research, there are a number of
limitations form this study that need to be highlighted. First, the research limited the study of
few areas only and some areas have not been covered. Second, the data collected for this
research is collected from 4 states in Malaysia, which are Penang, Kedah, Seremban and
Kuala Lumpur. The result received from this research may or may not be suitable for
application to the other states of Malaysia due to geographical limitations.
Lastly, the time constraint to complete this project limits the time period for data
collection. Thus, this study only based on targeted responses. Although the targeted number
of participants is sufficient for conducting the research, but a bigger sample size will have
better generalized for the population at large. The research reliably depends on the accuracy
of primary data collected and secondary data which is subject to changes depending on
government policies and updates from time to time.

How Sales and Services Tax (SST) brings social and economic impact compared to Goods
and Services Tax (GST) in Malaysia?
50
CHAPTER - 4
SURVEY FINDINGS AND ANALYSIS
4.0 INTRODUCTION
The objective of this chapter is to make clear on the following questions, how Sales
and Services Tax (SST) bring social impact compared to goods and services tax (GST) in
Malaysia? What is the impact of Sales and Services Tax (SST) to the economy of Malaysia?
What is the different attitude expressed by taxpayers in different groups towards Sales and
Services Tax (SST)? Several previous studies have already provided convincing proofs to
these questions.
4.1 FINDINGS AND ANALYSIS OF THE RESULTS OF QUESTIONNAIRE
167 responses were received on the returned questionnaires.

How Sales and Services Tax (SST) brings social and economic impact compared to Goods
and Services Tax (GST) in Malaysia?
51
(a) Questions 1 to 6: (Background information)
This background information provides us with a better analysis of the view of different
groups of tax payers towards the implementation of SST. These background questions
included the industry involved, current classification, role, duration of experience in the
industry, education and annual income after tax. The responses to Question 1 to 6 are shown
in Figure 3.1 to 3.6 and Table 3.1 to 3.6 respectively.
Question 1 Which business sector or industry are you currently work for?
Business Sector / Industry Response(s)
Media and Telecommunications 8
Food and Beverages 13
Advertising and Public relations 14
Financial Services and Banking 25
Industrial Production 22
Pharmaceutical 13
Retail and Consumer 19
Transportation and Logistic 9
Others: Education
Manufacturing
Travelling
Marketing
Medical and Health care
Beauty and Haircare
Others
13
4
5
4
7
5
6
Table 3.1 Business sector or industry

How Sales and Services Tax (SST) brings social and economic impact compared to Goods
and Services Tax (GST) in Malaysia?
52
Figure 3.1 Business sector or Industry
Question 2 Please indicate your current classification.
Classification Response(s)
Self-employed / Businessman 26
Employee 107
Management 34
Table 3.2 Current classification
Figure 3.2 Current classification
5%8%
8%
15%
13%8%
11%
5%
8%
3%
3%2%
4%
3%
4%
Business sector/ Industry Media andTelecommunicationFood and Beverages
Advertising and PublicrelationsFinancial Services andBankingIndustrial Production
Pharmaceutical
Retail and Consumer
Transportation
Education
16%
20%
64%
Current Classification
Self employed/ Businessman
Management
Employee
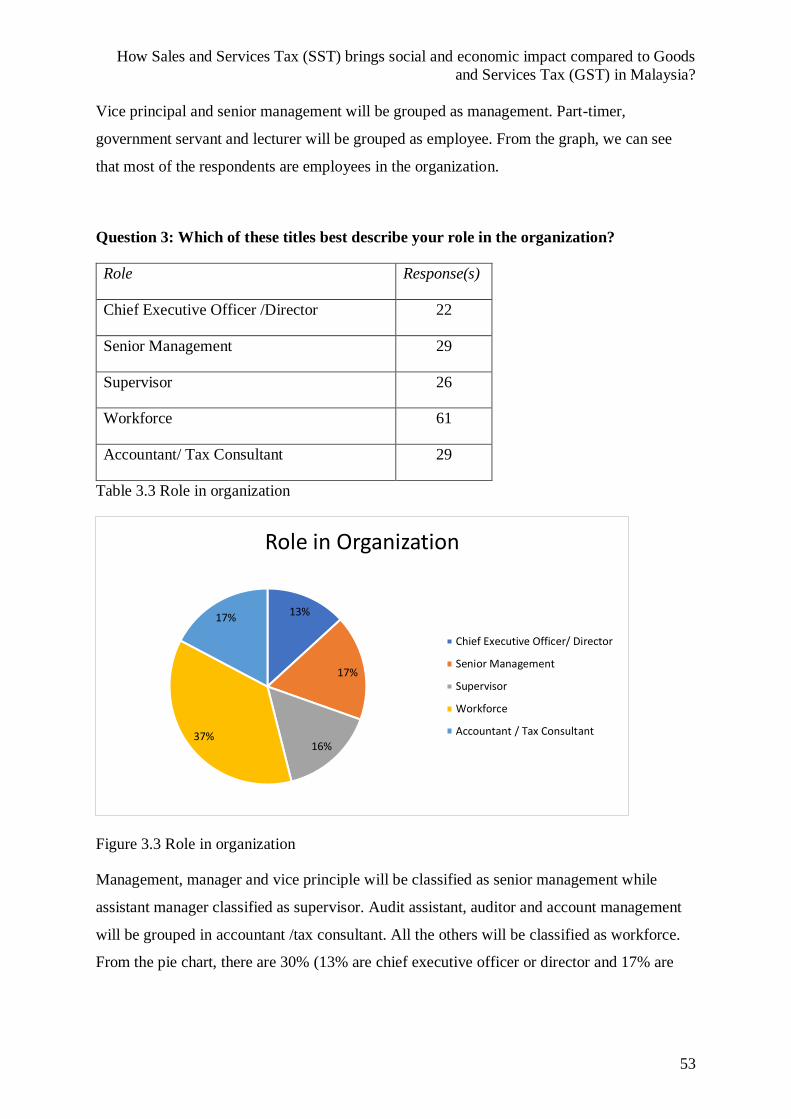
How Sales and Services Tax (SST) brings social and economic impact compared to Goods
and Services Tax (GST) in Malaysia?
53
Vice principal and senior management will be grouped as management. Part-timer,
government servant and lecturer will be grouped as employee. From the graph, we can see
that most of the respondents are employees in the organization.
Question 3: Which of these titles best describe your role in the organization?
Role Response(s)
Chief Executive Officer /Director 22
Senior Management 29
Supervisor 26
Workforce 61
Accountant/ Tax Consultant 29
Table 3.3 Role in organization
Figure 3.3 Role in organization
Management, manager and vice principle will be classified as senior management while
assistant manager classified as supervisor. Audit assistant, auditor and account management
will be grouped in accountant /tax consultant. All the others will be classified as workforce.
From the pie chart, there are 30% (13% are chief executive officer or director and 17% are
13%
17%
16%37%
17%
Role in Organization
Chief Executive Officer/ Director
Senior Management
Supervisor
Workforce
Accountant / Tax Consultant

How Sales and Services Tax (SST) brings social and economic impact compared to Goods
and Services Tax (GST) in Malaysia?
54
senior management) of respondents are in top management level and the rest of respondents
are workforce, accountant or tax consultants.
Question 4: How long have you worked in the industry?
Duration Response(s)
0-5 years 59
6-10 years 29
11-15 years 31
16-20 years 25
21-30 years 13
More than 30 years 10
Table 3.4 Duration in industry
Figure 3.4 Duration in industry
According to the pie chart created, most of the respondents had lesser experience in the
industry. More than half of the respondents have more then 10 years experiences in the
industry.
35%
17%
19%
15%
8%
6%
Duration in the Industry
0-5 years
6-10 years
11-15 years
16-20 years
21-30 years
More than 30 years

How Sales and Services Tax (SST) brings social and economic impact compared to Goods
and Services Tax (GST) in Malaysia?
55
Question 5: What is your education?
Education Response(s)
Doctoral Degree 7
Master’s Degree 25
Bachelor’s Degree 74
Diploma/ Certificate 42
High School Graduate 19
Table 3.5 Education
Figure 3.5 Education
A total of 106 of the respondents are holding the qualification on and above bachelor’s
degree, which are 44% of bachelor’s degree holder, 15% of master’s degree holder and 4% of
doctoral degree holder. The rest of the respondents are 12% of high school graduate, and 25%
of diploma or certificate holders. From the pie chart, we can see that most of the respondents
have higher qualification.
4%
15%
44%
25%
12%
Education
Doctoral Degree
Master's Degree
Bachelor's Degree
Diploma/ Certificate
High School Graduate

How Sales and Services Tax (SST) brings social and economic impact compared to Goods
and Services Tax (GST) in Malaysia?
56
Question 6: What is your annual income after tax?
Annual income after tax Response(s)
Below RM29,999 31
RM30,000 – RM59,999 53
RM60,000 – RM89,999 34
RM90,000 – RM119,999 23
RM120,000 – RM149,999 11
RM150,000 and above 15
Table 3.6 Annual income after tax
Figure 3.6 Annual income after tax
From the pie chart, we see that almost half of the respondents earn less then RM60,000 as
annual income after tax. In this study, annual income after tax will have relationship with
implementation of SST in Malaysia because a higher income earner may feel that SST brings
no impact to them. However, the lower income earner may feel that a change of tax system
may bring extra burden or an advantage to them.
18%
32%
20%
14%
7%
9%
Annual income after tax
Below RM29,999
RM30,000 - RM59,999
RM60,000 - RM89,999
RM90,000 - RM119,999
RM120,000 - RM149,999
RM150,000 and above

How Sales and Services Tax (SST) brings social and economic impact compared to Goods
and Services Tax (GST) in Malaysia?
57
(b) Questions 7 to 9: (Awareness of Sales and Services Tax in Malaysia)
Question 7 Do you live in a country with Sales and Services Tax (SST)?
This question designed to know that whether respondents had the experience of living in a
country with Sales and Services Tax (SST). The results summarized in Table 3.7 and Figure
3.7.
Choice Response(s)
Yes 163
No 2
Neutral 2
Don’t Know 0
Table 3.7 Choices of staying in country with SST
Figure 3.7 Choices of staying in a country with SST?
From the bar chart, a total of 163 respondents responded that they are living in the country
with implementation of SST.
Yes, 163
No , 2 Neutral , 20
50
100
150
200
Yes No Neutral
Do you live in a country with SST?
Responses

How Sales and Services Tax (SST) brings social and economic impact compared to Goods
and Services Tax (GST) in Malaysia?
58
Question 8 Do you know what is Sales and Services Tax (SST)?
The responses reflect that taxpayers are knowledge to the Sales and Services Tax (SST)
which implemented in Malaysia. The results summarized in Table 3.8 and Figure 3.8.
Choice Response(s)
Yes 151
No 3
Neutral 13
Don’t Know 0
Table 3.8 Knowledge to SST
Figure 3.8 Knowledge to SST
90% of the respondents knows what is SST and 2% of them don’t know what is SST. The
rest of the respondents have neutral response.
90%
2%8%
Do you know what is SST?
Yes
No
Neutral

How Sales and Services Tax (SST) brings social and economic impact compared to Goods
and Services Tax (GST) in Malaysia?
59
Question 9 Do you know when Sales and Services Tax (SST) was implemented to
replace Goods and Services Tax (GST)?
The response reflects that the awareness of Sales and Services Tax (SST) had implemented to
replace the old tax system, which is Goods and Services Tax (GST). The results summarized
in Table 3.9 and Figure 3.9.
Choice Response(s)
Yes 162
No 1
Neutral 3
Don’t Know 1
Figure 3.9 Awareness of replacement
Figure 3.9 Awareness of replacement
According to the bar chart, most of the peoples aware that there is a replacement of SST to
GST.
0
50
100
150
200
Yes No Neutral Don’t Know
Do you know when SST was implemented to replace GST?
Responses

How Sales and Services Tax (SST) brings social and economic impact compared to Goods
and Services Tax (GST) in Malaysia?
60
(c) Questions 10 to 14: (Malaysian’s tax system)
Question 10 Do you think the Sales and Services Tax (SST) a fair and just tax?
This response reflects the view of whether thinking Sales and Services Tax (SST) is a fair
and just tax. The results summarized in Table 3.10 and Figure 3.10.
Choice Response(s)
Yes 94
No 28
Neutral 32
Don’t Know 13
Table 3.10 View of SST a fair and just tax
Figure 3.10 View of SST a fair and just tax
According to the data collected, 56% of the Malaysia thinks that SST is a fair and just tax
whereas 17% of them are disagree. Furthermore, 45 of the respondents holding a neutral and
no idea view.
56%
17%
19%
8%
Do you think SST is a fair and just tax?
Yes
No
Neutral
Don’t Know
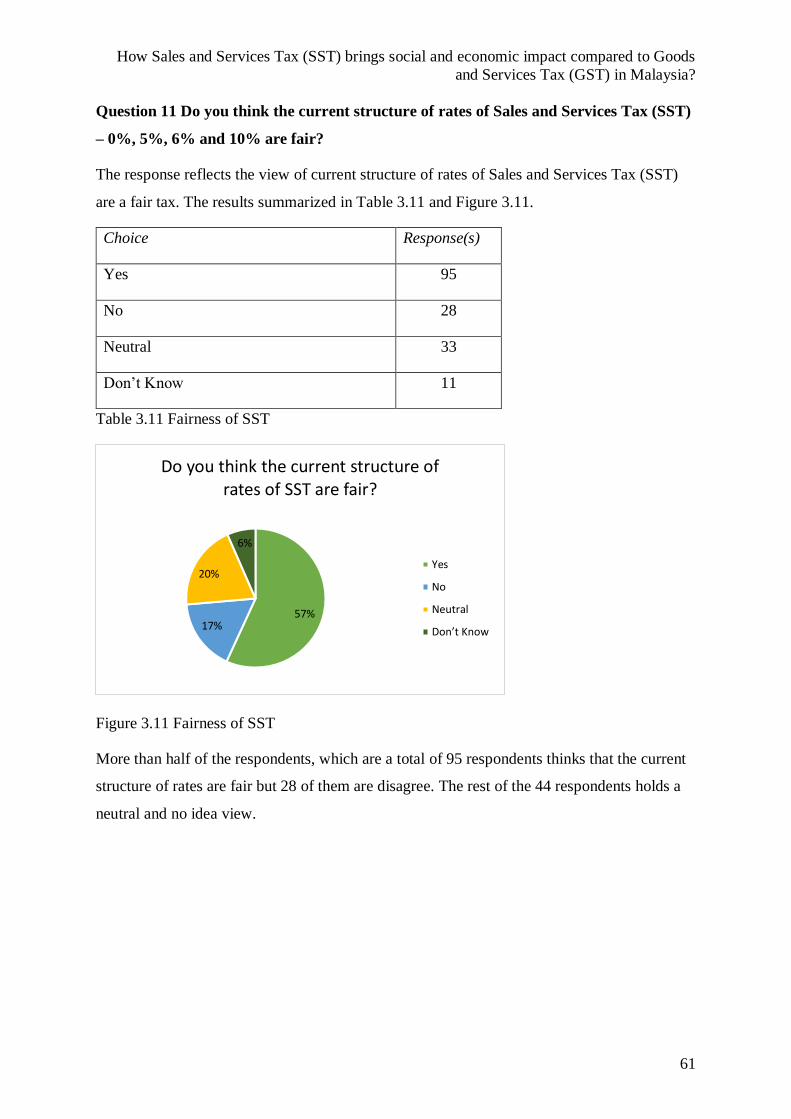
How Sales and Services Tax (SST) brings social and economic impact compared to Goods
and Services Tax (GST) in Malaysia?
61
Question 11 Do you think the current structure of rates of Sales and Services Tax (SST)
– 0%, 5%, 6% and 10% are fair?
The response reflects the view of current structure of rates of Sales and Services Tax (SST)
are a fair tax. The results summarized in Table 3.11 and Figure 3.11.
Choice Response(s)
Yes 95
No 28
Neutral 33
Don’t Know 11
Table 3.11 Fairness of SST
Figure 3.11 Fairness of SST
More than half of the respondents, which are a total of 95 respondents thinks that the current
structure of rates are fair but 28 of them are disagree. The rest of the 44 respondents holds a
neutral and no idea view.
57%17%
20%
6%
Do you think the current structure of rates of SST are fair?
Yes
No
Neutral
Don’t Know

How Sales and Services Tax (SST) brings social and economic impact compared to Goods
and Services Tax (GST) in Malaysia?
62
Question 12 Do you believe there is a fundamental structural problem in tax system?
There are 43% of the respondents agree that there is a fundamental structural problem in the
tax system. 35% disagree, and 22% are either neutral or of no idea. The result is summarized
in Table 3.12 and Figure 3.12 below.
Choice Response(s)
Yes 72
No 59
Neutral 10
Don’t Know 26
Table 3.12 View of fundamental structure problem in tax system
Figure 3.12 View of fundamental structural problem in tax system
According to the data collected, 43% of them believe that there is a fundamental structural
problem in the tax system, 35% of them feels that the current tax system is fine and the rest
of 22% holds a neutral and no idea view.
43%
35%
6%
16%
Do you believe there is a fundamental structural problem in tax system?
Yes
No
Neutral
Don’t Know

How Sales and Services Tax (SST) brings social and economic impact compared to Goods
and Services Tax (GST) in Malaysia?
63
Question 13 If you agree with Question 12, which of the following is the major cause of
structural problem?
26% and 34% believe narrow tax base and the high public expenditure are the major cause of
the structural problem. However, most of the respondents, which are 36% opine that both the
narrow tax base and high public expenditure are the major cause of the fundamental
structural problem in Malaysia.
Furthermore, there are also some comments.
In general, respondents believe the causes of structural problem are as followings:
(i) poor government performance
(ii) misallocation of the public resources and
(iii) uneven income distribution etc.
The results are summarized in Table 3.13 and Figure 3.13.
Answer Response(s)
Tax base is too narrow 43
Public expenditure is too high 57
Both of above 60
Others: 7
Table 3.13 Major cause of structural problem
26%
34%
36%
4%
Major cause of structural problem
Tax base is too narrow
Public expenditure is toohigh
Both of above
Others

How Sales and Services Tax (SST) brings social and economic impact compared to Goods
and Services Tax (GST) in Malaysia?
64
Figure 3.13 Major cause of structural problem
The result considers consistent with the analysis in Question 13 that the majority of
respondents hold the view that public expenditure is too high is the main cause of the
structural problem in the tax system. 26% of the respondents believe the narrow tax base
alone cause the structural problem and 36% believe both are the major cause of problem. In
other words, a total of 62% of taxpayers believe that narrow tax base is the main structural
problem. Furthermore, 70% of the taxpayers agree that high government expenditure is one
of the factors contributed to the structural issue.
Question 14 Is it necessary to introduce a new tax system to solve the problem?
Among all respondents, 31% hold the view that a new tax system is required and 37% of the
respondents do not agree to implement a new tax system in Malaysia. Their views are
summarized in Table 3.14 and Figure 3.14.
Choice Response(s)
Yes 52
No 62
Neutral 27
Don’t Know 26
Table 3.14 Necessity to introduce a new tax system
Figure 3.14 Necessity to introduce a new tax system
31%
37%
16%
16%
Is it necessary to introduce a new tax system to solve the problem?
Yes
No
Neutral
Don’t Know
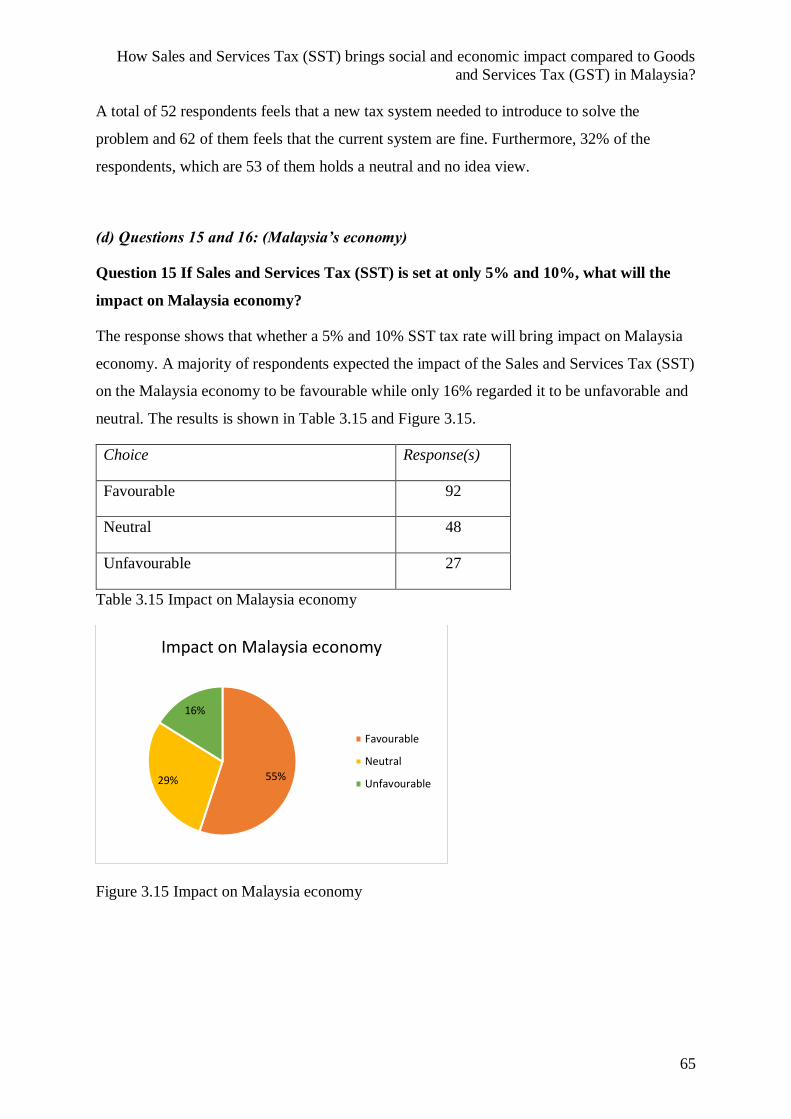
How Sales and Services Tax (SST) brings social and economic impact compared to Goods
and Services Tax (GST) in Malaysia?
65
A total of 52 respondents feels that a new tax system needed to introduce to solve the
problem and 62 of them feels that the current system are fine. Furthermore, 32% of the
respondents, which are 53 of them holds a neutral and no idea view.
(d) Questions 15 and 16: (Malaysia’s economy)
Question 15 If Sales and Services Tax (SST) is set at only 5% and 10%, what will the
impact on Malaysia economy?
The response shows that whether a 5% and 10% SST tax rate will bring impact on Malaysia
economy. A majority of respondents expected the impact of the Sales and Services Tax (SST)
on the Malaysia economy to be favourable while only 16% regarded it to be unfavorable and
neutral. The results is shown in Table 3.15 and Figure 3.15.
Choice Response(s)
Favourable 92
Neutral 48
Unfavourable 27
Table 3.15 Impact on Malaysia economy
Figure 3.15 Impact on Malaysia economy
55%29%
16%
Impact on Malaysia economy
Favourable
Neutral
Unfavourable

How Sales and Services Tax (SST) brings social and economic impact compared to Goods
and Services Tax (GST) in Malaysia?
66
Question 16 Do you expect the introduction of Sales and Services Tax (SST) to be
revenue neutral. ie. That the government will no generate additional tax revenue.
The response reflects the expectation of introduction of Sales and Services Tax (SST) to be
revenue neutral to Malaysia, which the government will no generate additional tax revenue.
Choice Response(s)
Yes 90
No 24
Neutral 19
Don’t Know 24
Table 3.16 Expectation of the introduction of SST to be revenue neutral
Figure 3.16 Expectation of the introduction of SST to be revenue neutral
A total of 90 respondents expect that the introduction of SST will be revenue neutral and 34
of them believe that the introduction of SST will generate revenue to the government and
country. The rest of the respondents holdings the neutral and no idea view.
54%
20%
12%
14%
Expectation of the introduction of SST to be revenue neutral
Yes
No
Neutral
Don’t Know

How Sales and Services Tax (SST) brings social and economic impact compared to Goods
and Services Tax (GST) in Malaysia?
67
(e) Questions 17 to 19: (The Sales and Services Tax)
Question 17 What do you expect the tax rate to be in 5 years times?
There are 33% of the respondents expected that the rate would be increased within 5 years
while 44% of respondents expected the tax rate to remain unchanged even though the
government set the tax rate at 5%, 6% and 10%. Furthermore, there are also 18% of
respondents expected the tax rate would be reduced. The results are summarized in Table
3.17 and Figure 3.17.
Expectation Response(s)
Higher 55
Unchanged 74
Lower 30
Don’t Know 8
Table 3.17 Expectation of tax rate in 5 years times
Figure 3.17 Expectation of tax rate in 5 years times
33%
44%
18%
5%
Expectation of tax rate in 5 years times
Higher
Unchanged
Lower
Don’t Know
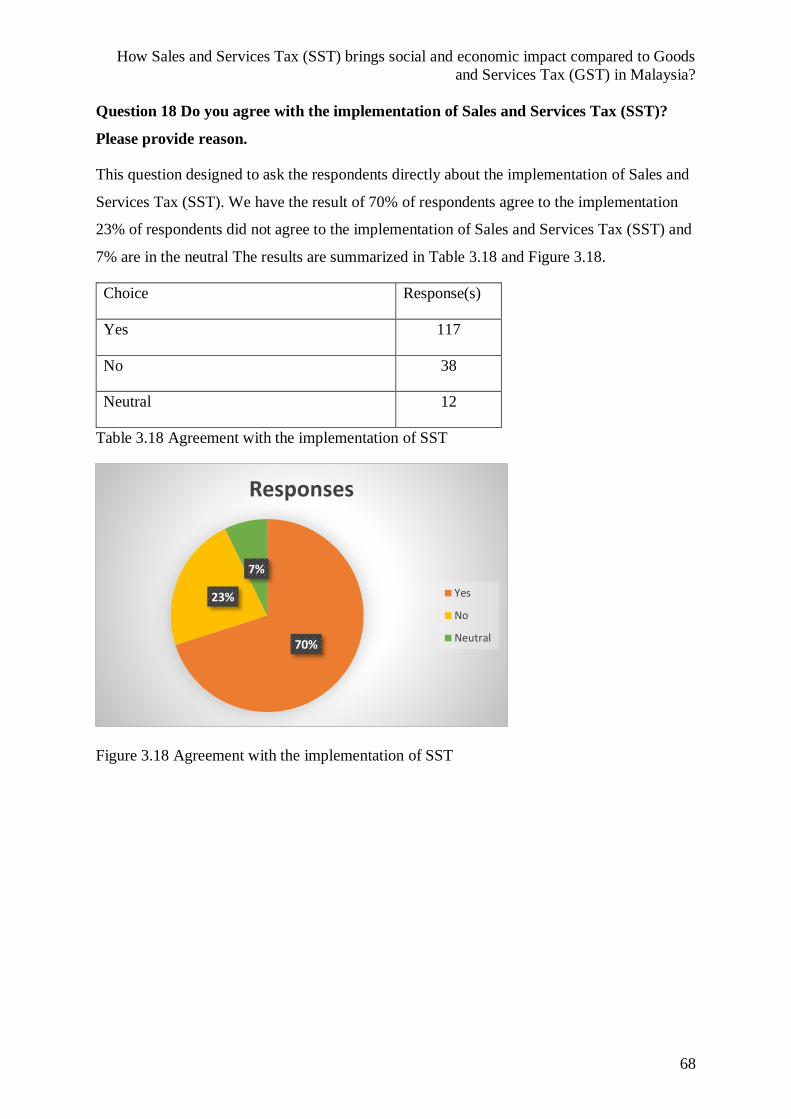
How Sales and Services Tax (SST) brings social and economic impact compared to Goods
and Services Tax (GST) in Malaysia?
68
Question 18 Do you agree with the implementation of Sales and Services Tax (SST)?
Please provide reason.
This question designed to ask the respondents directly about the implementation of Sales and
Services Tax (SST). We have the result of 70% of respondents agree to the implementation
23% of respondents did not agree to the implementation of Sales and Services Tax (SST) and
7% are in the neutral The results are summarized in Table 3.18 and Figure 3.18.
Choice Response(s)
Yes 117
No 38
Neutral 12
Table 3.18 Agreement with the implementation of SST
Figure 3.18 Agreement with the implementation of SST
70%
23%
7%
Responses
Yes
No
Neutral

How Sales and Services Tax (SST) brings social and economic impact compared to Goods
and Services Tax (GST) in Malaysia?
69
92 respondents gave reason on their options, which are 66 support SST, 21 did not support
SST and 5 having a neutral opinion. The reasons of their options are summarized as follows:
Support SST
Reason Response(s)
Support country’s economy and development 8
Lower tax/ increase in profit 11
Generate revenue for country 9
Increase in savings/ less expenditures 8
Simple and easier tax 11
More goods exempted 6
People’s friendly (not burden on consumer) 6
Easier in preparation 7
Table 3.19 Agree with SST implementation
From the analysis, most of the people thinks that SST is a simple and easier tax which the
lower tax can brings more profit to businessman. Next, in personal perspect, a change to SST
implementation can help to increase savings and have less expenditures. In national and
country perspect, people think that the implementation can generate revenue for country,
which help to support country’s economy and development. From the views of accountants
or tax consultants, they think that tax documentation is easier to prepare. Furthermore, SST
become more people’s friendly because more goods are exempted, which won’t cause a
burden on consumer.

How Sales and Services Tax (SST) brings social and economic impact compared to Goods
and Services Tax (GST) in Malaysia?
70
Figure 3.19 Agree with SST implementation
Did not Support SST
Reason Response(s)
Increase in spending/ less savings 3
Burden on people 4
Unclear tax structure 3
Complication of tax 7
Increase in prices of goods and services 4
Table 3.20 Disagree with SST implementation
There are 21 peoples vote that they are not supporting SST. From the analysis, a number of
them comment that SST is a complicated tax and it is an unclear tax structure. Lastly, people
think that it makes an increase in prices of goods and services, which increase in spending ad
make less savings. It becomes a burden to people.
0 2 4 6 8 10 12
Support country's economy and development
Lower tax / increase in profit
Generate revenue for country
Increase in savings/ less expenditures
Simple and easier tax
More goods exempted
People's friendly (not burden on consumer)
Easier in prepration
Agree with implementation

How Sales and Services Tax (SST) brings social and economic impact compared to Goods
and Services Tax (GST) in Malaysia?
71
Figure 3.20 Disagree with SST implementation
There a few peoples response with a neutral view. To conclude that, people thinks that there
must be a tax, else there is no country. No matter which tax is implemented, a clean
government is needed and tax is never the issue to country and people.
Question 19 If you agree, what Sales and Services Tax (SST) tax rate do you think is
appropriate?
There are 59% of the respondents suggested a rate of 5% while 18% suggested 6%. There are
only less respondents, ie 9%, 5% and 9% agree with the suggested tax rate of 2%, 10% and
0% respectively. We can see that have no respondents agree with the suggested tax rate of
20% which is extremely high. The results are summarized in Table 3.21 and Figure 3.21.
Tax rate Response(s)
0% 15
2% 15
5% 98
6% 31
10% 8
0 1 2 3 4 5 6 7 8
Increase in spending / less savings
Burden on people
Unclear tax structure
Complication of tax
Increase in prices of goods and services
Disagree with implementation

How Sales and Services Tax (SST) brings social and economic impact compared to Goods
and Services Tax (GST) in Malaysia?
72
20% 0
Table 3.21 Appropriateness of SST tax rate
Figure 3.21 Appropriateness of SST tax rate
From the data, it suggests that tax payers believe that Sales and Services Tax (SST) could
only be effective, or balance at the tax rates between 5% and 6%.
(f) Questions 20: (Comment)
Question 20 is an open-ended question. 9 respondents gave their comments.
COMMENT
1. If possible, no GST and SST tax. Burden the citizen.
2. Tax is unavoidable. Country need tax to improve our infrastructure and extra.
3. Tax rate should not be consistent for all items.
4. Reduce public waste and tax will come down.
5. SST need to offset income tax. Tax from both is too burden.
6. Put back GST but start from 3% to 4%.
7. A flat rate should be implemented.
8. Should use flat rate instead of 5% and 10%.
9%
9%
59%
18%
5%
Appropriateness of Tax rate
A- 0%B- 2%C- 5%D- 6%E- 10%

How Sales and Services Tax (SST) brings social and economic impact compared to Goods
and Services Tax (GST) in Malaysia?
73
9. No SST is the best. If here is service tax at restaurant, then why still SST? Implement
one is enough. For example, some restaurant don’t even deserve to pay tax.
From the comment given, most of the peoples think that a flat rate should be implemented. A
different rate of the tax seems like make complication and misunderstand the consumer.
Next, respondent thinks that tax is unavoidable as country needs tax for the development.
Last but not least, people seems want to have a single tax instead of having a different tax,
which are income tax.
4.2 FURTHER ANALYSIS
Next, we used two variables to have further analysis of the SST implementation.
1. Annual income and view to implement SST
We believed that different income groups of people will have different view to the
implementation of SST. The results are summarized in Figure 3.22.
Figure 3.22 Annual income vs the view to implement SST
From Figure 3.22, we can see the majority of the respondents agreed with the implementation
of SST. Furthermore, for the group of people who have higher income, they are agree with
0 5 10 15 20 25 30 35 40 45
Below RM29,999
RM30,000 - RM59,999
RM60,000 - RM89,999
RM90,000 - RM119,999
RM120,000 - RM149,999
RM150,000 and above
Annual Income
Neutral No Yes

How Sales and Services Tax (SST) brings social and economic impact compared to Goods
and Services Tax (GST) in Malaysia?
74
the implementation. It is because their annual income after tax is higher and the tax would not
have any impact to their spending as they can earn. For the lower income group, they also
agree with the implementation of SST. It is because of the rate is slightly lower than GST
implementation.
2. Education and view to implement SST
Education of the people may bring some influence to the SST implementation. Different level
of education means to have different level of understanding and knowledge. However, a
higher qualification doesn’t mean will have fully understanding as tax is a complicated topic.
The results are summarized in Figure 3.23.
Figure 3.23 Education and view to implement SST
A majority of respondents agreed with the SST implementation. According to Figure 3.23,
respondents who have lower qualification, which below bachelor’s degree holder holds a
number of disagree. It is due to lower qualification may have misunderstanding or not
familiar with the SST. For higher education holder, we believed that the knowledge and
policy which publicly available can be easy understand by them.
0 10 20 30 40 50 60
Doctoral Degree
Master's Degree
Bachelor's Degree
Diploma / Certificate
High School Graduate
Education
Neutral No Yes

How Sales and Services Tax (SST) brings social and economic impact compared to Goods
and Services Tax (GST) in Malaysia?
75
3. Annual income and appropriateness of tax
As mentioned previously, annual income may have different views to the implementation.
Next, different income group may have different view to the appropriateness of tax rate. The
results are summarized in Figure 3.24.
Figure 3.24 Annual income and appropriateness of tax
As majority of the respondents agreed with the SST implementation, and we can see that
most of them believed that 5% and 6% tax rate is more appropriate. However, higher annual
income doesn’t mean that they are likely support a higher tax rate. From Figure 3.24, we can
read that annual income below RM90,000 are more support to the 5% tax rate.
4. Financial services and banking and view to implement SST
In the previous section, we discussed about level of education. Next, we investigate only the
financial services and banking with the view to implement SST. In the previous section,
higher education may don’t have taxation knowledge. Now, we focused on the financial
services and banking industry. The results are summarized in Figure 3.25.
0 5 10 15 20 25 30 35
Below RM29,999
RM30,000 - RM59,999
RM60,000 - RM89,999
RM90,000 - RM119,999
RM120,000 - RM149,999
RM150,000 and above
Annual Income vs Appropriateness of Tax
E- 10% D- 6% C- 5% B- 2% A- 0%

How Sales and Services Tax (SST) brings social and economic impact compared to Goods
and Services Tax (GST) in Malaysia?
76
Figure 3.25 Financial services and banking and view to implement SST
There are 25 respondents in the Financial service and banking industry. From the data
collected, there are 19 respondents, which is 76% agreed with the implementation of SST.
Some of them had made comment on why they agreed. They comment that it will help to
improve and sustain the country’s economy. Next, they found that the preparation of filing is
much more easier and less complicated than GST. However, 5 respondents do not agree with
it as they comment that SST increase spending and much more complex due to different
category of taxes applied compared than single rate of tax in GST.
76%
20%4%
Financial Services and Banking
YES NO NEUTRAL

How Sales and Services Tax (SST) brings social and economic impact compared to Goods
and Services Tax (GST) in Malaysia?
77
CHAPTER – 5
CONCLUSIONS AND RECOMMENDATIONS
5.1 CONCLUSIONS
This research analysed the social and economic impact of SST to Malaysia. On the
basis of the literature review and survey results, we may draw some conclusions. SST is one
of the famous topics being discussed by Malaysian since the government’s announcement to
reintroduce in September 2019. It is believed that the implementation of the new tax system
is one of the measures to gain more revenues for the country, which may help to improve
Malaysia economy. The more revenues gained by the government, the more benefits will be
gained by nations. Thus in doing so, it needs the cooperation and commitment from all
parties, professionals, politicians including the students and freelancers. This is because by
having a clear understanding of this concept, it will give a good effect for a better
government. Recognition must be made of the need for the government to explore methods
that increase future revenue source. On the condition that the government does announce the
SST 2.0, preparations for the re-introduce are crucial.
On the basis of the survey results, the following conclusions could be drawn:
1. Awareness of Sales and Services Tax
A majority of the respondents staying in a country with SST, but slightly some of them have
less knowledge about what SST is. As tax is one of the revenue generator to country which
supported by tax payers, majority of tax payers aware of it and know when the re-
implementation to replace GST.
2. Tax system
About half of the respondents think that SST is a fair and just tax. A majority of the
respondents agreed that the tax system had a fundamental structural problem. The problem
was caused by either high public expenditure or the narrow tax base or both.
3. Malaysia’s economy
Majority of respondents agreed that SST will brings favourable impact to the Malaysia
economy. A majority of respondents did not believe that SST would be revenue-neutral. This

How Sales and Services Tax (SST) brings social and economic impact compared to Goods
and Services Tax (GST) in Malaysia?
78
is indicating that they were not confident that the increase in revenue from the SST would be
totally offset by the reductions in income tax and the increase of transfer to help the lower
income or poor.
4. Sales and Services Tax
Respondents feel that the tax rate remains unchanged in 5 years times. A majority of
respondents agreed to implement SST as it is a simple and easier tax, which help people to
understand easily and support country’s economy and development. Lastly, respondents
believed that the tax rate should be set between 5% and 6%.
5.2 RECOMMENDATIONS
This research aims to provide information for analysing the impact of SST re-
introduction in Malaysia. The results of the survey and analysis should give some thoughts to
tax payers in respect of the SST. I would recommend that further studies on the views of
particular group of tax payers towards SST and its impact should be conducted. This would
enrich our knowledge of the SST.
In the context of this tax system, SST, the responsible party should pay attention and
emphasis the public, the tax payers to understand the innovations happening in the tax
system. Therefore, some aspects need to be observed. For example, the definition of the
terms used the scope of the SST’s implementation, a specific list of goods and services that
subject to tax and most important, they comply and adhere to the rules and regulations fairly
and in transparent manner so that the tax payers are not burdened with the re-introduction.
While reviewing the tax system, the simple tax system should be maintained.
Providing adequate and relevant fundamental information is necessary to make tax payers
better understand the general principle of SST by organizing seminar, training and forum in
order to increase the awareness and knowledge. Awareness on exempted items should be
raised through effective communication. Consumers should also be educated on what to do
should they fall victim to price manipulation. On the other hand, government should remain
steadfast with the list of goods and services that are exempted from SST. The measures
should be taken to reduce the income and wealth gap in order to maintain a balance.

How Sales and Services Tax (SST) brings social and economic impact compared to Goods
and Services Tax (GST) in Malaysia?
79
Consistencies in communication are important to gain public acceptance on the re-
introduce and implementation of the SST. Issues like leakages and a lack of transparency in
public expenditure should be resolved more enthusiastically in order to build credibility in the
government’s fiscal adjustment plans. For long run purpose, income growth is key to
generate tax revenue and the government should reinvest revenue gains from the SST in
improving the quality of public health services, promoting equal access to education and
bridging the divide of access to information technology.
The government should commit to a 3-year timeline when implementing the SST. The
government should restrict itself from arbitrarily increasing the SST rate within the 3-year
period. This allows for price stability and better consumption planning. Committing to a time
schedule with a review of the SST at the end of the 3-year period increases the credibility of
the government to enforce its deficit-reduction plan. This timeline also serve to avoid
inconsistencies due to myopic political gains or possible changes in the political structure that
may jeopardize public financial health over the long run.
Lastly and of utmost importance, if the government intends to expand the tax base and
increase the efficiency of tax collection through the use of a SST, it will bring the majority of
the population within the tax base. Therefore, all citizens in Malaysia become stakeholders in
the budget and the government must begin to display strong political will to cut wastages and
corruption. Prudent spending and transparent accounting will go a long way in winning over
public acceptance of the SST. A common trait associated with an efficient SST system is
improved international competitiveness. This is in line and a goal which Malaysia aims
toward in becoming a high-income nation by 2020.

How Sales and Services Tax (SST) brings social and economic impact compared to Goods
and Services Tax (GST) in Malaysia?
80
5.3 PERSONAL REFLECTIONS
“Learn by doing” – Lewis and William
To determine the best practices in experiential learning, it is necessary to first define
experiential learning. According to Lewis and Williams, they mentioned that “In its simplest
form experiential learning means learning from experience or learning by doing.
Experiential education first immerses learners in an experience and then encourages
reflection about the experience to develop new skills, new attitudes, or new ways of
thinking.”(Lewis and Williams, 1994). The first theories arose to move away from the
traditional formal education, where teachers simply presented students with concepts.
Students would “learn by doing”, by applying the knowledge to experience in order to
develop skills and new ways of thinking (Lewis and Williams, 1994).
Reflecting on the experience of this dissertation, it is realized that I am reflecting on a
journey, my personal journey into the world of taxation. Like any journey, some of the most
memorable experiences come from side trips that take us out of our comfort zones, changing
us forever. Concerning the process of the dissertation, it should be noted that in overall was
very exciting. Generally, I liked learning about the taxation in the world, as I find this
specific subject an ongoing challenge for Malaysia in this new era of changes and taxpayer
behaviors. All the articles and information that I read around the topic, was of great value and
aligned with today’s “trend”.
I liked the independent study as it had more tasks to fulfill and demanded my
academic view. While reflecting on the experience of writing a dissertation, I came to the
realization that I truly enjoyed this process, at least most of it. I am the type of person who
loves to learn and always seeks to obtain more knowledge in and out of the boring classroom.
I am especially passionate about learning things that pertain to my major and my future
career in the taxation sector. I spent many hours on doing this research, but through it I
learned that, if I set goals, I can achieve anything. I learned that I can achieve more than often
I think I can, so just push myself.
Concerning this reflection, I would like to state that Mr. Andrew Quinn feedback and
guidance, upon my project was sufficient enough to point out clearly which parts of my
dissertation where adequate and which not. I can now look back and realize that this
experience has helped me both as a student and as a young professional.
How Sales and Services Tax (SST) brings social and economic impact compared to Goods
and Services Tax (GST) in Malaysia?
81
Research and writing skills are not only valued in an academic setting, but also in
consultants and taxation sector as well. I now feel much more confident in my writing
abilities and research skills. Overall, I feel that this has been both a valuable and enjoyable
experience and I now feel prepared and excited for my upcoming career years.
5.4 SUGGESTIONS FOR FURTHER RESEARCH
In relevance with the limitation of this research project which were presented in Chapter 3,
suggestions for further research include the following points:
1. Sample of the study was limited. Future studies can conduct with a larger sample or in a
specific group of people in Malaysia.
3. Dissertation was based only in 3 states in Malaysia. Future projects can conduct and carry
out and include more states in Malaysia.
4. Only quantitative research approaches used in this research. Qualitative research
approaches such as personal interviews can introduce and conduct for measurement of
discussed issues.

How Sales and Services Tax (SST) brings social and economic impact compared to Goods
and Services Tax (GST) in Malaysia?
82
REFERENCES
1. Ajzen, I. (1991) ‘The theory of planned behavior’, in Organizational Behavior and
Human Decision Processes, pp. 179–211.
2. Alavi, M. and Carlson, P. (1992) ‘A Review of MIS Research and Disciplinary
Development’, Journal of Management Information Systems, 8(4), pp. 45–62. doi:
10.1080/07421222.1992.11517938.
3. Anthony Kerr (2018) The Resurrection Of Sales And Service Tax - Tax - Malaysia.
Available at:
http://www.mondaq.com/x/730314/sales+taxes+VAT+GST/The+Resurrection+Of+S
ales+And+Service+Tax (Accessed: 8 March 2019).
4. Benk, S., Cakmak, A. F. and Budak, T. (2011) ‘An investigation of Tax Compliance
Intention: A theory of Planned Behaviour Approach’, (28).
5. Bobek, D. D., Roberts, R. W. and Sweeney, J. T. (2007) ‘The Social Norms of Tax
Compliance: Evidence from Australia, Singapore and the United States’, Journal of
Business Ethics, 74, pp. 49–64. Available at:
https://www.researchgate.net/publication/5149010_The_Social_Norms_of_Tax_Com
pliance_Evidence_from_Australia_Singapore_and_the_United_States.
6. Chidi Rafael (2016) UNDERSTANDING THE RESEARCH ONION: AN
ILLUSTRATION. Available at: https://nairaproject.com/blog/understanding-the-
research-onion-methodology.html (Accessed: 18 August 2019).
7. ‘Deductive Approach (Deductive Reasoning)’ (no date) Research-Methodology.
Available at: https://research-methodology.net/research-methodology/research-
approach/deductive-approach-2/ (Accessed: 8 March 2019).
8. DeFranzo, S. E. (2011) What’s the difference between qualitative and quantitative
research ?, Snap Surveys.

How Sales and Services Tax (SST) brings social and economic impact compared to Goods
and Services Tax (GST) in Malaysia?
83
9. Dr. Choong Kwai Fatt (2018) ‘GST vs SST. Which is better?’, The Star Onlline,
August. Available at: https://www.thestar.com.my/news/nation/2018/08/12/gst-vs-sst-
which-is-better.
10. EY (2018) ‘Sales Tax and Service Tax 2018 Managing the transition’, p. 8.
11. Financial literacy for youth: Malaysia (2019) ‘A brief comparison between GST and
SST’, FLY Malaysia, 22 March. Available at: https://www.flymalaysia.org/a-brief-
comparison-between-gst-and-sst/ (Accessed: 19 August 2019).
12. Fisher. C, Wartick. M and Mark. M (1992) ‘Detection propability and taxpayer
compliance: A review of the literature’, Journal of Accounting Literature, pp. 1–46.
13. Gary S.Becker (1968) ‘Crime and Punishment: An Economic Approach’, The Journal
of Political Economy, 76, pp. 169–217.
14. Hayley (2019) ‘The research onion for beginners’, Lifeasabutterfly, 19 January.
Available at: https://www.lifeasabutterfly.com/research-onion-beginners/ (Accessed:
18 August 2019).
15. ‘Inductive Approach (Inductive Reasoning)’ (no date) Research-Methodology.
Available at: https://research-methodology.net/research-methodology/research-
approach/inductive-approach-2/ (Accessed: 8 March 2019).
16. ‘Interpretivism (interpretivist) Research Philosophy’ (no date) Research-
Methodology. Available at: https://research-methodology.net/research-
philosophy/interpretivism/ (Accessed: 7 March 2019).
17. Jackson. B and Milliron. V (1986) ‘Tax Compliance Research: findings, problem and
prospects.’, Journal of Accounting Literature, pp. 125–165.
18. Jamie Chee (2018) Malaysia introduces Sales and Service Tax (SST): What you need
to know. Available at: /en/news-insights/articles/2018/december/malaysia-introduces-
sst/ (Accessed: 1 March 2019).
19. Lancaster, G. (2012) Research Methods in Management.
20. Lewis, L. H. and Williams, C. J. (1994) Experientia learning: Past and present.

How Sales and Services Tax (SST) brings social and economic impact compared to Goods
and Services Tax (GST) in Malaysia?
84
21. Modh Salleh, M. C., Ainon Yussof, S. and Irwani Abdulla, N. (2018) ‘Impact of
Goverment Service Tax (GST) on Malaysian Takaful Industry: Issues and
Challenges’, International Journal of Engineering & Technology, 7, pp. 368–373.
Available at:
https://www.researchgate.net/publication/326725562_Impact_of_Government_Servic
e_Tax_GST_on_Malaysian_Takaful_Industry_Issues_and_Challenges.
22. Mohd Rozlan Mohamed Ali (2015) ‘Overview of GST’, Persatuan Akauntan
Percukaian Malaysia.
23. Mukhopadhyay, S. (2005) The Economics of Value Added Tax: (theory & practice).
Centax Publication.
24. Nathan, P. (2018) ‘Malaysia: SST vs GST - A comparison’, IBFD. Available at:
https://www.ibfd.org/sites/ibfd.org/files/content/pdf/tns_2018-09-04_my_1.pdf.
25. Nisya Aziz (2019) SST vs GST: Here Are 5 Things That You Need to Know, |
Loanstreet. Available at: https://loanstreet.com.my/learning-centre/sst-vs-gst
(Accessed: 19 August 2019).
26. OECD (2019) Prices - Inflation (CPI) - OECD Data, theOECD. Available at:
http://data.oecd.org/price/inflation-cpi.htm (Accessed: 16 July 2019).
27. PAGERO (2018) ‘Malaysia introduces new tax regime’, Pagero, 21 September.
Available at: https://www.pagero.com/news/malaysia-introduces-new-tax-regime/
(Accessed: 8 March 2019).
28. ‘Positivism’ (2016) Philosophy Terms, 31 August. Available at:
https://philosophyterms.com/positivism/ (Accessed: 7 March 2019).
29. Positivism - Research Methodology (no date). Available at: https://research-
methodology.net/research-philosophy/positivism/ (Accessed: 7 March 2019).
30. ‘PROPOSED GOODS EXEMPTED FROM SALES TAX 16072018 btm.pdf’ (no
date). Available at:
http://gst.customs.gov.my/en/SiteAssets/doc/PROPOSED%20GOODS%20EXEMPT

How Sales and Services Tax (SST) brings social and economic impact compared to Goods
and Services Tax (GST) in Malaysia?
85
ED%20FROM%20SALES%20TAX%2016072018%20btm.pdf (Accessed: 8 March
2019).
31. Ragab, M. A. and Arisha, A. (2017) ‘Research Methodology in Business: A Starter’s
Guide’, Management and Organizational Studies, 5(1), p. 1. doi:
10.5430/mos.v5n1p1.
32. Sanusi, S., Omar, N. and Sanusi, Z. M. (2015) ‘Goods and Services Tax (GST)
Governance in the Malaysian New Tax Environment’, Procedia Economics and
Finance, 31, pp. 373–379. doi: 10.1016/S2212-5671(15)01212-5.
33. Singh, S. (2018) Sampling Techniques, Towards Data Science. Available at:
https://towardsdatascience.com/sampling-techniques-a4e34111d808 (Accessed: 9
April 2019).
34. Soong, B. (2018) ‘Differences between Good & Service Tax (GST) & Sales &
Service Tax (SST)’, Biztory, 23 August. Available at:
https://www.biztory.com.my/sst-gst-2-differences-2/ (Accessed: 18 August 2019).
35. Statistics Times (2019) World GDP Ranking 2019 - StatisticsTimes.com. Available at:
http://statisticstimes.com/economy/projected-world-gdp-ranking.php (Accessed: 16
July 2019).
36. Syed A. Basher (2008) ‘Is there really a unit root in the inflation rate? More evidence
from panel data models’, 15,2008(3), pp. 161–164.
37. The Straits Time (2018) Malaysia to impose 5-10% tax on goods, 6% on services, The
Straits Times. Available at: https://www.straitstimes.com/asia/se-asia/malaysia-to-
impose-5-to-10-per-cent-tax-on-goods-6-per-cent-on-services (Accessed: 1 March
2019).
38. The World Bank (2019) The World Bank. Available at:
https://data.worldbank.org/country/malaysia (Accessed: 2 March 2019).
39. Trading Economics (2019a) Inflation Rate - Countries - List, Trading Economics.
Available at: https://tradingeconomics.com/country-list/inflation-rate (Accessed: 16
July 2019).

How Sales and Services Tax (SST) brings social and economic impact compared to Goods
and Services Tax (GST) in Malaysia?
86
40. Trading Economics (2019b) Malaysia Government Revenues | 2019 | Data | Chart |
Calendar | Forecast, Trading Economics. Available at:
https://tradingeconomics.com/malaysia/government-revenues (Accessed: 22 August
2019).
41. treasury.gov.my (no date) ‘List of Countries Implemening VAT/GST’.
42. Vijay Velkar (2010) ‘A well-designed GST can boost GDP growth by 2%’, Money
Today. Available at: https://www.businesstoday.in/moneytoday/expert-view/a-
welldesigned-gst-can-boost-gdp-growth-by-2percent/story/8474.html (Accessed: 2
March 2019).
43. Viren, M. and Kilponen, J. (2008) ‘Why do growth rates differ? Evidence from Cross-
Country data on private sector production’, Bank of Finland Research Discussion
Paper, (13/2008).
44. Wayne W. LaMorte, W. (2018) The Theory of Planned Behavior, Boston University
School of Public Health. Available at: http://sphweb.bumc.bu.edu/otlt/MPH-
Modules/SB/BehavioralChangeTheories/BehavioralChangeTheories3.html
(Accessed: 9 April 2019).
45. Yvonne Beh and Tan Yi Lyn (2018) INSIGHT: Malaysian Sales Tax and Service Tax
Make a Comeback. Available at: https%3A%2F%2Fwww.bna.com%2Finsight-
malaysian-sales-n73014483162%2F (Accessed: 8 March 2019).

How Sales and Services Tax (SST) brings social and economic impact compared to Goods
and Services Tax (GST) in Malaysia?
87
APPENDIX
COVER LETTER FOR QUESTIONNAIRE

How Sales and Services Tax (SST) brings social and economic impact compared to Goods
and Services Tax (GST) in Malaysia?
88
Angeline Sing Yee Lim
Dublin Business School
No. student: 10354941
Mobile: 083 8260198
Dear Sir/Madam,
I am a postgraduate student in Dublin Business School in International Accounting and
Finance and currently I am doing a research for my dissertation.
The topic of my dissertation is:
“How Sales and Services Tax (SST) brings social and economic impact compared to
Goods and Services Tax (GST) in Malaysia?”
I would very appreciate your help in participating in this questionnaire which would take
approximately 10-15 minutes.
This study looks at some common variables in the study of economic and taxation. The
survey has been designed to provide information for my Master dissertation. All research
conducted by DBS students is done for the purpose of meeting course requirement.
Please help me by answering these questions. Questionnaire will be attached in the email.
Please say what you really think and try to be integrity and accurate as possible.
You may decide to stop being a part of the research study at any time without explanation
required from you. You have the right to ask that any data you have supplied to that point be
withdrawn / destroyed.
You have the right to omit or refuse to answer or respond to any question that is asked of
you. You have the right to have your questions about the procedures answered (unless
answering these questions would interfere with the study’s outcome. A full de-briefing will

How Sales and Services Tax (SST) brings social and economic impact compared to Goods
and Services Tax (GST) in Malaysia?
89
be given after the study). If you have any questions as a result of reading this information
sheet, you should ask the researcher before the study begins.
All responses will be treated with the strictest sensitivity and are anonymous. The data I
collect does not contain any personal information about you except for gender.
Thank you for your cooperation.
If you would require any further information regarding to this study, please free to contact me
or my tutor.
Lecturer: Andrew Quinn
DBS School of Business
Dublin Business School
13/14 Aungier Street
Dublin 2.
Tel: +353 (01) 4178731
Kind regards,
Angeline

How Sales and Services Tax (SST) brings social and economic impact compared to Goods
and Services Tax (GST) in Malaysia?
90
MASTER IN SCIENCE IN INTERNATIONAL ACCOUNTING AND
FINANCE
MASTER DISSERTATION
TITLE OF TOPIC:
HOW SALES AND SERVICES TAX (SST) BRINGS SOCIAL AND
ECONOMIC IMPACT COMPARED TO GOODS AND SERVICES TAX
(GST) IN MALAYSIA?
Survey Questionnaire
Dear participant, My name is Angeline Lim. I am a student at Dublin Business School. As
part of a Master’s dissertation, I am gathering data on Sales and Services Tax. Your
DUBLIN BUSINESS SCHOOL
School of Art and Business

How Sales and Services Tax (SST) brings social and economic impact compared to Goods
and Services Tax (GST) in Malaysia?
91
participation in this questionnaire survey is very important to the success of this master’s
dissertation. regarding your experience. All responses will be kept confidential.
Filling out the complete survey should only take approximately 10-15 minutes. There are
three sections:
Section A: Personal Information
Please select one by using a tick for the choice best describing your position on each
question.
1. Which business Sector/ industry are you currently work for?
Media and Telecommunications
Food and Beverages
Advertising and Public Relations
Financial Services and Banking
Pharmaceutical
Industrial Production
Retail and Consumer
Transportation and Logistic
Other:
2. Please indicate your current classification.
Self-employed / Businessman
Employee
Management
Other

How Sales and Services Tax (SST) brings social and economic impact compared to Goods
and Services Tax (GST) in Malaysia?
92
3. Which of these titles best describe your role in the organization?
CEO/ Director
Senior Management
Supervisor
Workforce
Accountant/Tax consultant
Other:
4. How long have you worked in the industry?
0-5 Years
6-10 Years
11-15 Years
16-20 Years
21-30 Years
More than 30 Years
5. What is your education?
Doctoral Degree
Master’s Degree
Bachelor’s Degree
Diploma/Certificate
High School Graduate
Other:
6. What is your income for the year after tax?

How Sales and Services Tax (SST) brings social and economic impact compared to Goods
and Services Tax (GST) in Malaysia?
93
Below RM29,999
RM30,000- RM59,999
RM60,000- RM89,999
RM90,000- RM119,999
RM120,000- RM149,999
RM150,000 and above
Section B: Implementation of Sales and Services Tax
Please select one by using drawing a circle around the choice best describing your position on
each question.
7. Do you know what is Sales and Services Tax (SST)?
A. Yes.
B. No.
C. Neutral
D. Don’t know
8. Do you know when Sales and Services Tax (SST) was implemented to replace Goods and
Services Tax (GST)?
A. Yes.
B. No.
C. Neutral
D. Don’t know
9. Do you think the Sales and Services Tax (SST) is a fair and just tax?
A. Yes.
B. No.

How Sales and Services Tax (SST) brings social and economic impact compared to Goods
and Services Tax (GST) in Malaysia?
94
C. Neutral
D. Don’t know
10. Do you think the current rates of Sales and Services Tax (SST) – 0%, 5%, 6% and 10%
are fair?
A. Yes.
B. No.
C. Neutral
D. Don’t know
11. Do you live in a country with Sales and Services Tax (SST)?
A. Yes.
B. No.
C. Neutral
D. Don’t know
12. Do you expect the introduction of Sales and Services Tax (SST) to be revenue neutral, ie.
That the government will no generate additional tax revenue.
A. Yes.
B. No.
C. Neutral
D. Don’t know
13. Do you believe there is a fundamental structural problem in tax system?
A. Yes.
B. No.

How Sales and Services Tax (SST) brings social and economic impact compared to Goods
and Services Tax (GST) in Malaysia?
95
C. Neutral
D. Don’t know
14. If you agree with Question 13, which of the following is the major cause of structural
problem?
A. Tax base is too narrow
B. Public expenditure is too high
C. Both of the above
D. Other suggestion
15. Is it necessary to introduce a new tax system to solve the problem?
A. Yes.
B. No.
C. Neutral
D. Don’t know
16. If SST is set at only 5% and 10%, what will the impact on Malaysia economy?
A. Favorable
B. Neutral
C. Unfavorable
17. What do you expect the tax rate to be in 5 years times?
A. Higher
B. Unchanged
C. Lower
D. Don’t know

How Sales and Services Tax (SST) brings social and economic impact compared to Goods
and Services Tax (GST) in Malaysia?
96
18. Do you agree with the implementation of the SST? Please provide reason.
19. If you agree, what SST tax rate do you think is appropriate?
A. 0%
B. 2%
C. 5%
D. 6%
E. 10%
F. 20%
20. Any other comment:
These and all response will be kept confidential. However, if you feel uncomfortable to
answer these questions, you don’t have to. Please use the space below to write additional
comment about your view in organizational changes or business transformation. For example,
major problems or issues in your department and suggest some possible improvement. You
comment will be typed and edited to protect your identity.
**We extend our heartiest thanks for sparing your valuable time in responding to this
questionnaire.**

How Sales and Services Tax (SST) brings social and economic impact compared to Goods
and Services Tax (GST) in Malaysia?
97
INFORMED CONSENT FORM
Project Title: How Sales and Services Tax (SST) brings social and economic impact
compared to Goods and Services Tax (GST) in Malaysia?
Project Summary:
Sales and Services Tax (SST) introduced and implemented in September 2018, which
replaced the old Goods and Services Tax (GST). Government has the reasons to switch from
Goods and Services Tax (GST) to Sales and Services Tax (SST) and the tax payers have their
concerns in the implementation of the Sales and Services Tax (SST).
The research helps:
1. To understand SST implemented by Malaysian Government and its effect on the economy.
2. To analyse the view of tax payers and accountants towards SST.
3. To examine the role of Sales and Services Tax (SST) in achieving suitable economic
growth.
4. To understand the attitudes of businessman and tax payer after the implementation of SST.
This study looks at some common variables in the study of economic and taxation. The
survey has been designed to provide information for my Master dissertation. All research
conducted by DBS students is done for the purpose of meeting course requirement.
By signing below, you are agreeing that:
(1) you have read and understood the Participant Information Sheet,
(2) questions about your participation in this study have been answered satisfactorily,
(3) you are aware of the potential risks (if any), and
(4) you are taking part in this research study voluntarily (without coercion).

How Sales and Services Tax (SST) brings social and economic impact compared to Goods
and Services Tax (GST) in Malaysia?
98
Participant’s Signature
Participant’s Name:
Angeline Lim
Student Name Signature
Student Name: Angeline Sing Yee Lim
Date: 10 July 2019
School of Art and Busines

How Sales and Services Tax (SST) brings social and economic impact compared to Goods and Services Tax (GST) in Malaysia?
99
![A Dimensions: [mm] B Recommended land pattern: [mm] · 2020. 8. 11. · 2014-03-11 2013-12-19 2013-12-04 2013-04-10 2013-03-06 2013-02-14 2012-12-10 DATE SSt SSt SSt SSt SSt SSt SSt](https://img.pdfslide.us/doc/110x75/6145e75a8f9ff812541fec6f/a-dimensions-mm-b-recommended-land-pattern-mm-2020-8-11-2014-03-11-2013-12-19.jpg)


![A Dimensions: [mm] B Recommended land pattern: [mm] D ... · 2013-03-12 2013-01-13 2012-12-10 2012-10-29 2012-08-27 2006-05-05 DATE SSt SSt SSt SSt SSt SSt SSt BY SSt COt COt SSt](https://img.pdfslide.us/doc/110x75/604b228bc93c005c75431c51/a-dimensions-mm-b-recommended-land-pattern-mm-d-2013-03-12-2013-01-13.jpg)


![A Dimensions: [mm] B Recommended land pattern: [mm] D ...2012-12-06 2012-10-24 2012-08-08 2012-06-28 2012-03-12 DATE SSt SSt SSt SSt SSt SSt BY SSt SSt BD BD SSt DDe CHECKED Würth](https://img.pdfslide.us/doc/110x75/60f984e176666848374d15c0/a-dimensions-mm-b-recommended-land-pattern-mm-d-2012-12-06-2012-10-24.jpg)