Embed Size (px)
Citation preview

How Rigid is the Wealth Structure and Why?
Inter‐ and Multigenerational Associations in Family Wealth
Fabian T. Pfeffer
University of Michigan
Alexandra Killewald
Harvard University
Population Studies Center Research Report 15‐845
September 2015
This work has been supported in part by an award from the Russell Sage Foundation and the W.K. Kellogg Foundation. The collection of data used in this study was partly supported by the National Institutes of Health under grant number R01 HD069609 and the National Science Foundation under award number 1157698. Any opinions expressed are those of the authors alone and should not be construed as representing the opinions of the funding agencies. We thank Andreja Siliunas for excellent research assistance. We thank Trina Shanks and Pablo Mitnik for helpful comments on an earlier version. Please direct all correspondence to Fabian T. Pfeffer, University of Michigan, 426 Thompson Street, 3240 Institute for Social Research, Ann Arbor, Michigan 48104, [email protected].

How Rigid is the Wealth Structure and Why? 2
ABSTRACT
Inequality in family wealth is high and rising. Yet we know little about how much and how wealth inequality is maintained across generations, in particular compared to the vast literatures on intergenerational rigidity in the income or class structure. Using data from the Panel Study of Income Dynamics that span nearly half a century, we provide reliable estimates of two- and three-generational associations in family wealth, assess black-white differences in the transmission of wealth, and uncover the relative importance of different channels through which wealth inequality is reproduced across generations. Our results indicate a considerable degree of intergenerational wealth transmission across not only two but three generations, particularly high rigidity at the top of the wealth distribution, and a stark disadvantage of African-American households through their disproportional and repeated relegation to the bottom of the wealth distribution. We also show that wealth transmission occurs early in life, namely through the provision of educational advantage, while bequests and inter-vivos transfers – the focus of most prior research – play a smaller role. The intergenerational rigidity of wealth that we reveal here raises concerns about the distribution of opportunity among future generations, especially in the context of continued stratification of the wealth distribution.

How Rigid is the Wealth Structure and Why? 3
INTRODUCTION
Inequality in U.S. family wealth is high and increasing (Pfeffer et al. 2013; Piketty 2014;
Wolff 2014), which raises concerns about whether the greatly unequal distribution of wealth
between families is also bound to be maintained across generations (Conley 1999; Oliver and
Shapiro 1995). Of course, both sociologists and economists have long been interested in the
transmission of socio-economic advantage across generations (Becker and Tomes 1979; Blau
and Duncan 1967). However, wealth has rarely been considered in this perspective, although it is
an important and distinct dimension of economic success (Spilerman 2000). Instead, the study of
intergenerational persistence is still chiefly concentrated on income and occupations (Torche
2015). Furthermore, the vast majority of research on the intergenerational reproduction of
inequality is focused on two-generational associations. While examining parent-child
associations is meaningful, given that parents are likely to be the primary investors in their
children’s future, this approach imposes a narrow conception of family relations and
intergenerational ties. We expand beyond the parent-child relationship and consider the
persistence of wealth across three generations: grandparents and their adult grandchildren. It has
been hypothesized that multigenerational associations should be particularly strong for wealth
compared to other markers of socio-economic attainment (Mare 2011; Pfeffer 2014). If so, three-
generational associations in U.S. family wealth, which have never been studied before, may
reflect additional rigidities in the distribution of socio-economic advantage that the few existing
two-generational studies fail to capture.
Studies of intergenerational correlations (especially in occupational standing) have also long
paid attention to the channels of intergenerational status transmission, with education a key
mediator of interest. We hypothesize that education is likely to also be an important mediator of
the intergenerational transmission of wealth, given the role of parental wealth in facilitating
access to and attainment of higher education (Conley 2001a) and the advantage of those with
higher education in accumulating assets (Conley 2001b; Keister 2003). However, in the case of
wealth, unlike education or earnings, there is also an obvious direct mechanism for the
propagation of inequality across generations: wealth can be directly transferred across

How Rigid is the Wealth Structure and Why? 4
generations through bequests and inter-vivos transfers (Kotlikoff and Summers 1981; Kohli
2004). The direct transmissibility of wealth from one generation to the next may mean that we
observe the same money as wealth in multiple generations. We document descriptively how the
estimated inter- and multigenerational transmission of wealth changes when we account for these
two channels of transmission: education and inheritance. We do not attempt to make causal
claims about the role of each factor in mediating intergenerational wealth rigidity, but identify
these two characteristics as important correlates of both (grand)parental and child wealth to help
direct the search for further explanations of rigidity in the wealth structure.
In addition to these contributions – taking a multigenerational perspective and investigating
channels of transmission – our analyses substantially improve and expand the few prior estimates
of two-generational correlations in wealth. Existing evidence on intergenerational rigidity in the
U.S. wealth distribution comes from a small number of studies, which, like ours, use data from
the Panel Study of Income Dynamics (PSID) but, unlike ours, were only able to examine the
wealth outcomes of younger adults (Charles and Hurst 2003; Conley and Glauber 2008;
Mulligan 1997). This limitation was imposed by data restrictions at the time of analysis and
already acknowledged in that research, suggesting that it would be more appropriate to measure
wealth at later ages when adults have had more time to accumulate assets (Charles and Hurst
2003: fn.5; Conley and Glauber 2008: p. 10). We hypothesize that adults’ wealth will more
closely resemble that of their parents as both generations enter middle and late adulthood, aging
out of the period of intensive investments in young adulthood and increasingly accumulating
assets. Drawing on newly available data from the PSID, we update estimates of intergenerational
wealth correlations and test whether intergenerational wealth transmission indeed strengthens
from early through late adulthood.
Additionally, we examine the contours of the intergenerational reproduction of wealth. We
hypothesize that wealth positions at the top and bottom of the distribution may be particularly
sticky, with very wealthy parents able to secure a substantial wealth advantage for their children,
and parents who live in debt especially likely to have adult children who are also net debtors.
When the intergenerational transmission of wealth is measured with a single parameter, such as

How Rigid is the Wealth Structure and Why? 5
an intergenerational elasticity, this variability is lost. Evaluating the persistence of the highest
levels of wealth across generations also speaks to concerns about a wealthy elite that wields
dynastic financial power.
We also consider the possibility that rigidity in the wealth structure differs by race. The race
gap in wealth is vast (Kochhar, Fry, and Taylor 2011; Oliver and Shapiro 1995), and prior
research has debated the extent to which current racial wealth disparities can be explained by
differences in parental wealth (Conley 1999, 2001b; Killewald 2013). But little attention has
been given to the fact that current racial gaps in wealth will depend on the strength of the
intergenerational transmission of wealth and its variation by race. In other words, the capacity for
African-Americans today to overcome the wealth disadvantage of prior generations depends
intimately on the extent to which the wealth outcomes of adults are determined by the
circumstances of their ancestors. We test for variation by race in the intergenerational
transmission of wealth and further explore whether African-Americans are at higher risk than
whites for downward wealth mobility. If so, this suggests that African-Americans are
disadvantaged not only by their lower starting wealth positions but also by constraints in their
ability to transmit and maintain wealth positions across generations.
Together, our analyses offer a rich description of the intergenerational persistence of wealth
across two and three generations, how these patterns differ across the wealth distribution and by
subgroup, and to what extent education and inheritance can account for these intergenerational
associations. Our analyses mitigate the great imbalance of a large literature focused on the
description of two-generational correlations in other dimensions of socio-economic standing,
mostly occupational classes or income.
Drawing on the concept of “linked lives” from the life course perspective (Elder 1994), we
also recognize that wealth accumulation takes place in the context of family relationships across
the life span. The dearth of evidence on wealth and multigenerational associations is increasingly
problematic in the context of demographic shifts in the U.S.: declines in fertility limit the number
of offspring in which parents and grandparents invest; increased longevity prolongs the contact
between older and younger generations; and declines in time spent married increases the

How Rigid is the Wealth Structure and Why? 6
importance of extended family networks, including grandparent-grandchild ties (Bengston 2001;
Swartz 2009). In her review of the literature on intergenerational relationships in adulthood,
Swartz (2009) writes: “Attention to intergenerational adult family relationships should be viewed
as a key contribution to the larger efforts of sociologists and family scholars to expand both
scholarly and popular conceptions of the family beyond those of the traditional nuclear model”
(p. 207). We respond to this charge in part by considering the potential for generation-skipping
investments by grandparents in their grandchildren. At the same time, we respond to Mare’s
(2011) caution that two-generation models “have a strong mid-twentieth century American
middle- and working-class bias” (p. 20) and to his call for greater attention to multigenerational
processes. Thus, our examination of the extent of two- and three-generation persistence in wealth
is at the intersection of emerging research areas in both social stratification and family sociology.
THEORETICAL MOTIVATION AND PRIOR WORK
Compared to income and earnings, wealth in the United States is substantially more
unequally distributed (Keister and Moller 2000). Access to wealth is in turn associated with a
wide range of outcomes, including longevity, family formation, and the educational achievement
of offspring (Belley and Lochner 2007; Bond Huie et al. 2003; Charles, Hurst, and Killewald
2013; Conley 1999, 2001a; Haveman and Wilson 2007; Morgan and Kim 2006; Orr 2003;
Pfeffer 2011; Schneider 2011). Furthermore, these associations are not fully explained by
standard measures of socioeconomic advantage, such as income, education, and occupation. The
wealth distribution is thus an important and distinct measure of the concentration of social
inequality and advantage.
Wealth can be passed directly to subsequent generations through bequests or inter-vivos
transfers, such as assistance with the down payment on a first home (Charles and Hurst 2002).
Family wealth can also be used to facilitate wealth-generating investments of the next
generation, most notably post-secondary education (Conley 2001a; Pfeffer 2011). Thus, wealth
plays a central role in the reproduction of inequality across generations, and this reproduction is a
manifestation of the life-course concept of “linked lives,” which conceptualizes individuals as

How Rigid is the Wealth Structure and Why? 7
embedded in family (and other) relationships that facilitate exchange and generational succession
(Elder 1994).
Prior estimates of two-generational wealth correlations and potential life-cycle bias
While a large literature in economics and sociology has investigated intergenerational
associations in income, occupations, and education (Blau and Duncan 1968; Hertz et al. 2007;
Long and Ferrie 2013; Pfeffer 2008; Rosenfeld 1978; Solon 1999), our knowledge of how
similar the wealth of parents is to the wealth of their offspring relies on very few studies. In part
because of data limitations, the three most comprehensive evaluations of intergenerational wealth
mobility have relied on wealth outcomes for the second generation at relatively young ages.
Mulligan (1997) measures both parent and child wealth in 1984 and 1989, averaging if possible,
for children at most age 38 in 1989. Charles and Hurst (2003) estimate the correlation between
children’s wealth in 1999 and parental wealth averaged between 1984 and 1989. In order to
estimate pre-bequest and pre-retirement associations, parents are required to be not yet retired in
1984 and 1989 and surviving in 1999. As a result, the average adult offspring in their sample is
just under 38 years old. Conley and Glauber (2008) measure the wealth of young adults ages 24
to 40 in 1999 to 2003, restricting their sample to young adults whose parents’ wealth was
measured in 1984, when the offspring generation was ages 6 to 21. All three studies estimate an
intergenerational wealth elasticity based on the correlation in logged parent and child wealth.
Charles and Hurst estimate an elasticity of 0.37, while Conley and Glauber estimate a
substantially lower 0.28. Mulligan’s OLS-estimated elasticity falls in between at 0.32, but an
instrumental variables approach designed to correct for attenuation bias produces an estimate of
0.43.1
1 The difference in the estimates may be due to a number of factors, but one prominent difference is the treatment of those with nonpositive net worth. Previous evidence suggests that the association between parental wealth and the wealth of their young adult children is much weaker for offspring who are net debtors (Killewald 2013). Thus, the lower elasticity estimated by Conley and Glauber may be because they bottom‐code wealth for offspring with nonpositive net worth, while both Mulligan and Charles and Hurst excluded this group. We return to this point in our analyses.

How Rigid is the Wealth Structure and Why? 8
To put these estimates in context, Solon (1992) estimates that the intergenerational
correlation in (quasi) permanent income between fathers and sons is 0.41, and subsequent studies
have confirmed this estimate (Chetty et al. 2014; Solon 1999) or found even higher
intergenerational income elasticities (Mazumder 2005; Mitnik et al. 2015). The intergenerational
persistence in years of education in the United States is similar in size (Couch and Dunn 1997;
Hertz et al. 2007), as is the intergenerational persistence of occupational status (Blau and Duncan
1967). Given that wealth is both more unequally distributed than income and education and
easier to transmit directly between generations, it is surprising that prior estimates of the
intergenerational transmission of wealth suggest comparable social reproduction as for other
measures of socioeconomic advantage.
We hypothesize that these prior estimates, based on the accumulated wealth of the second
generation at relatively young ages, may have underestimated the intergenerational persistence of
wealth – a phenomenon referred to as life-cycle bias. Life-cycle bias has been shown to affect
intergenerational earnings correlations, even with controls for parent and child age; correlations
are much higher during middle adulthood than either younger or older adulthood (Mazumder
2015). For wealth, we expect rising intergenerational correlations through pre-retirement late
adulthood, given the continued accumulation of assets, making it even more pressing to evaluate
whether prior studies have underestimated the intergenerational reproduction of wealth by
focusing on younger adults.
In support of the hypothesis of life-cycle bias, using Swedish data, Adermon, Lindahl, and
Waldenström (2015) find that the rank-rank correlation in intergenerational wealth is 50 percent
higher when second-generation wealth is measured at an average age of 47, rather than an
average age of 32. Although previous research on intergenerational wealth transmission in the
U.S. has recognized that later adulthood is preferable for measuring intergenerational wealth
correlations (Charles and Hurst 2003; Conley and Glauber 2008), until recently the PSID had not
been collecting wealth information for long enough to measure both parents’ and offspring’s
wealth at midlife. Using data from the 1984-2013 waves of the PSID, we construct a sample of
parent-child pairs that spans a larger age range in the second generation and test how the
intergenerational transmission of wealth differs across the life course.

How Rigid is the Wealth Structure and Why? 9
Rigidity across the wealth distribution
Recent research focused on historical trends in persistence at the very top of wealth
distribution has documented much higher intergenerational correlations than those based on the
entire population (e.g., Piketty 2014).2 Previous research documents that intergenerational wealth
associations are stronger at higher positions in the parental wealth distribution (Adermon et al.
2015; Hansen 2014; Killewald 2013). We expect that the nonlinearity of this relationship will be
even stronger later in adulthood and following bequests, which are highly skewed (Avery and
Rendall 2002).
However, consistent with previous research on the intergenerational reproduction of poverty
(see Corcoran 1995 for a review), we expect that children born to asset-poor parents may also be
particularly likely to reproduce their parents’ position in the wealth distribution. Research by
Sharkey (2008) demonstrates that, for African-Americans, the intergenerational transmission of
neighborhood context is concentrated at the bottom of the distribution. Given the importance of
assets for homeownership and neighborhood selection, spatial patterns suggest another
mechanism by which the reproduction of wealth may be concentrated at the bottom of the
distribution. This is consistent with the notion of an intergenerational “underclass,” with children
raised by extremely economically, spatially, and socially disadvantaged parents likely to
experience the same deprivations as adults (Wilson 1987).
Using mobility tables, Charles and Hurst (2003) and Conley and Glauber (2008) both find
greater intergenerational reproduction of wealth at the top and bottom of the wealth distribution,
compared to the middle. Using our sample of older adults, we assess differences in the degree of
wealth transmission across the full wealth distribution.
2 Research based on historical register data often shows much higher intergenerational wealth correlations (Clark 2014; Kearl and Pope 1986; Menchik 1979), perhaps due to these studies’ reliance on wealth measures derived from death records that include all bequests and transfers ever received. However, other factors may also account for the high correlation, such as the focus on the top of the wealth distribution (wealth measures in death records are available only for individuals who had significant wealth to bequest) or the restriction to a specific population (e.g., Mormons in Utah) or historical time (this research mostly studies the 18th and 19th centuries).

How Rigid is the Wealth Structure and Why? 10
Transmission differences by race
As hinted above, patterns of intergenerational reproduction may also differ substantially by
race. The black-white race gap in wealth is enormous, much larger than the race gap in income
(Oliver and Shapiro 1995). In 2009, following the Great Recession, the median African-
American household held only 5 percent the net worth of the median white household, compared
to about 10 percent between 1984 and 2004 (Kochhar, Fry, and Taylor 2011). As a result,
concentration in intergenerational reproduction at different points of the wealth distribution is
likely to affect African-Americans and whites differently. If, intergenerational wealth
reproduction is particularly strong at the top of the wealth distribution, this may lead to lower
average intergenerational wealth persistence for African-Americans than whites. Conversely, if
intergenerational correlations in wealth are particularly strong at the bottom, we should observe
higher intergenerational persistence among African-Americans compared to whites.
Furthermore, prior research suggests that African-Americans’ wealth benefits less from their
own demographic traits and income (Altonji and Doraszelski 2005). As a result, parental
investments that facilitate educational attainment and income for offspring may have diminished
power to translate into offspring’s own wealth, lessening the intergenerational transmission of
advantage. This is consistent with evidence that the intergenerational transmission of
socioeconomic status in general (Blau and Duncan 1968), and wealth in particular (Conley and
Glauber 2008), is stronger for whites than for African-Americans. Conley and Glauber (2008) in
particular find that intergenerational reproduction at the top of the wealth distribution is stronger
for white families, while intergenerational persistence at the bottom of the distribution is stronger
for African-American families. Thus, African-American offspring are disadvantaged in wealth
not only because they begin with lower average levels of parental wealth, but because,
conditional on parental wealth, they are more likely to remain at the bottom of the wealth
distribution and less likely to be able to retain a place at the top.
We include separate estimates of intergenerational transmission of wealth by race to test
whether the lower intergenerational reproduction of wealth found by Conley and Glauber
remains when offspring are considered beyond the young adulthood range. In addition, we assess
whether race differences in wealth reproduction arise from the different parental wealth
distributions of African-American and white offspring.

How Rigid is the Wealth Structure and Why? 11
Multigenerational associations in wealth
Understanding how wealth is passed down through family lineages requires understanding
which ancestors’ wealth contributes to an individual’s current wealth position. We propose that
the intergenerational transmission of wealth may frequently occur across three generations.
Previous studies that have estimated two-generational associations in wealth privilege the notion
of investments and direct transfers from parents to children. While, in most cases, parents are
likely to make the biggest investments in children’s future, assuming that the transmission of
resources between family members occurs only from parents to children is an overly restrictive
view of family support networks. For example, Hall and Crowder (2011) argue that individuals
may benefit from the wealth of their extended family, including parents, grandparents, siblings,
aunts and uncles, cousins, and so on. They find that average wealth in an individual’s extended
family facilitates the transition to homeownership, net of individuals’ own wealth. However,
based on these analyses, it is unclear how much of this association is due purely to parental
wealth, rather than other members of the extended family network.
Our analyses focus on lineage correlations between parents and children and between
grandparents and grandchildren. Since the similarity in the socio-economic position of parents
and children is typically viewed as a measure of a societies’ level of social fluidity or rigidity, the
similarity in the wealth position between grandparents and their grandchildren provides an
indication of longer-term rigidities in the wealth structure: the more rigid the wealth structure,
the longer we should be able to track the imprint of the wealth of prior generations.
Grandparents may contribute to investments made in early adulthood, such as post-
secondary education, purchase of a first home, and weddings, or they may bequest wealth
directly to their grandchildren. Increasing life expectancy and decreasing fertility rates imply that
wealth transfers now occur at later ages and among fewer recipients and may often skip one
generation. The potential for “generation-skipping” wealth is one reason to expect associations in
wealth between the grandparent and the grandchild generation even conditional on the wealth of
the parent generation (Mare 2011).

How Rigid is the Wealth Structure and Why? 12
Our interest in three-generational wealth associations is supported by the fact that
grandparents are often heavily involved in children’s lives. About 10 percent of American
children live with at least one grandparent (U.S. Census Bureau 2015), and about one quarter of
children under age 5 are in a regular childcare arrangement with a grandparent as caregiver
(Laughlin 2013). As American families diversify, it becomes increasingly problematic to assume
that all relevant intergenerational wealth transmission can be captured by the parent-child dyad.
By analyzing three generations, we contribute to a young but rapidly growing field of
research that seeks to expand the study of intergenerational mobility to multiple generations.
Recent research has observed three-generational influence of education, family income, and
occupation (Jaeger 2012; Wightman and Danziger 2014; Chan and Boliver 2013; Hertel and
Groh-Samberg 2014). Multigenerational effects have been hypothesized to be even more
pronounced for wealth (Mare 2011; Pfeffer 2014). Recent contributions suggest that
grandparental wealth may play a major role in the multigenerational transmission of advantage,
even in comparatively egalitarian Sweden (Adermon et al. 2015; Hällsten 2014). We present the
first estimates of the multigenerational role of wealth in the United States.
Channels of intergenerational wealth transmission
Finally, we describe how the intergenerational correlation in wealth changes when we adjust
for possible mechanisms underlying this association. Prior research finds little role for genetic
endowments in the intergenerational transmission of wealth (Black et al. 2015) and therefore
ascribes it mostly to environmental factors. Those may either be direct monetary transfers from
grandparents and parents to offspring or indirect investments by grandparents and parents in
asset-generating attributes of offspring. We consider two channels in detail: bequests and
education.
Bequests and transfers are extremely unequally distributed and have been estimated to
account for somewhere between 40 and 80 percent of aggregate net worth (Gale and Scholz
1994; Piketty 2014). Using Swedish data, Adermon et al. (2015) find that inheritance can

How Rigid is the Wealth Structure and Why? 13
(descriptively) explain the majority of the intergenerational correlation in wealth. Bequests are
thus a likely mechanism by which rigidity in the wealth structure is maintained. They also occur
relatively later in life. This implies a likely downward bias in prior estimates of the
intergenerational wealth correlation because correlations are estimated before the occurrence of
bequests from the parent, either simply because the second generation is young (Conley and
Glauber 2008), or because of requirements about survivorship of the parental generation (Charles
and Hurst 2003; Mulligan 1997). Assessing wealth in the child generation at a higher age is
therefore valuable in part because it allows us to include more individuals who have received
bequests. In fact, the average age of our child sample coincides with the expected average age of
receiving bequests (~50 years; see Piketty 2014: p. 389). We also descriptively assess the degree
to which bequest and transfer receipt account for the intergenerational wealth correlation.
Prior research has documented strong associations between parents’ wealth and their
children’s educational outcomes (Conley 2001a; Morgan and Kim 2006, Belley and Lochner
2007; Haveman and Wilson 2007; Orr 2003; Pfeffer 2011) and paying for higher education is a
likely moment for inter-vivos wealth transfers from grandparents and parents to offspring
(Conley 2001a; Schoeni and Ross 2005). Since income returns to educational attainment should
translate into different patterns of asset accumulation, and education itself is associated with
wealth net of income (Conley 2001b; Keister 2003), we expect that education is a mediator of
intergenerational persistence in wealth. Furthermore, education and income are associated with
not only higher wealth levels but also faster rates of wealth accumulation (Conley 2001b).
Therefore, we also expect that the education mechanism leads to higher intergenerational wealth
correlations as early adulthood investments increasingly pay off as offspring age.
The two channels selected, educational investments and bequests and transfers, are likely to
be of different importance at different points in the offspring’s life course. Parental bequests tend
to occur during middle adulthood of those bequeathed. In contrast, the timing of grandparental
bequests may matter more for wealth accumulation since is occurs at an earlier stage of the life-
course. Finally, and importantly, the assessment of education’s role will also point to a
mechanism of intergenerational wealth transmission much earlier in life.

How Rigid is the Wealth Structure and Why? 14
There are multiple other mechanisms that might produce an association between parental
and offspring wealth. Three particularly likely channels are homeownership, marriage, and self-
employment. The purchase of a first home is a key moment for direct wealth transfers from
parents to child (Charles and Hurst 2002), and homeownership is in turn associated with higher
rates of wealth growth (Turner and Luea 2009). Since low-income couples often cite a lack of
financial resources as one reason to delay marriage (Edin and Kefalas 2005; Smock, Manning,
and Porter 2005), parental wealth transfers, including to assist with wedding costs, may act to
speed marriage transitions. Marriage itself is associated with faster subsequent wealth growth
(Zagorsky 2005). Finally, self-employment is intergenerationally transmitted (Dunn and Holtz-
Eakin 2000) and could contribute to the similarity in wealth across generations.
Evaluating the importance of these three channels of transmission poses special challenges
because it is possible that self-employment, homeownership, and marriage in the offspring
generation are not mediators of the intergenerational reproduction of wealth, but outcomes of it.
Prior research suggests that own wealth facilitates home purchase (Hall and Crowder 2011),
marriage (Schneider 2011), and entrance into self-employment (Evans and Jovanovic 1989;
Dunn and Hotz-Eakin 2000), heightening concerns that these outcomes for offspring may be the
result of other processes of intergenerational wealth transmission, rather than a step on the causal
chain between parental wealth and child wealth. Therefore, we leave the evaluation of the
importance of these mechanisms to future research.
By contrast, education and inheritance, do not suffer from the same concern. Inheritance
received by the child is by definition a transfer from grandparents and parents to the child, not
the result of child wealth. Also, given that most education is completed before the young
accumulate their own assets, we believe it is reasonable to assume that offspring education is a
mediator of the intergenerational correlation in wealth rather than education being the outcome
of offspring’s own wealth.
Charles and Hurst (2003) also consider mechanisms of intergenerational wealth
transmission, specifically (lifetime) income, education, prior transfers and anticipated bequests,
and the types of assets held. To assess the role of each channel, they add controls for both the

How Rigid is the Wealth Structure and Why? 15
parent and child value to the regression model estimating the intergenerational association in
wealth. For example, by controlling for parent and child education, they estimate the extent of
intergenerational reproduction in wealth that is independent of any intergenerational
reproduction of education. They find, perhaps unsurprisingly, that the similarity between parents
and children in their income-earning potential –lifetime income – is the largest contributor to the
intergenerational wealth association, explaining about half of the association. The
intergenerational reproduction of education explains about one quarter of the association, 17
percent is explained by prior gifts received by the child and anticipated bequests of the parents,
and a little over one third is explained by intergenerational similarity in asset types held. Net of
similarities in income, education and transfers have little additional explanatory power, nor do
shared risk preferences between parents and children.
We pursue a somewhat different approach. First, in our analysis of the mediation of two-
generational correlations we adjust only for children’s characteristics (education and
gifts/bequests received), but not the characteristics of parents. Charles and Hurst aim to estimate
the extent of intergenerational wealth reproduction independent of the intergenerational
reproduction in other factors, essentially assuming that parental wealth is a spurious factor
associated with both parental education and child education, rather than viewing the latter as a
mediator of this association. We make the opposite assumption. Our assumption is in keeping
with our descriptive focus on channels of wealth transmission: we seek to understand the
potential role for parental investments in child outcomes. Because education is positively
correlated between parents and children, our estimates will be more conservative in terms of the
share of the wealth correlation explained by each factor.
Second, we consider a narrower range of mechanisms. As described previously, we do not
consider asset types, including homeownership, out of concern that they are endogenous with
children’s own wealth. Charles and Hurst’s finding that education explains little of the
intergenerational transmission of wealth net of income is important, as it indicates that the
importance of education as a channel of transmission is largely through education’s effect on
income, rather than other mechanisms, such as enhanced financial skills. However, interpreting
How Rigid is the Wealth Structure and Why? 16
the mediating role of income is challenging: we learn that much of the between-generation
similarity in wealth is because generations are similar in their ability to bring in income that can
be used for savings, but we still do not know why this is true. By focusing on education and
inheritance, we identify channels that are more directly subject to (grand)parental manipulation –
(grand)parental action that seeks to increase offspring wealth directly through transfers or
indirectly through investments in their future income- and wealth-generating potential.
Finally, since we also examine channels of transmission in a multigenerational context, we
provide an assessment of the cumulative influence of education and transfers and bequests on the
long-term maintenance of wealth positions within family lineages. We describe our approach to
the three-generational mediation analysis in detail below.
DATA
The PSID’s genealogical design makes it ideal for intergenerational analyses: children born
to PSID households eventually become PSID respondents themselves as they form their own
households. The PSID is the only nationally representative panel study that has been in the field
long enough to include both a second and a third generation of adult survey respondents (Pfeffer
2014). The PSID has collected information on housing wealth since its inception in 1968 (home
values starting in the first wave and also mortgages starting in 1969). Since 1984, every five
years until 1999 and every wave since then, PSID has collected detailed information on families’
assets, which allows the calculation of a family’s net worth.
For the two-generational analyses, we take advantage of the earliest (1984-1989) and latest
(2011-2013) wealth data collected in the PSID, spanning almost three decades and including a
decade more wealth data than prior contributions that assessed wealth correlations based on the
PSID. The full analytic sample contains 4,567 individuals aged 25-64 in 2013 and their parents,
aged 25-64 in 1984, when they reported their own wealth for the first time. We link children to
their biological or adoptive parents and grandparents using PSID’s family identification mapping
system (FIMS). For parents who do not live in the same household in 1984, for instance because
they are divorced, we sum the net worth of parents if they are both observed in separate

How Rigid is the Wealth Structure and Why? 17
households (5 percent of the weighted sample). Where only the mother (20 percent) or the father
(3 percent) are observed, we take her/his household net worth as the sole indicator of parental
wealth. One could instead impute the net worth of the missing parent, but we are not convinced
that doing so is preferable, since the missing parent may be genuinely missing from the child’s
life and therefore should not count towards that child’s wealth background. However, analyses
that do use imputed wealth of the missing parent produce very similar results (available upon
request).
For the multigenerational analyses, we draw on three different samples with complementary
strengths. First, we rely on the grandparents’ own wealth reports from 1984, the first survey year
in which the PSID included a full asset module (N=2,160). This allows us to use a net worth
measure for grandparents that has been collected the same way as for parents and children.
However, there are two important limitations. First, since we observe grandparents’ and parents’
wealth in the same survey year, there are of course large differences in the age at which we
observe grandparental and parental wealth. Second, this sample suffers from mortality bias, since
we only observe grandparents who are still alive in 1984 and still live in their own independent
households. Ideally, we would instead want to measure grandparents’ wealth much earlier and at
similar ages to the following generations.
A second multigenerational sample accomplishes that by observing grandparents in the first
PSID survey years but, since those early survey waves did not yet contain a full-fledged asset
module, we retreat to home values as a proxy for net worth. Housing wealth is the largest
component of the typical and the majority of U.S. households’ wealth portfolio (Pfeffer et al.
2014; Wolff 2014). Our analyses test the validity of this proxy measure. We measure
grandparents’ self-reported home values in 1969 and 1970 and relate it to the home values of
parents in 1984 and 1989 and children in 2011 and 2013 (N=2,492).
Finally, a drawback in most multigenerational analyses based on prospective panel studies is
that the sample following rules imply that we typically only observe either maternal or paternal
grandparents (but see Warren and Hauser 1997 for an important exception). Not knowing the
wealth of one set of grandparents may lead to conservative estimates of multigenerational
associations, for instance, if having wealthy maternal grandparents provides additional benefits
How Rigid is the Wealth Structure and Why? 18
to having wealthy paternal grandparents. To directly address this potential bias, we use data from
the 1988 PSID “transfer module” that asked respondents to report the wealth of their parents and
parents-in-law, thereby capturing the net worth of both paternal and maternal grandparents in our
sample (N=559). Prior research has used these reports to assess between-spouse associations in
parental wealth (Charles et al. 2013).
The PSID is not the only nationally representative survey that collects information on net
worth. The Survey of Consumer Finances (SCF), often considered the gold standard among
wealth surveys, does not track offspring wealth and therefore does not contain the necessary data
to estimate intergenerational wealth correlations. Recent research has shown that the PSID
wealth measures compare very favorably to the SCF wealth measures, attesting to the high
validity of the former (Pfeffer et al. 2014). Since 1985, the National Longitudinal Survey of
Youth 1979 (NLSY79) has also collected information on respondents’ net worth, but, like the
SCF, does not measure parental wealth and therefore does not allow the estimation of
intergenerational wealth correlations, much less of multigenerational persistence of wealth.
Our main wealth measure is family net worth, which is the sum of all financial assets, real
assets, and home equity, minus any financial obligations. To reduce measurement error, we
average wealth measures across two adjacent survey years (2011 and 2013 for the offspring
generation, 1984 and 1989 for the parents and grandparents, and 1969 and 1970 for the housing
wealth of grandparents). All dollar values are adjusted for inflation and expressed in 2013-$. Our
main results do not adjust wealth for family size, but models based on wealth measures adjusted
by the square root of family size yielded numerically similar and substantively equivalent results
(available upon request).
In our models that assess the mediating role of education in the intergenerational (and
multigenerational) transmission of wealth, we use offspring’s (and parents’) highest educational
degree attained (less than high school, high school, some college, B.A., and post-graduate
degree). For bequests, we draw on a direct survey question, asked in each wave of the PSID, on
whether any large gift or inheritance of over $10,000 has been received and, if so, the value. We
cumulate this information across all waves to approximate the total value of gifts and bequests
ever received by children (and by parents).

How Rigid is the Wealth Structure and Why? 19
METHODS
A large literature on intergenerational associations in economic status (Black and Devreux
2011; Solon 1999) and prior work on intergenerational wealth correlations (Mulligan 1997;
Charles and Hurst 2003) apply an OLS regression approach to estimate intergenerational
correlations as age-adjusted elasticities. For wealth, this model is
(1)
with the natural log of offspring net worth, the natural log of parental net worth, and
with quadratic controls for child and parental age (average of maternal and paternal age if both
are observed). Since both offspring and parental net worth are logged, β1 can be interpreted as an
elasticity, i.e. as the predicted percent change in offspring wealth from a one percent change in
parental wealth.
The log-log specification reduces the impact of high wealth outliers, which is important
given the vastly unequal distribution of wealth, but it suffers from two important drawbacks.
First, it cannot easily incorporate households with zero wealth or net debt: they are either
dropped from the sample (Charles and Hurst 2003; Mulligan 1997) or set to a floor value
(Conley and Glauber 2008). This is particularly important because nearly one in five individuals
in our sample of the offspring generation has zero or negative net worth (i.e. net debt), and
among younger cohorts (25-44 in 2013) the share rises to one in four. Second, comparing
elasticities across groups or time is complicated by the fact that they are a product of both the
intergenerational correlation (exchange mobility) and the variances in both generations (marginal
distributions).
We therefore prefer a different specification to assess and compare exchange mobility in
wealth:
(2)
Instead of the logarithm of net worth (equation 1), we measure child wealth (rankWc) and
parental wealth (rankWp) as the percentile rank in their respective weighted net worth
distribution. This specification allows us to assess the full distribution of wealth, since it easily

How Rigid is the Wealth Structure and Why? 20
accommodates cases of zero wealth and net debt. Also, the rank slope coefficient ( 1) is
insensitive to differences in the marginal distributions across groups (Chetty et al. 2014; Jäntti
and Jenkins 2014) and therefore more easily compares groups. In addition, it has recently been
shown by Mazumder (2015) that, at least in the context of income correlations, rank-rank slopes
are much more robust to life-cycle bias and attenuation bias due to measurement error than are
intergenerational elasticities.
After estimating the average intergenerational association in wealth, we document variation
in this association across substantively important subgroups by estimating subgroup-specific
models. First, we test our hypothesis that wealth transmission is more pronounced at older ages,
dividing the sample into four age groups: 25-34, 35-44, 45-54, and 55-64. We also estimate
associations separately by sex and by race. The PSID’s oversample of African-American
households facilitates comparison of intergenerational wealth persistence for African-American
and white households, but we do not have sufficient sample size to examine patterns for
members of other races.
To assess variation in intergenerational wealth rigidity across the wealth distribution of both
parents and offspring, we formally test whether the correlation between parental and offspring
wealth is nonlinear (see Mitnik et al. 2015). We then move to mobility tables (transition
matrices) as a flexible approach to assess potential non-linearities in the wealth association
across generations. Sociologists studying intergenerational mobility by occupation or education
have often used mobility tables to assess where immobility is particularly pronounced (see the
discussion in Erikson and Goldthorpe 2002). Like the rank-rank correlations, mobility tables
easily incorporate the experiences of net debtors – a substantial share of our adult offspring
sample. For these and all following analyses, we restrict the sample to parent-child pairs in
which the offspring is ages 45-64 (N=1,975), to document patterns after offspring have had time
to accumulate assets across a substantial portion of their adult lives. We divide both the parent
and offspring weighted wealth distributions into generation-specific quintiles and examine
transition probabilities across cells, testing the possibility that rigidity is particularly pronounced
at the top and bottom of the distribution.

How Rigid is the Wealth Structure and Why? 21
We then use a similar technique to investigate in more detail race differences in wealth
transmission, exploring whether any differences observed in the rank-rank correlations are due to
race differences in the wealth distribution, and particularly to high-rigidity or low-rigidity
locations, rather than to race differences in persistence conditional on position in the wealth
distribution. In this analysis, because of the smaller sample size of African-American households
and substantial underrepresentation at the top of the wealth distribution, we have insufficient
sample size to examine race-specific patterns across wealth quintiles. Instead, we divide the
samples of both generations into three categories: less than $25,000 of net worth, at least $25,000
but less than $75,000, and $75,000 or more.
Our assessment of three-generational associations uses modeling approaches parallel to
those used to estimate two-generational associations. To study similarity in wealth across three
generations we focus on the rank-rank specifications (but provide estimates of elasticities in the
Appendix). In a first step, we re-estimate the two-generational association (equation 2) based on
each of the multigenerational samples. We then compare these two-generational rank slopes to
unconditional rank slopes for grandparents (i.e. replacing parental wealth and age with
grandparental wealth and age in equation 2). These models estimate the extent of wealth
similarity between grandparents and grandchildren, ignoring the parent generation. Finally, we
estimate the association between grandparental wealth (rankWgp) and children wealth while
taking into account parental wealth, i.e.
(3)
In (3), indicates the extent of wealth similarity between grandparents and grandchildren
that is not explained by the wealth position of the parental generation. In other words, it is the
direct association between grandparents and grandchildren, net of the mediating channel via
parental wealth.
Finally, to assess the contribution of the two channels of transmission that we hypothesized
to underlie intergenerational wealth correlations, inheritances or transfers and education, we
enter controls for these characteristics into equations (2) and (3) and observe the degree to which

How Rigid is the Wealth Structure and Why? 22
they mediate – separately and jointly – intergenerational and multigenerational correlations. For
the mediation of the two-generational (parent-child) correlation, we control for children’s
educational attainment and amount of gifts or inheritance received to date, cumulating across
years. For the mediation of the three-generational correlations, we investigate how much of the
conditional wealth correlation between grandparents and children (as estimated in equation 3) is
mediated by both children’s and parents’ characteristics. For instance, if grandparents’ wealth
correlates with parents’ education and parents’ education contributes to the educational success
of their children and, directly or indirectly, to their wealth attainment, then, in order to fully
account for the portion of the residual grandparent-grandchild association that is mediated
through education, we need to condition on both parental and offspring education. In these
models, we continue to condition on parental wealth, since it is the grandparent-grandchild
wealth association net of the two-generation linkages from grandparents to parents to offspring
that we seek to explain.
All of our analyses are weighted by the family weight of the parents (averaged across the
two measurement points), and standard errors are clustered by the original sample family
(grandparent). Neither of these two adjustments, however, substantively alters our findings.
Since we draw on imputed wealth measures provided by the PSID there is no need for
imputation of missing values, and we also have no missing values on education or inheritance.
RESULTS
Descriptives
Descriptive statistics for our full analytic sample are displayed in Table 1. As argued before,
the latest PSID data allow us to capture the wealth of children and parents at more similar and
higher ages than prior research: the mean age at which we observe parents (in 1984) is 43.4 years
and 44.6 years for children (in 2013). Half of the offspring are observed during their peak time of
wealth, between 45 and 64 years of age. The close similarity of mean ages across two
generations protects our estimates of two-generational correlations from life-cycle bias.

How Rigid is the Wealth Structure and Why? 23
Table 1. Descriptives
How Rigid is the Wealth Structure and Why? 24

How Rigid is the Wealth Structure and Why? 25
However, some differences in mean ages re-emerge in our three-generational sample. As
one would expect, the requirement to additionally observe the wealth of grandparental
households restricts our sample to somewhat younger children and parents (mean ages 37.0 and
35.1, respectively) and older grandparents (46.6 in 1968 for the assessment of their housing
wealth and 61.6 in 1984 for the assessment of their net worth). More than 80 percent of the
offspring in our three-generational sample(s) are observed between the ages of 25 and 44. As we
will show below, the assessment of wealth attainment at these earlier ages hides a significant
amount of two-generational wealth transmission, so it may also underestimate multigenerational
wealth transmission, making our estimates of multigenerational associations conservative.
Mean net worth decreased from the $337,589 in the parent generation to $289,311 in the
child generation, in line with prior assessments of trends in the wealth distribution between those
years (Pfeffer et al. 2014). More than two-thirds of the lower net worth in the child generation is

How Rigid is the Wealth Structure and Why? 26
accounted for by losses during the Great Recession. Offspring mean wealth was $322,609 in
2005-2007, before the large-scale asset destruction brought about by the collapse of the housing
and stock markets. Similarly, the share of offspring with zero or negative net worth dramatically
increased from 14 percent pre-recession to 18.5 percent after the recession, compared to less than
6 percent of parents in 1984-1989.
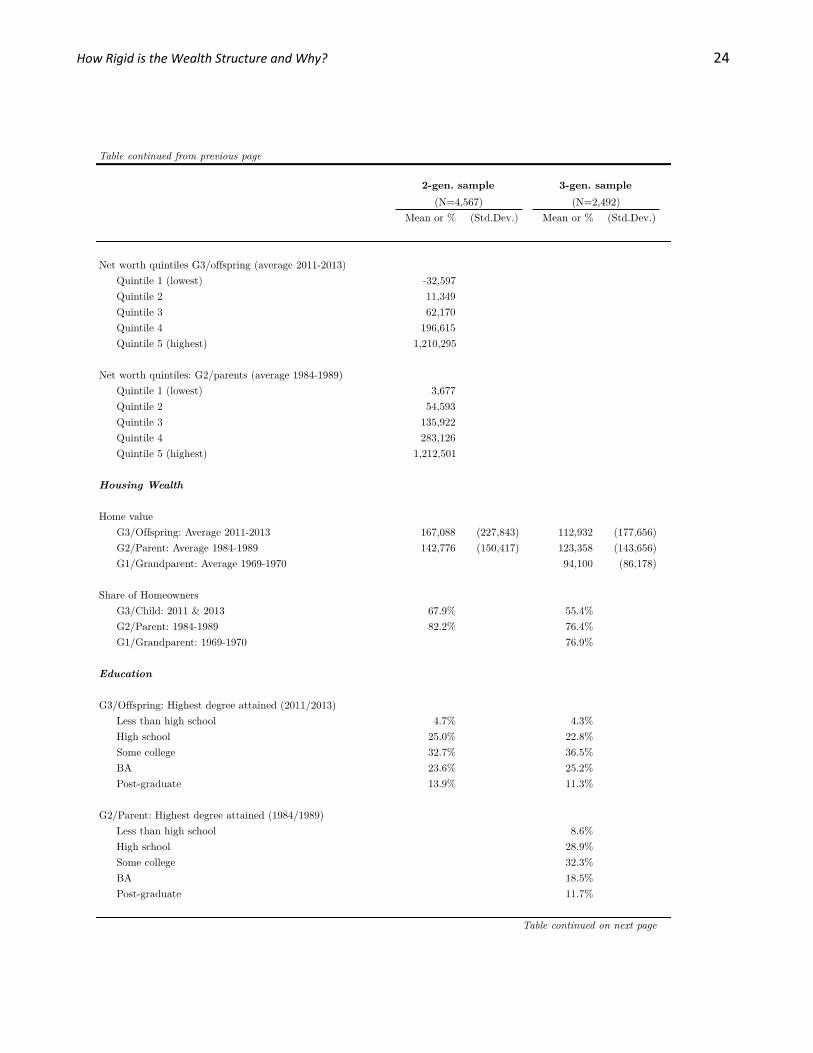
Given that nearly a fifth of the offspring sample held no wealth, it is unsurprising that the
bottom 20 percent of the offspring hold $32,597 in net debt, on average, compared to $3,677 in
net worth for the parent generation. The net worth of the middle wealth quintile of the offspring
generation averages less than half the value in the parental generation ($62,170 vs. $135,922).
Average net worth for both the child and the parent generation are lower in the three-
generational sample since, as mentioned above, they are assessed at earlier ages, while the self-
reported net worth of grandparents in 1984 is much higher than that of parents and children.
Mean grandparental net worth (G1) as reported by parents (G2) in 1988 is somewhat lower than
grandparents’ self-reports, despite the fact that parents are reporting on both lineages (their own
parents and their parents-in-law), while grandparents report only on their own wealth (only
maternal or paternal grandparents). However, rather than using the proxy-reports to provide
another estimate of the true population parameter of the three-generational association in wealth,
we use them as a stability check to assess potential bias introduced by not observing both family
lineages: we compare the estimate based on both lineages to estimates based on just one lineage
within this sample.
Since our main multigenerational sample is based on an assessment of housing wealth,
Table 1 also reports home values and homeownership rates. The mean home value in the child
generation, including non-owners as $0, is $167,088 and higher than in the parent generation
($142,766), despite the fact that homeownership is more widespread among the parent
generation (82.2 percent) than the child generation (67.9 percent). In our three-generational
sample, we observe similar gaps in homeownership rates between children and parents, very
similar homeownership rates between parents and grandparents, and average home values that
are greatest for the parent generation and lowest for the grandparent generation.

How Rigid is the Wealth Structure and Why? 27
Wealth Correlations
Table 2 shows the estimated intergenerational elasticities and rank correlations in net worth.
Our baseline estimate of the elasticity in net worth is 0.41, similar to the prior estimate of 0.37
from Charles and Hurst (2003).3 Applying a common interpretation that assumes constant
elasticity, this implies that a 1 percent increase in parental net worth is associated with a
predicted increase of 0.41 percent in offspring wealth. Or, a doubling of parental wealth is
associated with a predicted increase of 32 percent (2 . 1.32) in offspring wealth.
We find sizeable gender differences in wealth elasticities. Using the same interpretation,
the estimates imply that a doubling of parents’ net worth is associated with an increase in net
worth by 38 percent (2 . 1.38) for sons but only 28 percent (2 . 1.28) for daughters.
However, the direct comparison of these two estimates is challenged by two complications. First,
since they are based on logarithmically transformed net worth variables, they exclude cases with
zero wealth or net debt, excluding a somewhat higher share of daughters (20 percent) than sons
(17 percent). Second, as discussed above, elasticities are sensitive to the marginal distribution, in
this case, group differences in the variance of wealth. The wealth distribution for daughters is
substantially more compressed than for sons (44 percent lower variance). Together, these factors
contribute to deflate the elasticity for daughters compared to sons.
The rank correlations presented in Table 1 address both issues and are therefore much
more suitable for group comparisons of the size of intergenerational associations (see also Jäntti
and Jenkins 2014). Here, the overall degree of association between parental wealth and
children’s wealth is 0.37 and virtually the same for sons and daughters. A rank slope of 0.37
means that an advantage of 10 percentiles (one decile) in the parent generation is associated with
an advantage of 3.7 percentiles (about a third of a decile) in the child generation.
3 Conley and Glauber (2008) found an appreciably lower elasticity of 0.28 based on a net worth measures that was bottom coded at $1 before logarithmic transformation. Doing so reduces the elasticity in our sample to 0.33 and foreshadows some of the issues around non‐linearity in the elasticity that we discuss in more detail below.

How Rigid is the Wealth Structure and Why? 28
Table 2. Intergenerational Correlations in Net Worth
How Rigid is the Wealth Structure and Why? 29
We also focus on rank correlations to meaningfully compare the degree of
intergenerational wealth correlation across age groups. The correlation rises greatly with
increasing age, from 0.31 among offspring aged 25-34 to more than a third higher, 0.41 for
offspring aged 55-64 in 2013. These findings support the hypothesis that intergenerational
wealth correlations rise with age. Since we also assess the two generations at similar ages within
each age group (i.e. the average age of parents in our sample rises with children’s age; r=0.88),
one conclusion is that the similarity in wealth between parents and their children increases as
both of them accumulate assets.
Because of the importance of mid- and later-life wealth for both retirement and
investments in the next generation, we argue that estimates of rigidity in the wealth structure
should ideally be based on measures of wealth attainment during older adulthood. Based on the
rank slopes, we observe that intergenerational similarity is high and relatively stable among the
older two age groups (45-54 and 55-64). In the following two-generational analyses, we
therefore focus on the group of children aged 45 to 64.
We find a very similar age-gradient in the rank slope when the ranks are drawn within
each age group rather than the entire sample (rightmost section of Table 2). Consequently, the
rising intergenerational wealth correlation with age not only means that children from wealthier
households move up in the overall distribution of wealth, but that they also move up relative to
their less wealthy but similarly aged peers.
Turning to the race-specific analyses, we find that the intergenerational correlation in
wealth positions is less than one third as strong for African-Americans as for whites (0.11 versus
0.35). We investigate in a later section whether this difference is due to African-Americans’
concentration in areas of the wealth distribution where intergenerational reproduction is weaker.
Finally, we note that the intergenerational correlation in wealth was virtually the same
before and after the Great Recession (0.35 and 0.37, respectively). Although to different
intensity, wealth losses hit American households across the wealth distribution, and it appears
that these distributional shifts have not appreciably altered wealth positions of families when
compared across generations.

How Rigid is the Wealth Structure and Why? 30
Rigidity across the Wealth Distribution
For the reasons previously discussed, we believe that the strength of the intergenerational
transmission of wealth is likely to vary across the wealth distribution. We follow Mitnik et al.
(2015) and test for non-linearities in the intergenerational associations by assessing the fit of
alternative model specifications that include non-linear terms, either squared parental wealth or,
more flexibly, a spline function with knots at the quintiles. Both specifications provide clear
evidence against the constant association assumption (based on global F-tests; results not
shown).
Therefore, to examine intergenerational associations in wealth across the wealth
distribution, we use mobility tables that cross-tabulate parental and offspring’s wealth quintiles,
restricting the sample to 45-64 year olds in 2013 and their parents and drawing the quintiles
based on the weighted wealth distribution within this age group.
Table 3 shows the resulting mobility table and displays row or “outflow” percentages,
which identify what percentage of the members from a given quintile of the parental wealth
distribution are found in each quintile of the offspring wealth distribution.
Table 3. Intergenerational Wealth Mobility Net worth quintiles within ages 45‐64 (N=1,975)
For each quintile, offspring are more likely to end up in the same quintile as their parents
than expected by random chance (all on-diagonal cells have outflow percentages greater than

How Rigid is the Wealth Structure and Why? 31
20). However, intergenerational persistence of wealth is much higher at the top than in any other
quintile: forty-four percent of children from the highest parental wealth quintile also end up in
the highest wealth quintile themselves (corresponding to a total net worth of around $331,000 or
more), and about 70 percent end up in one of the top two quintiles ($108,000 or more).4
Furthermore, we observe a U-shaped pattern of immobility commonly found in mobility
analyses. Immobility is lowest for children from the middle 20 percent of the wealth distribution
(with parental net worth between $89,000 and $195,000). But, although these children appear to
be about equally likely to move into any of the bottom four quintiles, a clear barrier to enter the
top quintile is also apparent, with only 12 percent of these children accessing it. Finally,
intergenerational persistence is again higher for children from the bottom quintile, with 35
percent of them remaining there (and holding basically no net worth), although not as high as
persistence as the top.
Transmission Differences by Race
The results in Table 3 heighten the possibility that the low intergenerational wealth
correlation observed for African-Americans is due to their underrepresentation at the top of the
wealth distribution, where persistence is greatest. Tellingly, the African-American and white
wealth distributions are so different that virtually no African-Americans in our older age group
are born into the highest parental wealth quintile (6 individuals, less than 2 percent of the
weighted sample). Even among the top 40 percent, African-Americans are basically not
represented (2.1 percent of the weighted sample). By comparison, 63 percent of African-
American offspring are from the bottom wealth quintile, and 87 percent are from the bottom two
quintiles. As a result, we are not able to compare mobility across quintiles by race to test the
possibility described above.
Besides posing an analytical challenge, these patterns highlight just how different the
wealth backgrounds of African-American and white offspring are. About 23 percent of white
4 Further adjustments for remaining age differences within this group, based on quintiles drawn from age‐residualized distributions, do not appreciably alter the picture of persistence at the top (44.4 percent instead of 44.1 percent attaining the top wealth quintile).
How Rigid is the Wealth Structure and Why? 32
offspring in the older age group were born to parents in the top quintile of the parental wealth
distribution, making the likelihood of being born to a highest-wealth household 14 times greater
for whites than African-Americans. At the other extreme, African-Americans have an almost 5
times higher likelihood of being born to the lowest wealth quintile than do whites.
To test our hypothesis about the patterns underlying lower intergenerational wealth
correlations among African-Americans, we divide our sample into three wealth categories: no
more than $25,000, more than $25,000 but no more than $75,000, and more than $75,000. Even
in these coarse categories, the distribution of parental wealth differs greatly by race. As shown in
Table 4, more than four-fifths of white parents are in the top wealth category, compared to 28
percent of African-Americans parents. At the other end, only 8 percent of white parents are in the
lowest category, compared to 45 percent of African-Americans parents. In the offspring
generation, differences are not quite as extreme, but remain large. Compared to African-
Americans, whites in the offspring generation are more than twice as likely to be in the top
wealth group (66 percent versus 29 percent) and less than half as likely to be in the bottom
category (22 percent versus 51 percent).
Using these categories, we explore the race-specific patterns of mobility. For those with
parents with net worth less than $25,000, slightly over half remain in the same low wealth
category themselves (53 percent of whites and 56 percent of African-Americans). Thus, at the
bottom of the wealth distribution we see strong intergenerational persistence, but little difference
by race. At the top, however, 71 percent of whites born into the top wealth group remain there in
adulthood, compared to only 32 percent of African-Americans. More generally, only 29 percent
of whites who could have experienced downward mobility (i.e., born to the top two parental
wealth groups) did, compared to 55 percent of African-Americans. This difference is not
matched by greater rates of upward mobility for African-Americans: only 39 percent of African-
Americans eligible for upward mobility moved up, compared to 47 percent of whites.5
5 In these simplified mobility tables, we also compare mobility rates experienced by blacks and whites across the three groups using a log‐linear modeling approach that adjusts for the remaining racial differences in the marginal distributions. Specifically, we use the log‐multiplicative layer model (Xie 1992) to test whether the strength of the wealth association between parents and children differs by race. The model fits the data very
well ( 1.5, 0.67), and confirms greater intergenerational exchange mobility for blacks than
whites 0.26; 1 .

How Rigid is the Wealth Structure and Why? 33
Table 4. Race Differences in Wealth Mobility Ages 45‐64
Of course, these differences might still be artifacts of differences by race in the
distribution of parental wealth. If, within each parental wealth category, average wealth for
African-American parents is lower than for white parents, we might observe higher rates of
downward mobility for African-Americans simply because their parents’ wealth was already
closer to the bottom boundary of the category. Figure 1 shows mobility patterns in more detail
across the entirety of the wealth distribution. For every decile of the weighted parental wealth
distribution, we plot the average wealth percentile of the offspring (ages 45-64) of those parents,

How Rigid is the Wealth Structure and Why? 34
separately by race. The size of the marker is proportional to the weighted fraction of parents
found in that decile. The figure visualizes the large racial gaps in parental wealth: the markers for
African-American families are much larger at the bottom of the distribution than at the top, while
the markers for white families are approximately equally sized across the wealth distribution. A
full 41 percent of African-American parents are found in the bottom decile of the wealth
distribution, compared to only 7 percent of white parents. Second, the fitted line for African-
Americans is shallower than the fitted line for whites, demonstrating weaker intergenerational
persistence. However, the figure also highlights that, at each decile of parental wealth, the
average wealth of African-American adult children falls below that of their white peers.
Figure 1. Race Differences in Intergenerational Wealth Correlations Binned scatterplot (with bins defined as wealth deciles) and linear fit
Notes: (a) Hollow circles & dashed line = Whites (N=1,105). (b) Solid circles & solid line = African-Americans (N=799)
3040
5060
7080
Wea
lth P
erce
ntile
0 20 40 60 80 100Parental Wealth Percentile

How Rigid is the Wealth Structure and Why? 35
Together, these results suggest that our estimate of higher intergenerational correlation in
wealth for whites than African-Americans is not exclusively due to African-Americans’ severe
underrepresentation at the very top of the distribution: race differences in mobility appear even
within parental wealth categories. However, the greater mobility for African-Americans is also
not symmetric, but is dominated by greater rates of downward mobility.
Multigenerational Associations in Wealth
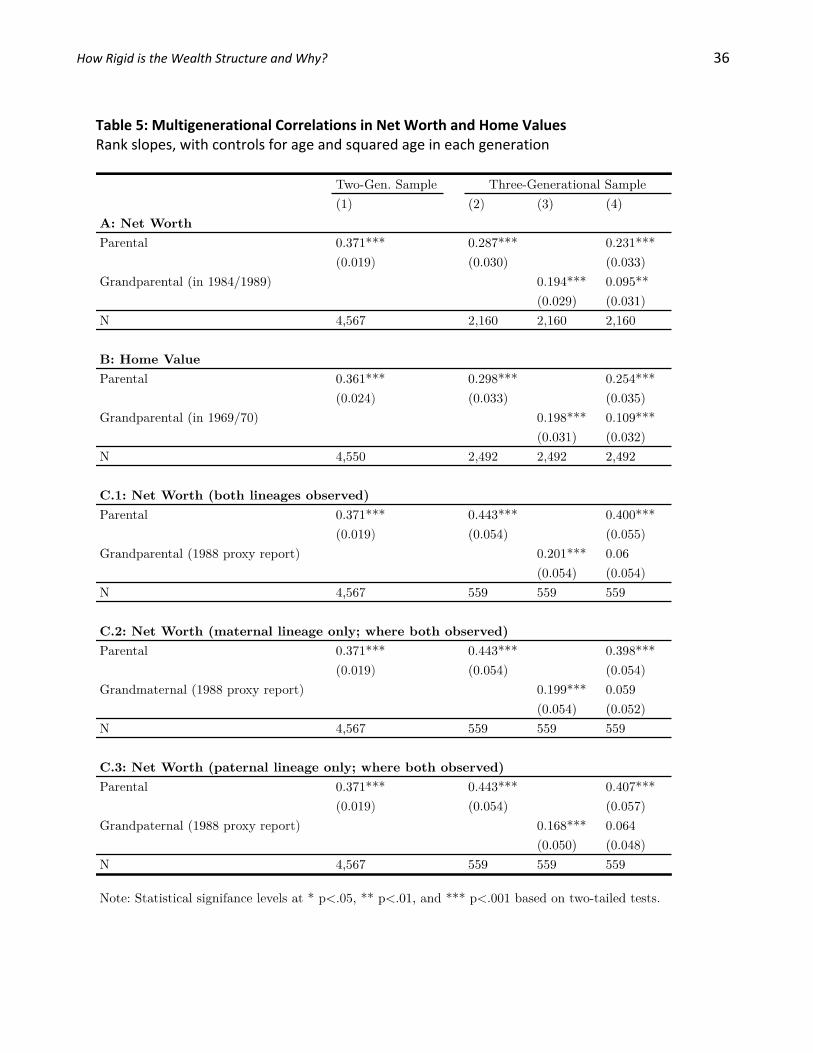
In Table 5, we report the results of our multigenerational analyses that, as described
above, are based on three different measures of grandparental wealth and three different resulting
samples. We begin by discussing rank slopes in self-reported net worth (Sample A). Recall that
our estimate of the two-generational net worth correlation, using the full sample of offspring
ages 25-64, is 0.37 (column 1; see also Table 2). When we re-estimate the same association,
restricted to the three-generational sample, the association is lower, 0.29. This is expected, given
the younger ages of parents and children in our three-generational samples. That is, while we are
able to successfully eliminate life-cycle bias in our main two-generational analyses reported
above, it re-emerges in our three-generational samples. However, our main focus here is the size
of the grandparent-grandchild associations in comparison to these adjusted two-generational
associations. The grandparent-grandchild rank slope is about two-thirds the size of the parent-
child rank slope (0.19 compared to 0.29). That is, if we were to predict the wealth attainment of
children from the wealth position of their grandparents, we would on average expect an increase
of 2 percentiles in the child generation for every decile increase in the grandparental generation.
About half of this three-generational association goes through the wealth attainment of the parent
generation (0.10 versus 0.19), but the conditional association between grandparental and
grandchild net worth is still significant, both substantively and statistically.6
6 We tested for interactions between parental and grandparental wealth but found few statistically significant interactions and they were inconsistent across the different multigenerational samples.
How Rigid is the Wealth Structure and Why? 36
Table 5: Multigenerational Correlations in Net Worth and Home Values Rank slopes, with controls for age and squared age in each generation

How Rigid is the Wealth Structure and Why? 37
To overcome the limitation of sample A that grandparents’ wealth is assessed at a different
and much higher average age than parents’ or offspring’s, we now turn to an analysis that relies
on home value as an indicator of wealth (sample B). First, and importantly, we observe that the
two-generational rank slope in home values (column 1) is quite similar to the two-generational
rank slope in net worth (0.36 versus 0.37), implying that home values alone may provide a valid
proxy measure for the assessment of intergenerational wealth correlations. We consider this an
essential finding since home values are often more readily accessible measures that could be
used in research based on a broader range of data. Measures of home equity (home value minus
mortgages) yielded broadly similar results (not shown).7
Importantly, the striking similarity in the intergenerational correlation of net worth and
home values fully extends to the multigenerational case: the unconditional multigenerational
association in this sample is 0.20, compared to 0.19 in sample (A), and the conditional
association is 0.11, compared to 0.10 in sample (A). Our conclusions about the multigenerational
transmission of net worth offered above hold in precisely the same way for the multigenerational
similarity in home values.
Perhaps yet more surprisingly, our final multigenerational sample (C.1), which is based on
proxy reports of grandparental net worth by parents and which we primarily use to assess the
consequences of neglecting one of the two grandparental lineages – provides a very similar
estimate of the three-generational association in net worth (column 3), although the estimated
two-generational association is higher (column 2) and conditioning on parental wealth reduces
that association more strongly than in prior models (column 4).8 However, the main use of this
additional multigenerational sample is not to estimate the multigenerational association reliably,
but to assess whether the restriction to a single grandparental lineage is likely to have
significantly biased the estimated multigenerational associations reported above. We compare
the multigenerational associations in grandparental wealth summed across maternal and paternal
7 We also assessed whether the estimated correlations in home values are driven by the intergenerational persistence of homeownership. Models restricted to homeowners in all generations yielded somewhat higher estimates (e.g. a two‐generational rank slope of 0.39 instead of 0.36 and a conditional three‐generational rank slope of 0.17 instead of 0.11), indicating that correlations in home values are not simply reflections of familial histories of homeownership. 8 The latter result may be due in part to correlation between self‐reported parental wealth and bias in parents’ reports of grandparental wealth.

How Rigid is the Wealth Structure and Why? 38
grandparents (C.1) to associations based on only maternal (C.2) or paternal grandparents (C.3)
within the same sample. Maternal grandparental wealth alone perfectly replicates the
unconditional multigenerational association based on total grandparental wealth (0.20 in both
cases), as well as the conditional multigenerational association (both 0.06). Associations based
on the paternal lineage are somewhat weaker for the unconditional but not the conditional
associations (0.17 and 0.06, respectively).9 This comparison gives additional credibility to the
main estimates of multigenerational association provided earlier: our estimates based only on one
grandparental lineage are unlikely to substantially understate the grandparent-grandchild
association in wealth.
Overall, our complementary approaches to address different data challenges in this section
leave us with a greatly consistent answer: the three-generational correlation in wealth is about
two thirds the size of the parent-child correlation, and only half of that multigenerational
correlation is explained by the wealth position of the middle generation.
Race and Multigenerational Wealth Transmission
Examining race differences in the multigenerational transmission of wealth further
intensifies the data limitations we faced in the two-generation case: race differences in
grandparental wealth are dramatic. However, we examine multigenerational persistence in
homeownership by race. As shown in Table 6, 50 percent of the African-American grandparents
in our sample were homeowners in 1969 and 1970, compared to 83 percent of white
grandparents. Two generations later, only 41 percent of African-American adult grandchildren of
homeowners were themselves homeowners, compared to 61 percent of whites. Therefore, we
continue to see greater rates of downward mobility for African-Americans across three
generations, at least in terms of homeownership. At the bottom of the distribution, too, slightly
more than half of the white grandchildren of non-homeowners owned their own homes,
compared to only about one-third of African-American grandchildren.
9 The difference between estimates based on the maternal versus paternal lineage is not statistically significant. Similarly, in our main multigenerational analyses we do not find different associations based on maternal or paternal lineages.

How Rigid is the Wealth Structure and Why? 39
Table 6: Race Differences in Multigenerational Mobility
Channels of Intergenerational and Multigenerational Wealth Transmission
In this final section, we examine the importance of two channels of intergenerational wealth
transmission underlying the two- and three-generational wealth associations: (1) inter-vivos
transfers and bequests and (2) educational attainment. As before, we report results for the older
age group (aged 45-64), which is particularly important for the assessment of the mediating
channels: bequests are received later in life and the asset-building potential of higher education is
also most adequately assessed once these individuals had enough time to accumulate assets
(results for all age groups available from the authors). The results are descriptive rather than
causal, continuing our demographic approach, but they provide suggestive evidence on the
relative contributions of different pathways to the intergenerational transmission of advantage.
As shown in the first section of Table 7, the amount of gifts (inter-vivos transfers) or
inheritances (bequests) over $10,000 received to date explains about one eighth of the observed
intergenerational wealth association (11.9 percent). Considering the overall size of these
transfers among those who received them does not explain appreciably more of the association
(not shown). The quite limited mediating role of transfers and bequests may raise concerns about

How Rigid is the Wealth Structure and Why? 40
limitations in their measurement. For instance, although the panel information used here allows
us to track inter-vivos transfers and bequests across the life-course, one limitation of the survey
item used is that it asks only for transfers of $10,000 or more. We therefore tested two additional
measures of bequests, drawing on separate survey items of inheritances received10 as well as on
indicators of parental and grandparental death as proxy measures of potential bequests.11 Neither
of these specifications suggested a greater role of inter-vivos transfers and bequests in the
intergenerational transmission of wealth. One feasible explanation is that bequests are in fact
concentrated at the top of the wealth distribution and the modal impact of parental death is not
one of an increase in children’s net worth.
Table 7: Channels of Inter‐ and Multigenerational Wealth Transmission Age 45‐64
10 This indicator separately identifies inheritances received in all PSID waves since 1988 and does so without imposing a lower limit. However, this survey item only captures bequests that occurred during the last year and therefore fails to capture a contiguous period of potential bequest receipt since PSID’s switch to biennial interviewing in 1997. 11 The idea is that parental (and grandparental) deaths are a necessary condition for a bequest to occur. The PSID confirms the death of its sample members through linkage to the National Death Index. We distinguish whether both parents / grandparents are recorded to be alive in 2011 (the earliest time we observe offspring wealth), whether one parental / grandparental death is recorded, or whether two parental deaths / two or more grandparental deaths are recorded.

How Rigid is the Wealth Structure and Why? 41
Finally, we assess the mediating role of education. Accounting for the child’s highest
degree received accounts for more than a quarter of the intergenerational wealth association. The
attainment of a college degree alone mediates a fifth of the association (not shown). Together,
education and transfers explain a little more than a third of the two-generation association in
wealth (34.4 percent).
The sample in which we can observe all three generations at older ages, even using the
home value measure of net worth, is quite small (N=349). For this part of the analysis, we cannot
rely on the much larger but younger group of children in the multigenerational sample (N=2,142)
since they are less likely to have received an inheritance and the asset-generating effects of their
educational attainment have not come to full fruition. Given these sample size restrictions, we
are hesitant to draw strong conclusions about the role of these mediating channels across three
generations. However, minimally, they are not inconsistent with the two-generation results: the
fraction of the conditional grandparent-grandchild association explained by parents’ and
children’s education is larger than the fraction explained by parents’ and children’s receipt of
transfers. Thus, compared to our indicators of the role of inter-vivos transfers and bequests, we
conclude that the transmission of wealth through the educational attainment of children, on
average, has a more pronounced role in two generations and suggestively also in three
generations.
CONCLUSION
The distribution of family wealth is highly unequal, yet wealth’s concentration across
generations of the same family lineage has received little scholarly attention. We fill this gap by
documenting a substantial degree of rigidity in the wealth distribution. We draw on new data
from the Panel Study of Income Dynamics to address the life-cycle bias present in the few
existing estimates of intergenerational wealth mobility. We find that intergenerational
correlations in wealth rise across the life course as wealth is accumulated, so that the full extent
of intergenerational similarity in wealth comes to light only once we investigate those aged 45
and above, which has not been possible before. Estimates of intergenerational persistence rise by
about 20 percent when this older age group is considered, compared to younger adults.

How Rigid is the Wealth Structure and Why? 42
Furthermore, unlike prior research, we incorporate the experiences of both parents and
children who are net debtors – roughly one fifth of our second generation. While we replicate a
prior estimate of intergenerational wealth elasticity (Charles and Hurst 2013), both issues – the
age gradient and the influence of debtors – can only be adequately captured through a different
specification of intergenerational association based on rank-rank slopes (Chetty et al. 2014;
Mazumder 2015). Our resulting main estimate of the correlation in wealth between parents and
their children implies that, on average, a 10 percentile point advantage in parents’ wealth
position is associated with a 4 percentile point advantage in the child generation. The size of this
correlation is quite similar to comparable estimates of intergenerational correlations in income
(Mazumder 2015), revealing a similar degree of rigidity in different dimensions of economic
well-being. Thus, as for other measures of economic well-being, stark inequality in wealth is not
counterbalanced by great intergenerational fluidity in wealth.
We also document that intergenerational wealth persistence is particularly high at the top of
the wealth distribution: 44 percent of children from the highest parental wealth quintile end up in
the highest wealth quintiles themselves, and only 30 percent fall into the bottom 60 percent of
the wealth distribution. The concentration of wealth transmission at the top partly accounts for
higher wealth mobility rates among African-Americans compared to whites, since the former are
largely absent from even the top 40 percent of the wealth distribution. However, the greater
overall mobility rates of African-Americans also arise from greater rates of downward mobility
across generations. That is, the few African-American families that have succeeded in
accumulating wealth are less successful in passing that wealth on to their children than white
families.
These racial differences may of course reflect a longer history of the intergenerational
transmission of disadvantage and advantage. More broadly, we provide the first-ever estimates of
multigenerational correlations in the wealth position of U.S. families. Using a multitude of
approaches designed to overcome the current data limitations, our findings are consistent: the
persistence of wealth across three generation is about two-thirds the size of the parent-child
wealth correlation, showing the importance of a longer legacy in the transmission and
concentration of wealth within family lineages. Furthermore, less than half of the grandparent-
grandchild association flows through parental wealth. These findings speak directly to

How Rigid is the Wealth Structure and Why? 43
exhortations in both the stratification literature and the family demography literature to consider
families in broader perspective, recognizing the influence of kin other than parents on children’s
outcomes (Mare 2011; Swartz 2009)
Lastly, we identified two broad channels through which wealth is transmitted across two and
three generations: offspring’s educational attainment and the receipt of bequests and large inter-
vivos transfers. Our findings indicate that a larger part of the inter- and multigenerational
transmission of wealth is established through the provision of educational advantage, which
typically occurs in early adulthood. Inheritances explain a smaller part of intergenerational
wealth correlations. Our results are consistent with Charles and Hurst’s (2003) finding that the
bulk of the intergenerational correlation in wealth is explained by income similarity rather than
transfers. Our findings suggest that investigations of the reproduction of wealth across
generations should pay at least as much attention to early-life, indirect investments by parents in
offspring, including educational attainment, as to direct, later-life transfers, such as bequests. An
exclusive focus on bequests is bound to underestimate the importance of parental wealth for their
children’s ultimate wealth attainment. Future research might explore the role of other types of
early life investments by parents, including those that may be incidental or unconscious, such as
neighborhood characteristics and access to social and cultural capital.
Our results are robust across multiple specification checks. When we adjusted family wealth
for family size, our results were very similar. Likewise, averaging wealth measures across years
to reduce measurement error produced very little change in the estimated associations, reducing
concerns that our main results are attenuated by remaining measurement error. One specification
test with broader implications is our finding that the value of a family’s home is a very good
proxy measure to study the questions addressed here. Our estimates of intergenerational
correlations in home values, even without considering mortgages, replicate estimates based on
net worth. Identifying home values as a potential proxy measure to assess intergenerational
wealth correlations may open vast opportunities for future research using non-survey data
sources such as the home value reports in the publicly available 1940 Census or estimates of
home values provided by real estate companies, such as Zillow. Substantively, of course, it may
also promote a much closer consideration of the links and overlaps of the growing literatures on
wealth, on one side, and on housing and neighborhoods on the other. Future research may seek to
How Rigid is the Wealth Structure and Why? 44
establish whether and to what extent the advantages and disadvantages flowing from housing
wealth are genuine asset ownership effects or housing and neighborhood effects (and vice versa).
We recognize that life-cycle bias may remain a concern for our multigenerational estimates.
Patience and the further ageing of the PSID sample will eventually provide a remedy (potentially
in about a decade from now), just as our two-generation estimates provide a corrective to earlier
two-generation analyses based on relatively young adult offspring. Until then, we consider our
multigenerational findings to provide conservative estimates of the longer-term rigidity in the
wealth distribution, which may be adjusted upward in future research as grandchildren age.
We reiterate that our analyses of channels of transmission are descriptive, and for the three-
generation analyses they are further based on a small sample. It is possible that, rather than
parental wealth causally affecting children’s educational attainment, the prospect of their
children going to college may induce parents to save up (a similar logic could be applied to
inheritances). Grandparent-grandchild wealth associations may not suffer – or at least not to the
same degree – from this kind of problem, unless we assume that grandparental motives for asset
accumulation extend beyond securing educational advantage for their children and additionally
refer to the maintenance of wealth across a longer family lineage.
Finally, we note that intergenerational wealth persistence cannot be interpreted as indicative
of the total degree of inequality in opportunity to attain wealth. The determinants of wealth
attainment are manifold. Although a considerable part of them are tied to the wealth of prior
generations, there are a host of other characteristics of families and environments that shape
wealth attainment. Future research may assess total inequality in wealth opportunities across
families by estimating within-family correlations in wealth, e.g. among siblings or cousins (see
e.g. Hällsten 2014 for Sweden).
Our description of the intergenerational persistence in wealth and its variation across the life-
course, racial groups, and generations provides a comprehensive assessment of an understudied
dimension of societal rigidity. Stratification research has begun to identify wealth as an
important dimension of particularly large and rapidly increasing inequality. Our results caution
that this inequality is bound to be replicated across generations. Given recent increases in wealth
inequality, our research leads us to be skeptical of the ability of future generations to share in
economic prosperity by overcoming the disadvantages related to their wealth origins.

How Rigid is the Wealth Structure and Why? 45
REFERENCES
Adermon, Adrian, Mikael Lindahl, and Daniel Waldenström. 2015. “Intergenerational Wealth Mobility and the Role of Inheritance: Evidence from Multiple Generations.” Unpublished manuscript.
Altonji, Joseph G. and Ulrich Doraszelski. 2005. “The Role of Permanent Income and Demographics in Black/White Differences in Wealth.” Journal of Human Resources 40(1): 1-30.
Avery, Robert B. and Michael S. Rendall. 2002. “Lifetime Inheritances of Three Generations of Whites and Blacks.” American Journal of Sociology 107(5):1300-1346.
Becker, Gary S. and Nigel Tomes. 1979. “An Equilibrium Theory of the Distribuytion of Income and Intergenerational Mobility”. Journal of Political Economy 87(6):1153-1189.
Belley, Philippe and Lance Lochner. 2007. “The Changing Role of Family Income and Ability in Determining Educational Attainment.” NBER Working Paper No. 13527.
Bengston, Vern L. 2001. “Beyond the Nuclear Family: The Increasing Importance of Multigenerational Bonds.” Journal of Marriage and Family 63(1):1-16.
Blau, Peter M, and Otis Dudley Duncan. 1967. The American Occupational Structure. New York: The Free Press.
Black, Sandra E., Paul J. Devereux, Petter Lundborg, and Kaveh Majlesi. 2015. “Poor Little Rich Kids? The Determinants of the Intergenerational Transmission of Wealth.” NBER Working Paper No. 21409.
Blau, Peter M. and Otis Dudley Duncan. 1967. The American Occupational Structure. New York: Wiley.
Bond Huie, Stephanie A., Patrick M. Krueger, Richard G. Rogers, and Robert A. Hummer. 2003. “Wealth, Race, and Mortality.” Social Science Quarterly 84(3):667–84.
Chan,TakWing,andVikkiBoliver.2013.“TheGrandparentsEffectinSocialMobility.EvidencefromBritishBirthCohortStudies.”AmericanSociologicalReview78(4):662–78.
Charles, Kerwin Kofi and Erik Hurst. 2002. "The Transition to Home Ownership and the Black-White Wealth Gap." Review of Economics and Statistics 84(2):281-297.
Charles, Kerwin Kofi and Erik Hurst. 2003. “The Correlation of Wealth across Generations.” Journal of Political Economy 111(6):1155–82.
Charles, Kerwin Kofi, Erik Hurst, and Alexandra Killewald. 2013. "Marital Sorting and Parental Wealth." Demography 50(1):51-70.
Chetty, Raj, Nathaniel Hendren, Patrick Kline, Emmanuel Saez, and Nicholas Turner. 2014. “Is the United States Still a Land of Opportunity? Recent Trends in Intergenerational Mobility.” NBER Working Paper Series No. 19844.
Clark, Gregory. 2014. The Son Also Rises. Surnames and the History of Social Mobility. Princeton. Princeton.
Conley, Dalton. 1999. Being Black, Living in the Red: Race, Wealth, and Social Policy in America. Berkeley: University of California Press.
Conley, Dalton. 2001a. "Capital for College: Parental Assets and Postsecondary Schooling." Sociology of Education 74(1): 59-72.
Conley, Dalton. 2001b. “Decomposing the Black-White Wealth Gap: The Role of Parental Resources, Inheritance, and Investment Dynamics.” Sociological Inquiry 71(1):39-66.
Conley, Dalton and Rebecca Glauber. 2008. Wealth Mobility and Volatility in Black and White. Washington, D.C.: Center for American Progress.
Corcoran, M. 1995. “Rags to Rags: Poverty and Mobility in the United States.” Annual Review of Sociology 21:237-67.

How Rigid is the Wealth Structure and Why? 46
Couch, Kenneth A. and Thomas A. Dunn. 1997. “Intergenerational Correlations in Labor Market Status: A Comparison of the United States and Germany.” Journal of Human Resources 32(1): 210-32.
Dunn, Thomas and Douglas Holtz-Eakin. 2000. “Financial Capital, Human Capital, and the Transition to Self-Employment: Evidence from Intergenerational Links.” Journal of Labor Economics 18(2):282-305.
Edin, Kathryn and Maria Kefalas. 2005. Promises I Can Keep: Why Poor Women Put Motherhood Before Marriage. Berkeley, CA: University of California Press.
Elder, Glen H., Jr. 1994. “Time, Human Agency, and Social Change: Perspectives on the Life Course.” Social Psychology Quarterly 57(1):4-15.
Elwert,Felix,andChristopherWinship.2014.“EndogenousSelectionBias:TheProblemofConditioningonaColliderVariable.”AnnualReviewofSociology
Erikson, Robert and John H. Goldthorpe. 2002. “Intergenerational Inequality: A Sociological Perspective.” Journal of Economic Perspectives 16(3):31-44.
Evans, David S. and Boyan Jovanovic. 1989. “An Estimated Model of Entrepreneurial Choice under Liquidity Constraints.” Journal of Political Economy 97(4):808-27.
Gale, William G. and John Karl Scholz. 1994. “Intergenerational Transfers and the Accumulation of Wealth.” Journal of Economic Perspectives 8(4):145–60.
Hällsten,Martin.2014.“InequalityacrossThreeandFourGenerationsinEgalitarianSweden.1stand2ndCousinCorrelationsinSocio‐EconomicOutcomes.”ResearchinSocialStratificationandMobility35:19–33.
Hansen, Marianne Nordli. 2014. “Self-Made Wealth or Family Wealth? Changes in Intergenerational Wealth Mobility.” Social Forces 93(2):457-81.
Haveman,Robert,andKathrynWilson.2007.“Access,Matriculation,andGraduation.”InEconomicInequalityandHigherEducation.Access,Persistence,andSuccess.editedbyStacyDickert‐ConlinandRossRubenstein.NewYork:RussellSageFoundation.
Hall, Matthew and Kyle Crowder. 2011. "Extended-Family Resources and Racial Inequality in the Transition to Homeownership." Social Science Research 40(6):1534-46.
Hertel,FlorianR.,andOlafGroh‐Samberg.2014.“ClassMobilityAcrossThreeGenerationsintheUSandGermany.”ResearchinSocialStratificationandMobility35:35–52.
Hertz, Tom, Tamara Jayasundera, Patrizio Piraino, Sibel Selcuk, Nicole Smith, and Alina Verashchagina. 2007. “The Inheritance of Educational Inequality: International Comparisons and Fifty-Year Trends.” BE Journal of Economic Analysis and Policy 7(2):1–46.
Jaeger,MadsMeier.2012.“TheExtendedFamilyandChildren’sEducationalSuccess.”AmericanSociologicalReview77(6):903–22.
Jäntti, Markus and Stephen P. Jenkins. 2014. “Income Mobility.” in Handbook of Income Distribution, edited by Anthony B. Atkinson and F. Bourguignon. Elsevier-North Holland.
Kearl, J. R. and Clayne Pope. 1986. “Choices, Rents, and Luck. Economic Mobility of Nineteenth-Century Utah Households.” Pp. 215–60 in Long-Term Factors in American Economic Growth, edited by Stanley L. Engerman and Robert E. Gallman. Chicago: University of Chicago Press.
Keister, Lisa A. 2003. “Sharing the Wealth: The Effect of Siblings on Adults’ Wealth Ownership.” Demography 40(3):521-42.
Keister, Lisa A. and Stephanie Moller. 2000. “Wealth Inequality in the United States.” Annual Review of Sociology 26:63-81.
Killewald, Alexandra. 2013. "Return to Being Black, Living in the Red: A Race Gap in Wealth That Goes Beyond Social Origins." Demography 50(4):1177–95.

How Rigid is the Wealth Structure and Why? 47
Kochhar, Rakesh, Richard Fry, and Paul Taylor. 2011. “Wealth Gaps Rise to Record Highs Between Whites, Blacks and Hispanics.” Pew Social & Demographic Trends. Washington, DC: Pew Research Center.
Kohli, Martin. 2004. “Intergenerational Transfers and Inheritance. A Comparative View.” Annual Review of Gerontology and Geriatrics 24:266–89.
Kotlikoff, Laurence J. and Lawrence H. Summers. 1981. “The Role of Intergenerational Transfers in Aggregate Capital Accumulation.” Journal of Political Economy 89(4):706–32.
Laughlin, Lynda. 2013. Who’s Minding the Kids? Child Care Arrangements: Spring 2011. Current Population Reports, P70-135. Washington, DC: U.S. Census Bureau.
Long, Jason and Joseph Ferrie. 2013. “Intergenerational Occupational Mobility in Great Britain and the United States Since 1850.” American Economic Review 103(4):1109-1137.
Mare, Robert D. 2011. “A Multigenerational View of Inequality.” Demography 48(1):1-23.
Mazumder,Bhashkar.2005.“FortunateSons:NewEstimatesofIntergenerationalMobilityintheUnitedStatesUsingSocialSecurityEarningsData.”ReviewofEconomicsandStatistics87(2):235–55.
Mazumder,Bhashkar.2015.“EstimatingtheIntergenerationalElasticityandRankAssociationsintheUS.OvercomingtheCurrentLimitationsofTaxData.”UnpublishedManuscript.
Menchik, Paul L. 1979. “Inter-Generational Transmission of Inequality. An Empirical Study of Wealth Mobility.” Economica 46(184):349–62.
Mitnik, Pablo, Victoria Bryant, David B. Grusky, and Michael Weber. 2015. “New Estimates of Intergenerational Mobility Using Administrative Data.” Stanford Center on Poverty and Inequality.
Morgan,StephenL,andYoung‐MiKim.2006.“InequalityofConditionsandIntergenerationalMobility.ChangingPatternsofEducationalAttainmentintheUnitedStates.”InMobilityandInequality.FrontiersofResearchinSociologyandEconomics,editedbyStephenLMorgan,DavidBGrusky,andGarySFields,165–94.Stanford:StanfordUniversityPress.
Mulligan, Casey B. 1997. Parental Priorities and Economic Inequality. Chicago: The University of Chicago Press.
Oliver, Melvin L. and Thomas M. Shapiro. 1995. Black Wealth / White Wealth: A New Perspective on Racial Inequality. New York: Routledge.
Orr, Amy J. 2003. “Black-White Differences in Achievement: The Importance of Wealth.” Sociology of Education 76(4):281–304.
Panel Study of Income Dynamics, public use dataset. 2015. Produced and distributed by the Survey Research Center, Institute for Social Research, University of Michigan, Ann Arbor, MI.
Pfeffer, Fabian T. 2008. “Persistent Inequality in Educational Attainment and Its Institutional Context.” European Sociological Review 24(5):543–65.
Pfeffer, Fabian T. 2011. “Status Attainment and Wealth in the United States and Germany.” Pp. 109–37 in Persistence, Privilege, and Parenting, edited by Timothy M Smeeding, Robert Erikson, and Markus Jäntti. New York: Russell Sage Foundation.
Pfeffer, Fabian T. 2014. “Multigenerational Approaches to Social Mobility. A Multifaceted Research Agenda.” Research in Social Stratification and Mobility 35:1–12.
Pfeffer, Fabian T., Robert F. Schoeni, Arthur B. Kennickell, and Patricia Andreski. 2014. “Measuring Wealth and Wealth Inequality: Comparing Two U.S. Surveys.” PSID Technical Series Paper #14-03.
Pfeffer, Fabian T., Sheldon H. Danziger, and Robert F. Schoeni. 2013. “Wealth Disparities Before and After the Great Recession.” Annals of the American Academy of Political and Social Science 650(1):98–123.

How Rigid is the Wealth Structure and Why? 48
Piketty, Thomas. 2014. Capital in the Twenty-First Century. Cambridge, MA: Belknap Press.
Rosenfeld, Rachel A. 1978. “Women’s Intergenerational Occupational Mobility.” American Sociological Review 43(1):36-46.
Schneider, Daniel. 2011. “Wealth and the Marital Divide.” American Journal of Sociology 117(2):627–67.
Schoeni,RobertF.,andKarenE.Ross.2005.“MaterialAssistancefromFamiliesduringtheTransitiontoAdulthood.”InOntheFrontierofAdulthood,editedbyRichardA.SetterstenandFrankF.Furstenberg,396–416.
Sharkey, Patrick. 2008. “The Intergenerational Transmission of Context.” American Journal of Sociology 113(4):931-969.
Sharkey,Patrick,andFelixElwert.2011.“TheLegacyofDisadvantage.MultigenerationalNeighborhoodEffectsonCognitiveAbility.”AmericanJournalofSociology116:1934–81.
Smock, Pamela J., Wendy D. Manning, and Meredith Porter. 2005. “‘Everything’s There Except Money’: How Money Shapes Decisions to Marry Among Cohabitors.” Journal of Marriage and Family 67(3):680-96.
Solon,Gary.1992.“IntergenerationalIncomeMobilityintheUnitedStates.”AmericanEconomicReview82(3):393–408.
Solon, Gary. 1999. “Intergenerational Mobility in the Labor Market.” Pp. 1761–1800 in Handbook of Labor Economics, vol. 3, edited by O. Ashenfelter and D.Card. Oxford: Elsevier.
Spilerman, Seymour. 2000. “Wealth and Stratification Processes.” Annual Review of Sociology 26:497-524.
Swartz, Teresa Toguchi. 2009. “Intergenerational Family Relations in Adulthood: Patterns, Variations, and Implications in the Contemporary United States.” Annual Review of Sociology 35:191-212.
Torche,Florencia.2015.“AnalysesofIntergenerationalMobilityAnInterdisciplinaryReview.”TheANNALSoftheAmericanAcademyofPoliticalandSocialScience657(1):37–62.
Turner, Tracy M. and Heather Luea. 2009. "Homeownership, Wealth Accumulation and Income Status." Journal of Housing Economics 18(2):104-114.
U.S. Census Bureau. 2015. “America’s Families and Living Arrangements: 2014: Children (C table series).” Washington, DC: U.S. Census Bureau. Retrieved September 1, 2015 (https://www.census.gov/hhes/families/data/cps2014C.html).
Wilson, William Julius. 1987. The Truly Disadvantaged: The Inner City, the Underclass, and Public Policy. Chicago: University of Chicago Press.
Warren, John Robert and Robert M. Hauser. 1997. “Social Stratification across Three Generations: New Evidence from the Wisconsin Longitudinal Study.” American Sociological Review 62(4):561-72.
Wightman,Patrick,andSheldonDanziger.2014.“Multi‐GenerationalIncomeDisadvantageandtheEducationalAttainmentofYoungAdults.”ResearchinSocialStratificationandMobility35(March):53–69.
Wolff,EdwardN.2014.“HouseholdWealthTrendsintheUnitedStates,1962‐2013:WhatHappenedovertheGreatRecession?”NationalBureauofEconomicResearchWorkingPaper
Xie,Yu.1992.“TheLog‐MultiplicativeLayerEffectModelforComparingMobilityTables”.AmericanSociologicalReview57(3):380‐395
Zagorsky,JayL.2005.“MarriageandDivorce’sImpactonWealth.”JournalofSociology41(4):406‐24.

How Rigid is the Wealth Structure and Why? 49
Appendix Table A.1. Multigenerational Elasticities