Embed Size (px)
Citation preview
How Repression Affects Public Perceptions of Police:Evidence from a Natural Experiment in Uganda
Travis Curtice∗
February 18, 2021
Abstract
What are the effects of state repression on public perceptions of police? And towhat extent are these effects uniform or conditional on individuals’ loyalty to politicalauthorities? I argue that repression by the police negatively affects how people evaluatethe police, especially among those who do not support the ruling party. People whooppose the regime are more likely to fear the police following a repressive event rela-tive to regime supporters. To test this argument, I leverage a unique research designopportunity that emerges from the social media tax protest led by Robert Kyagu-lanyi Ssentamu (also known as Bobi Wine) and subsequent selective repression by theUganda Police Force while a nationally representative survey on police and securitywas being administered in Uganda. I demonstrate selective repression of protestersdecreased support for the police. These effects are largely driven by political loyalty;repression has a stronger effect on how members of the opposition evaluate the policerelative to incumbent supporters.
Conditional Accept at The Journal of Conflict Resolution
Keywords: Law and order, police, protests, collective action, repression, Uganda
Word Count: 11,000
Replication files, supplementary material and online appendix will be available on theauthor’s website.
∗Correspondence: [email protected]. Dickey Center U.S. Foreign Policy and Interna-tional Security Fellow at Dartmouth College. Mildmay Uganda Research Ethics Committee (MUREC), anethics review committee accredited by the Uganda National Council of Science and Technology approvedthe study (#REC REF 0204-2017) and the Uganda National Council of Science and Technology (REFSS4302). Additionally, Emory University’s Institutional Review Board declared the study exempt under 45CFR 46.101 (b)(2) REF IRB00104491. Funding provided by the Institute of Developing Nations, LaneyGraduate School at Emory University,the Andrew W. Mellon Foundation (Mellon PhD Intervention), andNational Science Foundation (#1343123). Thanks to Jennifer Gandhi, David Davis, Danielle Jung, JasonLyall, Ben Valentino, Jeffrey Friedman, Courtenay Conrad, Kristine Eck, Charles Crabtree, Jonathan Mum-molo, and Dartmouth’s IR Dickey Center Seminar Series, the Emory Comparative Politics Reading Groupand Empirical Study of Conflict (ESOC) Annual Meeting Virtual Session on Crime and Policing for helpfulcomments and suggestions on previous drafts of this paper.
1 Introduction
What are the effects of state repression on public perceptions of the institution that per-
petrates it?1 Does state repression by the police at the national-level affect individual-level
support for the police? Repression by the government occurs across an array of contexts
and political settings, making it one of the most common forms of violence against civil-
ians. Existing studies focus on the effects of repression on political participation (Davenport
et al. 2019, Ritter and Conrad 2016).2 If state repression decreases support for police, it has
implications for the ability of police to provide law and order and deter crime.
However, the political effects of repression are debated. On one hand, state repression
is meant to punish political disloyalty, deter acts of dissent and induce obedience (Lichbach
1987, Lyall 2009, Ritter and Conrad 2016, Young 2019, Zhukov and Talibova 2018). On
the other, state repression can incite political opposition, mobilizing future collective action
(Balcells 2012, Curtice and Behlendorf 2020, Finkel 2015, Gurr 2015). The effectiveness of
repression is shaped by governments’ repressive tactics: targeting clandestine activities might
decrease dissent but using it against overt, collective challenges might escalate dissent (Sul-
livan 2016). Additionally, repression and dissent depend on a state’s infrastructural power.
More developed infrastructural power might decrease reactive repression by police enabling
police to preemptively limit dissent without shifting to excessive acts of state repression
(Sullivan and Liu 2020). But we know less about the relationship between repression and
public perception of the institution tasked with perpetrating it.
In many unconsolidated democracies and autocracies, security institutions like the police
and military have two roles: first, they are responsible for providing security and law and
order; and second, they repress dissent to maintain the political status quo. Internal security
1Repression is defined as “physical sanctions against an individual or organization, within the territorialjurisdiction of the state, for the purpose of imposing a cost on the target as well as deterring specific activitiesand/or beliefs perceived to be challenging to government personnel, practices or institutions” (Davenport2007, 2).
2More generally, exposure to violence and repression has both short-term and long-term effects on in-dividuals’ relationship to the state (Blattman 2009, Bratton and Masunungure 2007, Rozenas and Zhukov2019, Zhukov and Talibova 2018).
institutions used by political authorities to repress dissent and enforce the political status
quo are also responsible for deterring crime, enforcing law and order and providing security
more broadly.3
For many countries, the police forces are the state agents most likely to use repression
against civilians (Curtice and Behlendorf 2020, Davenport 2020). Examining how repression
affects people’s support for the police is crucial to understanding the provision of law and
order, especially when security institutions rely on cooperation from individuals. When
political authorities rely on the police to repress dissent, it has implications beyond deterring
dissent. As a tool used by political authorities to inflict fear and reduce dissent (Young 2019),
repression likely increases people’s fear of the police. Relative to the military, police forces
rely more heavily on people’s willingness to cooperate with them to be effective. The more
people fear the police as repressive agents of the state, the less likely they are to support
them. People who fear repression, for example, are likely to avoid interacting with security
forces who employ it. Individuals refusing to voluntarily provide information, or even report
crimes, makes routine acts of policing more difficult. People’s willingness to cooperate with
police depends on public perceptions of the police as legitimate authorities.
However, the theoretical and empirical relationship between repression and its effects on
public perception of police remains an open question.4 Repression by police might have a
uniform negative effect on the public’s perceptions of the police as legitimate authorities.
Alternatively, people might view acts of repression through motivated reasoning, depending
on whether they support the regime. People who support the regime might view repression
as legitimate while people who oppose the regime see it as illegitimate. Then, repression
might have a positive effect on assessments of incumbent supporters and a negative effect
3These security institutions include both formal institutions like the police and military forces andinformal institutions such as elite police squads and pro-government militias. (Blaydes 2018, DeMeritt 2015,Greitens 2016, Mitchell, Carey and Butler 2014).
4A related study in Liberia by Blair and Morse (2020) examines how exposure to violence during civilwar shape citizens’ attitudes towards the police, finding that rebel-perpetrated violence increases trust inpolice, whereas state-violence during the civil war period had no effect on attitudes toward the police. Asimilar study in Catalonia studies the effects of repression on the public (Balcells, Dorsey and Tellez 2020).
2
on evaluations by supporters.
I argue that when political authorities rely on the police to repress dissent, people are
less likely to view the police as legitimate authorities. The extent to which people fear being
repressed varies by whether they support or oppose the regime. People are more likely to
fear the police in general; however, support for the ruling party should condition its effect.
Incumbent supporters are less concerned about experiencing repression and consequently less
likely to fear repression. However, opposition supporters are more likely to fear experiencing
repression. The effects of repression on public perception should be strongest among those
who are more likely to fear experiencing political violence from the state.
To test these claims, I empirically examine the effect of repression by the police on public
perceptions of police in Uganda. I estimate the effect of selective repression by leveraging
a unique research design opportunity that emerges from the social media tax protest led by
Robert Kyagulanyi Ssentamu (also known as Bobi Wine) and his subsequent arrest by the
Uganda Police Force while a nationally representative survey on police and security was being
administered in Uganda. I find selective repression of these protesters by police decreased
support for the police, even among those who did not directly experience the repression.
Following the repression of Bobi Wine and the Social Media Tax protests, people viewed the
police as less legitimate authorities. Additionally, these effects are largely driven by political
loyalty and perceptions of normative alignment with the police. The effects are weakest
among those who support the incumbent.5
This paper makes several significant contributions to research on political violence (Ka-
lyvas 2006, Lyall 2009), repression (Davenport et al. 2019, Ritter and Conrad 2016), and
policing (Blair, Karim and Morse 2019). First, these results demonstrate that the negative
consequences of repression move beyond political behavior (Balcells 2012, Bautista 2015),
rather repression by police undermines support for the state institutions responsible for
5In the study, respondents were asked which party they support during a baseline survey that occurredpre-treatment. So the protests and arrests could not affect how people responded to the party supportquestion.
3
providing security. The effects of repression on civilian-police interactions matter because
police rely on individuals to be effective; higher support leads to more cooperation (i.e.,
better information being provided to the police), which leads to more effective security oper-
ations. Second, selective repression targeted at opposition political elites and protestors has
individual-level effects even among those who were not engaged in political dissent. Selective
violence might be an effective tool to induce political loyalty (Blaydes 2018, Kalyvas 2006),
but it still adversely affects the way people view the police. Third, these results suggest
that political authorities face a tradeoff: they can rely on the police to repress dissent but
doing so undermines people’s trust in the police – even those who support the regime – and
subsequently decreases the co-production of law and order and security.
2 Repression and Police Legitimacy
In many contexts, political authorities use members of the security apparatus to repress
dissent. Several governments employ their police force to suppress and control opposition
movements. The Chinese government relies on their police and non-state security institu-
tions to repress Uighur culture and traditions (Ong 2015). Authoritarian governments in
Burundi, Belarus, Ethiopia, Rwanda, Tanzania, and Zimbabwe have used their police to
restrict public spaces associated with political dissent, intimidating opposition supporters
during elections, arresting and even torturing political opposition leaders. Since 2013, police
in Egypt have imprisoned thousands of Islamist opponents, as well as numerous liberal ac-
tivists and journalists. In non-democracies where political authorities are not committed to
the democratic transfer of power, people view actions taken by police through a broader po-
litical lens of the state. Acts of repression by members of the security apparatus should affect
both people’s perceptions of those who ordered the repression and the institution responsible
for implementing it.
However, most theoretical and empirical studies of repression focus on its political effects
4
(i.e., how people view political authorities) rather than its effect on perception of those who
implemented it. Existing studies have examined the relationship between repression and
dissent (Davenport et al. 2019).6 Others focus on the political effects of repression and
exposure to violence (Blattman 2009, Bratton and Masunungure 2007, Gonzalez and Miguel
2015, Rozenas and Zhukov 2019, Zhukov and Talibova 2018). An important theoretical
and empirical limitation of existing studies of the effects of state repression on political
participation is the assumption that political authorities and the security apparatus act
as a unitary actor, considering whether indiscriminate or mass repression affect political
behavior of civilians. Consequently, we know less about how decisions by political authorities
to employ various security institutions to repress dissent affects people’s support for those
security institutions. This study examines the second dynamic: how repression by the police
affects public perception of the police.
Exploring the relationship between the political authorities, the security apparatus, and
the civilians to answer the question of “how individuals relate to the security apparatus”
is foundational to theories of government and state development. The main purpose of
government is to provide public goods. Of the many goods the state provides, such as
healthcare and education, the provision of security may be one of the most important because
without law and order society remains in relative anarchy (Hobbes 1946, Weber 1946, Wilson
1978).7 Even in non-democracies, regimes see their ability to provide law and order as a
cornerstone of legitimacy and economic development.
However, the co-production of domestic security depends on a set of three actors. The first
set of actors are political authorities who are in charge of the government. These actors are
tasked with legislating and executing laws to run the government and ensure development.
As a function of their authority, they delegate the use of force to agents who are tasked with
upholding and enforcing the laws (Blaydes 2018, Greitens 2016, Hassan 2017, Svolik 2012).
6See for example, Carey (2006), Davenport (2007), Gurr (2015), Henderson (1991), Lichbach (1987),Moore (2000), and Nordas and Davenport (2013).
7A Weberian definition considers the state the institution that “(successfully) claims the monopoly ofthe legitimate use of physical force within a given territory” (Weber 1946, 78).
5
The second set of actors are the security apparatus who are tasked with the capacity and
directives to enforce the law. In the modern state, the police are the central actor responsible
for providing law and order (Blair, Karim and Morse 2019, Tyler 2006). The third set of
actors are the civilians who live within the given territory of the state. They must decide
whether to comply and cooperate with the security agents they interact with on a day-to-
day basis. To the extent that political authorities relying on police to repress dissent might
influence people’s perception of the legitimacy of police – determining who cooperates with
police in the provision of law and order – the effects of state repression on public perception
of police is of significant importance to our theories of governance and development.
Daily encounters between citizens and members of the police force are key to state de-
velopment (Mazerolle et al. 2013, Wilson 1978). For many citizens, encounters with the
police are the most likely interactions that people have with agents of the state (Lerman and
Weaver 2014). As a consequence, the police and political authorities both rely on cooperation
with the community to effectively accomplish their objectives (Skogan and Frydl 2004, Tyler
2006, Tyler and Fagan 2008). This cooperation involves citizens organizing neighborhood
watches, taking note of suspicious activity, and reporting crimes.Information sharing and
gathering is central to policing. Arriola et al. (2020) argue that fragmentation of police
forces can undermine information sharing and coordinated action, exacerbating conflict.
Yet, the structure and behavior of police forces also has implications for how people
interact with the police. Critically, the police rely on information supplied by community
members to prevent and solve crimes. They can receive this information only if citizens
are willing to interact with them to provide it. People cooperate more with police when
they trust them and view them as legitimate authorities (Nagin and Telep 2017, Tyler
and Fagan 2008). Legitimacy is a function of whether or not individuals trust the police.8
The legitimacy argument suggests that the “police can gain leverage for the co-production of
8I define legitimacy as “a feeling of obligation to obey the law and to defer to the decisions made by legalauthorities” (Tyler and Fagan 2008, 235) Certainly, legitimacy must be seen as a multi-dimensional concept(Beetham 1991, Tyler 2006). Accepting the legitimacy of authority is the belief that authorities should beobeyed and individuals should defer to that authority.
6
security by inculcating the popular perception that their actions and decisions are legitimate”
(Tyler and Fagan 2008, 235). The legitimacy-based framework linking legitimacy, compliance
and cooperation generalizes across several policing contexts.9 People who view the police as
legitimate should be more likely to do what they say, obeying police directives and showing
deference even if individuals do not agree.
One reason why people are unlikely to cooperate with police is because they fear the
outcome of their interactions.10 Individuals who have negative interactions with the police
are less likely to trust them, especially if these individuals are from minoritized or politi-
cally marginalized groups. Existing work within criminology, for example, often focuses on
apolitical forms of violence that police officers employ against individuals. Individuals see
the police as less legitimate and are less likely to cooperate when the police behave in ways
that are considered procedurally unfair or when the police are normatively misaligned with
the community (Mazerolle et al. 2013).11 Violations to procedural fairness or normative
alignment undermine police legitimacy, precisely because they increase fear and mistrust
in the police (Skogan and Frydl 2004, Tyler 2003, 2004).12 When police act in ways that
people believe are procedurally unfair, people will be more likely to fear encountering them.
Similarly, when police act in ways that undermine their relationship to the communities they
are policing, community members are more likely to believe that the police will engage in
excessive force.
However, one important dimension less explored in the criminology literature is the way
that political authorities rely on the police to repress dissent and the effect this might have
on people’s perception of the police. This study focuses explicitly on politicized police action
9See for example, studies on the United Kingdom (Jackson et al. 2012, Tankebe 2013), Ghana (Tankebe2009), Hong Kong (Cheng 2015), Israel (Jonathan-Zamir and Harpaz 2014).
10Certainly, in some settings, fear might increase compliance and cooperation; however, this is a separatemechanism than cooperation based on support for the police shaped by perceptions of their legitimacy.
11Procedural justice relates to judgments about the manner in which authority is exercised, includingquality of decision-making such as neutrality and applying rules consistently in addition to judgments aboutthe quality of interpersonal treatment: respect, politeness, and consideration of one’s views. Normativealignment reflects that the police share values with members of the community.
12Lerman and Weaver (2014) find that a high degree of stops involving the use of force, especially whenthey do not result in an arrest, have a chilling effect on neighborhood-level outreach to local government.
7
– coercive action taken by the police on behalf of political authorities to repress political
opponents.
Coercive violence by the state often generates fear, which shapes people’s willingness
to engage in dissent (Young 2019). Fear of experiencing abuse likely determines whether
people view the police as legitimate authorities. Fear and mistrust of the police should
decrease people’s willingness to interact with police, undermining the police’s ability to
gather information, investigate crimes, and deter crimes. Political authorities using violence
to repress dissent may be perceived as inherently illegitimate to citizens, even those who
support the regime (Lupu and Wallace 2019).13 Coercion against protestors can make people
doubt their own loyalty to the ruling regime and question whether the security forces serve
the interests of the citizens or the regimes, including their ability and willingness to protect
them (Lupu and Wallace 2019). This is especially the case with escalating violence that
becomes more indiscriminate. During indiscriminate repression citizens “can no longer assure
themselves of immunity from repression by simply remaining politically inert” (Mason and
Krane 1989, 176). If people see human rights violations by the police, we should observe
police abuse negatively shaping whether people believe the police treat individuals with
dignity and respect and their expectations about whether the police make fair and impartial
decisions.
Hypothesis 1. (Police Repression): State repression by the police decreases support for the
police.
3 Partisanship, Fear, and Motivated Reasoning
There are several reasons why the effects of repression on public perceptions might vary
depending on the attitudes and beliefs of individuals. The use of fear to control dissent is a go-
13Governments require consent from citizens; however, this support depends on the perceived fairnessof the government’s conduct. As Levi (1997, 16) argues “when citizens believe government actors promoteimmoral policies, have ignored their interests, or have actually betrayed them, citizens are unlikely to feelobligated to comply.”
8
to strategy for political authorities in non-democracies. However, mistrust of the government
is unlikely to be normally distributed in society. The more people fear and mistrust the
police, the more likely they are to see the police as illegitimate authorities. Accordingly,
state repression is likely to have heterogeneous effects on individuals’ perceptions of the
police depending on whether they support or oppose the political authorities. First, people
might have a stronger negative reaction to repression, if they fear repression more (i.e.,
they political oppose the incumbent government). Second, people might interpret repression
through a motivated reasoning lens, justifying or supporting repression if it supports the
political status quo. This section explores these two possibilities.
3.1 Partisanship and Fear
Individuals’ loyalty to political authorities might affect how they respond to repression by
police. Based on the theoretical framework above, I expect that political loyalty to the
regime moderates the effect of repression on perceptions of the police based on whether or
not people believe they are likely to experience repression. People who support the political
authorities by attending pro-regime rallies, campaigning for candidates, and joining the
ruling party should be less likely to fear repression. Alternatively, people who are engaged in
collective action opposing the political status quo are more likely to fear experiencing future
repression. Consequently, people who identify as regime supporters should be less likely to
fear repression relative to non-supporters.
Hypothesis 2. (Police Repression Conditional on Partisanship): The extent to which re-
pression by police decreases public support for the police is larger when the respondent supports
the opposition.
9
3.2 Partisanship and Motivated Reasoning
An alternative perspective based on motivated reasoning might predict that people interpret
repressive action based on their support for or opposition to the political authorities who
ordered the repression. The basic idea of motivated reasoning is that individuals often form
opinions based on their existing values, beliefs, identities, and attitudes. One possibility is
that people might view actions done by the police through a partisan lens.14
Following the logic of motivated reasoning, people might interpret actions taken by the
police as legitimate or not depending on whether they achieve or challenge their political
preferences. Beliefs about whether or not repressive action taken by the police is legitimate
depends on a partisan lens. Individuals supporting the ruling political authorities might
view political opponents engaging in collective action as social deviants disturbing social
order. People who are loyal to the political authorities should support state repression by
the police, as those actions might be perceived as necessary to maintain the political status
quo. From this perspective, police using force to deter dissent should increase support for
the police among some individuals who politically align with the authorities.
Alternatively, people who do not politically identify with the political authorities should
be less likely to justify repression, seeing any act of repression by the police as a clear violation
of the role of police in society. Individuals who do not identify as loyal to the incumbent
regime are relatively more likely to support challenges to the status quo, seeing repression
as unjustifiable. People who oppose the regime are more likely to see political violence by
the police, even selective repression, as a signal that the police are aligned with the political
authorities rather than the community they are meant to be protecting. Even if they do not
directly fear repression, opposition supporters are likely to see repression by the police as
illegitimate.
Hypothesis 3. (Motivated Reasoning: Conditional Effect of Incumbent Support): Repres-
14For work on partisanship and motivated reasoning, see (Leeper and Slothuus 2014, Slothuus andDe Vreese 2010).
10
sion by the police increases support for the police among incumbent supporters.
Hypothesis 4. (Motivated Reasoning: Conditional Effect of Opposition Support): Repres-
sion by the police decreases support for the police among incumbent supporters.
4 Context: The Social Media Tax Protests and Selective Repression
I test my theory of selective repression on perceptions of police legitimacy with evidence
from the Social Media Tax Protests in Uganda on July 11, 2018. To understand the selective
repression of the Social Media Tax Protests in Uganda, it is necessary to understand the
broader political context. Yoweri Museveni has maintained control of Uganda since 1986
alongside his incumbent party, the National Resistance Movement.15 Although Museveni
won the last three elections with an average vote-share of 60.27%, elections in Uganda were
generally panned by international and domestic observers as lacking electoral credibility.
Human rights are severely restricted and in many cases violated.16
Politics as usual shifted in Uganda in 2017 when Robert Kyagulanyi Ssentamu, also
known as Bobi Wine and the Ghetto President, announced his plans to compete in the
upcoming by-election for Kyaddondo East Constituency. Well-known throughout Uganda
as a famous musician, performer, and actor, Bobi Wine’s decision to campaign for parliament
was not a surprise. His music became increasingly political following the controversial 2016
presidential election. Wine used his music and social media platform as a venue to call for
political reform. However, as a political neophyte, his campaign was met with broad dismissal
by much of the political establishment in Kampala and few took his candidacy seriously. The
Kyaddondo East Constituency had two well-established candidates competing for it (Sitenda
Sebalu of the incumbent ruling National Resistance Movement party and Apollo Kantinti of
15Multiparty elections were first held in 2006 after 92% of voters approved the introduction of a multipartysystem by referendum in July 2005. Only 42% of the electorate voted in the 2005 referendum but those whodid vote wanted a marked departure from the 2000 referendum where 90.7% voters wanted a “Movement”not a “Multiparty” political system.
16Political freedoms including electoral democracy, access to information and justice, and human rightsprotections remain limited and frequently violated by the regime.
11
the dominant opposition Forum for Democratic Change party) in addition to two additional
independent candidates. Wine’s electoral campaign strategy included combining a rigorous
door-to-door walking campaign and substantial social media presence relative to many of the
established candidates. Wine leveraged his social media presence and door-to-door walking
campaign to a landslide victory.17 Wine’s rise to political office threatened the 33-year-
old government led by President Yoweri Museveni and the National Resistance Movement.
His social media presence, ability to energize crowds, and commitment to political reform
contrasted starkly with the incumbent administration.
In March 2018, in part in response to Wine’s electoral success, the president of Uganda
gave a directive that all social media platforms would be taxed. Broadly seen as a mechanism
used by political authorities to repress political freedom, the new Over-The-Top Tax was de-
signed to to raise resources “to cope with the consequences” of social media users’ “opinions,
prejudices, [and] insults.”18 For many in Uganda, WhatsApp, Twitter, and Facebook among
other social media platforms were a major source of news and political information. The
heightened exposure to information had reportedly led Ugandans to become more critical
about political conditions in the country.19 The Over-The-Top tax on WhatsApp, Twitter,
and Facebook, among other sites, required users to pay a daily fee of 200 Ugandan Shillings
(USD 0.05). This was not the first time political authorities attempted to control the flow of
information via social media platforms. In 2016, the president ordered all social media sites
to be shut down during the elections to control the flow of information. As a mechanism of
social control, the Social Media Tax was implemented on July 1, 2018.20
On July 11, 2018 a group of political activists organized by Bobi Wine gathered in
17Bobi Wine won 25,659 votes with Ssebalu and Kantinti receiving only 4,566 votes 1,832 votes, respec-tively. The two other independent candidates together received only 952 votes.
18https://cipesa.org/2018/07/uganda-blocks-access-to-social-media-vpns-and-dating-sites-as-new-tax-takes-effect/
19https://www.theguardian.com/global-development/2019/feb/27/millions-of-ugandans-quit-internet-after-introduction-of-social-media-tax-free-speech
20At USD 0.05 per day, each user must pay approximately USD 1.50 per month in fees to access the socialmedia services, a rate that is prohibitive since the average revenue per user of telecom services at the timein Uganda was an estimated USD 2.5 per month.
12
Kampala to protest the Social Media Tax. Political authorities directed the Uganda Police
Force to use force to break up the protest. The police used tear gas and live bullets to break
up the protest. At least three protestors were arrested and remanded to Luzira Prison.
Following the clash with the police, the Directorate of Public Prosecutions issued charges
of assault and theft against several protesters including Bobi Wine, his bodyguard (Eddy
Ssebufu), and two journalists (Raymond Mujuni and Joel Ssenyonyi).21 Wine was detained
and interrogated for more than 8 hours at the Central Police Station in Kampala. The
coercive force used against the protestors was selective repression meant to deter collective
action against the new social media tax. The security apparatus responsible for implementing
it was the national police force. The police justified their actions by saying that Wine and
the protestors had not gained permission to publicly assemble and charging protesters with
assaulting members of the police and theft of police property including handcuffs. The
selective state repression by the police of the Social Media Tax Protest is the type of violence
that is likely to undermine public perceptions of police legitimacy depending on individuals’
political loyalty. In the next section, I explain the research design and data I employ to test
my theory by leveraging this incident of selective repression.
5 Research Design
This study uses an unexpected event during surveys design approach to causal inference
to estimate the effect of selective repression of the social media tax protests on individu-
als’ perceptions of police legitimacy (Munoz, Falco-Gimeno and Hernandez 2019). Next, I
summarize my identification strategy, data, measures, and model specifications.
21At least three other protestors were taken in to custody over the same charges, including David Lule,Julius Katongole and Nyanzi Ssentamu.
13
5.1 Identification strategy and data
I employ a unique research design opportunity that comes from the unexpected police clashes
with the social media tax protesters while I was fielding a nationally representative survey on
security and policing was being administered across Uganda. I consider participants surveyed
before the selective repression of the protesters on July 11 as assigned to the control group
and respondents interviewed on or after July 11 as assigned to the treatment group.22 The
timing of when respondents would be interviewed was determined at random without any
knowledge of the social media tax protests occurring. Importantly, the timing of the selective
repressive event did not influence the administration of the survey.
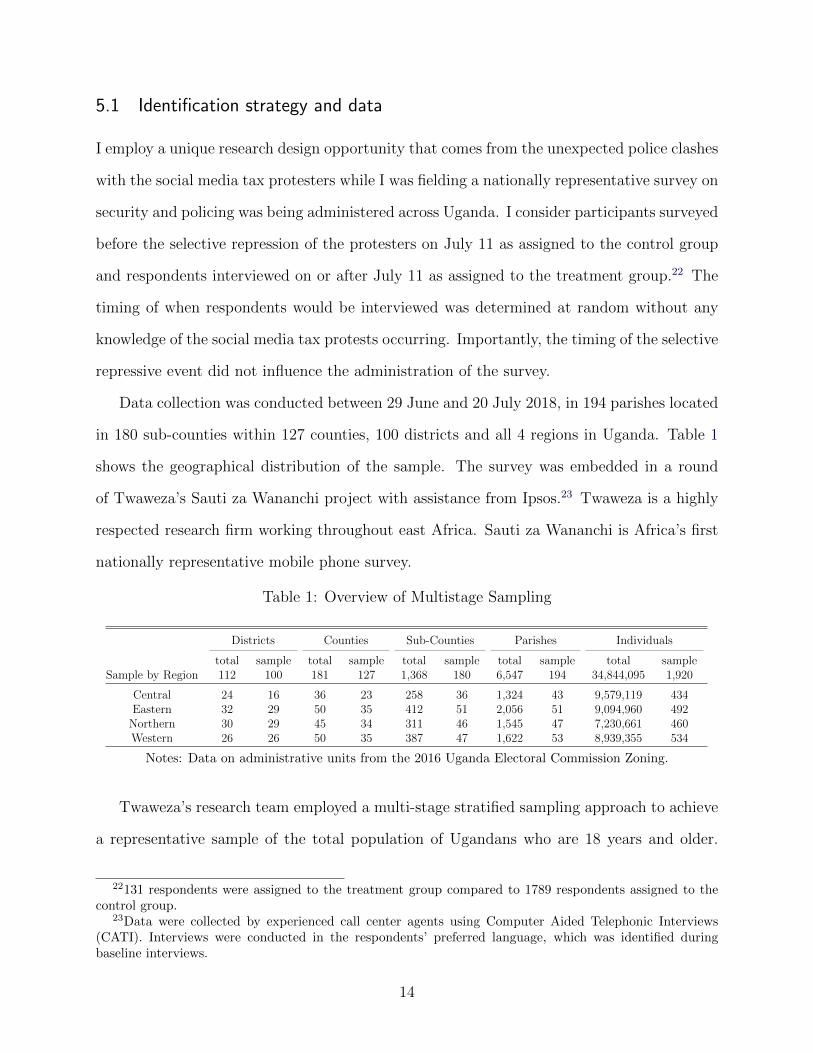
Data collection was conducted between 29 June and 20 July 2018, in 194 parishes located
in 180 sub-counties within 127 counties, 100 districts and all 4 regions in Uganda. Table 1
shows the geographical distribution of the sample. The survey was embedded in a round
of Twaweza’s Sauti za Wananchi project with assistance from Ipsos.23 Twaweza is a highly
respected research firm working throughout east Africa. Sauti za Wananchi is Africa’s first
nationally representative mobile phone survey.
Table 1: Overview of Multistage Sampling
Districts Counties Sub-Counties Parishes Individuals
total sample total sample total sample total sample total sampleSample by Region 112 100 181 127 1,368 180 6,547 194 34,844,095 1,920
Central 24 16 36 23 258 36 1,324 43 9,579,119 434Eastern 32 29 50 35 412 51 2,056 51 9,094,960 492
Northern 30 29 45 34 311 46 1,545 47 7,230,661 460Western 26 26 50 35 387 47 1,622 53 8,939,355 534
Notes: Data on administrative units from the 2016 Uganda Electoral Commission Zoning.
Twaweza’s research team employed a multi-stage stratified sampling approach to achieve
a representative sample of the total population of Ugandans who are 18 years and older.
22131 respondents were assigned to the treatment group compared to 1789 respondents assigned to thecontrol group.
23Data were collected by experienced call center agents using Computer Aided Telephonic Interviews(CATI). Interviews were conducted in the respondents’ preferred language, which was identified duringbaseline interviews.
14
The sample frame is based on the 2014 Uganda Population and Housing Census.24 There
was a high participation rate in the study (1,920 of 2,000 respondents participated).
5.2 Measurement
I employ two measures of police support as my main dependent variables. Respondents were
asked whether they agreed with two statements regarding the police: 1) “The police in your
community are legitimate authorities and you should do what they tell you to do.” 2) “You
should do what the police tell you even if you do not understand or agree with the reasons.”
These two measures refer to the legitimacy of police and whether people feel obligated
to cooperate with them.25 The first captures whether respondents perceive the police as
legitimate and their obligation to cooperate with them. The second measure focuses on
whether individuals feel obligated to comply with police, regardless of whether they agree
with the directive. Responses to these direct questions were measured with a five-point
ordinal scale from “strongly agree,” “agree,” “neither”, “disagree,” to “strongly disagree.”
In addition to the main dependent variables, I employ four measures capturing whether
people view the police as procedurally fair or normatively aligned with the community as
alternative dependent variables.
Incumbent support is a binary indicator coded as 1 if the respondent stated that the
National Resistance Movement is the political party they feel closest to and 0 otherwise.26
Additionally, I consider an alternative measure: “If the election were held today, which po-
litical party will you support or vote for.” Similarly, if respondents said they would vote for
the NRM, I coded this second measure as Incumbent vote and 0 otherwise. This second set
of analyses using Incumbent vote are reported in the online appendix.27 Control variables
24The baseline sample was selected to be a representative cross-section of all adult citizens in Uganda.Twaweza explains the multi-stage sampling design of Sauti za Wananchi in Twaweza’s technical paper. Thebaseline data were collected in person; however, the round on security and policing that I designed was doneby phone.
25These measures of policy legitimacy (peoples people’s duty to obey) were developed by Knight andSchwartzberg (2019), Trinkner, Jackson and Tyler (2017).
2668% of respondents identified as supporting the NRM.27One threat to inference would be if repression affected people’s willingness to identify with the oppo-
15
include participants’ self-reported age, gender, education level, and income status. Addition-
ally, I control for whether the respondent lives in an urban or rural setting. Since exposure
to crime, number of police officers deployed, and other potential confounders like prior state
repression could affect people’s perception of police, I control for parish level fixed effects.28
5.3 Model
I use the following OLS specifications to test hypothesis 1:
DVi,p = αp + β1Ti,p + β2Xi,p + φZi,p + ε (1)
The respondent is referenced with the subscript i within the parish p. The DVi,p captures
the individual response to the respective police legitimacy survey question. The treatment
variable, Ti,p, is a binary indicator for whether the respondent was interviewed before the
arrest (Ti,p = 0) or on or after the date of the arrest (Ti,p = 1). The treatment coefficient β1
is the total effect of the repressive incident. The binary variable Xi,p indicates whether the
respondent supports the National Resistance Movement (the ruling incumbent party). If the
respondent supports the incumbent political party, then Xi,p = 1 and 0 otherwise. Zi,p is a
vector of individual-level control variables, including respondent’s self-reported age, gender,
education level, economic status, and whether they live in an urban or rural environment.
Finally, αp captures parish-level fixed effects. In the main specification, robust standard
errors are clustered at the level of treatment assignment, which is the respondent.29
Similarly, I employ the following OLS specifications to examine the conditional effects of
partisanship on repression by the police. To investigate heterogeneity in the treatment effect
across political support for the regime in the other hypotheses, I interact Ti,p with Xi,p.
sition. However, respondents identified which political party they supported prior to the survey round onpolicing and security. This information comes from baseline data collected prior to the social media taxprotests.
28The results are generally robust to employing district level fixed effects rather than the more micro-levelregions. See Table 7 in the online appendix.
29I employ OLS models for parsimonious interpretation but results from ordered logit models are reportedin the online appendix (see Table 6).
16
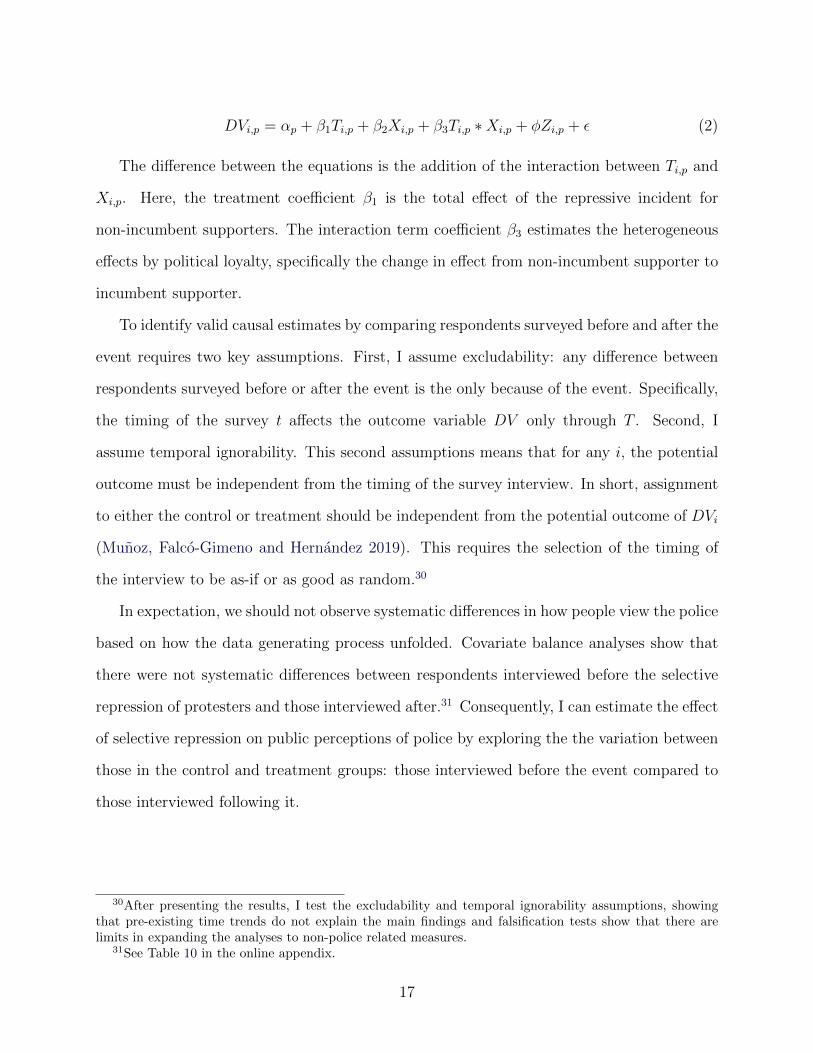
DVi,p = αp + β1Ti,p + β2Xi,p + β3Ti,p ∗Xi,p + φZi,p + ε (2)
The difference between the equations is the addition of the interaction between Ti,p and
Xi,p. Here, the treatment coefficient β1 is the total effect of the repressive incident for
non-incumbent supporters. The interaction term coefficient β3 estimates the heterogeneous
effects by political loyalty, specifically the change in effect from non-incumbent supporter to
incumbent supporter.
To identify valid causal estimates by comparing respondents surveyed before and after the
event requires two key assumptions. First, I assume excludability: any difference between
respondents surveyed before or after the event is the only because of the event. Specifically,
the timing of the survey t affects the outcome variable DV only through T . Second, I
assume temporal ignorability. This second assumptions means that for any i, the potential
outcome must be independent from the timing of the survey interview. In short, assignment
to either the control or treatment should be independent from the potential outcome of DVi
(Munoz, Falco-Gimeno and Hernandez 2019). This requires the selection of the timing of
the interview to be as-if or as good as random.30
In expectation, we should not observe systematic differences in how people view the police
based on how the data generating process unfolded. Covariate balance analyses show that
there were not systematic differences between respondents interviewed before the selective
repression of protesters and those interviewed after.31 Consequently, I can estimate the effect
of selective repression on public perceptions of police by exploring the the variation between
those in the control and treatment groups: those interviewed before the event compared to
those interviewed following it.
30After presenting the results, I test the excludability and temporal ignorability assumptions, showingthat pre-existing time trends do not explain the main findings and falsification tests show that there arelimits in expanding the analyses to non-police related measures.
31See Table 10 in the online appendix.
17
6 Results
Table 2 shows the effects of the social media protest and arrests on whether people view
the police as legitimate authorities (Model 1 and Model 3) and whether people think they
should obey the police (Model 2 and Model 4). I hypothesized that repression by the police
should decrease support for the police, negatively affecting public perceptions of police. A
second observable implication of my argument is that the magnitude of the effect should
be stronger among those who oppose the regime – those who have more to fear from police
engaging in repression on behalf of political authorities.
As theorized, police employing state repression, even selective repression against protestors,
negatively affects public support for the police. Model 1 and Model 3 show the unconditional
effects of selective repression of the Social Media Tax Protests on support for the police. Re-
sults from Model 1 show that people interviewed on or after the July 11 had lower perceptions
of the police as legitimate authorities (β1 = −0.2498). The magnitude of the relationship is
sizeable, with assignment to treatment corresponding to a 0.23 standard deviation decrease.
We observe a similar pattern with the second measure of support (do people feel obligated
to comply with police). Results again provide evidence that repression decreases support
for the police. Assignment to treatment lowered perceptions of respondents’ obligation to
comply and defer to the police (β1 = −0.4720). The magnitude of this relationship is even
higher with assignment to treatment corresponding to a 0.49 standard deviation decrease in
beliefs that respondents are obligated to comply and defer to the police.
From a motivated reasoning perspective based on supporting or opposing the regime, it is
surprising that these results hold across all levels of regime support. A theory of motivated
reasoning and partisanship would expect that people who support the incumbent would
support repression while people who oppose the regime would view such acts as illegitimate,
hypotheses 3 and 4, respectively. Alternatively, I argued that political support for the
regime should have a conditional effect on repression. People who support the regime fear
experiencing repression less relative to those who oppose the regime; however, they are still
18
concerned about the incumbent using the police to repress others. If this is the case, we
should observe a weaker effect of repression on incumbent supporters.
Results from Equation 2 demonstrate the effects of selective repression on perceptions
of police legitimacy are conditioned by political loyalty. Including the interaction term, β1
shows the effect when the incumbent term equals 0. Model 2 shows that assignment to
treatment has a negative effect on whether people view the police as legitimate authorities
(β1 = −0.5163). To examine the effect of repression when incumbent supporters is equal
to 1, I sum the coefficients for the treatment measure and its interaction with incumbent
supporter (β1 and β3). Considering the conditional effect of incumbent support in Model 2,
the heterogeneous effect of selective repression on perceptions of the police being legitimate
authorities decreases (-0.1091).
Turning to the second measure of support, Model 4 shows that assignment to treatment
again has a negative effect on people obligation to obey the police (β1 = −0.7523). The
heterogeneous effect of selective repression on people’s obligation to obey the police also
decreases (-0.3239). Even controlling for parish-level fixed effects, the results show that
selective repression of the Social Media Tax Protesters decreased individuals’ support for
the police. The effects of selective violence are conditioned by political loyalty to the regime.
However, even those who identified as supporting the ruling political party viewed the police
in lower regard following the incident. This demonstrates that an explanation based on
motivated reasoning and partisanship does not fully explain how civilians interpret repression
by the police.
6.1 Procedural Fairness and Normative Alignment
Does repression affect other perceptual measures of support for the police? Public per-
ceptions of procedural fairness and normative alignment are key inputs of whether people
support and trust the police (Knight and Schwartzberg 2019, Trinkner, Jackson and Tyler
2017). I use two questions that capture respondents’ perception of the procedural fairness of
19
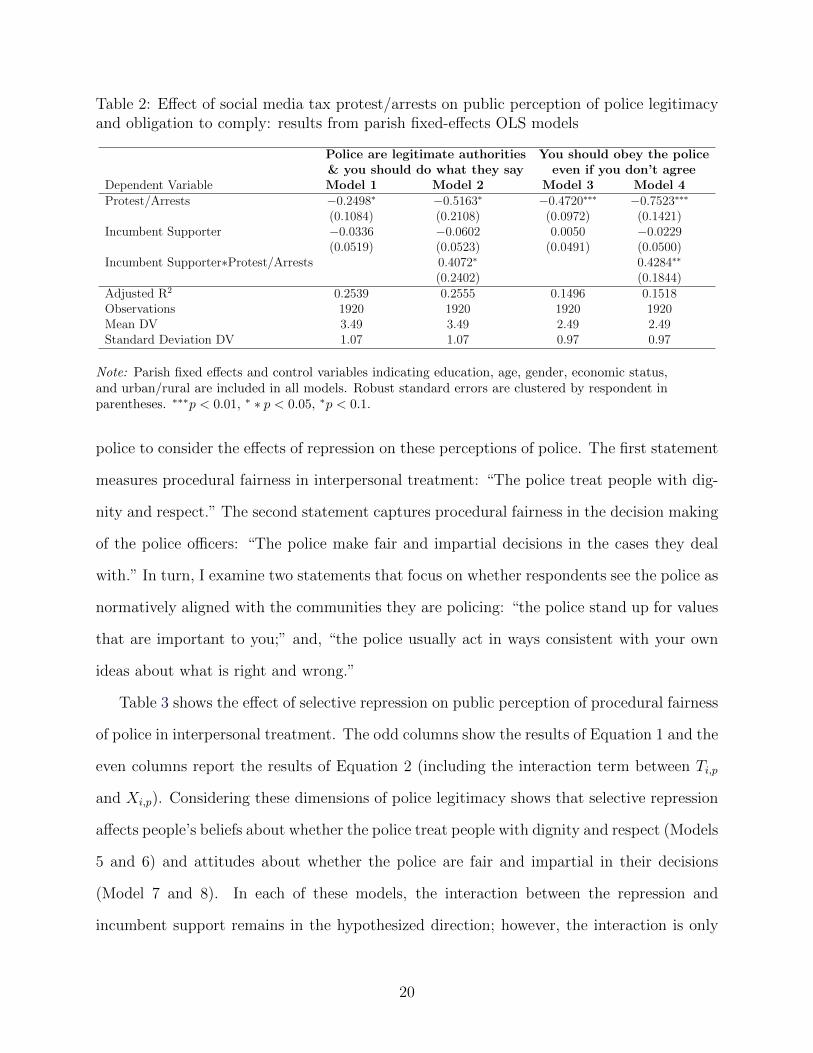
Table 2: Effect of social media tax protest/arrests on public perception of police legitimacyand obligation to comply: results from parish fixed-effects OLS models
Police are legitimate authorities You should obey the police& you should do what they say even if you don’t agree
Dependent Variable Model 1 Model 2 Model 3 Model 4Protest/Arrests −0.2498∗ −0.5163∗ −0.4720∗∗∗ −0.7523∗∗∗
(0.1084) (0.2108) (0.0972) (0.1421)Incumbent Supporter −0.0336 −0.0602 0.0050 −0.0229
(0.0519) (0.0523) (0.0491) (0.0500)Incumbent Supporter∗Protest/Arrests 0.4072∗ 0.4284∗∗
(0.2402) (0.1844)Adjusted R2 0.2539 0.2555 0.1496 0.1518Observations 1920 1920 1920 1920Mean DV 3.49 3.49 2.49 2.49Standard Deviation DV 1.07 1.07 0.97 0.97
Note: Parish fixed effects and control variables indicating education, age, gender, economic status,and urban/rural are included in all models. Robust standard errors are clustered by respondent inparentheses. ∗∗∗p < 0.01, ∗ ∗ p < 0.05, ∗p < 0.1.
police to consider the effects of repression on these perceptions of police. The first statement
measures procedural fairness in interpersonal treatment: “The police treat people with dig-
nity and respect.” The second statement captures procedural fairness in the decision making
of the police officers: “The police make fair and impartial decisions in the cases they deal
with.” In turn, I examine two statements that focus on whether respondents see the police as
normatively aligned with the communities they are policing: “the police stand up for values
that are important to you;” and, “the police usually act in ways consistent with your own
ideas about what is right and wrong.”
Table 3 shows the effect of selective repression on public perception of procedural fairness
of police in interpersonal treatment. The odd columns show the results of Equation 1 and the
even columns report the results of Equation 2 (including the interaction term between Ti,p
and Xi,p). Considering these dimensions of police legitimacy shows that selective repression
affects people’s beliefs about whether the police treat people with dignity and respect (Models
5 and 6) and attitudes about whether the police are fair and impartial in their decisions
(Model 7 and 8). In each of these models, the interaction between the repression and
incumbent support remains in the hypothesized direction; however, the interaction is only
20
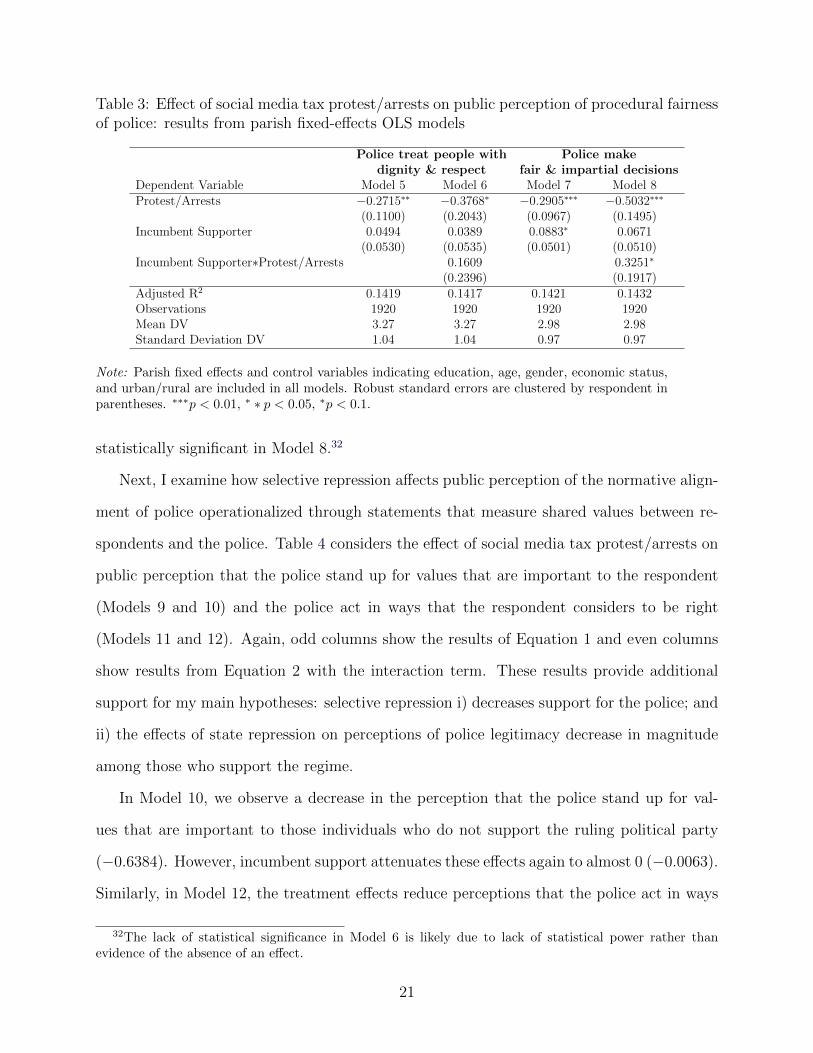
Table 3: Effect of social media tax protest/arrests on public perception of procedural fairnessof police: results from parish fixed-effects OLS models
Police treat people with Police makedignity & respect fair & impartial decisions
Dependent Variable Model 5 Model 6 Model 7 Model 8Protest/Arrests −0.2715∗∗ −0.3768∗ −0.2905∗∗∗ −0.5032∗∗∗
(0.1100) (0.2043) (0.0967) (0.1495)Incumbent Supporter 0.0494 0.0389 0.0883∗ 0.0671
(0.0530) (0.0535) (0.0501) (0.0510)Incumbent Supporter∗Protest/Arrests 0.1609 0.3251∗
(0.2396) (0.1917)Adjusted R2 0.1419 0.1417 0.1421 0.1432Observations 1920 1920 1920 1920Mean DV 3.27 3.27 2.98 2.98Standard Deviation DV 1.04 1.04 0.97 0.97
Note: Parish fixed effects and control variables indicating education, age, gender, economic status,and urban/rural are included in all models. Robust standard errors are clustered by respondent inparentheses. ∗∗∗p < 0.01, ∗ ∗ p < 0.05, ∗p < 0.1.
statistically significant in Model 8.32
Next, I examine how selective repression affects public perception of the normative align-
ment of police operationalized through statements that measure shared values between re-
spondents and the police. Table 4 considers the effect of social media tax protest/arrests on
public perception that the police stand up for values that are important to the respondent
(Models 9 and 10) and the police act in ways that the respondent considers to be right
(Models 11 and 12). Again, odd columns show the results of Equation 1 and even columns
show results from Equation 2 with the interaction term. These results provide additional
support for my main hypotheses: selective repression i) decreases support for the police; and
ii) the effects of state repression on perceptions of police legitimacy decrease in magnitude
among those who support the regime.
In Model 10, we observe a decrease in the perception that the police stand up for val-
ues that are important to those individuals who do not support the ruling political party
(−0.6384). However, incumbent support attenuates these effects again to almost 0 (−0.0063).
Similarly, in Model 12, the treatment effects reduce perceptions that the police act in ways
32The lack of statistical significance in Model 6 is likely due to lack of statistical power rather thanevidence of the absence of an effect.
21
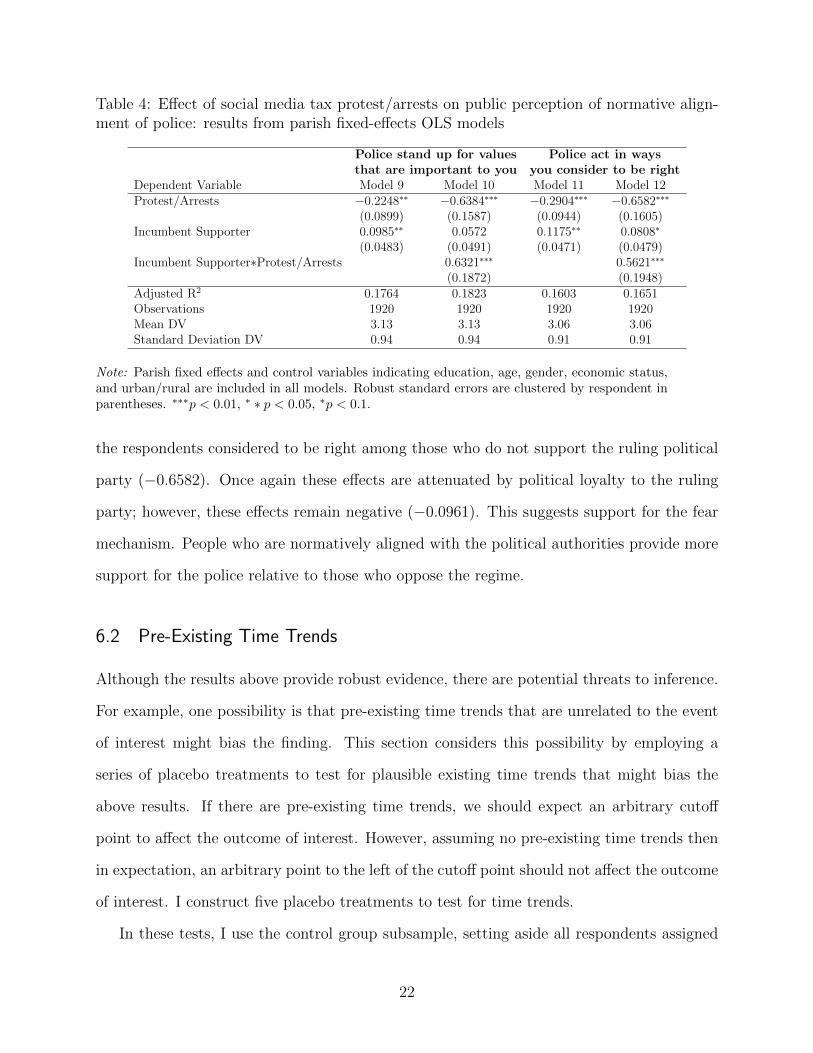
Table 4: Effect of social media tax protest/arrests on public perception of normative align-ment of police: results from parish fixed-effects OLS models
Police stand up for values Police act in waysthat are important to you you consider to be right
Dependent Variable Model 9 Model 10 Model 11 Model 12Protest/Arrests −0.2248∗∗ −0.6384∗∗∗ −0.2904∗∗∗ −0.6582∗∗∗
(0.0899) (0.1587) (0.0944) (0.1605)Incumbent Supporter 0.0985∗∗ 0.0572 0.1175∗∗ 0.0808∗
(0.0483) (0.0491) (0.0471) (0.0479)Incumbent Supporter∗Protest/Arrests 0.6321∗∗∗ 0.5621∗∗∗
(0.1872) (0.1948)Adjusted R2 0.1764 0.1823 0.1603 0.1651Observations 1920 1920 1920 1920Mean DV 3.13 3.13 3.06 3.06Standard Deviation DV 0.94 0.94 0.91 0.91
Note: Parish fixed effects and control variables indicating education, age, gender, economic status,and urban/rural are included in all models. Robust standard errors are clustered by respondent inparentheses. ∗∗∗p < 0.01, ∗ ∗ p < 0.05, ∗p < 0.1.
the respondents considered to be right among those who do not support the ruling political
party (−0.6582). Once again these effects are attenuated by political loyalty to the ruling
party; however, these effects remain negative (−0.0961). This suggests support for the fear
mechanism. People who are normatively aligned with the political authorities provide more
support for the police relative to those who oppose the regime.
6.2 Pre-Existing Time Trends
Although the results above provide robust evidence, there are potential threats to inference.
For example, one possibility is that pre-existing time trends that are unrelated to the event
of interest might bias the finding. This section considers this possibility by employing a
series of placebo treatments to test for plausible existing time trends that might bias the
above results. If there are pre-existing time trends, we should expect an arbitrary cutoff
point to affect the outcome of interest. However, assuming no pre-existing time trends then
in expectation, an arbitrary point to the left of the cutoff point should not affect the outcome
of interest. I construct five placebo treatments to test for time trends.
In these tests, I use the control group subsample, setting aside all respondents assigned
22
to the treatment group (Imbens and Lemieux 2008, Munoz, Falco-Gimeno and Hernandez
2019). Data collection for the control group ran from June 29 to July 10. Rather than using
the empirical median of the control group subsample to split the sample, as suggested by
Imbens and Lemieux (2008), Munoz, Falco-Gimeno and Hernandez (2019), I create 5 placebo
treatments in two-day windows (7/1, 7/3, 7/5, 7/7, and 7/9). Figure 1 shows the results
of 20 regression models to examine whether the placebos have any effect on the two main
measures of support for the police. The results show no evidence of consistent time trends
occurring prior to the repressive event.33
6.3 Falsification Test: Effects of the event on other outcome variables
Another potential threat to inference is a violation of the excludability assumption by the
occurrence of simultaneous events. One approach to consider this is to run a falsification test
that examines the effect of the event on outcome variables that should not be affected by
the repressive treatment event (Munoz, Falco-Gimeno and Hernandez 2019). To ensure that
another event T ′ is not driving the effect, one plausible falsification test is using a relevant
outcome DV ′ that is theoretically unrelated to the repressive event, T , but might be affected
by T ′ that might also have an effect on DV . I use a series of outcome variables relating to
how people perceive others in their community that are as close to possible to the survey
instruments on policing but should not be affected by the selective repression. An effect
of t on DV ′ would indicate a potential violation of the exclusion restriction, suggesting a
broader time trend T ′ might be driving people’s perception of others DV ′. Alternatively, if
we observe null effects of t on DV ′, we can have more confidence that the estimated effects
for DV are not biased by other events.
Theoretically, a related series of events like an increase in crime, other security threat,
or even frustration about the protester (as opposed to the state response) might affect both
people’s trust in the police and their trust in others. Alternatively, the selective repressive
33Only one coefficient was statistically significant (β1 in the top right figure when the placebo is 7/1).The placebo effects captured in the remaining 39 coefficients were statistically indistinguishable from 0.
23
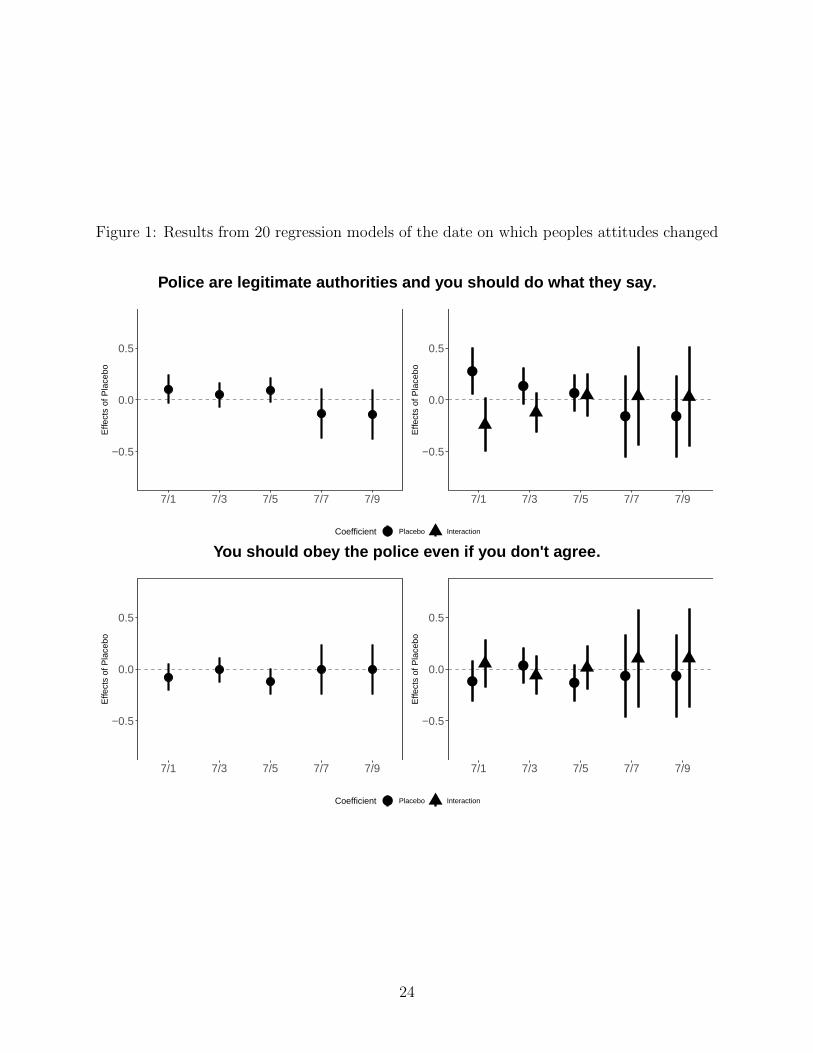
Figure 1: Results from 20 regression models of the date on which peoples attitudes changed
−0.5
0.0
0.5
7/1 7/3 7/5 7/7 7/9
Effe
cts
of P
lace
bo
−0.5
0.0
0.5
7/1 7/3 7/5 7/7 7/9
Effe
cts
of P
lace
bo
Coefficient Placebo Interaction
Police are legitimate authorities and you should do what they say.
−0.5
0.0
0.5
7/1 7/3 7/5 7/7 7/9
Effe
cts
of P
lace
bo
−0.5
0.0
0.5
7/1 7/3 7/5 7/7 7/9
Effe
cts
of P
lace
bo
Coefficient Placebo Interaction
You should obey the police even if you don't agree.
24
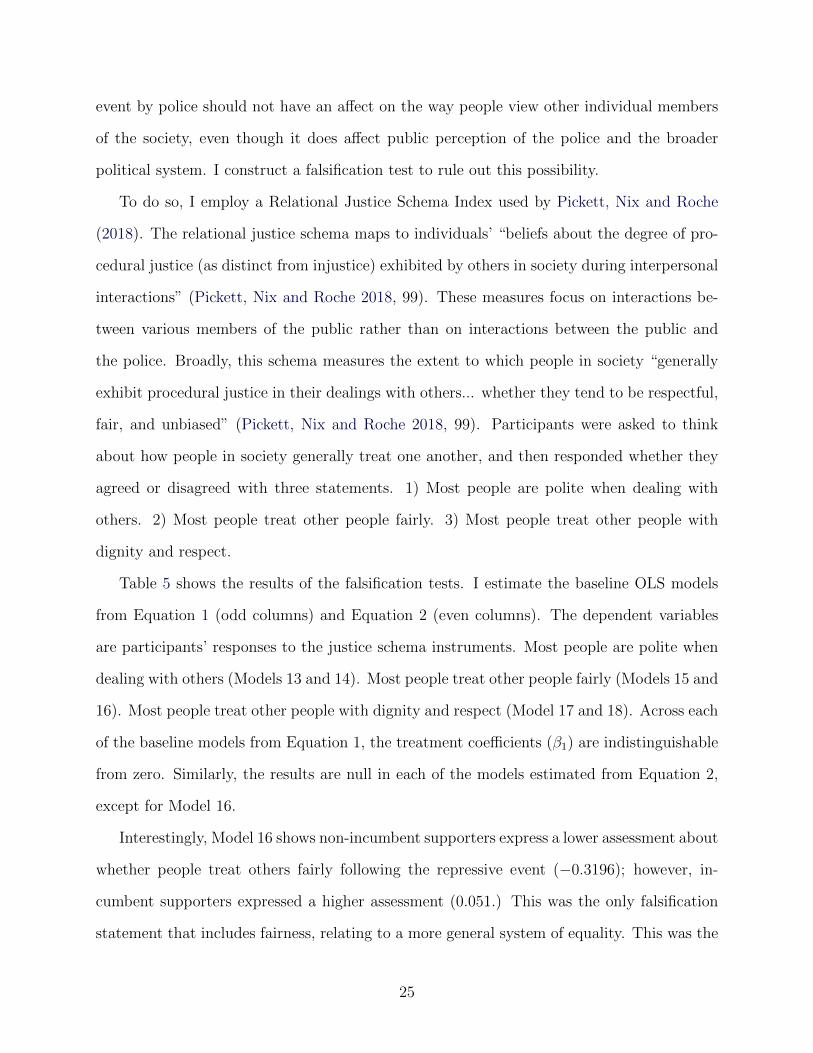
event by police should not have an affect on the way people view other individual members
of the society, even though it does affect public perception of the police and the broader
political system. I construct a falsification test to rule out this possibility.
To do so, I employ a Relational Justice Schema Index used by Pickett, Nix and Roche
(2018). The relational justice schema maps to individuals’ “beliefs about the degree of pro-
cedural justice (as distinct from injustice) exhibited by others in society during interpersonal
interactions” (Pickett, Nix and Roche 2018, 99). These measures focus on interactions be-
tween various members of the public rather than on interactions between the public and
the police. Broadly, this schema measures the extent to which people in society “generally
exhibit procedural justice in their dealings with others... whether they tend to be respectful,
fair, and unbiased” (Pickett, Nix and Roche 2018, 99). Participants were asked to think
about how people in society generally treat one another, and then responded whether they
agreed or disagreed with three statements. 1) Most people are polite when dealing with
others. 2) Most people treat other people fairly. 3) Most people treat other people with
dignity and respect.
Table 5 shows the results of the falsification tests. I estimate the baseline OLS models
from Equation 1 (odd columns) and Equation 2 (even columns). The dependent variables
are participants’ responses to the justice schema instruments. Most people are polite when
dealing with others (Models 13 and 14). Most people treat other people fairly (Models 15 and
16). Most people treat other people with dignity and respect (Model 17 and 18). Across each
of the baseline models from Equation 1, the treatment coefficients (β1) are indistinguishable
from zero. Similarly, the results are null in each of the models estimated from Equation 2,
except for Model 16.
Interestingly, Model 16 shows non-incumbent supporters express a lower assessment about
whether people treat others fairly following the repressive event (−0.3196); however, in-
cumbent supporters expressed a higher assessment (0.051.) This was the only falsification
statement that includes fairness, relating to a more general system of equality. This was the
25
only result, including the policing measures, that provided any evidence of the motivated
reasoning hypotheses.
The falsification tests are neither necessary nor sufficient to demonstrate that the esti-
mated effects of the selective repressive event on public perception of police is not caused
by another event. However, they do increase our confidence that the exclusion restriction
assumption is credible. In short, the link appears to be the state repression by the police
against the protesters that affects public perception of the police and not mistrust of others
in general or another event.
26
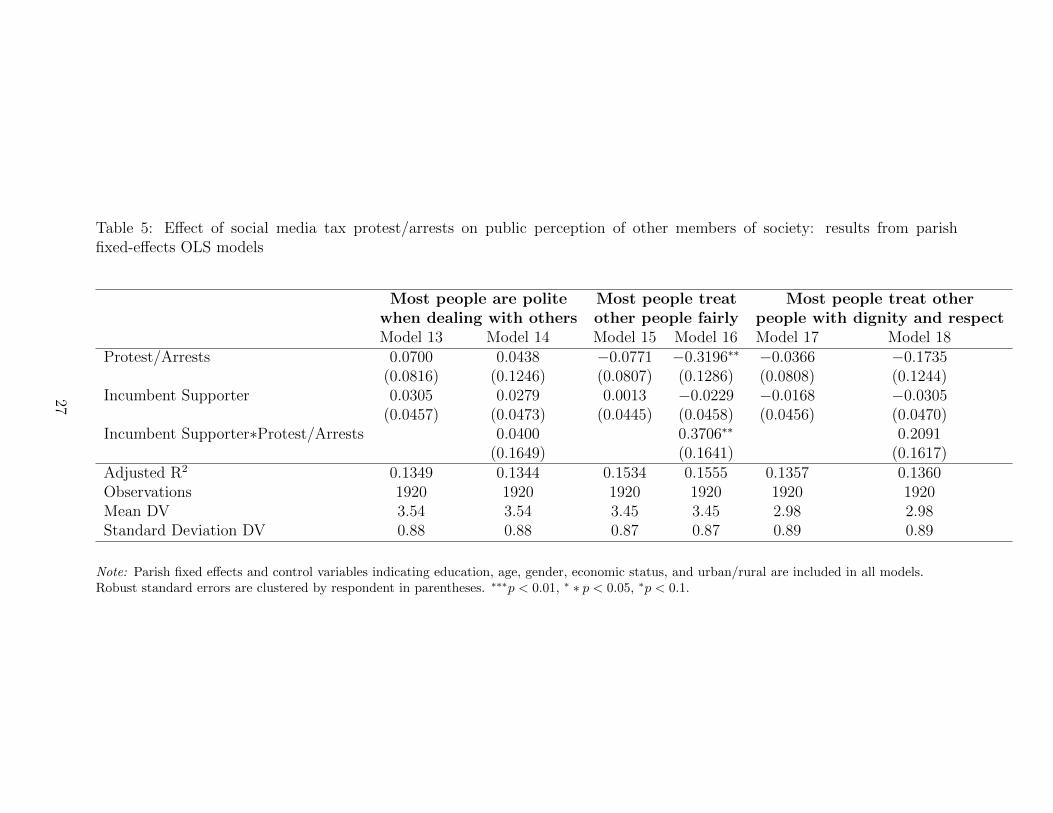
Table 5: Effect of social media tax protest/arrests on public perception of other members of society: results from parishfixed-effects OLS models
Most people are polite Most people treat Most people treat otherwhen dealing with others other people fairly people with dignity and respectModel 13 Model 14 Model 15 Model 16 Model 17 Model 18
Protest/Arrests 0.0700 0.0438 −0.0771 −0.3196∗∗ −0.0366 −0.1735(0.0816) (0.1246) (0.0807) (0.1286) (0.0808) (0.1244)
Incumbent Supporter 0.0305 0.0279 0.0013 −0.0229 −0.0168 −0.0305(0.0457) (0.0473) (0.0445) (0.0458) (0.0456) (0.0470)
Incumbent Supporter∗Protest/Arrests 0.0400 0.3706∗∗ 0.2091(0.1649) (0.1641) (0.1617)
Adjusted R2 0.1349 0.1344 0.1534 0.1555 0.1357 0.1360Observations 1920 1920 1920 1920 1920 1920Mean DV 3.54 3.54 3.45 3.45 2.98 2.98Standard Deviation DV 0.88 0.88 0.87 0.87 0.89 0.89
Note: Parish fixed effects and control variables indicating education, age, gender, economic status, and urban/rural are included in all models.Robust standard errors are clustered by respondent in parentheses. ∗∗∗p < 0.01, ∗ ∗ p < 0.05, ∗p < 0.1.
27
7 Discussion and Conclusion
What are the effects of state repression by police on public perceptions of the legitimacy of
the police? Using an unexpected event during surveys design approach to causal inference,
I show that even selective repression by the police negatively affects how individuals view
the police. I theorize that fear of the police as agents of repression is the main theoretical
mechanism by which repression decreases support for police. When political authorities rely
on the police to repress dissent, it increases people’s fear that the police function as agents of
repression and undermines people’s trust in the police as legitimate authorities who provide
law and order.
Surprisingly, repression decreases support for the police across the levels of support for
the incumbent regime. A theory of motivated reasoning does not completely capture changes
in people’s attitudes toward the police following repression. Political loyalty to the political
authorities, operationalized by support for the ruling party, does condition the effect of state
repression by police on individuals’ perceptions of police abuse. I demonstrate the effects of
selective state repression are strongest among those who do not identify as supporting the
political party. Yet, even respondents who identify with the ruling party view the police
as more illegitimate authorities and say they are less likely to comply with police directives
after the police engage in repression.
This study makes several theoretical and empirical contributions to a growing literature
on the politics of policing. Existing studies of state repression, by and large, focus on its
effects on political participation either voter turnout or protests. Answering how repression
affects political participation matters because even non-democracies employ protests and
elections as important sources of information, if not a way to foster legitimacy (Brownlee
2007, Gandhi 2008, Magaloni 2006). However, one limitation is that this work primarily
focuses on the costs of repression based on the negative effects it has politically (i.e, future
protests or more support for the opposition at the ballot box).
By examining the effects of state repression on how the public views the legitimacy of
28
the actors responsible for implementing it, I identify another cost for political authorities
and society more generally. When political authorities rely on state security institutions,
it undermines people’s willingness to cooperate with them. Even if fear associated with
selective repression might induce political loyalty and deter dissent (Young 2019), relying on
official members of the state security apparatus for coercive force against political challengers
adversely affects people’s perceptions of the legitimacy of these institutions. This study
demonstrates that even selective repression by the police undermines public perceptions of
the police and people’s confidence that the police exist to protect and serve the interests of
the community. This raises several implications for the relationship between repression and
the politics of policing and crime.
Next, I join previous work that relaxes the unitary actor assumption within the state
repression literature (DeMeritt 2015, Greitens 2016, Hassan 2017, Svolik 2012). However,
rather than focusing only on the principal-agent problems, I argue the co-production of
security depends on the relationship between political authorities, members of the security
apparatus, and citizens. This has implications for the state’s ability to provide law and
order. By examining the relationship between political authorities, the police, and citizens, I
explore important variation in how people might view repression depending on their political
preferences. In the context of this study, incumbent supporters did not support the use of
repression by the police (at least selective repression did not have a positive effect on their
assessment of the police). Future work might consider the strategic role that citizens play
not only in the co-production of security but also the co-production of repression.
Finally, this analysis raises several policy implications and questions about the challenges
of rebuilding trust in security institutions in post-conflict and fragile environments (Blair,
Karim and Morse 2019). If the recent work on the lingering political effects of state re-
pression are any indicator, the negative effects of state repression on people’s perception of
the legitimacy of their security providers are likely to persist. However, these effects might
depend on whether people believe a person or population is deserving of repression or retal-
29
iation (Kao and Redlich Revkin 2019). Moreover, these results might be even less likely in
areas with higher levels of conflict and repression, especially if people have no expectation
of fair or unbiased treatment at the hands of the police. Future studies could examine the
lingering effects of repression on public perceptions of the police and the potential for a
“floor effect” when people no longer trust the state to provide security. One future avenue
of research could examine challenges of police to solicit information to deter crime among
politically marginalized communities, especially among those who have experienced past ex-
posure to state abuse at the hands of law enforcement officers. This study provides a rare
window into the effects of repressive action of a regime that is increasingly relying on the
security apparatus to maintain power. Overall, this study demonstrates a cost of repression
to political authorities and society. When political authorities rely on the police as agents
of repression, people view the police as more illegitimate authorities.
References
Arriola, Leonardo, Aila Matanock, David Dow and Michaela Mattes. 2020. “Policing Insti-tutions and Civil Conflict.” Working Paper.
Balcells, Laia. 2012. “The consequences of victimization on political identities: Evidencefrom Spain.” Politics & Society 40(3):311–347.
Balcells, Laia, Spencer Dorsey and Juan F. Tellez. 2020. “Repression and Dissent in Con-temporary Catalonia.” British Journal of Political Science p. 1–9.
Bautista, Maria Angelica. 2015. “Political Effects of State-led Repression: The ChileanCase.”.
Beetham, David. 1991. The Legitimation of Power. Macmillan.
Blair, Robert A., Sabrina M. Karim and Benjamin S. Morse. 2019. “Establishing the Rule ofLaw in Weak and War-torn States: Evidence from a Field Experiment with the LiberianNational Police.” American Political Science Review p. 1–17.
Blair, Robert and Benjamin Morse. 2020. “Policing and the Legacies of State Predation:Evidence from a Survey and Field Experiment in Liberia.” Working Paper.
Blattman, Christopher. 2009. “From violence to voting: War and political participation inUganda.” American political Science review 103(2):231–247.
30
Blaydes, Lisa. 2018. State of Repression: Iraq under Saddam Hussein. Princeton, NJ:Princeton University Press.
Bratton, Michael and Eldred Masunungure. 2007. “Popular reactions to state repression:Operation Murambatsvina in Zimbabwe.” African Affairs 106(422):21–45.
Brownlee, Jason. 2007. Authoritarianism in an Age of Democratization. Cambridge Univer-sity Press.
Carey, Sabine C. 2006. “The dynamic relationship between protest and repression.” PoliticalResearch Quarterly 59(1):1–11.
Cheng, Kevin Kwok-yin. 2015. “Prosecutorial procedural justice and public legitimacy inHong Kong.” British Journal of Criminology 57(1):94–111.
Curtice, Travis B. and Brandon Behlendorf. 2020. “Street-level Repression: Protest, Policing,and Dissent in Uganda.” Journal of Conflict Resolution .
Davenport, Christian. 2007. State repression and the domestic democratic peace. CambridgeUniversity Press.
Davenport, Christian. 2020. “Introducing DyoRep: A database of perpetrator–victim dyadswithin repressive spells.” Journal of Human Rights 19(1):117–137.
Davenport, Christian, Havard Mokleiv Nygard, Hanne Fjelde and David Armstrong. 2019.“The Consequences of Contention: Understanding the Aftereffects of Political Conflictand Violence.” Annual Review of Political Science 22(1):361–377.
DeMeritt, Jacqueline HR. 2015. “Delegating Death Military Intervention and GovernmentKilling.” Journal of Conflict Resolution 59(3):428–454.
Finkel, Evgeny. 2015. “The phoenix effect of state repression: Jewish resistance during theHolocaust.” American Political Science Review 109(2):339–353.
Gandhi, Jennifer. 2008. Political institutions under dictatorship. Cambridge University PressCambridge.
Gonzalez, Felipe and Edward Miguel. 2015. “War and local collective action in Sierra Leone:A comment on the use of coefficient stability approaches.” Journal of Public Economics128:30–33.
Greitens, Sheena Chestnut. 2016. Dictators and their Secret Police: Coercive Institutionsand State Violence. Cambridge University Press.
Gurr, Ted Robert. 2015. Why Men Rebel. Princeton University Press.
Hassan, Mai. 2017. “The strategic shuffle: Ethnic geography, the internal security apparatus,and elections in Kenya.” American Journal of Political Science 61(2):382–395.
31
Henderson, Conway W. 1991. “Conditions affecting the use of political repression.” Journalof Conflict Resolution 35(1):120–142.
Hobbes, Thomas. 1946. Leviathan; Or, The Matter, Forme and Power of a Commonwealth,Ecclesiasticall and Civil. New Haven, CT: Yale University Press.
Imbens, Guido W and Thomas Lemieux. 2008. “Regression discontinuity designs: A guideto practice.” Journal of econometrics 142(2):615–635.
Jackson, Jonathan, Ben Bradford, Mike Hough, Andy Myhill, Paul Quinton and Tom RTyler. 2012. “Why do people comply with the law? Legitimacy and the influence of legalinstitutions.” British journal of criminology 52(6):1051–1071.
Jonathan-Zamir, Tal and Amikam Harpaz. 2014. “Police understanding of the foundationsof their legitimacy in the eyes of the public: The case of commanding officers in the IsraelNational Police.” British Journal of Criminology 54(3):469–489.
Kalyvas, Stathis N. 2006. The logic of violence in civil war. Cambridge University Press.
Kao, Kristen and Mara Redlich Revkin. 2019. “Retribution or Reconciliation? Attitudes To-ward Rebel Collaborators in Iraq.” Attitudes Toward Rebel Collaborators in Iraq (Septem-ber 4, 2019) .
Knight, Jack and Melissa Schwartzberg. 2019. Political Legitimacy: NOMOS LXI. Vol. 8New York University Press.
Leeper, Thomas and Rune Slothuus. 2014. “Political parties, motivated reasoning, and publicopinion formation.” Political Psychology 35:129–156.
Lerman, Amy E and Vesla Weaver. 2014. “Staying out of sight? Concentrated policing andlocal political action.” The ANNALS of the American Academy of Political and SocialScience 651(1):202–219.
Levi, Margaret. 1997. Consent, dissent, and patriotism. Cambridge University Press.
Lichbach, Mark Irving. 1987. “Deterrence or escalation? The puzzle of aggregate studies ofrepression and dissent.” Journal of Conflict Resolution 31(2):266–297.
Lupu, Yonatan and Geoffrey PR Wallace. 2019. “Violence, Nonviolence, and the Effects ofInternational Human Rights Law.” American Journal of Political Science 63(2):411–426.
Lyall, Jason. 2009. “Does indiscriminate violence incite insurgent attacks? Evidence fromChechnya.” Journal of Conflict Resolution 53(3):331–362.
Magaloni, Beatriz. 2006. Voting for autocracy: Hegemonic party survival and its demise inMexico. Cambridge University Press Cambridge.
Mason, T David and Dale A Krane. 1989. “The political economy of death squads: To-ward a theory of the impact of state-sanctioned terror.” International Studies Quarterly33(2):175–198.
32
Mazerolle, Lorraine, Emma Antrobus, Sarah Bennett and Tom R Tyler. 2013. “Shapingcitizen perceptions of police legitimacy: A randomized field trial of procedural justice.”Criminology 51(1):33–63.
Mitchell, Neil J, Sabine C Carey and Christopher K Butler. 2014. “The impact of pro-government militias on human rights violations.” International Interactions 40(5):812–836.
Moore, Will H. 2000. “The repression of dissent a substitution model of government coer-cion.” Journal of conflict resolution 44(1):107–127.
Munoz, Jordi, Albert Falco-Gimeno and Enrique Hernandez. 2019. “Unexpected Event dur-ing Survey Design: Promise and Pitfalls for Causal Inference.” Political Analysis p. 1–21.
Nagin, Daniel S. and Cody W. Telep. 2017. “Procedural Justice and Legal Compliance.”Annual Review of Law and Social Science 13(1):5–28.
Nordas, Ragnhild and Christian Davenport. 2013. “Fight the youth: Youth bulges and staterepression.” American Journal of Political Science 57(4):926–940.
Ong, Lynette H. 2015. “’Thugs-for-Hire’: State Coercion and ’Everyday Repression’ inChina.”.
Pickett, Justin T, Justin Nix and Sean Patrick Roche. 2018. “Testing a social schematicmodel of police procedural justice.” Social psychology quarterly 81(2):97–125.
Ritter, Emily Hencken and Courtenay R Conrad. 2016. “Preventing and responding to dis-sent: The observational challenges of explaining strategic repression.” American PoliticalScience Review 110(1):85–99.
Rozenas, Arturas and Yuri M Zhukov. 2019. “Mass Repression and Political Loyalty: Ev-idence from Stalin’s ‘Terror by Hunger’.” American Political Science Review 113(2):569–583.
Skogan, Wesley and Kathleen Frydl. 2004. Fairness and Effectiveness in Policing: the Ev-idence. Committee on Law and Justice, Division of Behavioral and Social Sciences andEducation. Washington DC: National Academies Press.
Slothuus, Rune and Claes H De Vreese. 2010. “Political parties, motivated reasoning, andissue framing effects.” The Journal of Politics 72(3):630–645.
Sullivan, Christopher and Howard Liu. 2020. “And the Heat Goes On: Police Repressionand the Modalities of Power.” Working Paper.
Sullivan, Christopher M. 2016. “Political repression and the destruction of dissident orga-nizations: Evidence from the archives of the Guatemalan national police.” World Politics68(4):645–676.
Svolik, Milan W. 2012. The politics of authoritarian rule. Cambridge University Press.
33
Tankebe, Justice. 2009. “Public cooperation with the police in Ghana: Does proceduralfairness matter?” Criminology 47(4):1265–1293.
Tankebe, Justice. 2013. “Viewing things differently: The dimensions of public perceptionsof police legitimacy.” Criminology 51(1):103–135.
Trinkner, Rick, J Jackson and T Tyler. 2017. “Expanding ‘appropriate’police behaviorbeyond procedural justice: bounded authority and legal legitimation.” Retrieved from osf.io/preprints/socarxiv/nezm6 .
Tyler, Tom R. 2003. “Procedural Justice, Legitimacy, and the Effective Rule of Law.” Crimeand Justice 30:283–357.
Tyler, Tom R. 2004. “Enhancing Police Legitimacy.” The Annals of the American Academyof Political and Social Science 593(1):84–99.
Tyler, Tom R. 2006. Why People Obey the Law. Princeton, NJ: Princeton University Press.
Tyler, Tom R and Jeffrey Fagan. 2008. “Legitimacy and cooperation: Why do people helpthe police fight crime in their communities.” Ohio St. J. Crim. L. 6:231.
Weber, Max. 1946. Politics as a Vocation. In From Max Weber: Essays in Sociology. Oxford:Oxford University Press.
Wilson, James Q. 1978. Varieties of Police Behavior: The Management of Law and Orderin Eight Communities. Cambridge, MA: Harvard University Press.
Young, Lauren E. 2019. “The Psychology of State Repression: Fear and Dissent Decisionsin Zimbabwe.” American Political Science Review 113(1):140–155.
Zhukov, Yuri M and Roya Talibova. 2018. “Stalin’s terror and the long-term political effectsof mass repression.” Journal of Peace Research 55(2):267–283.
34
Online Appendix for How Repression AffectsPublic Perception of Police: Evidence from
Uganda
Supporting Information not meant for print publication. Online version of appendixavailable at the publisher’s website:
List of Figures
1 Results from 20 regression models of the date on which peoples attitudes changed 24
List of Tables
1 Overview of Multistage Sampling . . . . . . . . . . . . . . . . . . . . . . . . 142 Effect of social media tax protest/arrests on public perception of police legit-
imacy and obligation to comply: results from parish fixed-effects OLS models 203 Effect of social media tax protest/arrests on public perception of procedural
fairness of police: results from parish fixed-effects OLS models . . . . . . . . 214 Effect of social media tax protest/arrests on public perception of normative
alignment of police: results from parish fixed-effects OLS models . . . . . . . 225 Effect of social media tax protest/arrests on public perception of other mem-
bers of society: results from parish fixed-effects OLS models . . . . . . . . . 276 Results from Ordered Logit Models . . . . . . . . . . . . . . . . . . . . . . . A27 Effect of social media tax protest/arrests on public perceptions of police: re-
sults from district fixed-effects OLS models and standard errors clustered atthe district level . . . . . . . . . . . . . . . . . . . . . . . . . . . . . . . . . . A2
8 Effect of social media tax protest/arrests on public perceptions of police (withalternative NRM vote measure): results from parish fixed-effects OLS models A3
9 Effect of July 12 on public perceptions of police: results from parish fixed-effects OLS models . . . . . . . . . . . . . . . . . . . . . . . . . . . . . . . . A3
10 Effect of pre-treatment covariates on likelihood of assignment to treatmentgroup . . . . . . . . . . . . . . . . . . . . . . . . . . . . . . . . . . . . . . . . A5
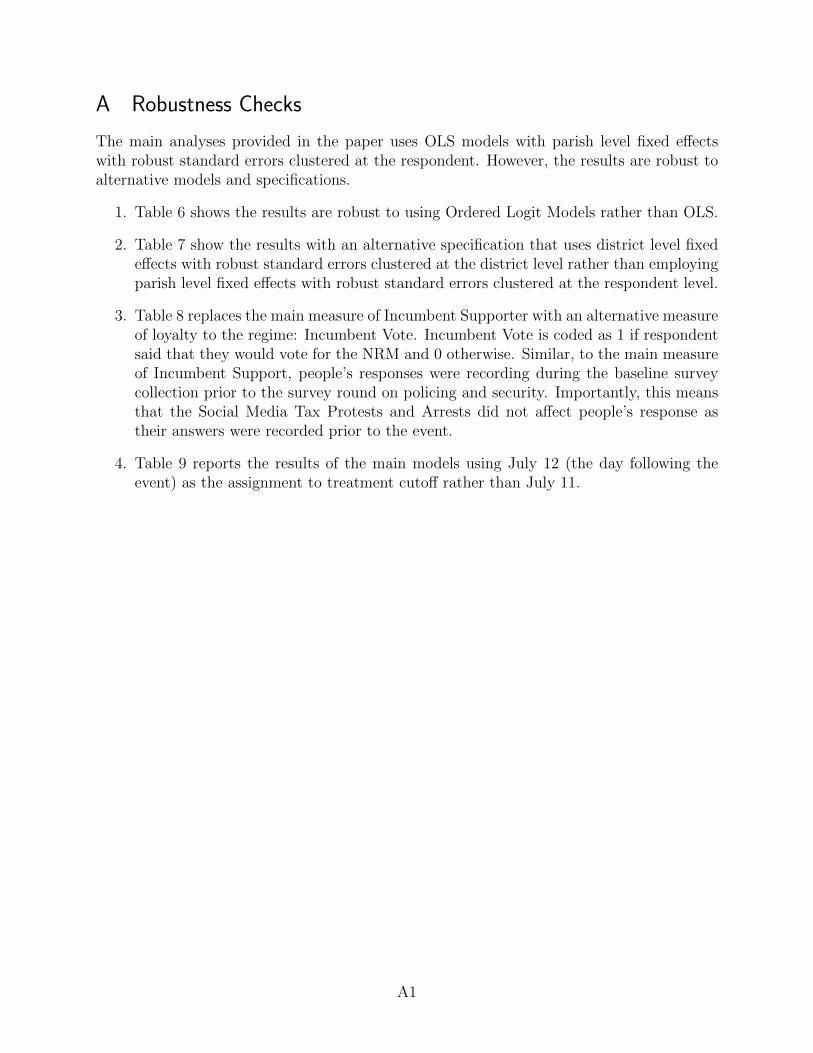
A Robustness Checks
The main analyses provided in the paper uses OLS models with parish level fixed effectswith robust standard errors clustered at the respondent. However, the results are robust toalternative models and specifications.
1. Table 6 shows the results are robust to using Ordered Logit Models rather than OLS.
2. Table 7 show the results with an alternative specification that uses district level fixedeffects with robust standard errors clustered at the district level rather than employingparish level fixed effects with robust standard errors clustered at the respondent level.
3. Table 8 replaces the main measure of Incumbent Supporter with an alternative measureof loyalty to the regime: Incumbent Vote. Incumbent Vote is coded as 1 if respondentsaid that they would vote for the NRM and 0 otherwise. Similar, to the main measureof Incumbent Support, people’s responses were recording during the baseline surveycollection prior to the survey round on policing and security. Importantly, this meansthat the Social Media Tax Protests and Arrests did not affect people’s response astheir answers were recorded prior to the event.
4. Table 9 reports the results of the main models using July 12 (the day following theevent) as the assignment to treatment cutoff rather than July 11.
A1
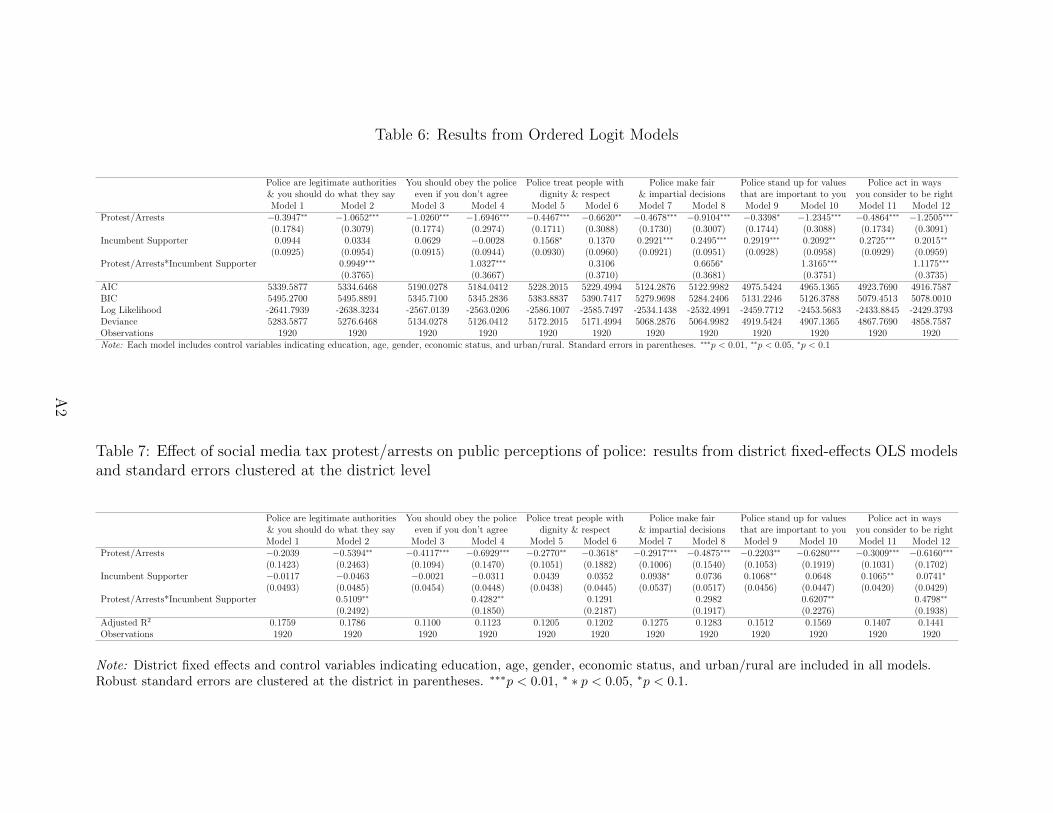
Table 6: Results from Ordered Logit Models
Police are legitimate authorities You should obey the police Police treat people with Police make fair Police stand up for values Police act in ways& you should do what they say even if you don’t agree dignity & respect & impartial decisions that are important to you you consider to be rightModel 1 Model 2 Model 3 Model 4 Model 5 Model 6 Model 7 Model 8 Model 9 Model 10 Model 11 Model 12
Protest/Arrests −0.3947∗∗ −1.0652∗∗∗ −1.0260∗∗∗ −1.6946∗∗∗ −0.4467∗∗∗ −0.6620∗∗ −0.4678∗∗∗ −0.9104∗∗∗ −0.3398∗ −1.2345∗∗∗ −0.4864∗∗∗ −1.2505∗∗∗
(0.1784) (0.3079) (0.1774) (0.2974) (0.1711) (0.3088) (0.1730) (0.3007) (0.1744) (0.3088) (0.1734) (0.3091)Incumbent Supporter 0.0944 0.0334 0.0629 −0.0028 0.1568∗ 0.1370 0.2921∗∗∗ 0.2495∗∗∗ 0.2919∗∗∗ 0.2092∗∗ 0.2725∗∗∗ 0.2015∗∗
(0.0925) (0.0954) (0.0915) (0.0944) (0.0930) (0.0960) (0.0921) (0.0951) (0.0928) (0.0958) (0.0929) (0.0959)Protest/Arrests*Incumbent Supporter 0.9949∗∗∗ 1.0327∗∗∗ 0.3106 0.6656∗ 1.3165∗∗∗ 1.1175∗∗∗
(0.3765) (0.3667) (0.3710) (0.3681) (0.3751) (0.3735)AIC 5339.5877 5334.6468 5190.0278 5184.0412 5228.2015 5229.4994 5124.2876 5122.9982 4975.5424 4965.1365 4923.7690 4916.7587BIC 5495.2700 5495.8891 5345.7100 5345.2836 5383.8837 5390.7417 5279.9698 5284.2406 5131.2246 5126.3788 5079.4513 5078.0010Log Likelihood -2641.7939 -2638.3234 -2567.0139 -2563.0206 -2586.1007 -2585.7497 -2534.1438 -2532.4991 -2459.7712 -2453.5683 -2433.8845 -2429.3793Deviance 5283.5877 5276.6468 5134.0278 5126.0412 5172.2015 5171.4994 5068.2876 5064.9982 4919.5424 4907.1365 4867.7690 4858.7587Observations 1920 1920 1920 1920 1920 1920 1920 1920 1920 1920 1920 1920Note: Each model includes control variables indicating education, age, gender, economic status, and urban/rural. Standard errors in parentheses. ∗∗∗p < 0.01, ∗∗p < 0.05, ∗p < 0.1
Table 7: Effect of social media tax protest/arrests on public perceptions of police: results from district fixed-effects OLS modelsand standard errors clustered at the district level
Police are legitimate authorities You should obey the police Police treat people with Police make fair Police stand up for values Police act in ways& you should do what they say even if you don’t agree dignity & respect & impartial decisions that are important to you you consider to be rightModel 1 Model 2 Model 3 Model 4 Model 5 Model 6 Model 7 Model 8 Model 9 Model 10 Model 11 Model 12
Protest/Arrests −0.2039 −0.5394∗∗ −0.4117∗∗∗ −0.6929∗∗∗ −0.2770∗∗ −0.3618∗ −0.2917∗∗∗ −0.4875∗∗∗ −0.2203∗∗ −0.6280∗∗∗ −0.3009∗∗∗ −0.6160∗∗∗
(0.1423) (0.2463) (0.1094) (0.1470) (0.1051) (0.1882) (0.1006) (0.1540) (0.1053) (0.1919) (0.1031) (0.1702)Incumbent Supporter −0.0117 −0.0463 −0.0021 −0.0311 0.0439 0.0352 0.0938∗ 0.0736 0.1068∗∗ 0.0648 0.1065∗∗ 0.0741∗
(0.0493) (0.0485) (0.0454) (0.0448) (0.0438) (0.0445) (0.0537) (0.0517) (0.0456) (0.0447) (0.0420) (0.0429)Protest/Arrests*Incumbent Supporter 0.5109∗∗ 0.4282∗∗ 0.1291 0.2982 0.6207∗∗ 0.4798∗∗
(0.2492) (0.1850) (0.2187) (0.1917) (0.2276) (0.1938)Adjusted R2 0.1759 0.1786 0.1100 0.1123 0.1205 0.1202 0.1275 0.1283 0.1512 0.1569 0.1407 0.1441Observations 1920 1920 1920 1920 1920 1920 1920 1920 1920 1920 1920 1920
Note: District fixed effects and control variables indicating education, age, gender, economic status, and urban/rural are included in all models.Robust standard errors are clustered at the district in parentheses. ∗∗∗p < 0.01, ∗ ∗ p < 0.05, ∗p < 0.1.
A2
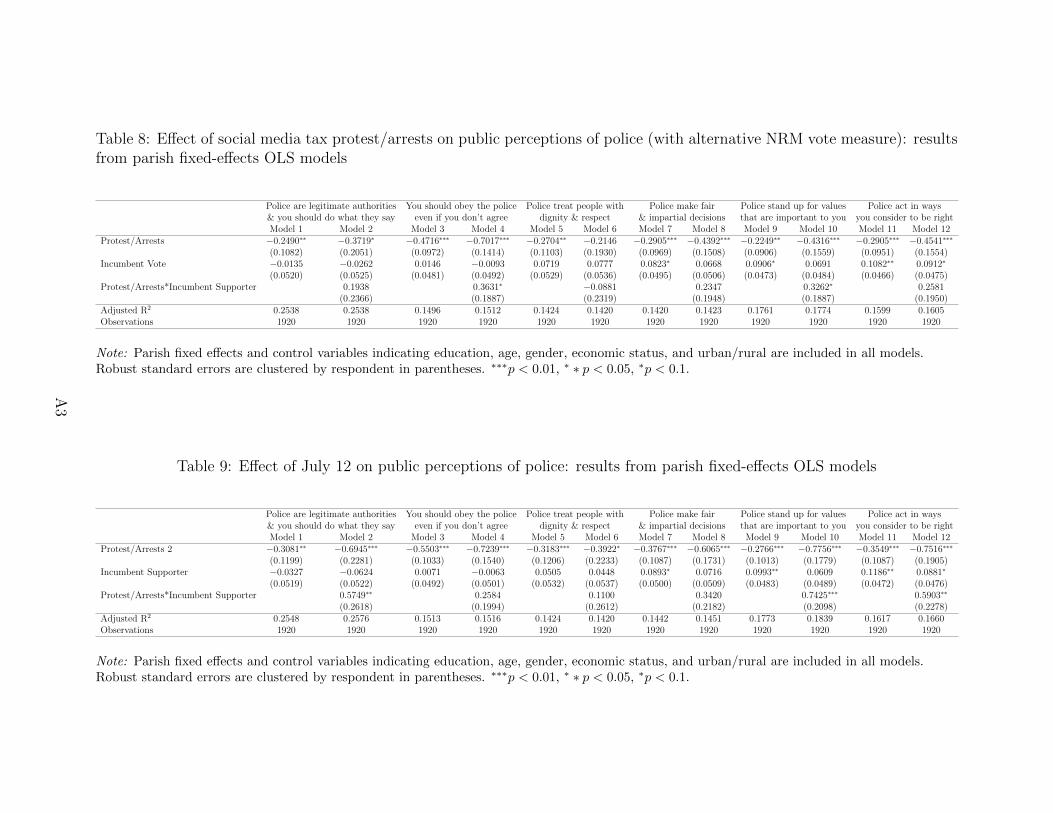
Table 8: Effect of social media tax protest/arrests on public perceptions of police (with alternative NRM vote measure): resultsfrom parish fixed-effects OLS models
Police are legitimate authorities You should obey the police Police treat people with Police make fair Police stand up for values Police act in ways& you should do what they say even if you don’t agree dignity & respect & impartial decisions that are important to you you consider to be rightModel 1 Model 2 Model 3 Model 4 Model 5 Model 6 Model 7 Model 8 Model 9 Model 10 Model 11 Model 12
Protest/Arrests −0.2490∗∗ −0.3719∗ −0.4716∗∗∗ −0.7017∗∗∗ −0.2704∗∗ −0.2146 −0.2905∗∗∗ −0.4392∗∗∗ −0.2249∗∗ −0.4316∗∗∗ −0.2905∗∗∗ −0.4541∗∗∗
(0.1082) (0.2051) (0.0972) (0.1414) (0.1103) (0.1930) (0.0969) (0.1508) (0.0906) (0.1559) (0.0951) (0.1554)Incumbent Vote −0.0135 −0.0262 0.0146 −0.0093 0.0719 0.0777 0.0823∗ 0.0668 0.0906∗ 0.0691 0.1082∗∗ 0.0912∗
(0.0520) (0.0525) (0.0481) (0.0492) (0.0529) (0.0536) (0.0495) (0.0506) (0.0473) (0.0484) (0.0466) (0.0475)Protest/Arrests*Incumbent Supporter 0.1938 0.3631∗ −0.0881 0.2347 0.3262∗ 0.2581
(0.2366) (0.1887) (0.2319) (0.1948) (0.1887) (0.1950)Adjusted R2 0.2538 0.2538 0.1496 0.1512 0.1424 0.1420 0.1420 0.1423 0.1761 0.1774 0.1599 0.1605Observations 1920 1920 1920 1920 1920 1920 1920 1920 1920 1920 1920 1920
Note: Parish fixed effects and control variables indicating education, age, gender, economic status, and urban/rural are included in all models.Robust standard errors are clustered by respondent in parentheses. ∗∗∗p < 0.01, ∗ ∗ p < 0.05, ∗p < 0.1.
Table 9: Effect of July 12 on public perceptions of police: results from parish fixed-effects OLS models
Police are legitimate authorities You should obey the police Police treat people with Police make fair Police stand up for values Police act in ways& you should do what they say even if you don’t agree dignity & respect & impartial decisions that are important to you you consider to be rightModel 1 Model 2 Model 3 Model 4 Model 5 Model 6 Model 7 Model 8 Model 9 Model 10 Model 11 Model 12
Protest/Arrests 2 −0.3081∗∗ −0.6945∗∗∗ −0.5503∗∗∗ −0.7239∗∗∗ −0.3183∗∗∗ −0.3922∗ −0.3767∗∗∗ −0.6065∗∗∗ −0.2766∗∗∗ −0.7756∗∗∗ −0.3549∗∗∗ −0.7516∗∗∗
(0.1199) (0.2281) (0.1033) (0.1540) (0.1206) (0.2233) (0.1087) (0.1731) (0.1013) (0.1779) (0.1087) (0.1905)Incumbent Supporter −0.0327 −0.0624 0.0071 −0.0063 0.0505 0.0448 0.0893∗ 0.0716 0.0993∗∗ 0.0609 0.1186∗∗ 0.0881∗
(0.0519) (0.0522) (0.0492) (0.0501) (0.0532) (0.0537) (0.0500) (0.0509) (0.0483) (0.0489) (0.0472) (0.0476)Protest/Arrests*Incumbent Supporter 0.5749∗∗ 0.2584 0.1100 0.3420 0.7425∗∗∗ 0.5903∗∗
(0.2618) (0.1994) (0.2612) (0.2182) (0.2098) (0.2278)Adjusted R2 0.2548 0.2576 0.1513 0.1516 0.1424 0.1420 0.1442 0.1451 0.1773 0.1839 0.1617 0.1660Observations 1920 1920 1920 1920 1920 1920 1920 1920 1920 1920 1920 1920
Note: Parish fixed effects and control variables indicating education, age, gender, economic status, and urban/rural are included in all models.Robust standard errors are clustered by respondent in parentheses. ∗∗∗p < 0.01, ∗ ∗ p < 0.05, ∗p < 0.1.
A3
Covariate Balance
Is there balance across pre-treatment observables? Covariate balance across observables byand large justifies the as good as random assumption. Table 10 provides two models showingthe effect of pre-treatment covariates on the likelihood of assignment to treatment. Controland treatment groups did not systematically vary by people’s pre-test assessment of whetherthe national government is doing well: reducing crime; maintaining roads and bridges; orensuring free and fair elections. Similarly, there is balance on those who said they would votefor the NRM party and consider themselves loyal to the NRM. Depending on whether themodel includes parish level fixed effects there are some in-balances in the level of educationand wealth. However, these covariates are used as control variables among others in themain analyses.
A4
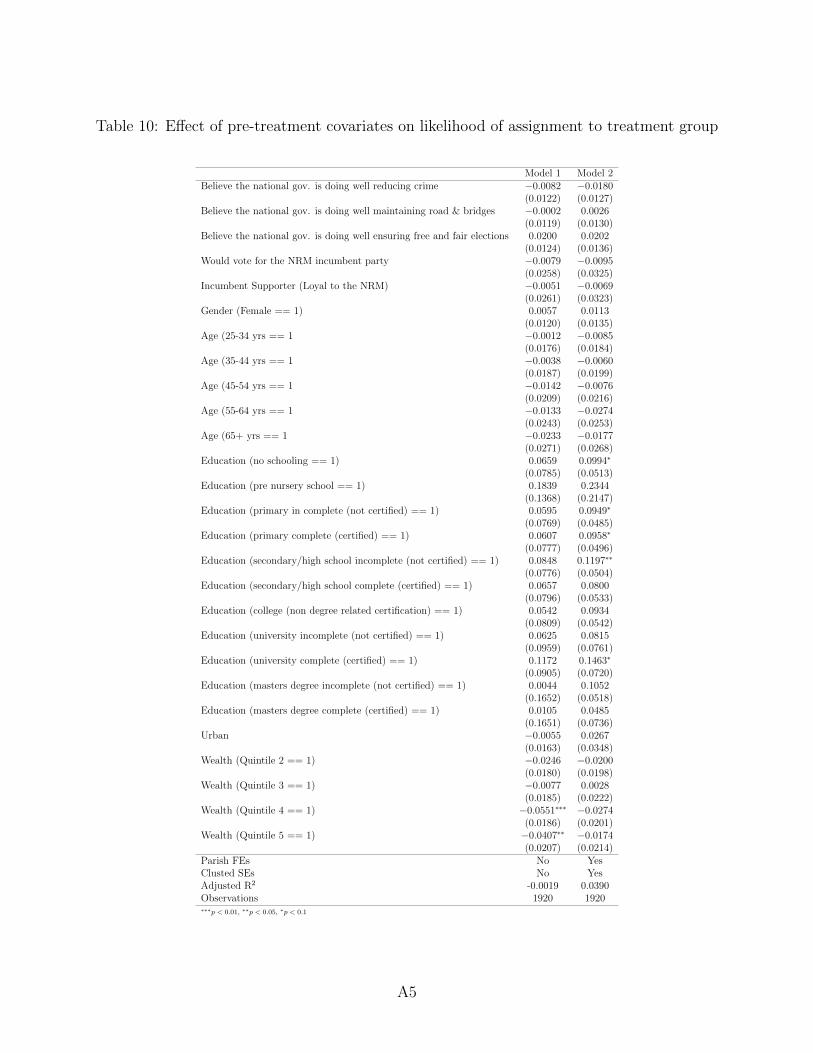
Table 10: Effect of pre-treatment covariates on likelihood of assignment to treatment group
Model 1 Model 2Believe the national gov. is doing well reducing crime −0.0082 −0.0180
(0.0122) (0.0127)Believe the national gov. is doing well maintaining road & bridges −0.0002 0.0026
(0.0119) (0.0130)Believe the national gov. is doing well ensuring free and fair elections 0.0200 0.0202
(0.0124) (0.0136)Would vote for the NRM incumbent party −0.0079 −0.0095
(0.0258) (0.0325)Incumbent Supporter (Loyal to the NRM) −0.0051 −0.0069
(0.0261) (0.0323)Gender (Female == 1) 0.0057 0.0113
(0.0120) (0.0135)Age (25-34 yrs == 1 −0.0012 −0.0085
(0.0176) (0.0184)Age (35-44 yrs == 1 −0.0038 −0.0060
(0.0187) (0.0199)Age (45-54 yrs == 1 −0.0142 −0.0076
(0.0209) (0.0216)Age (55-64 yrs == 1 −0.0133 −0.0274
(0.0243) (0.0253)Age (65+ yrs == 1 −0.0233 −0.0177
(0.0271) (0.0268)Education (no schooling == 1) 0.0659 0.0994∗
(0.0785) (0.0513)Education (pre nursery school == 1) 0.1839 0.2344
(0.1368) (0.2147)Education (primary in complete (not certified) == 1) 0.0595 0.0949∗
(0.0769) (0.0485)Education (primary complete (certified) == 1) 0.0607 0.0958∗
(0.0777) (0.0496)Education (secondary/high school incomplete (not certified) == 1) 0.0848 0.1197∗∗
(0.0776) (0.0504)Education (secondary/high school complete (certified) == 1) 0.0657 0.0800
(0.0796) (0.0533)Education (college (non degree related certification) == 1) 0.0542 0.0934
(0.0809) (0.0542)Education (university incomplete (not certified) == 1) 0.0625 0.0815
(0.0959) (0.0761)Education (university complete (certified) == 1) 0.1172 0.1463∗
(0.0905) (0.0720)Education (masters degree incomplete (not certified) == 1) 0.0044 0.1052
(0.1652) (0.0518)Education (masters degree complete (certified) == 1) 0.0105 0.0485
(0.1651) (0.0736)Urban −0.0055 0.0267
(0.0163) (0.0348)Wealth (Quintile 2 == 1) −0.0246 −0.0200
(0.0180) (0.0198)Wealth (Quintile 3 == 1) −0.0077 0.0028
(0.0185) (0.0222)Wealth (Quintile 4 == 1) −0.0551∗∗∗ −0.0274
(0.0186) (0.0201)Wealth (Quintile 5 == 1) −0.0407∗∗ −0.0174
(0.0207) (0.0214)Parish FEs No YesClusted SEs No YesAdjusted R2 -0.0019 0.0390Observations 1920 1920∗∗∗p < 0.01, ∗∗p < 0.05, ∗p < 0.1
A5