Embed Size (px)
Citation preview

Email: Website:
[email protected] www.lifetime-reliability.com
C:\Users\Mike\Documents\Lifetime Reliability\Seminars and Workshops\Lean Six Sigma\Value Stream
Mapping\How_Profit_Contribution_Mapping_Turns_Waste_into_Production_Productivity_Rev0 (2).docx Page 1 of 34
How Profit Contribution Mapping
Turns Wasted Money into Outstanding
Operational Productivity and Profits

Email: Website:
[email protected] www.lifetime-reliability.com
C:\Users\Mike\Documents\Lifetime Reliability\Seminars and Workshops\Lean Six Sigma\Value Stream Mapping\How_Profit_Contribution_Mapping_Turns_Waste_into_Production_Productivity_Rev0 (2).docx Page 2 of 34
How Profit Contribution Mapping
Turns Wasted Money into Outstanding
Operational Productivity and Profits
CONTENTS
The Value Stream Mapping Concept ................................................................................................... 3
Value vs. Non-Value ...................................................................................................................................................... 3
Current State Map / Future State Map ............................................................................................................................ 4
Start with a Process Map of the Situation ....................................................................................................................... 7
Equipment Process Maps ................................................................................................................................................ 7
Work Activity Process Maps .......................................................................................................................................... 9
Identify and Write Down the Process Step Risks ........................................................................................................... 9
Equipment Risk Review ................................................................................................................................................. 9
Work Process Risk Review ............................................................................................................................................. 9
Process Step Contribution Mapping .................................................................................................. 14
Properties of Production Processes ............................................................................................................................... 14
Bottomless Pits of Losses and Waste ............................................................................................................................ 15
Identifying Value Contribution ..................................................................................................................................... 16
The Process Step Contribution Map ............................................................................................................................. 18
Cost Analysis ................................................................................................................................................................ 18
Developing Profit Contribution Equations ................................................................................................................... 19
Collecting Cost Data ..................................................................................................................................................... 20
Capturing Process Step Costs ....................................................................................................................................... 21
Comparison with Standard Costs .................................................................................................................................. 23
Performance Measures and Reporting .......................................................................................................................... 23
Example E.1: Process Cost Mapping ........................................................................................................................... 24
INDEX ............................................................................................................................................... 33

Email: Website:
[email protected] www.lifetime-reliability.com
C:\Users\Mike\Documents\Lifetime Reliability\Seminars and Workshops\Lean Six Sigma\Value Stream Mapping\How_Profit_Contribution_Mapping_Turns_Waste_into_Production_Productivity_Rev0 (2).docx Page 3 of 34
How Profit Contribution Mapping
Turns Wasted Money into Outstanding
Operational Productivity and Profits
*********************************************************
Value Stream Mapping is a business process improvement tool. It derives from the Toyota Production
System where it was used to identify the seven wastes in a production process1. It is now used across all
business processes because the principle of finding and removing waste applies throughout every business.
But Value Stream Mapping (VSM) can be extended to do Process Step Contribution Mapping. Whereas
value stream mapping focuses only on identifying the seven wastes in a process, Process Step Contribution
Mapping focuses on the financial gains and losses happening in every process step. The power of Process
Step Contribution Mapping is its ability to identify exactly where every dollar goes in a business. Typically,
organisations examine the financial performance of their departments, but few businesses establish financial
data collection on what actually happens within their processes, preferring instead to employ supervisors and
managers to control and direct the operation and get delayed historic results on their performance.
The Value Stream Mapping Concept
“Value” is determined by the end customer. It means identifying what the customer is willing to pay for, as
that creates “value” for him/her. The whole process of producing and delivering a product or service should
be examined and optimized from the customer‟s point of view. Once the “value” is defined, one can then
explore the value stream. A value stream being all activities – both value-added and non-value added – that
are currently required to bring the product from start through to the customer2. It enables users to understand
the flow of material and information and visualize the process.
Value vs. Non-Value3
It is important to examine the process from the customer‟s perspective. The first question is always “What
does the customer want from this process?” as this defines value. Through the customer‟s eyes, one can
observe a process and separate the value-added steps from the non-value-added steps. According to
Yasuhiro Monden, there are 3 types of operations within the context and they can be categorized into4:
(1) Value-Adding (VA)
(2) Non-Value-Adding (NVA)
(3) Necessary but Non-Value-Adding (NNVA)
For manufacturing Value-Adding operations involve the conversion or processing of raw materials or semi-
finished products through the use of manual labour. For example, in the case of a steel mill, hot rolling, raw
coil pickling, cold rolling, welding and etc., fall within this category. Non-Value-Adding operations do not
make a product or service more valuable. These are termed pure waste and involve unnecessary actions that
should be eliminated completely. Some of the examples are increased waiting time, double handling,
unnecessary inventory, inspection and etc. Necessary but Non-Value-Adding operations are wasteful, but
may be necessary under the current operating procedures. These types of operations are difficult to remove in
the short run and should be targeted in the longer term by making changes in the present operations.
1 Liker, Jeffery K., The Toyota Way 14 Management Principles from the World’s Greatest Manufacturer, McGraw Hill, 2004 2 Rother, Mike and Shook, John. 2003. Learning to See: Value-Stream Mapping to create value and eliminate muda. Lean Enterprise Institute. USA 3 Ong Yong Shun, Bernard, Value Stream Mapping, Curtin University, 2007 4 Monden, Yasuhiro. 1983. Toyota Production System. Industrial Engineering and Management Press: IIE. Atlanta

Email: Website:
[email protected] www.lifetime-reliability.com
C:\Users\Mike\Documents\Lifetime Reliability\Seminars and Workshops\Lean Six Sigma\Value Stream Mapping\How_Profit_Contribution_Mapping_Turns_Waste_into_Production_Productivity_Rev0 (2).docx Page 4 of 34
Current State Map / Future State Map
VSM provides a systematic way for lean manufacturing implementation by illustrating how information and
material should flow, via current and future state mapping techniques. The current state map should illustrate
how the organization‟s process performs under the current work environment. To create the current state
map, the members of the team need to collect the data and information by walking the flow and interviewing
the people who perform the tasks.
The team will be able to gather important information such as cycle time, changeover time, reliability of
equipment, quantities, number of operators and shifts, inventory levels, queue times and etc. With the
information, users can also determine the takt time.
Takt is a German word for rhythm or meter. In manufacturing, takt is the rate of customer demand – the rate
at which the customer is buying the product5. Takt time is calculated based on the available production time
divided by customer demand. For example, if the customer wants 960 products per day and workers are to
work two shifts with 480 minutes of scheduled production on each shift, then takt time is one minute.
If the organization produces at a rate faster than one per minute, then there will be over-production. This in
turn requires extra people, containers, floor space, and equipment to move and store the inventory. On the
other hand, if its at a rate slower than takt time, bottlenecks are then created and customer demands will not
be met. These bottlenecks should also be highlighted when studying the current state map as they should be
the ones which need to be addressed in the value stream. When used effectively, takt time can be used to set
the pace of production and alert workers whenever they are getting ahead or falling behind.
With the information gathered, the team can then build and draw the Current State Value Stream Map
(CSVSM).
Figures 1 illustrates how VSM can be used at every level of work in a business and Figure 2 identifies the
worth of Lean thinking and Lean practices to a business.
5 Liker, Jeffery K., The Toyota Way 14 Management Principles from the World’s Greatest Manufacturer, McGraw Hill, 2004

Email: Website:
[email protected] www.lifetime-reliability.com
C:\Users\Mike\Documents\Lifetime Reliability\Seminars and Workshops\Lean Six Sigma\Value Stream Mapping\How_Profit_Contribution_Mapping_Turns_Waste_into_Production_Productivity_Rev0 (2).docx Page 5 of 34
Figure 1 - The Lean Waste Removal Process for Increasing the Proportion of Added Value
Business Value-Add
Business Process 1
Business Process 2
Business Process 3
Business Process 4
Business Process 5
Process Value-Add
Process Step 1
Process Step 2
Process Step 3
Process Step 4
Process Step 5
Personal Value-Add
Task 1 Task 2 Task 3 Task 4 Task 5
Value-Add
No
n V
alu
e-A
dd
No
n V
alu
e-A
dd
Value-Add
No
n V
alu
e-A
dd
No
n V
alu
e-A
dd
Value-Add
No
n V
alu
e-A
dd
No
n V
alu
e-A
dd
Value-Add Value-Add
Value-Add
No
n V
alu
e-A
dd
No
n V
alu
e-A
dd
Value-Add
No
n V
alu
e-A
dd
No
n V
alu
e-A
dd
Value-Add
No
n V
alu
e-A
dd
No
n V
alu
e-A
dd
Value-Add Value-Add
Value-Add
No
n V
alu
e-A
dd
No
n V
alu
e-A
dd
Value-Add
No
n V
alu
e-A
dd
No
n V
alu
e-A
dd
Value-Add
No
n V
alu
e-A
dd
No
n V
alu
e-A
dd
Value-Add Value-Add
Continual Improvement
loop
Continual Improvement
loop

Email: Website:
[email protected] www.lifetime-reliability.com
C:\Users\Mike\Documents\Lifetime Reliability\Seminars and Workshops\Lean Six Sigma\Value Stream Mapping\How_Profit_Contribution_Mapping_Turns_Waste_into_Production_Productivity_Rev0 (2).docx Page 6 of 34
Figure 2 - The Use of Lean Thinking in a Business
Business
Process 1
Business
Process 2
Business
Process 3
Business
Process 4
Business
Process 5
Process
Value-Add Process
Step 1
Process
Step 2
Process
Step 3
Process
Step 4
Process
Step 5
Personal
Value-Add Task 1 Task 2 Task 3 Task 4 Task 5
Value-
Add
No
n V
alu
e-A
dd
No
n V
alu
e-A
dd
Value-
Add
No
n V
alu
e-A
dd
No
n V
alu
e-A
dd
Value-
Add
No
n V
alu
e-A
dd
No
n V
alu
e-A
dd
Value-
Add
Value-
Add
Value-
Add
No
n V
alu
e-A
dd
No
n V
alu
e-A
dd
Value-
Add
No
n V
alu
e-A
dd
No
n V
alu
e-A
dd
Value-
Add
No
n V
alu
e-A
dd
No
n V
alu
e-A
dd
Value-
Add
Value-
Add
Value-
Add
No
n V
alu
e-A
dd
No
n V
alu
e-A
dd
Value-
Add
No
n V
alu
e-A
dd
No
n V
alu
e-A
dd
Value-
Add
No
n V
alu
e-A
dd
No
n V
alu
e-A
dd
Value-
Add
Value-
Add
Continual Improveme
nt loop
Continual Improveme
nt loop
Business
Value-Add
Technology
Innovation
Competition
Testing
Analysis
Globalisation
Visual
Management
Society
Laws and Regulations
Environment
Right First Time Quality
Waste
Removal
Safety
Six Sigma
SMED
Customer Expectations
Cost

Email: Website:
[email protected] www.lifetime-reliability.com
C:\Users\Mike\Documents\Lifetime Reliability\Seminars and Workshops\Lean Six Sigma\Value Stream
Mapping\How_Profit_Contribution_Mapping_Turns_Waste_into_Production_Productivity_Rev0 (2).docx Page 7 of 34
Start with a Process Map of the Situation
Whether you are improving a work process or on an equipment item, the process map is a „picture‟ of how a
thing works. Drawing a process map of a situation lets you understand its workings and find the weaknesses
in the process. Figure 3 is a process map of the life-cycle of plant and equipment.
Figure 3 – A Process Map of the Equipment Life Cycle
Without the process map it would be difficult to imagine a life cycle, much less find its weaknesses. As a
map the life cycle of plant and equipment is drawn in a form that allows risks to be identified, analysed and
discussed. The map immediately shows-up the great weakness in the life cycle – it is a series arrangement.
Using a process map, whether it is for a work process, production process or the parts in a machine, lets you
ask the right questions that lead to understanding and reducing risk. It is the start of all equipment reliability
and business process improvement strategies.
Equipment Process Maps
The equipment process map is used to identify what is required for highly reliable parts and assemblies and
starts the process of developing strategies to provide those outcomes. Maximising the reliability of
equipment requires identifying and controlling the operating risks added at every stage of design, installation
and operation. Removing them if at all possible, and unrelentingly reducing them if not.
Figure 4 is a series of process maps for a centrifugal pump-set „picturing‟ the equipment‟s construction and
operation. It helps you identify where failures will stop the equipment working. With it you spot the risks to
its operation by asking at each step along the process - “If this step fails, how will it affect the outcome of the
process?” Once we know the risks that can stop the process, we can put the right plans and actions into place
to prevent and reduce those risks.
The equipment process maps are made detailed enough to use them to identify the operational risks on the
equipment being examined. For example, the mechanical seal in the wet-end does not have a process map.
When the working parts of a mechanical seal fail the whole seal becomes unusable and the pump must be
stopped. To identify the consequent impact of seal failure on the pump we do not need to know every way
that a mechanical seal can be failed. We only need to realise that when the seal fails so does the pump.
Similarly, the shaft drive coupling does not have its own process map because the box on the diagram
sufficiently represents the part for identifying the risks it causes to the pump, should it fail.
Normally, process mapping is sufficient if it identifies the presence of operational risk to an equipment
assembly. In some cases, you may want to process map an assembly right down to its individual parts and
investigate the risks each part carries. You could expand the „wiring and circuitry‟ box in Figure 2 to find
the risks carried by individual components in the power supply system. If it became necessary to understand
what can cause the mechanical seal or the coupling to fail, the process map of the assembly is drawn and
analysed to identify the risks carried by its individual parts.
Expanding a process map to include more equipment assembly details is encouraged when it is not certain
how far to take the mapping. For example, it is necessary to expand the electric motor frame and volute to
include the supports because a solid base is critical to the operating life of the pump-set. It is important to
know the risks the supports carry, as their failure will fail the pump-set. Expanding an item on a process map
forces people to consider the risks it carries. If items are left-off a process map there will be no purposeful
risk controls installed to protect the equipment.
Concept Feasibility Design Install Select Operate Decommission Approve

Email: Website:
[email protected] www.lifetime-reliability.com
C:\Users\Mike\Documents\Lifetime Reliability\Seminars and Workshops\Lean Six Sigma\Value Stream Mapping\How_Profit_Contribution_Mapping_Turns_Waste_into_Production_Productivity_Rev0 (2).docx Page 8 of 34
Figure 4 – A Process Map of a Centrifugal Pump-set Delivering Product
Using a process map provides us with one more powerful perspective for risk analysis. We can perform
„what-if‟ analysis and visualise the effects of multiple causes of failure acting together. Such as, „What if the
motor frame is loose on its support, what else will it affect?‟ or „What if the power cable has a cracked
sheath, how will it affect the pump-set foundation, or the motor bearings, or the mechanical seal?‟ and be
better able to appreciate consequential failures from remote causes.
Here are some guidelines to help develop a useful process map flow sequence.
Follow the energy flow. Draw maps starting from the energy source and follow the process through to
the lowest energy level. E.g., the energy from the electric motor travels through the motor shaft, the
coupling and into the pump shaft.
Follow the path of the force. From the location a force is applied, follow the force and loads to the final
points of restraint. E.g., the holding bolts restrain the power generated by the electric motor driving the
pump in Figure 4.
Follow the product flow. Start mapping at the point product enters and follow the process through to
where the product leaves. E.g., the liquid moving though the pump enters at the suction nozzle and
leaves at the discharge nozzle.
Because most equipment types are used repeatedly in industry, once you have the first process map for a type
you can copy it again and again. Alternating current (AC) electric motors are an example. You can reuse
Power Supply
Switch Board
Power Cable
Electric Motor
Drive Coupling
Wet End Bearing Housing
Product Flows
Stator Motor Bearings
Motor Shaft
Motor Frame
Rotor Shaft Rotates
Terminal Connections
Brushes
Mechanical Seal
Cut Water
Discharge Pump Shaft
Volute Liquid Flows
Suction Impeller
Base Plate
Supports Equipment
Pedestal Foundation Holding Bolts
Base Plate
Supports Equipment
Pedestal Foundation Holding Bolts
Frame Shaft Rotates
Pump Shaft
Shaft Bearings
Bus Bars Electricity Flows
Starter Drive Rack
Power Provider
Transmission Line
Transformer Power Arrives
Wiring and Circuitry

Email: Website:
[email protected] www.lifetime-reliability.com
C:\Users\Mike\Documents\Lifetime Reliability\Seminars and Workshops\Lean Six Sigma\Value Stream Mapping\How_Profit_Contribution_Mapping_Turns_Waste_into_Production_Productivity_Rev0 (2).docx Page 9 of 34
the process map for AC electric motors over a large range of sizes. A 5kW AC electric motor would have
the same process map as an 11kW electric motor. This saves time analysing all AC electric motors in an
operation. You would not use an AC electric motor process map for a hydraulic motor. They are not
identical. The hydraulic motor works in a totally different way to an AC electric motor. The hydraulic
motor needs its own process map. But once drawn the process map can be used again for similar hydraulic
motors and adjusted for peculiarities.
Work Activity Process Maps
Work tasks and activities that impact on operating plant and equipment are also process mapped. If job
procedures are available, convert them into process maps. An example of a process map for a clerical task
recording important cost information is shown in Figure 5. The tasks in the process map are intentionally
drawn across the page so that value stream mapping and risk analysis can be applied later. Where job
procedures are not available, ask people what they do and record the steps they actually follow (not what
they say they do). From the description, develop the work activity process map.
Identify and Write Down the Process Step Risks
The next step is to identify the risks that are present for each box on the map. Later you will develop a
written plan to reduce the causes of unacceptable risks. It is used to perform a risk analysis and develop risk
management strategy, plans and actions.
Equipment Risk Review
A risk identification table for production equipment is developed in two separate steps.
List equipment, assemblies and sub-assemblies in a table like that of Table 1. The table listing eventually
grows into the Total Productive Maintenance strategy for the operation. Maintenance provides
equipment reliability and reduces operational risk. It can also cut production costs if targeted on
reducing production wastes by ensuring equipment and operating plant work efficiently. Initially a
high-level Failure Mode and Effect Analysis (FMEA) is conducted at the equipment and assembly level
using the production process maps.
A small team of people knowledgeable in the design, use and maintenance of the equipment assemble
together to work through the maps, asking what causes each operating equipment item to fail, including
identifying failures from possible combined causes. The size and composition of the team is not critical as
long as it contains the necessary design, operation and maintenance knowledge and expertise covering the
equipment being reviewed. Ideally, Operations and Maintenance shopfloor level supervisors are in the
review team so they understand the purpose of the review, and can later support the efforts needed to
instigate and perform the risk control activities that will arise.
The team completes a risk analysis, recording in the risk identification table likely risks to equipment in the
operation, their impact if the worst was to happen, along with their DAFT Cost, and any explanatory
comment. There is no need to record a failure cause if team consensus is that it cannot happen. But if one
team member wants the cause recorded, then do so. Number each entry uniquely so it can be identified and
referred to in future correspondence and discussion. The second step uses the equipment failure history.
From the maintenance work history in the CMMS (Computerised Maintenance Management System) or
documented history records, go through equipment by equipment and identify any other type of failure not
recorded in the team review. In this step it is also worth counting the number of each type of failure, and the
dates they occurred for later reliability analysis.
Work Process Risk Review

Email: Website:
[email protected] www.lifetime-reliability.com
C:\Users\Mike\Documents\Lifetime Reliability\Seminars and Workshops\Lean Six Sigma\Value Stream Mapping\How_Profit_Contribution_Mapping_Turns_Waste_into_Production_Productivity_Rev0 (2).docx Page 10 of 34
Work done by human beings can be wrong. We need to identify, prevent and control risks that arise from
human error. The risk identification method used for equipment is also used to identify human error and
work quality caused risks in work processes. The tasks and actions on the work process map are written into
a spreadsheet table. Each step is analysed to find the risks and identify parallel test activities, or error-
proofed methods, to stop them going wrong. If human error cannot be prevented, then reduce the
consequences of the error. Table 2 lists the work process of Figure 5, the monthly cost report, as an example
of identifying human-error risks in workplace processes. Usually risk control actions and parallel proof-tests
are self-evident and are written into the table as it is developed.

Email: Website:
[email protected] www.lifetime-reliability.com
C:\Users\Mike\Documents\Lifetime Reliability\Seminars and Workshops\Lean Six Sigma\Value Stream Mapping\How_Profit_Contribution_Mapping_Turns_Waste_into_Production_Productivity_Rev0 (2).docx Page 11 of 34
Figure 5 – A Job Procedure Converted into a Work Process Map
Secretary assembles information
into cost centres for
ease of data entry
Secretary enters
information into cash flow spreadsheet
using the Cashflow
Spreadsheet Procedure
Collate Monthly
Costs
On the first working day after month
end secretary gathers sales information
from accountants
Start Information
Collection
Compile Cost
Spreadsheet
Production Department Monthly Cost Report Procedure
Department manager
sends report to Head Office electronically
Department manager
writes monthly report using
standard report layout and enters
relevant content
Are all Costs
Included?
Department manager
reviews a print of the
spreadsheet for
correctness and
completeness of details
Review Cost
Spreadsheet
Forward Report to
Head Office
Follow up any queries with
persons responsible and make necessary
adjustments
All costs included
and correct?
Yes
No
Include any additional costs and
make necessary
corrections in the
spreadsheet
Write Monthly
Report
The report must be
completed by the 5
th working
day of the month
Work through the procedure
as written recording the
necessary information as
required

Email: Website:
[email protected] www.lifetime-reliability.com
C:\Users\Mike\Documents\Lifetime Reliability\Seminars and Workshops\Lean Six Sigma\Value Stream Mapping\How_Profit_Contribution_Mapping_Turns_Waste_into_Production_Productivity_Rev0 (2).docx Page 12 of 34
Equipment Assembly Sub-Assy or
Parts
Sub-Sub
Assy or Parts
Risks - Possible
Causes of Failure
Effects of Worst Likely
Failure
DAFT Cost of
Worst Failure Comments
Pump-set 01
1 Power Supply 1. Power Provider failure 1. Downtime $100,000
$25,000 per hour. Minimum 4 hours if power is
turned off
2. Lightening strike 1. Downtime $200,000 Minimum 8 hours if power is lost due to failure
2 Switch Board
1. Fire 1. Downtime $200,000
2. Liquid ingress 1. Downtime $200,000
3. Impact 1. Downtime $200,000
3 Panel Connection
1. Loose clamp bolts 1. Fire in switchboard
2. Poor cable crimping 1. Fire in switchboard
4 Drive Rack
1. Dust from Product 1. Fire in switchboard
2. Poor assembly 1. Fire in switchboard
3. Rust into place 1. Downtime
5 Motor Starter 1. Overload 1. Downtime
2. Short circuit 1. Major electrical burn
6 Power Cable
7 Electric Motor
8 Connection
9 Motor frame
10 Base Plate
11 Holding Bolts
12 Pedestal
13 Foundation
14 Stator
15 Brushes
16 Rotor
17 Bearings
18 Shaft
19 Drive Coupling
20 Bearing Housing
22 Shaft
Table 1 – Risks Identification Table Layout for Pump-set Parts and Assemblies

Email: Website:
[email protected] www.lifetime-reliability.com
C:\Users\Mike\Documents\Lifetime Reliability\Seminars and Workshops\Lean Six Sigma\Value Stream Mapping\How_Profit_Contribution_Mapping_Turns_Waste_into_Production_Productivity_Rev0 (2).docx Page 13 of 34
Department Process Job Task
Risks -
Possible
Causes of
Failure
Effects of
Worst
Likely
Failure
DAFT
Cost of
Worst
Failure
Risk Control Plans Actions to be Taken Proof that Actions
are Completed
Production
1
Monthly
Cost
Report
2 Start Information
Collection
Gather Sales information
from Accounts
1. Information
not available
Report not
completed on time
$500 Warn Accounts of impending
report date
Set-up a electronic schedule entry to automatically warn Accounts
Manager one week prior report due
date
Department Manager to
check schedule entered
2. Wrong information
provided
Bad management
decision
$10,000 Get Accounts to double-check
cost information is correct
Accounts to include double check
actions into their work procedure
Accounts to send copy of
revised procedure to
Department Secretary for review
3. Incomplete information
presented
Bad management
decision
$10,000 Get Accounts to double-check
cost information is complete
Accounts to include double check
actions into their work procedure
Accounts to send copy of
revised procedure to
Department Secretary for review
3
Collate
Monthly Costs
Put costs into
cost centres
4 Compile Spreadsheet
Enter cash flow
details using data entry
procedure
5 Review Cost Spreadsheet
Department
Manager checks
spreadsheet
6 Confirm all costs are
recorded
7
Write
Monthly Report
Department
Manager writes report
8
Report
forwarded to Head Office
Table 2 –Risks Identification Table and Risk Management Plan for a Work Activity Process

Email: Website:
[email protected] www.lifetime-reliability.com
C:\Users\Mike\Documents\Lifetime Reliability\Seminars and Workshops\Lean Six Sigma\Value Stream
Mapping\How_Profit_Contribution_Mapping_Turns_Waste_into_Production_Productivity_Rev0 (2).docx Page 14 of 34
Process Step Contribution Mapping
The higher you keep the process efficiency, the smaller are your losses, and the more profit you make. You
need to know the size and location of your losses in order to target maintenance on improving the plant and
process efficiency.
Process Step Contribution is a financial diagnostic tool used to produce key performance indicators of
process efficiency. It provides a snapshot of the money flows in and out of a process step. With it you
know where the wastes and losses are in your process. It is a fundamental tool for improving business
profitability rapidly. Instead of waiting for financial reports delivered weeks after doing the work, Process
Step Contribution maps the true costs of operating a process while it is happening. It provides accounting
and cost data about each step in a process and allows identification of opportunities to improve the step‟s
efficiency and effectiveness. With each step‟s money flows known, it becomes clear where there are
excesses and waste. Knowing the money made and lost permits focused and targeted process improvement
and re-engineering to minimise the wastes and losses.
Application of Process Step Contribution Mapping employs cost accounting and activity based costing
practices to accurately identify money movements throughout the steps of process. The money movements
in each step are modelled using basic accountancy equations. Once the equations for each process step are
developed, Process Step Contribution Mapping uses the financial information and data already available in
the business to snapshot what is happening. The cost equations reflect truly the money flows in a step and
their development requires engineering precision to capture every cost and waste. By understanding the
financial details of what happens in a process step it becomes possible to identify improvements and better
practices to optimise that step, and so make the whole process more productive and profitable.
Figure 6 is a symbolic production, manufacturing or service process diagram showing a series of boxes for
each conversion step in the process, with materials, utilities, services and labour flows represented by arrows.
Production, processing and manufacturing systems turn raw materials into finished products through a series
of steps that progressively convert them into saleable products. Typically, a conversion process takes raw
materials and adds inputs such as labour, utilities, like power and water, specialist services, like engineering
and maintenance, supplementary materials, like boxes for packaging, along with other necessary
requirements, to make products customers buy. Maximising profit requires both efficiency and effectiveness
from every step. An effective process makes and delivers what the customer wants. An efficient operations
process delivers the profit the shareholders want. An important job for managers, economists, accountants
and engineers is to develop business systems that reliably achieve seamless operation to the benefit of the
organisation, its customers and community. This requires on-going commitment to continually improve and
tune the organisation to be more efficient and work faster, better and cheaper.
Properties of Production Processes
In Figure 6, raw materials enter each step. The added inputs include the utilities (power and water) and
services (such as boxes for the product, labour man-hours, lubricants for machines, etc) needed to complete
the process step. The process steps use these to add value and make the products produced by the
organisation. During production, the product increases in value equal to the sum of value added in each
conversion step. Each value-adding step contributes part of the profit made. A process step does not
produce perfect conversion and some losses occur. The customer pays for those unwanted losses when they
buy the product.
A production process should only make what the market will purchase. Otherwise it ties-up money in
product and inventory that no one wants. Balanced production means buying raw material and inputs at the
same rate that you sell the product. Market and business economics act to regulate and control the
production rate and consequently the amount of raw materials and inputs you buy. This is the essence of a
market-based, capitalist economy – products that people want, in production systems balanced to the demand.

Email: Website:
[email protected] www.lifetime-reliability.com
C:\Users\Mike\Documents\Lifetime Reliability\Seminars and Workshops\Lean Six Sigma\Value Stream
Mapping\How_Profit_Contribution_Mapping_Turns_Waste_into_Production_Productivity_Rev0 (2).docx Page 15 of 34
Figure 6 - A Business Conversion Process
From Figure 6 we can propose five simple properties of a business process:
i. A process step adds value if the output is worth more than the sum of raw materials, inputs and losses.
ii. The customer demand rate dictates the manufacturing rate.
iii. The process design establishes production efficiency and costs.
iv. Process design determines product quality.
v. The bottleneck limits the maximum throughput rate for the process.
Bottomless Pits of Losses and Waste
Process losses behave differently to anything else in the production process. Market demand does not
naturally limit them. Their limit is how much money is available to the production system. All wastes take
money from what were profits. Because there are no systematic internal constraints on waste, control is
by minimising them during design and by managing them to minimal levels during operation.
Usually not seriously considered in business process design are the amounts of losses produced – the wastes.
Standard accounting and cost accounting systems do not measure them. The wastes include the obvious
waste product and scrap materials commonly associated with production waste. But there are many other
types of waste produced. Other wastes, which are numerous and common but not often noticed, include such
things as excess movement, lost heat, lost water, lost energy, excess storage space, excess in-process
inventory, excess time, lost time, quality defects, excess forklift pallet hire, excess equipment hire, safety
incidents, environmental incidents, excess paperwork, excess manning, and many, many more. Figure 7 is a
business losing profit through its wastes.
Some of these wastes are identifiable by using value stream mapping, typically time, motion and distance,
but the technique does not price lost moneys. In order to recognise the cost impact of waste it is necessary to
identify their real financial loss to a business with Process Step Contribution Mapping. Waste creation has
no natural means of self-control beyond bankrupting the business. Businesses need control systems that
monitor the waste and force its minimisation and eventual total elimination. There are now two additional
properties of a process:
vi. Wastes extract effort and profits from a process.
vii. The process can turn raw materials and inputs into waste so that the process makes waste instead of
profit, to the point where waste consumes all the profits.
2 3 4 5 6 1
Inputs Inputs Inputs Inputs
Raw Materials
Customer
Bottleneck
Each process step product is raw material for the next step
Losses Losses
Losses Losses
Final Product

Email: Website:
[email protected] www.lifetime-reliability.com
C:\Users\Mike\Documents\Lifetime Reliability\Seminars and Workshops\Lean Six Sigma\Value Stream
Mapping\How_Profit_Contribution_Mapping_Turns_Waste_into_Production_Productivity_Rev0 (2).docx Page 16 of 34
Figure 7 - Losses and Wastes in a Production Process
We can use these seven properties of a business process to understand how money behaves within it and to
identify the costs and wastes that reduce its performance and profit. This analysis process is Process Step
Contribution Mapping. It spots all wastes and identifies all moneys lost.
Identifying Value Contribution
Once a process is operating, people‟s concerns naturally turn to making the product on-time. The demand to
make product on-time often overrides the need to make it cost effectively. This leads to situations where
everyone is busy making product, but no one is busy making profit. If this situation occurs in an
organisation, the creation of waste, instead of profit, dramatically rises. Process Step Contribution Mapping
helps manager, supervisors and engineers collect the cost information needed to operate a production system
efficiently and effectively.
Figure 8 - Local Process Step Analysis
Process Step
Waste
Added Inputs
Process Step Raw Material
Boundary Line around the
Process Step
Process Product
2 3 4 5 6 1
Inputs Inputs Inputs Inputs
Raw Materials
Customer
Losses and
Waste
Losses and
Waste Losses
and Waste
Losses and
Waste
$ $ $ $
Potential profits lost as
waste

Email: Website:
[email protected] www.lifetime-reliability.com
C:\Users\Mike\Documents\Lifetime Reliability\Seminars and Workshops\Lean Six Sigma\Value Stream
Mapping\How_Profit_Contribution_Mapping_Turns_Waste_into_Production_Productivity_Rev0 (2).docx Page 17 of 34
Each process step has its own raw materials, which is the feed from the prior process step. It has its own
added inputs needed to make the conversion. From each step come a „product‟ and the wastes. Each process
step is clearly identifiable from its predecessor and its successor and is self-contained in performing its
conversion. Each process step is independent of the others and is a whole system in itself. This allows us to
analyse each process step separately. To make clear which process step is being reviewed draw a boundary
around it on the process flow diagram. An example of segregating a process step for analysis is Figure 8.
To determine process effectiveness and efficiency we need a measure. A good measure to use in business is
money. Money is the language of commerce and most people understand the concept of using money to
value an item or service. By using money to measure a process step‟s raw materials, added input‟s cost, cost
of wastes and the process step product, we can trend the step‟s profit contribution while making the product.
Figure 9 - Production Process Money Flows
Figure 9 indicates the various money flows in and out of a production process. By analysing each process
step, its true costs of the raw materials, the additional inputs and the wastes from it, the resulting contribution
of the step to the final product cost can be determined. Monitoring the costs and value contributions of each
process step provides a means to measure the efficiency of its conversion processes. The more value
contribution generated from a process step the more financially efficient is the step. By knowing the cost of
all inputs and all wastes, you can identify the steps having the greatest effects on operating profit. With
contribution information, managers, accountants and engineers can focus on new cost reduction, productivity
and process improvements that return the best value for the operation.
Figure 10 indicates how to identify each money flow associated with a process step. The boundary line
makes it clear there is money entering from „raw materials‟ and the added inputs required in making the
process conversion. Each process step delivers its own process „product‟ with its value contribution from the
value-adding performed in the step. In addition, there are lost moneys that reflect process and operating
inefficiencies, wastes and losses.
By identifying a business as a process of interconnected steps, it becomes possible to focus on the financial
performance of each step and optimise it. Process Step Contribution Mapping manages operating
performance hour by hour by monitoring the costs into, and the value out of, each process step. Once all a
step‟s in and out money flows are identified, they are used to analyse its profitability. The necessary
equation is:
Raw Material Cost + Added Inputs Cost = Value Contribution + Waste Eq. 1
2 3 4 5 6 1
Inputs Inputs Inputs Inputs
Raw Materials
Customer
Value Contributions
Bottleneck
Waste Waste
Waste
Waste
Contribution
Waste
Raw Material
Contribution
$
$ $ $
$
$
$
$ $ $
Added Input Cost
Contribution

Email: Website:
[email protected] www.lifetime-reliability.com
C:\Users\Mike\Documents\Lifetime Reliability\Seminars and Workshops\Lean Six Sigma\Value Stream
Mapping\How_Profit_Contribution_Mapping_Turns_Waste_into_Production_Productivity_Rev0 (2).docx Page 18 of 34
The value contribution is found from equation:
Raw Material Cost + Added Inputs Cost - Waste = Value Contribution Eq. 2
Strangely, from equations 1 and 2, it seems we pay for waste twice, once when we buy it as an input and
second when we throw it away as lost value.
Figure 10 - Local Process Step Money Flows
The Process Step Contribution Map
To identify money flows it is best to start by drawing a cost map showing the money movements occurring
in the entire process. A simple Process Step Contribution Map is shown in Figure 11 for a section of a
beverage canning line. Costs cascade into a step and wastes from the step.
Cost Analysis
The power of Process Step Contribution Mapping is the clear financial understanding provided of the real
value produced in each production step. By displaying where the money goes into, around and out of the
process, what happens with costs and profits becomes clear to people. Process Step Contribution Mapping
even lets shop floor people see how their process behaves so they can adjust their behaviours and decisions
accordingly.
It is important every dollar spent in the production of goods is accounted for on the process-step contribution
map. It is necessary to capture every cost, from the smallest cost to the largest, as it is spent. Activity Based
Costing (ABC) is the most appropriate accounting technique to apply when determining process step costs.
Standard costing is not suitable since overheads are allocated as a proportion of total direct costs of a process
and not by individual process step. It may be necessary to do time and motion studies in the workplace to
identify all time and resources used in a step. ABC identifies every cost with its component costs, and even
sub-component costs.
The reporting frequency for a process step depends on the step cycle time (how long it takes work to be
processed through the step) and how long it takes to measure all money flows for the process step. The
appropriate period used to measure the mapped costs should be as short as possible to give feedback quickly
enough to match the volatility and importance of a situation. With the progress of computerisation,
Process Step
$
$ $ $
$
$
$
Local Value Contribution
Waste
Contributions
$ $ $
Waste
Added Inputs Boundary
Line around the
Step Up-stream
Product Cost
Contributions
Added Input Cost Contributions

Email: Website:
[email protected] www.lifetime-reliability.com
C:\Users\Mike\Documents\Lifetime Reliability\Seminars and Workshops\Lean Six Sigma\Value Stream
Mapping\How_Profit_Contribution_Mapping_Turns_Waste_into_Production_Productivity_Rev0 (2).docx Page 19 of 34
electronic tracking of material and automation of cost information, it is possible to give value contribution
information to every operator in a business. Real-time collection is ideal, but those requires using
computerised on-line recording of all inputs, outputs and wastes, along with the software to processes the
data and display it. Reporting during and at the end of a processing cycle are useful for adjusting process
efficiency. In some cases, it might be necessary to map a particular process step more often than the entire
process because of its importance in the operation. The process step contribution map ought to be updated
for each shift so people can identify opportunities to improve every day. Process Contribution Maps
generated weekly or monthly are good historical indicators for reviewing process effectiveness.
Figure 11 - Process Step Contribution Map for a Canning Line
Developing Profit Contribution Equations
The money movements on the cost map represent the costs, wastes and the value-added in each step. They
can be represented by an equation of the type shown in Equations 1 and 2. The cost of producing product
through the whole process is simply the amalgamation of the individual steps. A financial model with such
engineering precision permits the monitoring of the real cost of production and allows determination of how
profitable it is to do a job, and identifies where there are costs and wastes to remove to get the maximum
operating profit. It often needs perseverance and creativity to gather the data and to develop the equations.
Once a process and its steps are mathematical detailed it is a simple matter to conduct „what-if‟ sensitivity
analyse to identify the critical success factors affecting its optimisation. It then becomes clear where the
process needs to be changed to maximise performance and profitability.
Can Conveyor
(no conversion)
Packer (conversion)
Conveyor
Stacker / Palletiser
Forklift
Full Cans
Boxes Power Power Pallets
Bottleneck
Can
Cost 1
Power
Cost/Can
Glue
Can
Cost 2
Full Box
Cost 1
Boxes on Pallet
Cost 1
Full Box
Cost 2
Dividers
Box Cost
Glue
Cost
Pallet
Cost
Divider
Cost
Fuel
Labour Labour Labour Labour Labour Maint Maint
Labour
Cost 5
Labour
Cost 4
Labour
Cost 3
Labour
Cost 2
Labour
Cost 1
Maint
Cost 7
Maint
Cost 6
Can Cost
3
Boxes on Pallet
Cost 2
Maint
Maint
Cost 1
Maint
Maint
Cost 2
Maint
Maint
Cost 3
Maint
Maint
Cost 4
Maint
Maint
Cost 5
Fuel
Cost
Can Cost
4
Energy Loss
$
Energy Loss
$
Box Waste
$
Energy Loss
$
Time Loss
$
Divider Waste
$
Time Loss
$

Email: Website:
[email protected] www.lifetime-reliability.com
C:\Users\Mike\Documents\Lifetime Reliability\Seminars and Workshops\Lean Six Sigma\Value Stream
Mapping\How_Profit_Contribution_Mapping_Turns_Waste_into_Production_Productivity_Rev0 (2).docx Page 20 of 34
Where detailed monitoring of all process step money flows is not available, an approximating cost model is
developed. The approximating equation is based on the costs related to a unit of production. Example E.1
shows how Profit Contribution approximating equations are developed for the manufacture of concrete
reinforcing steel in an operation that could not introduce process step money flow monitoring.
Collecting Cost Data
A production process generates the cost data needed for analysis and management as it makes the product.
The cost of materials, labour, utilities, overheads and services are on invoices or payslips. Not normally
available are the process costs accurately allocated to the process steps that incurred them. To manage a
process step‟s efficiency it is necessary to cost every input, product and waste accurately. An approach used
to identify the money flows in a process step is to use the process step procedure and work through it
identifying the process step raw materials and inputs added, the wastes produced and the product made. As
shown in Figure 10, put a boundary around the step to clarify the associated „flows‟. Many of the inputs,
wastes and products are on the process design drawings, or found in engineering documents, equipment
manuals and standard operating procedures. Confirm the data by personally observing every step for a full
cycle of production.
When onsite identify all electrical power supplies to the equipment, all pipes suppling services, all process
products into the step, all added inputs, all outputs and wastes from the step. This includes measuring all
manpower and overhead persons‟ (such as management, supervision, information technology specialists, etc)
efforts, times and costs incurred by the process step. It incorporates measuring forklift movements, vehicle
movements, personnel movements, etc. that occurs in the period observed. It includes counting the number
of lights and time they are on, how often equipment is hosed-down and the amount of water used. Collate
and cost all activities in a spreadsheet. It will be necessary to go as far as identifying minor costs, like rags
used for cleaning equipment, the cleaning detergents used, any personal safety equipment and company
brought clothing each operator requires during the period, etc. Over a year, these minor expenses can grow
into serious costs that are easily wasted. Find every dollar that goes into a process step and that comes out of
it. Put on the mantle of the crime investigator and look for all the clues to the puzzle. Unearth the truth of
where the money goes in each process step.
When studying a process step that involves movement of product and/or people, for example storing
materials in a warehouse, time the length of the move, measure the distance moved and identify the
equipment used in the work. Put a cost to the movement of product and materials to test if it delivers real
value for the expenditure.
Because the Process Contribution Mapping costing process needs to identify every cost individually, it is
preferred that all overheads be identified separately as used in each process step. By allocating overhead
costs proportionate to direct labour, an inaccurate mapping of the true costs result because overheads are not
really expended in proportion to labour hours. But if it is not possible to allocate overhead costs separately,
they can be allocated in proportion to their identified usage in each process step. The accuracy and
completeness with which the process step costs are collected will directly determine the effectiveness of the
step contribution map as a management control tool. If data is complete and true, then it is believable and
useful for decision making.
All process costs are in business systems such as payroll, inventory and accounting. Unfortunately, they
most likely will be totalised costs. The labour will be for a person‟s total time at work and you need what
they spent in each process step. The power bill will likely be for the whole of a building, whereas you
require the cost of lights and power for each machine in that building. The purchase of safety gloves will be
in batches of dozens at a time but it is necessary to know how many the people working in a process step
used.
The most accurate approach is to get the real usage of inputs and wastes. For example, the power used by
the lights and machinery in the process steps need to be collected for the period concerned. If that is not

Email: Website:
[email protected] www.lifetime-reliability.com
C:\Users\Mike\Documents\Lifetime Reliability\Seminars and Workshops\Lean Six Sigma\Value Stream
Mapping\How_Profit_Contribution_Mapping_Turns_Waste_into_Production_Productivity_Rev0 (2).docx Page 21 of 34
possible it becomes necessary to proportion the machine‟s share of the building‟s power based on the electric
wattage used in the process step. But by proportioning you introduce inaccuracies that may cause people to
question the conclusions. If necessary, introduce special means to capture cost information. Develop
timesheets and record-of-use sheets, connect chart recorders to electrical equipment and install Doppler-
effect meters to measure flows in pipes. If accurate cost control is important to the success of a business,
spare no effort to discover the true wastes, costs and losses of production.
Capturing Process Step Costs
The work involved in identifying and costing component inputs, products and wastes for each process step
can be large. Use modern technology and computerisation as much as possible to capture as many of the
costs automatically. Identify labour by using electronic time cards and time clocks. Electronic tagging or
bar coding can be used to identify material movements. With Global Positioning Systems equipment,
materials, equipment and people movements are traceable and any time losses identified and addressed.
Unless wastes can be identified electronically it becomes necessary to conduct site surveys to quantify the
waste in order to develop a factor for use in calculations. It may be useful to change work procedures and
include the recording of process step waste as standard practice. If waste is not regularly measured, conduct
audits periodically to confirm the waste factor allowance and alter the Process Step Contribution Mapping
equations as necessary.
Even if Profit Contribution Mapping is not adopted by your organisation, consider permanently introducing
the counting and measuring of wastes to allow identification of the causes and address them before they get
even worse.
Labour
Direct Labour comes from the time sheets of the people employed directly in the process step being
analysed. If the people work in another process step, then only cost time expended in the process step under
investigation. The direct labour cost is the pay rate, including on-costs, paid to the people working in the
process step, multiplied by the time they spend in the process step during the period costed. Their on-costs
include allowances, superannuation, benefits, etc, proportioned to the period. Do not include allowance for
overheads, as they are separately costed.
Indirect labour costs are the time spent by persons, other than the directly involved people, to complete the
process step. It is necessary to measure and allocate times for indirect labour. This includes maintenance,
supervision, middle and senior management time, inventory and storage personnel, purchasing department
personnel, quality control personnel, etc. Identify these costs by interviewing relevant people to find out the
time spent on various process steps. During a site inspection watch the process for a full production cycle
and observe who interacts with the process step.
The indirect labour cost is the pay rate paid to the indirect people, including their on-costs, multiplied by the
time they spend in the process step during the selected period. On-costs include allowances, superannuation,
benefits, etc, proportioned to the period. If short time periods, say a week, where indirect labour is missed, a
proportion of all the missed indirect labour costs still need to be allocated to the period. Take a longer time,
say a month or quarter year, and collect all the costs for the longer period. Then proportion and allocate
them in weekly quantities.
Indirect expenses are those costs incurred due to the presence of the „indirect‟ people in the operation. An
example is a manager‟s car and fuel paid out of operating revenue. Allocate them in proportion to the hours
spent in the process step by the expense owner.
Subcontractors

Email: Website:
[email protected] www.lifetime-reliability.com
C:\Users\Mike\Documents\Lifetime Reliability\Seminars and Workshops\Lean Six Sigma\Value Stream
Mapping\How_Profit_Contribution_Mapping_Turns_Waste_into_Production_Productivity_Rev0 (2).docx Page 22 of 34
Allocate subcontract labour and materials the same as employed direct labour. There will be an invoice for
the subcontractor‟s time and materials, and from it is extracted the allocation of times and materials for the
work done in a process step.
Utility Services
Measure electricity, water, buildings and such services and allocate to process step usage during the period.
Management, Engineering, Administration, Supervisory Costs
These costs cover the time managers, engineers, supervisors and administrative support staff spend doing
work related to requirements of the process step. For example daily meetings, site inspections, human
resources requirements, problem solving process issues, invoicing matching purchases, maintenance
planning, etc. All support persons who interact with the process step need their times and costs recorded
against the step. People can be interviewed and asked to estimate the time they spend on a process step. If
necessary, have them keep time sheets to record the actual times involved with the process during the period.
Added Input Materials
Direct material costs are for added input materials actually used in the process step. They are the obvious
additions of substances into the process step. This includes such things as electricity for motors, boxes for
packaging, lubricant for equipment gearboxes, air for pneumatic rams, etc. Typically, these materials enter
the process step in a physical form. These costs depend on the quantity and value of each input material used.
It requires counting the amount of the material used and multiplying by the cost of the added material.
Identify material costs from invoices for the material. Sometimes the added material is from within the
organisation and no invoices are available. In such cases, it will be necessary to get an accurate cost for the
added material from the process used to make it. If none is available, calculate it from the cost of the labour,
ingredients, handling and manufacturing charges, etc, used to make it.
Indirect material costs are the costs associated with the indirect functions required to perform the process
step. Such as paper for recordkeeping, electricity for office lighting, a maintenance planner‟s computer, the
cost of forklift hire to move pallets, the building storage space for spare equipment parts, etc. All these costs
are real costs incurred to conduct business that supports the production processes. It is necessary to measure
them and quantify them so that they have a value. Measurement can be by stopwatch, distance, counters, etc.
Identify the proportion used in the step, and the amount wasted.
Raw Material/Up-stream Product Costs
Determine the cost of the raw materials and/or up-stream products entering a process step. An accurate
value may be available from the accounting, or production department. If it is not available accurately, it
will need calculation for each prior process step from the start of the process.
Identifying and Costing Wastes
Direct waste is any direct labour or direct materials added into the process not fully used-up in making a
product. If the added input gradually converts through a number of process steps, as long as it is fully used it
is not wasted. Unconverted added-input is waste. For example, in some chemical processes the chemical
reaction absorbs only a portion of the mixed ingredients. Those ingredients not converted by the reaction are
wasted. A laboratory analysis can identify unconverted ingredients and tell how much was unused. Another
example is water used to clean equipment. It does not go into the product but disappears out of the process
and is a waste. Leakage from the process is waste. Spillage from a process is waste even if it is picked-up
and returned to the process. Another example of waste is side-steam materials collected in bags or bins and
disposed of as rubbish.

Email: Website:
[email protected] www.lifetime-reliability.com
C:\Users\Mike\Documents\Lifetime Reliability\Seminars and Workshops\Lean Six Sigma\Value Stream
Mapping\How_Profit_Contribution_Mapping_Turns_Waste_into_Production_Productivity_Rev0 (2).docx Page 23 of 34
Indirect wastes are those wastes related to the unnecessary use of indirect labour and indirect materials.
They are more difficult to identify because they are not easily observable. Examples include wastes related
to lost time in meetings, to lost energy, to lost compressed air, to safety equipment thrown away before fully
used, to storing unneeded materials in a storeroom. There are numerous instances of such wastes. The
detection of indirect wastes is through observation. That is why it is necessary to be present during a full
cycle of a production process and observe all process steps and their inputs to identify wasted costs,
materials and product. Look in the rubbish bins used in the process step area and see what people throw out.
Include the lights and air conditioning left on overnight unnecessarily. If required, develop and instigate
systematic means to spot and record the waste and its value during the period investigated.
Comparison with Standard Costs
Every organisation should have a standard costing system for its products. If standard costs are available,
use them as a parallel double-check and compare them with the costs from the process step mapping analysis.
Investigate variations of more than 10% from the current standard costs because there is a pricing problem
present.
Performance Measures and Reporting
Problems highlighted by profit contribution analysis require Management and personnel to use new
strategies to maximise the value from their processes. After a process step is analysed in detail it is easy to
understand and appreciate how its many factors interact and impact each other. The accurate costing of
inputs, wastes and conversions will identify efficiency problems. Through detailed questioning and root
cause investigation, the reasons can be uncovered and then the required changes can be made. If change is
required it is necessary determine what that change will be. Issues will need discussion with everyone
concerned in order to fully appreciate and understand the situation‟s history and the reasons for occurring.
The new changes will also need discussion, review and analysis for possible unwanted consequences. New
changes introduced will require their own measurement, monitoring and reporting.
Selecting the right measures to monitor and report will be critical to the success of the change process, and to
the speed of its implementation. The measures need to be meaningful to the users, truly reflect the situation,
be within the user‟s control to improve, and inspire continued improvement. One of the change strategies
will be to introduce performance measures that identify poor efficiencies and the practices that cause them.
Performance measures based on the issues identified by the analysis are intended to drive the right
behaviours and actions from people. Use process control charts, graphs and trends of the measures to show
performance improvement. Some typical indicators to use are listed below. Measures must suit specific
circumstances. The purpose of measuring is to know exactly what is happening. After understanding the
current situation an assessment is made as to whether it is satisfactory, or it needs to be changed. The effects
of a change will appear in the performance measures. It may take as long as several weeks or months to
observe the effects of a change. Where the measures indicate an unsatisfactory result, a correction is
necessary to get back on-track.
Usage Efficiency: This is the classic output divided by input. Select the important process flows, develop
appropriate efficiency measures for each, and trend them over time.
Productivity: These are measures of process performance. They are time based ratios of output during the
period. From the contribution map, select the productivities that are important to measure. Measure the
Productivity at the process step level, and the global process level.
Throughput: This measure is a count of what passes a selected point in the production process during a
period.
Waste Cost: This measure counts the cost of waste in dollars per dollar spent to purchase the original
material.

Email: Website:
[email protected] www.lifetime-reliability.com
C:\Users\Mike\Documents\Lifetime Reliability\Seminars and Workshops\Lean Six Sigma\Value Stream
Mapping\How_Profit_Contribution_Mapping_Turns_Waste_into_Production_Productivity_Rev0 (2).docx Page 24 of 34
Quality: Is the proportion of production that meets customer specification. It is another measure of a
wasteful process.
To get a complete understanding of what happens in a process requires more than one measure. Business
processes involve many interactions and may have several variables that affect each other. It may need a
number of ratios to identify what is occurring in a process, though you do not want to use any more measures
than necessary. Maintaining measures requires time and money, which are then not available for use
elsewhere. Experiment with the right measures to apply before deciding which to use. Keep performance
reporting simple by using headings to categorise reports and visual means for displaying information. Show
trends graphically in a form that makes their message clear. Use balloon notations in graphs to highlight
issues that need attention. Apply colour and font variations to enliven the report. It tables show summary
entries and totals for each category of detail. Keep the details for when people ask. Draw people‟s attention
to the conclusions and their implications by providing an executive summary at the top of the report.
Example E.1: Process Cost Mapping
Approximating Cost Equation for a Manufacturing Process
The organisation produces bent and straight reinforcing steel bar used in building construction by uncoiling
rolls of different size bar through a machine, which then bends the bar to the required shape and cuts it off
the coil. The cost map for the production is in Figure 12. The cost map shows the manufacturing process for
each machine and breaks the manufacturing process into its separate steps to show where costs arise during
production. The manufacturing process runs horizontally across the page and the costs incurred at each step
run vertically into the process flow at the step. The cost map identifies every input cost and waste for each
step. Realise that every input to a step is itself the result of another process, which the contribution method
can also analyse.
The same approach works for an entire production line, where each machine and production stage is its own
box in the flow diagram. By laying-out the process in a flow diagram it becomes clear which steps incur
costs and from where costs arise. To have a cost equation that correctly represents the money flows we must
have all input costs and all outputs, including the product and the waste, for each step. If the actual costs
incurred at each step are not available, it is necessary to develop cost estimates based on accurate historical
data, or by observing and recording the step.
Difficulty arises when there is no real data available for individual inputs and none can be collect on-site. In
such cases, it becomes necessary to allocate costs using standard cost methods and hope they closely reflect
the real situation. Figure 13 is a simplified version of the cost map in Figure 12 where costs are allocated
and proportioned for each individual step as advised by the operations management and accounting people in
the business. This example describes a means to estimate the cost of producing a piece of work through the
production process shown in Figure 13. The requirement is to represent the production process by a cost
equation so that estimates of the cost of work can be made in order to determine if it is profitable to do a job
and to identify where costs can be saved in producing the item. Each work piece from the cutting and
bending machine consists of lengths of bar either made straight or made with bends and straight lengths
between bends. The cost of a work piece depends on its diameter, the length of material used, the number of
operations and movements performed on it at each step, and its share of unmeasurable business costs
allocated to each step.
The variables for the steel bar production are:
Bar diameter
Work piece total length
Number of bends in a work piece
The bend complexity

Email: Website:
[email protected] www.lifetime-reliability.com
C:\Users\Mike\Documents\Lifetime Reliability\Seminars and Workshops\Lean Six Sigma\Value Stream
Mapping\How_Profit_Contribution_Mapping_Turns_Waste_into_Production_Productivity_Rev0 (2).docx Page 25 of 34
The total factory production time for the work piece
Once the cost to produce one unit of work is know, then the cost per production run can be estimated by
multiplying the cost of a production unit by the number of units to be produced.
Taking each process step one-by-one from the start of the process, the cost map allows easy identification of
component costs and wastes. Reflect each step in the form of calculation shown by Equation 2, and repeated
below.
Raw Material Cost + Added Inputs Cost - Waste = Value Contribution
Applying the equation to the „Received in Factory‟ step from Figure 13, its value contribution equation is:
Cost of steel coil to make a unit of product + That step’s proportion of allocations for one unit of product =
Step value contribution per unit processed
For the „MACHINE - Coil / Uncoil / Straighten / Bend / Cut‟ step its value equation is:
Value carried from prior step + Labour for the step to make one unit of product + Power used in the step to
make one unit of product + Maintenance on the machine caused by one unit of product + That step’s
proportion of allocations for one unit of product – Scrap from one unit of product = Step value contribution
per unit processed
Perform this calculation for each step in the process with a computerised spreadsheet. The analysis identifies
the value-added at each step, and the impact of its costs and wastes. If the unit of product is too small to get
sensible unit costs then use the smallest multiple of units for which costs and allocations can be reliably and
accurately determined.
Model the entire production line or process by adding together the equations for each process step.
Developing the Cost Equations
The first step is to draw the complete process as a flow diagram showing each stage of production as a
separate box on the flow diagram. Within each box briefly name the step with words that describe its
function and so it can be identified separately to other steps. On the flow diagram, identify every input,
output and waste for each step. Figure 12 shows where the production process costs arise during
manufacture. The production process runs horizontally across the page and the inputs run vertically into the
process flow at the steps. But detailed data was not available for every step and so Figure 13 was developed
from the data that was available.
It is necessary to identify and separate the fixed costs and the variable costs for each step. Typically, fixed
costs are a constant cost for the business and do not change with the work, whereas variable costs are
dependent on the work piece and change as the type of work changes. The production cost consists of the
fixed costs and variable costs added together. The basic form of the production cost equation is:
Production Cost = Fixed Costs + Variable Costs
To be able to use the equation for every item of work put through the process, it is best to base the costs
incurred in production on factors related to the work piece itself. In other words, allocate costs related to
variables that change with the type of work piece, so that the estimated cost reflects work piece variety.
Identify those variables that affect the cost of the final product. For example diameter, size, weight,
complexity, etc. The variables in the case of the steel bars are:
Bar diameter (available from the design drawings)

Email: Website:
[email protected] www.lifetime-reliability.com
C:\Users\Mike\Documents\Lifetime Reliability\Seminars and Workshops\Lean Six Sigma\Value Stream
Mapping\How_Profit_Contribution_Mapping_Turns_Waste_into_Production_Productivity_Rev0 (2).docx Page 26 of 34
Work piece total length (available from the design drawings)
Number of bends in a work piece (available from the design drawings)
The bend complexity (available from the design drawings)
The total factory production time for the work piece (available from standard costs or a work and motion
study is performed to determine typical production times)
For each process step in the cost map write the costs associated with each input and waste, identifying it as a
fixed or variable cost. Separately write the logic behind developing the cost equation so that there is a
reference explaining the equations (see the descriptions at the end of the example). The variable costs
connect to factors related to the work piece, whereas the fixed costs are independent of the work piece. With
all process step costs identified, collect the fixed costs together by variable and collect the variable costs
together separately. Arrange the collected costs into a summation equation with costs of identical variables
added together and the variable costs included at the end. Look for means to arrange and combine costs and
simplify the equation where possible. In this way, work through each process step to develop its own
equation. The total process is the sum of its individual steps.
The example combines all the individual process steps into one overall equation for the production process.
The structure of the production cost equation per work piece is below. Note that the numbers in italics
reference the description of the costs listed at the end of the example.
The cost for each work piece depending on its diameter consists of:
Cost / meter straight = Cost of machine power to feed and straighten coil (2)
+ Handling/bundling labour, including on-costs (3)
+ Maintenance of coil holder, rollers, etc due to machine use (4)
+ Steel cost per meter (12mm and 16mm) (1)
+ Coil loading – crane and labour, including on-costs (8)
+ Straightening rollers set-up labour, including on-costs (11)
+ Scrap, including crane movements of bin (13)
+ Finished tag storage - building amortisation & maintenance (17)
Cost / bend = Steel cost per bend (12mm and 16mm) (5)
+ Cost of machine power to do a bend (6)
+ Maintenance of machine due to use (7)
+ Bends‟ set-up labour, including on-costs (12)
Cost / work piece = Scheduling, including on-costs (9)
+ Finished job moving – crane & labour, including on-costs (14)
+ Loading truck/trailer – crane & labour, including on-costs (15)
+ Despatch to customer – paperwork, invoicing (16)
Cost / production hr = Supervision – Leading Hand, Supervisor, including on-cost (19)
+ Invoice processing, including on-costs (18)
+ Production Planner, including on-costs (20)
+ Senior Management/Accounting costs and on-costs (21)
+ Hire of factory crane (22)
+ Maintenance – crane (23)
+ Maintenance – general costs and building (24)
+ Factory lighting (25)
+ Offices‟ running costs (Admin Office, Production, Despatch) (26)
+ Safety (27)
+ Quality Control (28)
+ Estimating and quoting, including on-costs (10)
+ Customer disputes and resolution, including on-costs (29)

Email: Website:
[email protected] www.lifetime-reliability.com
C:\Users\Mike\Documents\Lifetime Reliability\Seminars and Workshops\Lean Six Sigma\Value Stream
Mapping\How_Profit_Contribution_Mapping_Turns_Waste_into_Production_Productivity_Rev0 (2).docx Page 27 of 34
+ Production Coordinator (30)
The cost equation for the complete process for a unit work piece becomes:
Production Cost = Cost per m straight
+ Cost per bend
+ Cost per piece
+ Cost per production hr
Once the cost of one work piece is know, then the cost per job size can be estimated by multiplying the cost
of a work piece by the number of work pieces required.
Derivation of Process Step Costs
(1) Steel cost per meter (12mm and 16mm)
This is the cost of one meter of coil delivered into store. It includes:
all steel mill cost,
all transport costs nationally and locally,
all off-loading forklift use and labour,
delivery documentation processing,
all stores receiving and inventory updating
the cost of storing the coil on-site, such as rates, land tax, site maintenance, etc
Both 12mm and 16mm coils go through the machine. The cost is required by meter length.
(2) Cost of machine power to feed and straighten coil
This is the power required to unroll the coil and run it through the straightening rollers. It will vary for each
size of bar. The cost is by meter length.
(3) Handling/bundling labour including on-costs
This is the labour cost to wait and grab, then lift, move to the stack and place each work piece onto its bundle,
including the time needed to tie the bundle for a lift to be despatched. The time taken depends on the size
(length x width) of the work piece. The cost is by meter length.
(4) Maintenance of coil holder, rollers, etc due to machine use
This cost is from the wear and tear on running parts used to unroll the coil and run it through the
straightening rollers. It can be estimated by meter length from the cost of replacement parts (coil holder and
straightening rollers) plus the labour to change the parts divided by the total length of coils put though the
machine in the time since replacing the last set of roller parts.
(5) Steel cost per bend (12mm and 16mm)
The cost of steel required for a bend. Both 12mm and 16mm bends go on the machine. For a 90o bend this
is three-quarter the bar diameter. For an 180o bend it is one-and-a-half times the diameter.
(6) Cost of machine power to do a bend
This is the power required to put a bend in the steel. It will vary for each size of bar and amount of bend.
The power is best determined by using a power meter mounted on the machine to measure the power used

Email: Website:
[email protected] www.lifetime-reliability.com
C:\Users\Mike\Documents\Lifetime Reliability\Seminars and Workshops\Lean Six Sigma\Value Stream
Mapping\How_Profit_Contribution_Mapping_Turns_Waste_into_Production_Productivity_Rev0 (2).docx Page 28 of 34
over a long period of time (at least a week). Alternately, make a rough estimate from the electric motor size
and the length of time it is used.
(7) Maintenance of bender due to machine use
This is the maintenance cost of the bending head on the machine per bend. Calculate it by the maintenance
costs over a period divided by the number of bends performed by the bender during that time. The number
of bends in a period comes from historical records or by site observation.
(8) Coil loading – crane & labour, including on-costs
This is the cost to forklift the coil into the building, lift it by crane to its uncoiling cradle at the machine and
return the crane. Labour cost is also included. Because a coil is of known length, calculate this cost by the
meter.
(9) Scheduling, including on-costs
This is the cost to schedule a work piece. It includes the time spent reviewing the drawings, calculating
measurements, entering information into the business systems and printing and handling paperwork,
including the cost of stationery. From the scheduling process the bar schedules are developed. A cost per
work piece can be determined from the cost of time spent per schedule, divided by the number of work
pieces in a schedule.
(10) Estimating and quoting, including on-costs
This is an hourly cost allocation for the time and resources taken to estimate and quote a job, multiplied by
the time taken to make a work piece. The bigger the job the longer the time taken to do these tasks. The cost
can be determined from historical averages of time and resources required provide prices to customers.
(11) Straightening rollers set-up labour, including on-costs
This is the time required to adjust and set the machine to straighten bar and test its performance. Calculate
the cost per meter length by dividing the time taken to set-up with the length of the coil. It assumes that
there is one set-up per coil, which is less than actual, as a bar size change can be required a couple of times a
day.
(12) Bends’ set-up labour, including on-costs
This is the cost to set-up the machine to do all bends required in a schedule divided by the number of work
pieces for the schedule and again divided by the number of bends in a work piece. All work pieces in a
schedule are identical. Calculate an estimate from workplace time and motion study for several different
work pieces and persons and averaging the time per bend. The more complicated shapes involving non-90o
bends will require a „complexity factor‟ to allow for the longer time these take compared to a standard 90o
bend. The suggested complexity factor is one (1) for 90o bends and two (2) for all other bends.
(13) Scrap, including crane movements of bin
This is the cost of scrap, which runs at 2% of steel bar throughput, or 20mm per 1000mm. Two crane
movements, removing scrap and replacing the bin, are also required in the cost. A more accurate scrap rate
allowance for each machine is by weighing the actual scrap generated by each machine monthly for a
number of months.
(14) Finished tag moving – crane & labour, including on-costs

Email: Website:
[email protected] www.lifetime-reliability.com
C:\Users\Mike\Documents\Lifetime Reliability\Seminars and Workshops\Lean Six Sigma\Value Stream
Mapping\How_Profit_Contribution_Mapping_Turns_Waste_into_Production_Productivity_Rev0 (2).docx Page 29 of 34
This cost is for moving each finished tag by crane from the machine to its storage space on the floor divided
by the number of work pieces in the tag. Allow one crane lift per tag.
(15) Loading truck/trailer – crane & labour, including on-costs
This cost is for moving each finished job by crane from its storage space on the floor to the transport vehicle
divided by the number of work pieces in the job. Allow one crane lift per job.
(16) Despatch to customer - paperwork, invoicing
This cost covers the time spent on each tag by the people in Despatch handling paperwork and inputting into
business systems divided by the number of work pieces in the tag. Collect the cost by counting the number
of jobs processed in a period by the Despatch personnel and dividing them by the total number of work
pieces in the job.
(17) Finished tag storage - building amortisation & maintenance
This cost is that required for the floor space within the building including rates, land tax, building
maintenance, etc. The floor space relates to the length of the work piece. Estimate the cost per meter length
by conducting site surveys of the typical foot print of a range of work piece types and dividing the cost of
each type by the total length of the steel in the work piece.
(18) Invoice processing, including on-costs
This cost covers the function of creating and processing customer invoices, including rectifying invoice
problems. Estimate the cost from historical averages of processing time and allocate per production hour for
a work piece. Multiply hourly cost by the estimated hours to produce a work piece. The time for work piece
fabrication comes from historical records or by site observation.
(19) Supervision – Leading Hand & Supervisor, including on-costs
This is the hourly cost for the leading hand and supervisor multiplied by the estimated time a work piece will
take to produce.
(20) Production Planner, including on-costs
This is the hourly cost for the Production Planner, multiplied by the estimated hours a work piece will take to
produce.
(21) Senior Management/Accounting costs and on-costs
This is the hourly cost for senior office staff, multiplied by estimated hours to produce a work piece.
(22) Hire of factory crane
This covers the hourly hire for the cranes in the steel bay allocated by machine, multiplied by the estimated
hours a work piece will take to produce on the machine.
(23) Maintenance – crane
The cost of crane maintenance per hour multiplied by the estimated hours to produce a work piece.
(24) Maintenance – general costs and building

Email: Website:
[email protected] www.lifetime-reliability.com
C:\Users\Mike\Documents\Lifetime Reliability\Seminars and Workshops\Lean Six Sigma\Value Stream
Mapping\How_Profit_Contribution_Mapping_Turns_Waste_into_Production_Productivity_Rev0 (2).docx Page 30 of 34
This is the cost for non-specific machine maintenance in the steel bay, and associated building, allocated to
each machine, multiplied by the estimated hours to produce a work piece.
(25) Factory lighting
This is the hourly cost for lighting in the production area, multiplied by the estimated hours to produce a
work piece.
(26) Offices’ running costs (Front Office, Production, and Despatch)
The hourly cost to run the Administration, Despatch and Production Offices and equipment (power, water,
air conditioning, cleaning, stationery, etc); multiplied by the estimated hours to produce a work piece.
(27) Safety
This is the hourly cost of safety personnel, safety systems, personal protective equipment, etc, multiplied by
the estimated hours a work piece will take to produce.
(28) Quality Control
This is the hourly cost of quality personnel, systems, documentation, etc, multiplied by the estimated hours a
work piece will take to produce.
(29) Disputes and resolution, including on-costs
This is an hourly cost allocation for the time and resources taken to resolve disputes on a job. A cost can be
estimated using historical data.
(30) Production Coordinator
This is the hourly cost for the Production Coordinator, multiplied by the estimated hours a work piece will
take to produce.
Calculating Crane Lift Cost
The cranes move job bundles about the production floor and unload/load transport vehicles. Each lift
requires the hoisting motor and each movement requires the drive motor. To calculate the cost of a lift it is
necessary to determine the power used by the motors while lifting the load and moving it from start to finish.
The weight of the load is variable and can be up to 5 tonne. However, normal practice is to load transport
vehicles in 1-tonne loads for ease of site off-loading. To simplify and standardise the situation for each
machine in the production line, a typical weight for each lift will be determined from site observation. The
electrical power for a typical lift can be measured by an electrician. Use the cost of power for a lift in the
production cost calculation for the relevant steps.
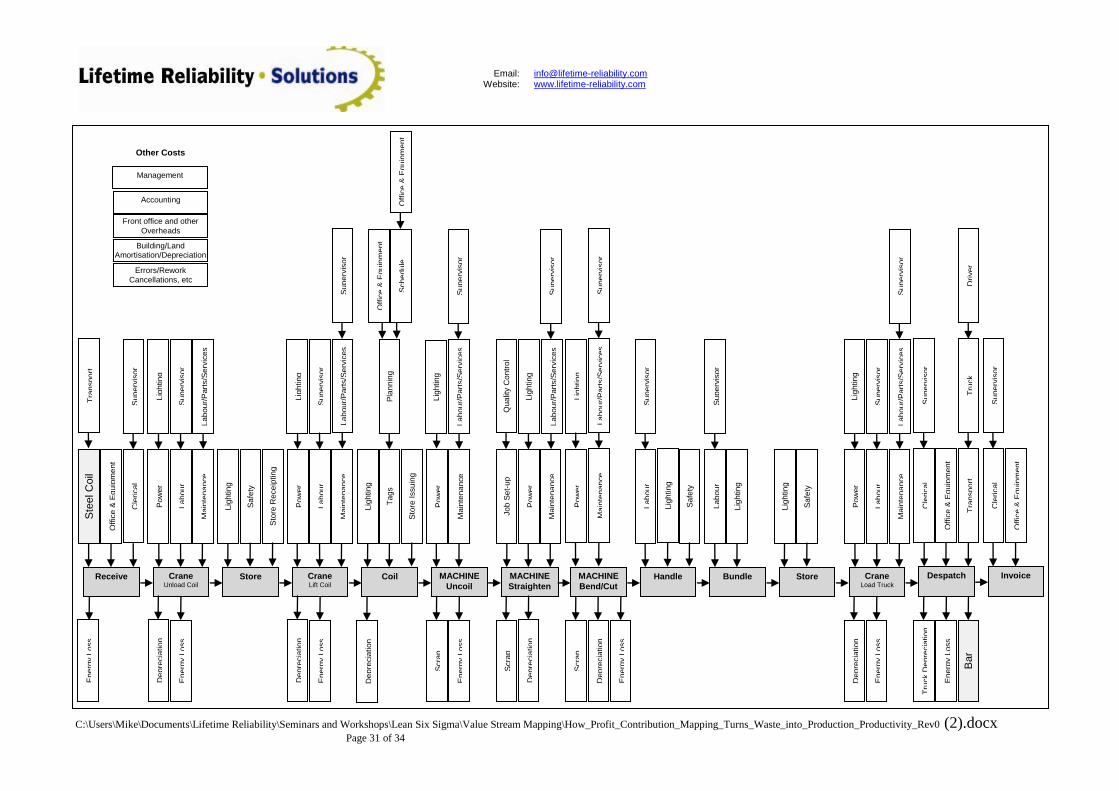
Email: Website:
[email protected] www.lifetime-reliability.com
C:\Users\Mike\Documents\Lifetime Reliability\Seminars and Workshops\Lean Six Sigma\Value Stream Mapping\How_Profit_Contribution_Mapping_Turns_Waste_into_Production_Productivity_Rev0 (2).docx Page 31 of 34
MACHINE
Bend/Cut Handle MACHINE
Straighten
MACHINE
Uncoil Coil Crane
Lift Coil Store Crane
Unload Coil Bundle Store Crane
Load Truck Despatch Receive
Cle
rical
La
bo
ur
Po
wer
Su
pe
rvis
or
Lig
htin
g
La
bo
ur
Po
wer
Su
pe
rvis
or
Lig
htin
g
Su
pe
rvis
or
Off
ice
& E
qu
ipm
en
t
Lig
htin
g
Lig
htin
g
Po
wer
Lig
htin
g
Po
wer
Ma
inte
na
nce
Ma
inte
na
nce
Su
pe
rvis
or
Lig
htin
g
Po
wer
Ma
inte
na
nce
La
bo
ur
Su
pe
rvis
or
La
bo
ur
Su
pe
rvis
or
Lig
htin
g
La
bo
ur
Po
wer
Su
pe
rvis
or
Lig
htin
g
Ste
el C
oil
Cle
rical
Su
pe
rvis
or
Off
ice
& E
qu
ipm
en
t
Ma
inte
na
nce
Ma
inte
na
nce
Ma
inte
na
nce
Ta
gs
Pla
nn
ing
Off
ice
& E
qu
ipm
en
t
Lig
htin
g
Scra
p
Scra
p
Scra
p
Invoice
Cle
rical
Su
pe
rvis
or
Off
ice
& E
qu
ipm
en
t
Sch
ed
ule
Off
ice
& E
qu
ipm
en
t
Lig
htin
g
Dep
recia
tion
Dep
recia
tion
Dep
recia
tion
Dep
recia
tion
Dep
recia
tion
Dep
recia
tion
Lig
htin
g
Sa
fety
Qu
alit
y C
on
tro
l Jo
b S
et-
up
Management
Accounting
Other Costs
Front office and other
Overheads
La
bo
ur/
Part
s/S
erv
ices
La
bo
ur/
Part
s/S
erv
ices
Su
pe
rvis
or
La
bo
ur/
Part
s/S
erv
ices
Su
pe
rvis
or
L
ab
ou
r/P
art
s/S
erv
ices
Su
pe
rvis
or
La
bo
ur/
Part
s/S
erv
ices
Su
pe
rvis
or
La
bo
ur/
Part
s/S
erv
ices
Building/Land Amortisation/Depreciation
Sa
fety
Sa
fety
Sto
re R
ece
ipting
Sto
re I
ssu
ing
Bar
Tra
nspo
rt
T
ruck
Dri
ver
Tru
ck D
epre
cia
tion
Errors/Rework
Cancellations, etc
Tra
nspo
rt
En
erg
y L
oss
En
erg
y L
oss
En
erg
y L
oss
En
erg
y L
oss
En
erg
y L
oss
En
erg
y L
oss
En
erg
y L
oss

Email: Website:
[email protected] www.lifetime-reliability.com
C:\Users\Mike\Documents\Lifetime Reliability\Seminars and Workshops\Lean Six Sigma\Value Stream Mapping\How_Profit_Contribution_Mapping_Turns_Waste_into_Production_Productivity_Rev0 (2).docx Page 32 of 34
Figure 12 - Process Cost and Waste Map for a Production Process
Figure 13 - Process Cost Map for a Production Process using Allocations
Handle MACHINE - Coil / Uncoil /
Straighten / Bend / Cut
Crane Lift Coil
Store
on Floor
Crane Unload Coil
Bundle Store
on trolley/floor
Crane Load
Truck Despatch Receive
in Factory
La
bo
ur
Po
wer
La
bo
ur
Po
wer
Ma
inte
na
nce
La
bo
ur
La
bo
ur
La
bo
ur
Steel Coil
Ma
inte
na
nce
Ma
inte
na
nce
Ma
inte
na
nce
Scra
p
La
bo
ur
Safety
Lighting
Costs to Proportion to Each Process Steps
Front office personnel
and their overheads
Cra
ne
Hir
e
Building/Land Amortisation/Depreciation
Bar to
Customer
Tra
nspo
rt
T
ruck
Dri
ver
Errors/Rework
Cancellations, etc
Tra
nspo
rt
Supervision
Quality Control
Production Office personnel and
overheads Scheduling Group
Supply Group receiving and issuing
Despatch Group
Po
wer
Cra
ne
Hir
e
Po
wer
Cra
ne
Hir
e
Invoicing
Depreciation –
Machine & Trucks

Email: Website:
[email protected] www.lifetime-reliability.com
C:\Users\Mike\Documents\Lifetime Reliability\Seminars and Workshops\Lean Six Sigma\Value Stream Mapping\How_Profit_Contribution_Mapping_Turns_Waste_into_Production_Productivity_Rev0 (2).docx Page 33 of 34
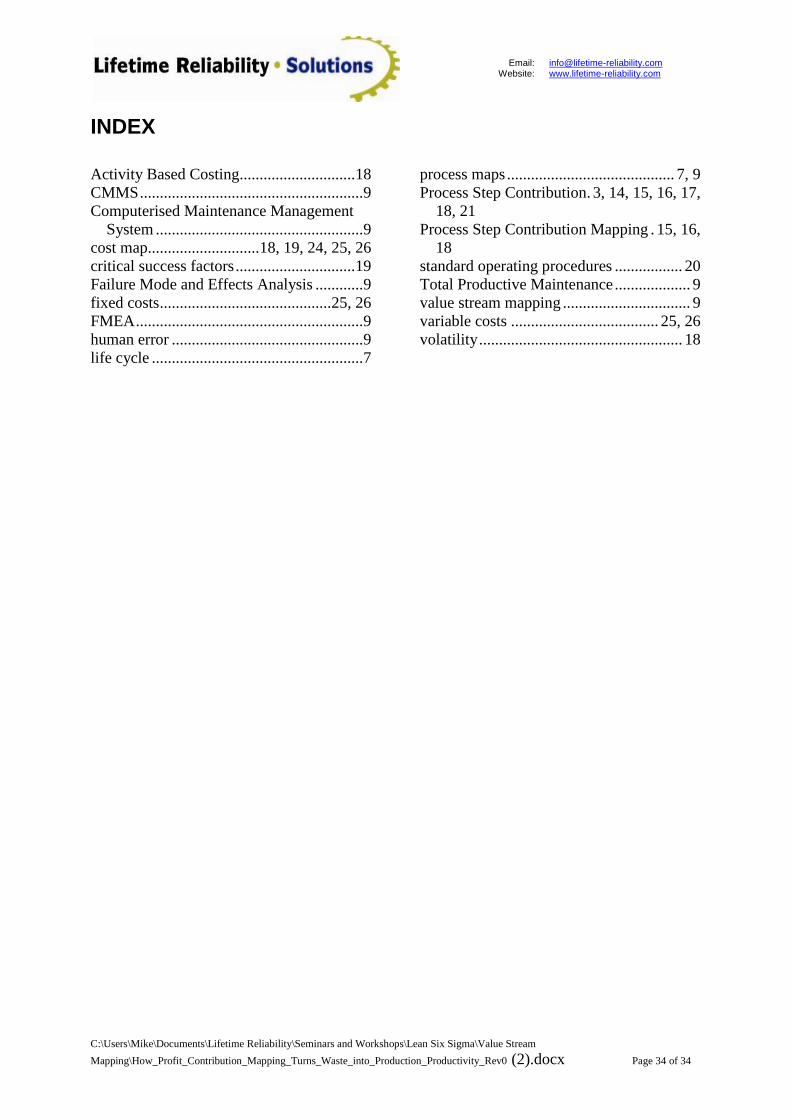
Email: Website:
[email protected] www.lifetime-reliability.com
C:\Users\Mike\Documents\Lifetime Reliability\Seminars and Workshops\Lean Six Sigma\Value Stream
Mapping\How_Profit_Contribution_Mapping_Turns_Waste_into_Production_Productivity_Rev0 (2).docx Page 34 of 34
INDEX
Activity Based Costing............................. 18
CMMS ........................................................ 9
Computerised Maintenance Management
System .................................................... 9
cost map............................ 18, 19, 24, 25, 26
critical success factors .............................. 19
Failure Mode and Effects Analysis ............ 9
fixed costs ........................................... 25, 26
FMEA ......................................................... 9
human error ................................................ 9
life cycle ..................................................... 7
process maps .......................................... 7, 9
Process Step Contribution. 3, 14, 15, 16, 17,
18, 21
Process Step Contribution Mapping . 15, 16,
18
standard operating procedures ................. 20
Total Productive Maintenance ................... 9
value stream mapping ................................ 9
variable costs ..................................... 25, 26
volatility ................................................... 18