Embed Size (px)
Citation preview
Journal of Behavioral Decision Making
J. Behav. Dec. Making, 18: 83–96 (2005)
DOI: 10.1002/bdm.485
How Probable is Probably? It Dependson Whom You’re Talking About
TIM SMITS* and VERA HOORENS
Departement Psychologie, KatholiekeUniversiteit Leuven, Belgium
ABSTRACT
Two studies tested whether people interpreted verbal chance terms in a self-servingmanner. Participants read statements describing the likelihood of events in their ownfuture and in the future of a randomly chosen other. They interpreted the chance termsnumerically. Chance terms were interpreted as denoting a higher probability when theywere used to describe the likelihood of pleasant events in one’s own future than whenthey were used to describe the likelihood of pleasant events in someone else’s future(Study 1). Similarly, chance terms were interpreted as denoting a lower probabilitywhen they were used to describe the likelihood of unpleasant events in one’s own futurethan when they were used to describe the likelihood of unpleasant events in someoneelse’s future (Studies 1 and 2). These differences occurred primarily when the riskstatements were threatening. Copyright # 2005 John Wiley & Sons, Ltd.
key words interpretation of verbal probabilities; risk communication; comparative
optimism; unrealistic optimism; self–other differences
People continuously make decisions. In doing so, they frequently evaluate the likelihood of the different
outcomes of various behavioral choices. One source of information that is available to them is the probability
information that they get from others. These may express their uncertainty about an event’s future occurrence
either by a verbal chance term (e.g., ‘‘smokers are likely to get cancer’’) or by a numerical probability (e.g.,
‘‘the likelihood that this medicine will work is 70%’’).
Most people prefer to express uncertainty verbally rather than numerically (e.g., ‘‘likely’’ versus ‘‘70%’’).
One reason may be that they feel that a verbal probability term expresses the uncertainty surrounding future
events better than a numerical expression. People may think that verbal expressions are conveniently vague
so that they will be less likely to be confronted with misjudgements (Budescu & Wallsten, 1985). At the
same time, most people like to receive likelihood information numerically. This may be due to numerical
probabilities seeming more precise and informative than verbal ones.
Copyright # 2005 John Wiley & Sons, Ltd.
* Correspondence to: Tim Smits, Laboratorium voor Experimentele Sociale Psychologie, Departement Psychologie, KatholiekeUniversiteit Leuven, Tiensestraat 102, B-3000 Leuven, Belgium. E-mail: [email protected]
Contract/grant sponsor: Research Fund of the Katholieke Universiteit Leuven, Belgium; contract/grant number: OT/00/06.
If receivers prefer to obtain likelihood information in numerical terms whereas senders prefer to present it
in verbal terms (about this so-called preference paradox, see Brun & Teigen, 1988; Erev & Cohen, 1990),
then we may assume that receivers regularly interpret verbal chance terms in numerical terms. It is therefore
important to understand how this interpretation comes about and which systematic distortions occur in it.
This paper focuses on the latter question and more specifically on differences in interpretations between
statements about one’s own versus another’s future.
A priori beliefs about event likelihood influence the numerical interpretation of verbal chance terms (e.g.,
Wallsten, Fillenbaum, & Cox, 1986). One phenomenon that characterizes the perceived likelihood of future
events is comparative optimism (Weinstein, 1980). People think that they are more likely than others to
experience positive events and less likely to experience negative events. An implication of comparative opti-
mism is that self–other differences may occur in the interpretation of verbal chance terms. Do people inter-
pret expressions such as likely or highly probable differently depending on whether these expressions occur
in statements about their own future or in statements about other people’s future? This is the main question
that we addressed in the present research.
THE NUMERICAL INTERPRETATION OF VERBAL CHANCE TERMS
Despite the omnipresence of verbal probability expressions in communication (Erev & Cohen, 1990), their
interpretation tends to be highly variable (for reviews see Clark, 1990; Budescu & Wallsten, 1995). Different
people interpret given chance terms very differently. Adding context to the chance terms further increases this
variability (Beyth-Marom, 1982; Brun & Teigen, 1988). Even the same individual may interpret a chance
term differently depending on the context in which it occurs (see Fox & Irwin, 1998). Although the
within-subjects variability is substantially smaller than the between-subjects variability, it is still considerable
(Budescu & Wallsten, 1985). Terms that linguistically denote approximately equal probabilities show a
remarkable variation (see, for instance, the difference between positive expressions such as likely and negative
expressions such as not certain; e.g., Teigen & Brun, 2003) whereas the interpretation of terms that linguis-
tically denote different probabilities tends to overlap (Wallsten, Budescu, Rapoport, Zwick, & Forsyth, 1986).
Different variables affect the numerical translation of verbal chance terms. One is the receiver’s a priori
belief about the likelihood of the events being described. Higher a priori probabilities generally lead to
higher probabilities (Wallsten et al., 1986). Compare, for instance, ‘‘This winter, you will probably develop
a common cold’’ to ‘‘This winter, you will probably develop a lung infection.’’ Most people believe that
common colds occur more frequently than lung infections. Therefore, the perceived a priori likelihood of
developing a common cold is higher than the a priori likelihood of developing a lung infection. Conse-
quently, when people are asked to estimate the numerical equivalent of the word likely, the average estimate
tends to be higher when likely occurs in the context of a common cold than when it occurs in the context of a
lung infection.
The above is not meant to say that verbal probability expressions are always more subject to personal and
context-bound interpretations than numerical probability expressions are. The latter expressions may also be
interpreted differently (see, for instance, Flugstad & Windschitl, 2003; Kleiter, Doherty, & Brake, 2002). In
fact, numerical expressions may be as inaccurate as verbal expressions and verbal expressions may be as
accurate as numerical ones (Rapoport, Wallsten, Erev, & Cohen, 1990).
COMPARATIVE OPTIMISM IN LIKELIHOOD ESTIMATES
People believe that they are more likely to experience positive events than others and less likely to experi-
ence negative events (for a recent review see Shepperd, Carroll, Grace, & Terry, 2002). This has been named,
84 Journal of Behavioral Decision Making
Copyright # 2005 John Wiley & Sons, Ltd. Journal of Behavioral Decision Making, 18, 83–96 (2005)
among other labels, unrealistic optimism (Weinstein, 1980) and comparative optimism (Harris & Middleton,
1994). It is typically measured using one of two approaches. Researchers may ask participants to estimate
their own likelihood of experiencing various events as compared to someone else’s (e.g., the average other’s)
likelihood. Alternatively, they may ask participants to estimate their own absolute likelihood of experiencing
the events as well as someone else’s (e.g., the average other’s). The researcher then calculates the difference
between the estimates for the self and the comparison other.
Using both methods, comparative optimism has been shown in a variety of life domains such as health (e.g.,
Weinstein, 1982; for reviews see Hoorens, 1994, and Klein & Weinstein, 1997), academic and professional
success (e.g., Weinstein, 1980), road safety (e.g., McKenna, 1993), and personal relationships and family life
(e.g., Buunk, 2001). However, events differ in the degree to which they elicit comparative optimism. While
some studies found stronger comparative optimism for negative than for positive events (e.g., Weinstein,
1980; see also Hoorens, 1996), the most robust determinant of comparative optimism is the perceived con-
trollability of the events. Controllable events elicit stronger comparative optimism than uncontrollable ones
(for reviews see Harris, 1996; Hoorens, 1996; Hoorens & Smits, 2001; Klein & Helweg-Larsen, 2002).
VERBAL CHANCE TERMS AND COMPARATIVE OPTIMISM
From the above, we may conclude that the interpretation of verbal probability terms partly depends on the
subjective a priori likelihood of the event. The subjective likelihood of events, in turn, depends on the target
person for whom this likelihood is to be given. Combining these observations, we hypothesized that the
numerical interpretation of verbal chance terms depends on the person for whom these likelihoods are given.
In two studies, we presented participants with a set of statements each describing the probability that an
event would occur in the life of one of two targets. Each participant received the set of statements twice: once
in the second person, thus simulating the situation in which participants receive likelihood information on
their own future (e.g., ‘‘you are likely to . . . ’’) and once in the third person, thus simulating the situation in
which they receive likelihood information on someone else’s future (e.g., ‘‘he or she is likely to . . . ’’). In
both cases participants’ task consisted of interpreting the verbal chance terms numerically.
We expected a self-serving or, stated differently, comparatively optimistic difference between the inter-
pretation of the verbal chance terms used to describe the participants’ own future and the interpretation of the
verbal chance terms used to describe another individual’s future. We expected that chance terms would be
particularly interpreted in a comparatively optimistic manner when they were used to describe the likelihood
of events that typically elicit comparative optimism. Moreover, we expected that the comparatively optimis-
tic interpretation of verbal chance terms would depend on the threatening nature of the probability statement.
Following a motivated reasoning account (Kunda, 1990), we can reasonably expect that participants are
more motivated to interpret a threatening statement (e.g., ‘‘you are likely to experience a heart attack’’) than
they are to interpret a less threatening one (e.g., ‘‘it is doubtful that you’ll have an infected throat’’) in a self-
serving manner. Therefore, we primarily expected a self–other difference in the interpretation of chance
terms that are used in threatening statements.
In Study 1, we tested whether a self–other difference occurs in the interpretation of chance terms that are
used in statements about positive and negative future life events. In Study 2 we focused on statements about
one type of negative future life events, namely, health problems.
STUDY 1
The aim of Study 1 was threefold. First, it tested the prediction that people interpret chance terms in a com-
paratively optimistic manner. If they do, verbal expressions describing the likelihood of negative events
T. Smits and V. Hoorens Verbal Probabilities Interpreted Optimistically 85
Copyright # 2005 John Wiley & Sons, Ltd. Journal of Behavioral Decision Making, 18, 83–96 (2005)
should be associated with lower numerical probabilities when embedded in statements about the perceiver’s
own future than when embedded in statements about another person’s future. In contrast, verbal expressions
describing the likelihood of positive events should be associated with higher numerical probabilities when
embedded in statements about the perceiver’s own future than when embedded in statements about a third
person’s future.
Second, we tested the prediction that this self–other difference depends on the degree to which the events
being described elicit comparative optimism. We did so in two different ways. On the one hand, we tested
whether chance terms were interpreted in a more self-serving manner when they were used to describe events
that elicited stronger comparative optimism. We did so by inspecting the correlation between self–other
differences in the interpretation of chance terms with self–other differences in a priori likelihood estimates.
On the other hand, we tested whether a factor known to influence comparative optimism, namely, event con-
trollability, also affected the degree to which a self-serving interpretation of chance terms occured. We
expected a self-serving interpretation of verbal chance terms when these were used to describe the likelihood
of controllable events but not or to a lesser degree when they were used to describe the likelihood of
uncontrollable events.
Third, we tested the prediction that people primarily interpret chance terms in a self-serving manner when
these chance terms occur in threatening statements. We assumed that the self-serving interpretation of verbal
chance terms is an example of motivated reasoning (Kunda, 1990). If this is true, then it should only or par-
ticularly occur if a statement is threatening to one’s self-view or one’s future expectations. Statements saying
that positive events are unlikely or that negative events are likely are more threatening than statements saying
that positive events are likely or that negative events are unlikely. Therefore, we expected a stronger self–
other difference when verbal chance terms were embedded in the former type of statements rather than in the
latter type of statements.
Method
Participants
Undergraduate psychology students (N¼ 370) participated for course credits. To avoid participants having
too much experience of some events (e.g., ‘‘having to redo a year of your studies’’), eight participants were
excluded from the analysis because they were older than 23. In addition, 32 questionnaires had missing
values and two participants failed to follow the instructions. The final data set (N¼ 328) consisted of 281
women and 47 men, aged 17 to 21 years (M¼ 18.41).
Materials and procedure
The experiment was run in groups of up to 20 participants. Upon entrance, participants received a booklet
that contained all the instructions and questionnaires (in Dutch). They filled out the questionnaire at their
own pace. Upon completing the questionnaires, participants were thanked and debriefed.
We used a chance term interpretation questionnaire and an event likelihood estimation questionnaire.
Each participant filled out each questionnaire twice, once for each of two targets (self condition and other
condition). In the self condition, participants interpreted statements about their own future (framed in the
second person) and estimated the likelihood of events in their own future. In the other condition, participants
interpreted statements about the future of a randomly chosen other psychology student of their age and gen-
der (framed in the third person) and estimated event likelihoods for this person’s future.
The questionnaires were grouped such that each participant filled out the chance term interpretation task
and the likelihood estimation task for one target before proceeding to the second target. Half of the partici-
pants completed the questionnaires for self first whereas the other half completed the questionnaires for other
first. Between two targets, participants filled out an unrelated filler task (a questionnaire on mechanisms
through which talking about problems may be helpful in coping with them).
86 Journal of Behavioral Decision Making
Copyright # 2005 John Wiley & Sons, Ltd. Journal of Behavioral Decision Making, 18, 83–96 (2005)
The instructions of the chance term interpretation questionnaire explained that people do not attach the
same meaning to probability terms under all circumstances. They stated that participants would see a number
of statements. Each statement would use a verbal chance term to describe the likelihood of a given event. For
each statement, participants had to indicate what the chance term meant in that context. They had to do so by
writing down a percentage from 0 (the term means that the event will certainly not happen) to 100 (the term
means that the event will certainly happen). Participants then saw a list of statements in which the likelihood
of each of a set of positive and negative events was described using various chance terms. They indicated
their responses in a blank space next to each statement.
The second questionnaire examined the degree to which the events that were used elicited comparative
optimism. Written instructions stated that ‘‘in order to better understand your previous answers, we want to
know how likely you think the events really are.’’ Participants estimated the events’ probabilities by writing a
percentage from 0 (the event will certainly not happen) to 100 (the event will certainly happen). They indi-
cated their responses in a blank space next to each statement.
Design
Each participant’s chance term interpretation questionnaire included 32 statements describing the likelihood
of eight events. To describe an event’s likelihood we used four chance terms, two of which referred to low
probabilities and two to high probabilities. We used two equivalent sets of chance terms (set A and set B),
thus totalling eight chance terms (see Table 1a). The events were selected such that within each questionnaire
four categories were equally represented: controllable positive events, controllable negative events,
uncontrollable positive events, and uncontrollable negative events. In total we used 16 events (see
Table 1b). From this initial set of 16 we derived two sets of eight to allow two replications of the experiment
(replication 1 and replication 2).
The events were combined with the chance terms such that each chance term of one set (A or B) was
combined with each event of a given valence (positive or negative) while each chance term of the other
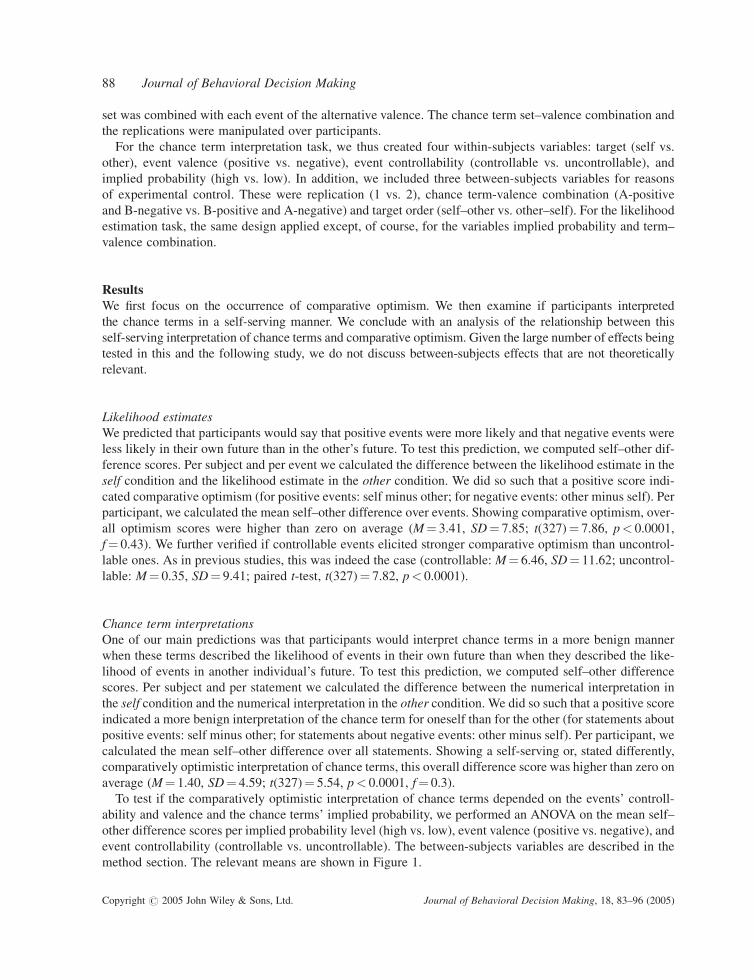
Table 1a. Verbal chance terms used in Study 1 and 2 (translation within brackets)
Set A Set B
High Waarschijnlijk (probably) Grote kans (big chance)Aannemelijk (likely) Te verwachten (to be expected)
Low Twijfelachtig (doubtful) Onzeker (uncertain)Kleine kans (small chance) Onwaarschijnlijk (improbable)
Table 1b. Events used in Study 1 (translated from Dutch)
Replication 1 Replication 2
Controllable positive Meet interesting people during one’s college years Get or keep a good fitness levelGraduate with honors Get a romantic relationship or
maintain one’s current relationshipUncontrollable positive Never in hospital for next 20 years Never have a car stolen
Win a lottery Have a highly talented childControllable negative Divorce Unplanned pregnancy as a mother or
as a fatherGet addicted to alcohol/drugs Have to redo a year of one’s studies
Uncontrollable negative Get jaundice Become blind due to accident or illnessBe forced to retire early Be robbed
T. Smits and V. Hoorens Verbal Probabilities Interpreted Optimistically 87
Copyright # 2005 John Wiley & Sons, Ltd. Journal of Behavioral Decision Making, 18, 83–96 (2005)
set was combined with each event of the alternative valence. The chance term set–valence combination and
the replications were manipulated over participants.
For the chance term interpretation task, we thus created four within-subjects variables: target (self vs.
other), event valence (positive vs. negative), event controllability (controllable vs. uncontrollable), and
implied probability (high vs. low). In addition, we included three between-subjects variables for reasons
of experimental control. These were replication (1 vs. 2), chance term-valence combination (A-positive
and B-negative vs. B-positive and A-negative) and target order (self–other vs. other–self). For the likelihood
estimation task, the same design applied except, of course, for the variables implied probability and term–
valence combination.
Results
We first focus on the occurrence of comparative optimism. We then examine if participants interpreted
the chance terms in a self-serving manner. We conclude with an analysis of the relationship between this
self-serving interpretation of chance terms and comparative optimism. Given the large number of effects being
tested in this and the following study, we do not discuss between-subjects effects that are not theoretically
relevant.
Likelihood estimates
We predicted that participants would say that positive events were more likely and that negative events were
less likely in their own future than in the other’s future. To test this prediction, we computed self–other dif-
ference scores. Per subject and per event we calculated the difference between the likelihood estimate in the
self condition and the likelihood estimate in the other condition. We did so such that a positive score indi-
cated comparative optimism (for positive events: self minus other; for negative events: other minus self). Per
participant, we calculated the mean self–other difference over events. Showing comparative optimism, over-
all optimism scores were higher than zero on average (M¼ 3.41, SD¼ 7.85; t(327)¼ 7.86, p< 0.0001,
f¼ 0.43). We further verified if controllable events elicited stronger comparative optimism than uncontrol-
lable ones. As in previous studies, this was indeed the case (controllable: M¼ 6.46, SD¼ 11.62; uncontrol-
lable: M¼ 0.35, SD¼ 9.41; paired t-test, t(327)¼ 7.82, p< 0.0001).
Chance term interpretations
One of our main predictions was that participants would interpret chance terms in a more benign manner
when these terms described the likelihood of events in their own future than when they described the like-
lihood of events in another individual’s future. To test this prediction, we computed self–other difference
scores. Per subject and per statement we calculated the difference between the numerical interpretation in
the self condition and the numerical interpretation in the other condition. We did so such that a positive score
indicated a more benign interpretation of the chance term for oneself than for the other (for statements about
positive events: self minus other; for statements about negative events: other minus self). Per participant, we
calculated the mean self–other difference over all statements. Showing a self-serving or, stated differently,
comparatively optimistic interpretation of chance terms, this overall difference score was higher than zero on
average (M¼ 1.40, SD¼ 4.59; t(327)¼ 5.54, p< 0.0001, f¼ 0.3).
To test if the comparatively optimistic interpretation of chance terms depended on the events’ controll-
ability and valence and the chance terms’ implied probability, we performed an ANOVA on the mean self–
other difference scores per implied probability level (high vs. low), event valence (positive vs. negative), and
event controllability (controllable vs. uncontrollable). The between-subjects variables are described in the
method section. The relevant means are shown in Figure 1.
88 Journal of Behavioral Decision Making
Copyright # 2005 John Wiley & Sons, Ltd. Journal of Behavioral Decision Making, 18, 83–96 (2005)
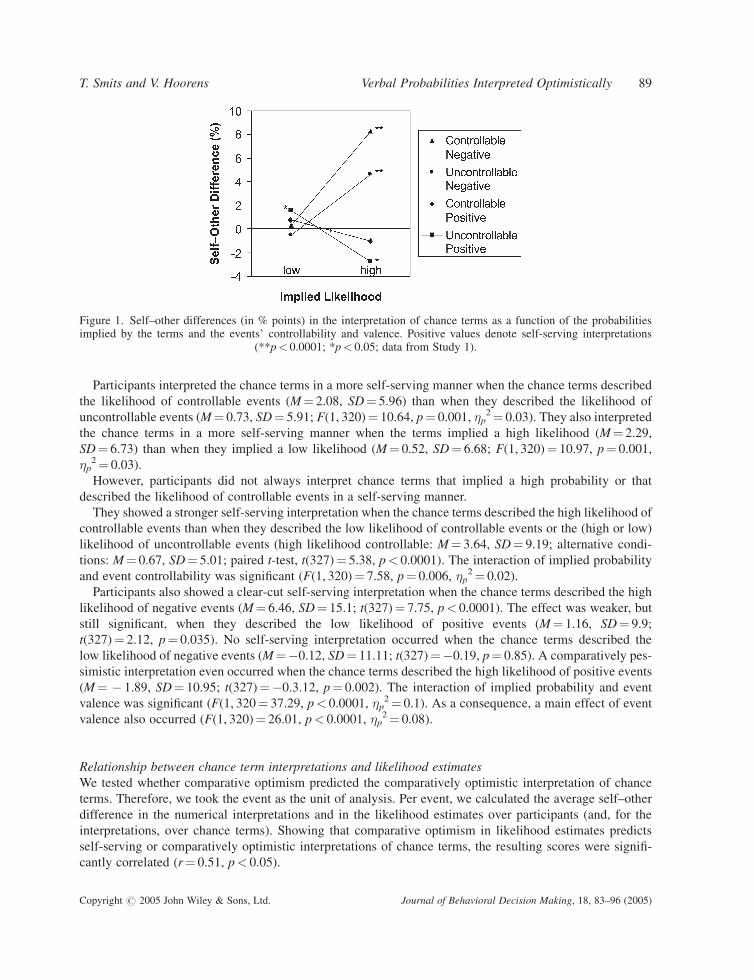
Participants interpreted the chance terms in a more self-serving manner when the chance terms described
the likelihood of controllable events (M¼ 2.08, SD¼ 5.96) than when they described the likelihood of
uncontrollable events (M¼ 0.73, SD¼ 5.91; F(1, 320)¼ 10.64, p¼ 0.001, �p2¼ 0.03). They also interpreted
the chance terms in a more self-serving manner when the terms implied a high likelihood (M¼ 2.29,
SD¼ 6.73) than when they implied a low likelihood (M¼ 0.52, SD¼ 6.68; F(1, 320)¼ 10.97, p¼ 0.001,
�p2¼ 0.03).
However, participants did not always interpret chance terms that implied a high probability or that
described the likelihood of controllable events in a self-serving manner.
They showed a stronger self-serving interpretation when the chance terms described the high likelihood of
controllable events than when they described the low likelihood of controllable events or the (high or low)
likelihood of uncontrollable events (high likelihood controllable: M¼ 3.64, SD¼ 9.19; alternative condi-
tions: M¼ 0.67, SD¼ 5.01; paired t-test, t(327)¼ 5.38, p< 0.0001). The interaction of implied probability
and event controllability was significant (F(1, 320)¼ 7.58, p¼ 0.006, �p2¼ 0.02).
Participants also showed a clear-cut self-serving interpretation when the chance terms described the high
likelihood of negative events (M¼ 6.46, SD¼ 15.1; t(327)¼ 7.75, p< 0.0001). The effect was weaker, but
still significant, when they described the low likelihood of positive events (M¼ 1.16, SD¼ 9.9;
t(327)¼ 2.12, p¼ 0.035). No self-serving interpretation occurred when the chance terms described the
low likelihood of negative events (M¼�0.12, SD¼ 11.11; t(327)¼�0.19, p¼ 0.85). A comparatively pes-
simistic interpretation even occurred when the chance terms described the high likelihood of positive events
(M¼ � 1.89, SD¼ 10.95; t(327)¼�0.3.12, p¼ 0.002). The interaction of implied probability and event
valence was significant (F(1, 320¼ 37.29, p< 0.0001, �p2¼ 0.1). As a consequence, a main effect of event
valence also occurred (F(1, 320)¼ 26.01, p< 0.0001, �p2¼ 0.08).
Relationship between chance term interpretations and likelihood estimates
We tested whether comparative optimism predicted the comparatively optimistic interpretation of chance
terms. Therefore, we took the event as the unit of analysis. Per event, we calculated the average self–other
difference in the numerical interpretations and in the likelihood estimates over participants (and, for the
interpretations, over chance terms). Showing that comparative optimism in likelihood estimates predicts
self-serving or comparatively optimistic interpretations of chance terms, the resulting scores were signifi-
cantly correlated (r¼ 0.51, p< 0.05).
Figure 1. Self–other differences (in % points) in the interpretation of chance terms as a function of the probabilitiesimplied by the terms and the events’ controllability and valence. Positive values denote self-serving interpretations
(**p< 0.0001; *p< 0.05; data from Study 1).
T. Smits and V. Hoorens Verbal Probabilities Interpreted Optimistically 89
Copyright # 2005 John Wiley & Sons, Ltd. Journal of Behavioral Decision Making, 18, 83–96 (2005)
DiscussionWe predicted that participants would interpret verbal chance terms in a self-serving manner. The present
study supported this prediction as we observed a significant self–other difference in a comparatively opti-
mistic direction.
We also predicted that this effect would primarily occur when likelihood statements were threatening. The
data supported this expectation as well. No self-serving interpretation occurred when chance terms occurred
in statements about the low likelihood of negative events and the high likelihood of positive events. It is clear
that such statements are reassuring rather than threatening. When chance terms occurred in statements that
described the high likelihood of negative events or the low likelihood of positive events, however, a self-
serving interpretation occurred. In addition, the former effect was stronger than the latter. Reading that
one is unlikely to obtain positive outcomes may indeed be less threatening than reading that one is likely
to obtain negative ones. This may be the case because being exposed to negative things may be more dan-
gerous to an individual than not being exposed to positive things.
We also predicted that the self-serving interpretation of chance terms derives from comparative optimism.
We reasoned that the latter phenomenon affects the a priori likelihood of events in one’s own versus in some-
one else’s life. Hence, it should affect the interpretation of the chance terms describing these events’ prob-
ability. Our data supported this prediction. First, the events we used generally elicited comparative optimism.
Second, a stronger self-serving interpretation occurred when chance terms described the likelihood of events
that elicited stronger comparative optimism. Third, the effect of event controllability on comparative opti-
mism came back as a main effect (and an interaction with implied likelihood) on the self-serving interpreta-
tion of chance terms. This pattern of results suggests that comparative optimism contributes to the self-
serving interpretation of chance terms.
Surprisingly, when participants were confronted with statements on the high likelihood of positive things,
they interpreted the chance terms in a manner that was unfavourable to them. This may be an example of
defensive pessimism (e.g., Norem & Cantor, 1986; Norem, 2001). By assuming that they are less likely than
others to experience common good things, people may brace against disappointment. This strategy also
allows them to maintain a sufficient level of energy aimed at obtaining these desirable things. Such a strategy
is not necessary in the case of rare good things. Failing to obtain positive outcomes that seldomly occur may
indeed be less disappointing and embarrassing than failing to obtain common positive outcomes. At the same
time, defensive pessimism may be undesirable when negative events come into play. In this case, the psy-
chological costs of defensive pessimism may indeed be much greater than its benefits (on the psychological
benefits of optimism see, for instance, Taylor & Brown, 1988).
To our knowledge, our study is the first to show a self-serving tendency in the interpretation of verbal
chance terms. A replication was therefore in order before drawing any firm conclusions. One domain in
which people are often confronted with statements about the future is in the realm of health and safety edu-
cation. If the self-serving tendency in the interpretation of verbal chance terms is to have any applied rele-
vance, then it should occur in this domain. Therefore, we replicated Study 1 using health-related events. This
replication also allowed us to vary the threatening nature of the statements in an alternative way and hence to
further test the view that the self-serving interpretation of chance terms is a case of motivated reasoning.
Finally, Study 2 further examined the relationship between the self-serving interpretation of verbal chance
terms and comparative optimism.
STUDY 2
The aim of Study 2 was to replicate Study 1 using statements about health problems. We expected that people
would associate lower numerical probabilities to verbal chance terms when these described the likelihood of
health problems in their own life rather than when they described the likelihood of the same problems in
someone else’s life.
90 Journal of Behavioral Decision Making
Copyright # 2005 John Wiley & Sons, Ltd. Journal of Behavioral Decision Making, 18, 83–96 (2005)
If this effect occurs because the information being transmitted is threatening, as we propose, then it should
primarily occur for verbal chance terms that denote a high probability but either not or to a lesser degree for
verbal chance terms that denote a low probability. Furthermore, among threatening statements denoting a
high probability, the effect should primarily occur for very severe health problems. Such statements are
indeed even more threatening than comparable statements about less severe events.
Finally, if the effect is based on comparative optimism, then it should be stronger when chance terms are
used to describe the likelihood of health problems that elicit comparative optimism than when they are used
to describe the likelihood of health problems that generally elicit weak or no comparative optimism.
Method
Participants
One hundred eight university students (75 women and 33 men, aged 18 to 27, mean age¼ 21.14) partici-
pated. They were paid 6.5 EUR for a one-hour session in which various studies were run, of these the present
study was the first part.
Materials and procedure
The materials and procedure were similar to those of Study 1 except for the following. First, the experiment
was computer-administered. Participants were seated in individual cubicles in which stimuli were presented
and data were collected using E-Prime (Version 1.0) software.
Second, we used a single set of eight health problems (Table 2). We selected them from published com-
parative optimism studies (Weinstein, 1980, 1982) such that half of the events typically elicited comparative
optimism whereas the other half did not. Within each category, we expected the perceived severity of the
health problems to vary considerably.
To construe the statements we divided the health problems into two sets of four. The first consisted of ‘‘get
diabetes,’’ ‘‘contract a venereal disease,’’ ‘‘get addicted to alcohol,’’ and ‘‘have a heart attack.’’ The second
consisted of ‘‘break a bone,’’ ‘‘have an infected throat,’’ ‘‘have high blood pressure,’’ and ‘‘get cancer.’’ For
half of the participants, the events from the first set were combined with the chance terms of set A and the
events from the second set were combined with the chance terms of set B (combination 1; see Table 1a). For
the other half of the participants, the events of the first set were combined with the chance terms of set B and
the events of the second set were combined with the chance terms of set A (combination 2).
Third, after the chance term interpretation questionnaire and the likelihood estimation questionnaire for a
given target (self or other), participants rated how severe they thought each health problem would be if that
target experienced it. They did so on a scale from 0 (not at all serious) to 100 (very serious). We chose this
unusually fine-grained scale to render the severity scale comparable to the likelihood scale.
For the chance term interpretation task, we thus created four within-subjects variables: target (self vs.
other), implied probability (high vs. low), event severity (high vs. low), and event comparative optimism
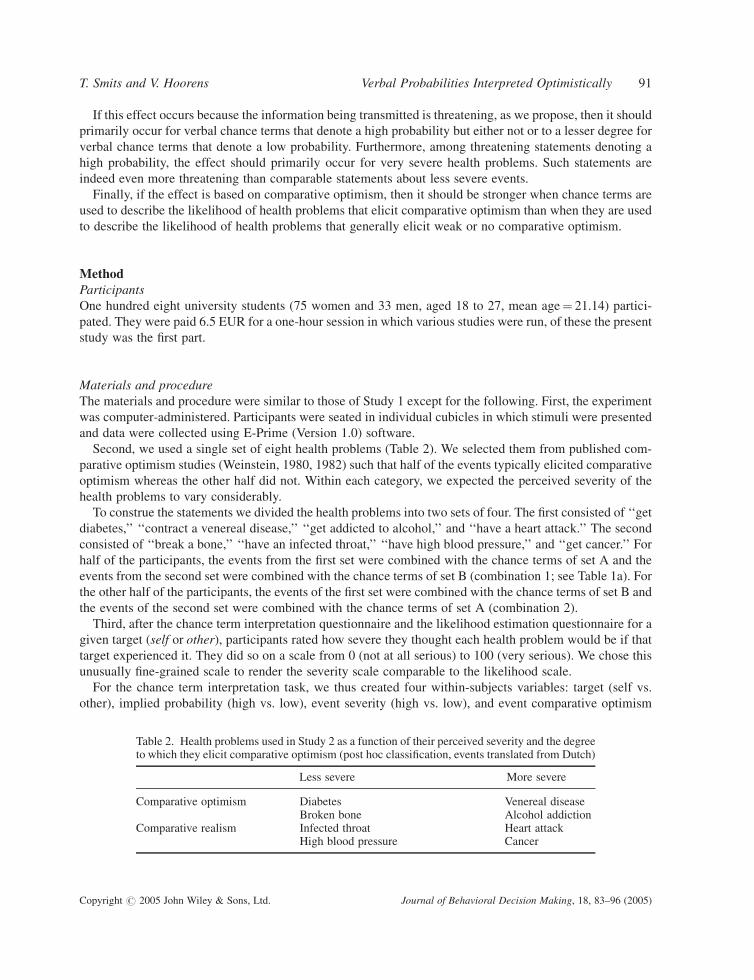
Table 2. Health problems used in Study 2 as a function of their perceived severity and the degreeto which they elicit comparative optimism (post hoc classification, events translated from Dutch)
Less severe More severe
Comparative optimism Diabetes Venereal diseaseBroken bone Alcohol addiction
Comparative realism Infected throat Heart attackHigh blood pressure Cancer
T. Smits and V. Hoorens Verbal Probabilities Interpreted Optimistically 91
Copyright # 2005 John Wiley & Sons, Ltd. Journal of Behavioral Decision Making, 18, 83–96 (2005)
(present vs. absent). The severity dichotomization was based on participants’ ratings. The comparative opti-
mism dichotomization was verified with the comparative optimism questionnaire. Contrary to the a priori
classification, comparative optimism occurred for ‘‘break a bone’’ but not for ‘‘have a heart attack.’’ There-
fore, we regrouped the problems accordingly. We also included two between-subjects variables for experi-
mental control: event–chance term combination (combinations 1 and 2) and target order (self–other vs.
other–self). For the likelihood estimation task and the severity rating task, the same design applied except
that the within-subjects variable implied probability and the between-subjects variable event–chance term
combination.
Results and discussion
We replicated the self-serving or comparatively optimistic interpretation of verbal chance terms. On average,
participants attached lower numerical probabilities to verbal chance terms in statements about health pro-
blems in their own future than to verbal chance terms in statements about health problems in someone else’s
future (self-other difference: M¼ 3.45, SD¼ 7.97; t(107)¼ 4.5, p< 0.0001, f¼ 0.43).
We particularly predicted a self-serving interpretation of verbal chance terms in threatening statements or,
more specifically, in statements implying a high likelihood of health problems. We also predicted that this
effect would be aggravated by the perceived severity of the health problems and the degree to which the
health problems elicited comparative optimism. To test these predictions, we performed an ANOVA on
the mean self–other difference scores with implied probability (high vs. low), event severity (high vs.
low), and event comparative optimism (present vs. absent) as within-subjects variables and with event–
chance term combination (combinations 1 and 2) and target order (self–other vs. other–self) as between-sub-
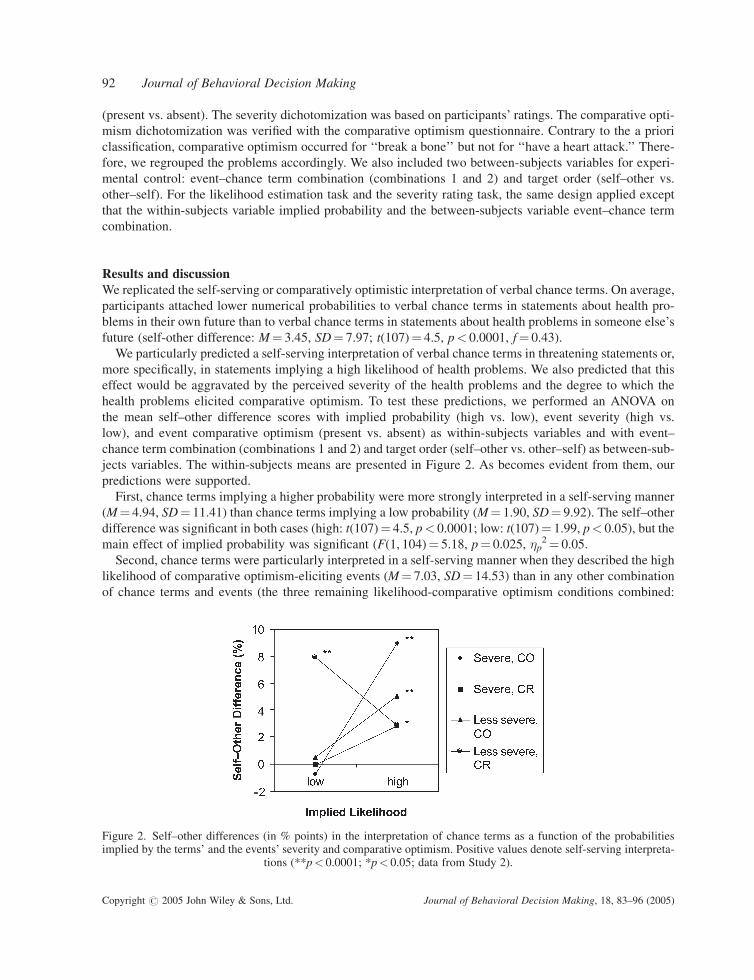
jects variables. The within-subjects means are presented in Figure 2. As becomes evident from them, our
predictions were supported.
First, chance terms implying a higher probability were more strongly interpreted in a self-serving manner
(M¼ 4.94, SD¼ 11.41) than chance terms implying a low probability (M¼ 1.90, SD¼ 9.92). The self–other
difference was significant in both cases (high: t(107)¼ 4.5, p< 0.0001; low: t(107)¼ 1.99, p< 0.05), but the
main effect of implied probability was significant (F(1, 104)¼ 5.18, p¼ 0.025, �p2¼ 0.05.
Second, chance terms were particularly interpreted in a self-serving manner when they described the high
likelihood of comparative optimism-eliciting events (M¼ 7.03, SD¼ 14.53) than in any other combination
of chance terms and events (the three remaining likelihood-comparative optimism conditions combined:
Figure 2. Self–other differences (in % points) in the interpretation of chance terms as a function of the probabilitiesimplied by the terms’ and the events’ severity and comparative optimism. Positive values denote self-serving interpreta-
tions (**p< 0.0001; *p< 0.05; data from Study 2).
92 Journal of Behavioral Decision Making
Copyright # 2005 John Wiley & Sons, Ltd. Journal of Behavioral Decision Making, 18, 83–96 (2005)
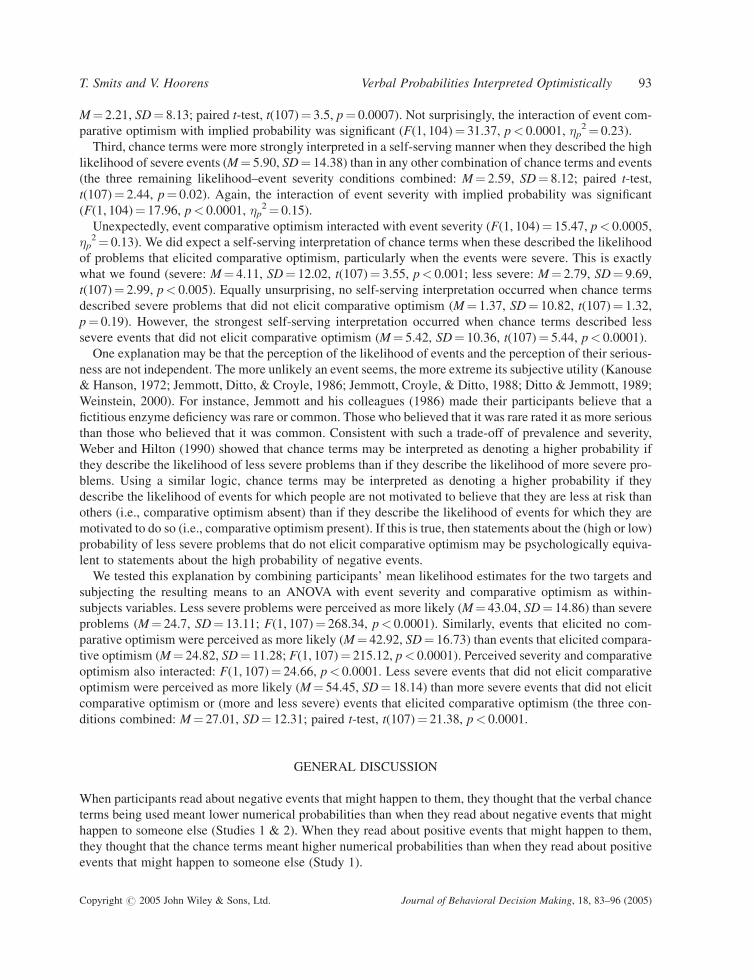
M¼ 2.21, SD¼ 8.13; paired t-test, t(107)¼ 3.5, p¼ 0.0007). Not surprisingly, the interaction of event com-
parative optimism with implied probability was significant (F(1, 104)¼ 31.37, p< 0.0001, �p2¼ 0.23).
Third, chance terms were more strongly interpreted in a self-serving manner when they described the high
likelihood of severe events (M¼ 5.90, SD¼ 14.38) than in any other combination of chance terms and events
(the three remaining likelihood–event severity conditions combined: M¼ 2.59, SD¼ 8.12; paired t-test,
t(107)¼ 2.44, p¼ 0.02). Again, the interaction of event severity with implied probability was significant
(F(1, 104)¼ 17.96, p< 0.0001, �p2¼ 0.15).
Unexpectedly, event comparative optimism interacted with event severity (F(1, 104)¼ 15.47, p< 0.0005,
�p2¼ 0.13). We did expect a self-serving interpretation of chance terms when these described the likelihood
of problems that elicited comparative optimism, particularly when the events were severe. This is exactly
what we found (severe: M¼ 4.11, SD¼ 12.02, t(107)¼ 3.55, p< 0.001; less severe: M¼ 2.79, SD¼ 9.69,
t(107)¼ 2.99, p< 0.005). Equally unsurprising, no self-serving interpretation occurred when chance terms
described severe problems that did not elicit comparative optimism (M¼ 1.37, SD¼ 10.82, t(107)¼ 1.32,
p¼ 0.19). However, the strongest self-serving interpretation occurred when chance terms described less
severe events that did not elicit comparative optimism (M¼ 5.42, SD¼ 10.36, t(107)¼ 5.44, p< 0.0001).
One explanation may be that the perception of the likelihood of events and the perception of their serious-
ness are not independent. The more unlikely an event seems, the more extreme its subjective utility (Kanouse
& Hanson, 1972; Jemmott, Ditto, & Croyle, 1986; Jemmott, Croyle, & Ditto, 1988; Ditto & Jemmott, 1989;
Weinstein, 2000). For instance, Jemmott and his colleagues (1986) made their participants believe that a
fictitious enzyme deficiency was rare or common. Those who believed that it was rare rated it as more serious
than those who believed that it was common. Consistent with such a trade-off of prevalence and severity,
Weber and Hilton (1990) showed that chance terms may be interpreted as denoting a higher probability if
they describe the likelihood of less severe problems than if they describe the likelihood of more severe pro-
blems. Using a similar logic, chance terms may be interpreted as denoting a higher probability if they
describe the likelihood of events for which people are not motivated to believe that they are less at risk than
others (i.e., comparative optimism absent) than if they describe the likelihood of events for which they are
motivated to do so (i.e., comparative optimism present). If this is true, then statements about the (high or low)
probability of less severe problems that do not elicit comparative optimism may be psychologically equiva-
lent to statements about the high probability of negative events.
We tested this explanation by combining participants’ mean likelihood estimates for the two targets and
subjecting the resulting means to an ANOVA with event severity and comparative optimism as within-
subjects variables. Less severe problems were perceived as more likely (M¼ 43.04, SD¼ 14.86) than severe
problems (M¼ 24.7, SD¼ 13.11; F(1, 107)¼ 268.34, p< 0.0001). Similarly, events that elicited no com-
parative optimism were perceived as more likely (M¼ 42.92, SD¼ 16.73) than events that elicited compara-
tive optimism (M¼ 24.82, SD¼ 11.28; F(1, 107)¼ 215.12, p< 0.0001). Perceived severity and comparative
optimism also interacted: F(1, 107)¼ 24.66, p< 0.0001. Less severe events that did not elicit comparative
optimism were perceived as more likely (M¼ 54.45, SD¼ 18.14) than more severe events that did not elicit
comparative optimism or (more and less severe) events that elicited comparative optimism (the three con-
ditions combined: M¼ 27.01, SD¼ 12.31; paired t-test, t(107)¼ 21.38, p< 0.0001.
GENERAL DISCUSSION
When participants read about negative events that might happen to them, they thought that the verbal chance
terms being used meant lower numerical probabilities than when they read about negative events that might
happen to someone else (Studies 1 & 2). When they read about positive events that might happen to them,
they thought that the chance terms meant higher numerical probabilities than when they read about positive
events that might happen to someone else (Study 1).
T. Smits and V. Hoorens Verbal Probabilities Interpreted Optimistically 93
Copyright # 2005 John Wiley & Sons, Ltd. Journal of Behavioral Decision Making, 18, 83–96 (2005)
This self-serving interpretation depended on the probability level implied by the chance terms. When they
described a high probability of negative events (Studies 1 and 2) or a low probability of positive events
(Study 1), they were interpreted in a self-serving manner. When they described a low probability of negative
events or a high probability of positive events, either no (Study 1) or a weak (Study 2, negative events) self-
serving interpretation occurred.
We interpret this pattern in terms of the threatening nature of the statements and suggest that the self-
serving interpretation of verbal chance terms is a case of motivated reasoning. Individuals use cognitive stra-
tegies to interpret probabilistic expressions favorably when they are motivated to do so. This motivation is
stronger when they are confronted with threatening communications about their future than when they are
confronted with non-threatening communications on their or someone else’s future. Supporting this view,
both the severity of the health problems being described (Study 2) and the probability implied by the chance
terms (Studies 1 and 2) affect the degree to which the interpretation of chance terms yield a comparatively
optimistic self–other difference.
Teigen and Brun (1995) offer further support for the idea that some probability statements are more threa-
tening than others. They found that chance terms may communicate a sense of directionality. Affirmative
chance terms elicit thoughts about why a given outcome may occur. Negative terms elicit reasons why
the outcomes will not occur. Interestingly, high probability terms are mostly affirmative, whereas low prob-
ability terms are mostly negative. Statements saying that negative events will occur may therefore elicit
frightening thoughts about risk-enhancing factors while statements saying that positive events will not occur
may elicit scary thoughts about blocks and pitfalls on the way to success. Because both are threatening, they
motivate self-serving interpretations of the chance terms being used.
To be sure, the self–other difference we observed in the interpretation of chance terms was not very large.
Therefore, we do not mean to say that people reinterpret chance terms completely differently when these
terms describe one’s own versus someone else’s future. We believe that the self-serving distortion is limited
by the boundaries of perceived rationality. As suggested in the literature on self-favoring biases, people
adjust their likelihood estimates and personality ratings to the degree that they can rationalise their views
and maintain a self-image as a reasonable person (e.g., Kunda, 1990). Consequently, the self–other differ-
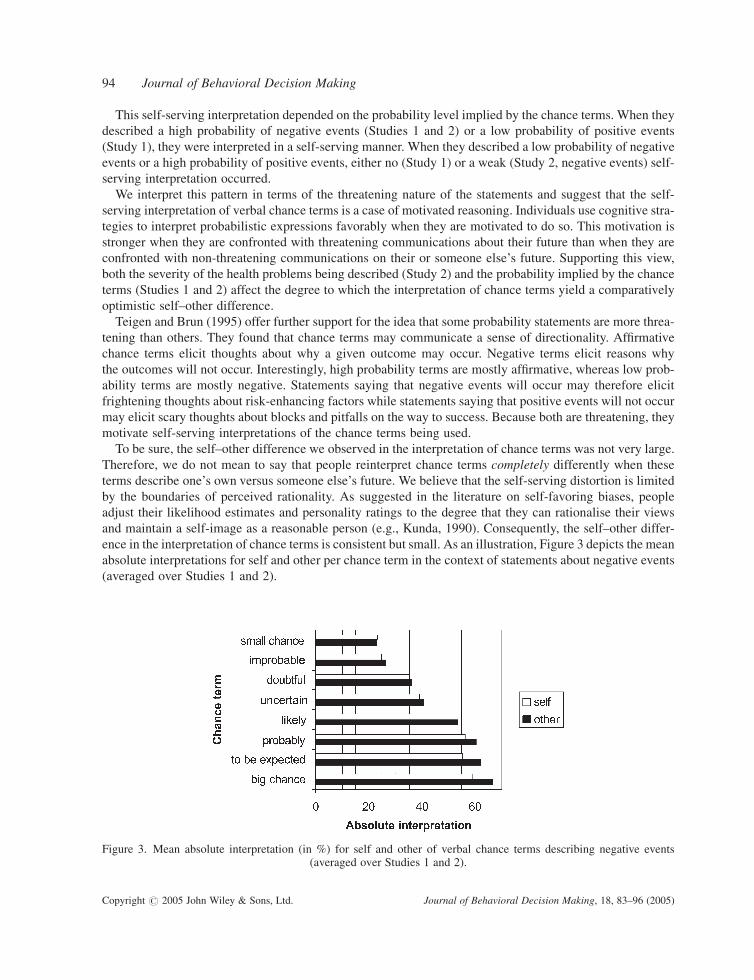
ence in the interpretation of chance terms is consistent but small. As an illustration, Figure 3 depicts the mean
absolute interpretations for self and other per chance term in the context of statements about negative events
(averaged over Studies 1 and 2).
Figure 3. Mean absolute interpretation (in %) for self and other of verbal chance terms describing negative events(averaged over Studies 1 and 2).
94 Journal of Behavioral Decision Making
Copyright # 2005 John Wiley & Sons, Ltd. Journal of Behavioral Decision Making, 18, 83–96 (2005)
The motivated reasoning account implies that identifying the motivational basis of the self-serving inter-
pretation of chance terms is not sufficient. To fully understand why people say that chance terms denote a
different probability when they describe their versus someone else’s future, we also need to analyse the cog-
nitive mechanism that allows them to reach this outcome without being confronted with their motivated sub-
jectivity. Both studies suggest that the effect is related to comparative optimism (for a recent overview see
Shepperd et al., 2002).
To conclude, we found that people interpret risk messages differently depending on whose future these
messages describe. As such, our studies add insight on context effects in the interpretation of risk messages
(for an overview, see Fox & Irwin, 1998). Although risk communication does not exist exclusively of mes-
sages on the high probability of unhappy events in the future, such messages constitute a large and important
part of it. Health and safety education messages that aim at eliciting behavioral change may particularly
underline the high probability of hazards if the audience does not comply. Ironically, this is the kind of risk
communication that is most likely to elicit a comparatively optimistic interpretation of the chance terms that
are used in describing these hazards.
REFERENCES
Beyth-Marom, R. (1982). How probable is probable? Numerical translation of verbal probability expressions. Journal ofForecasting, 1, 257–269.
Brun, W., & Teigen, K. H. (1988). Verbal probabilities: ambiguous, context-dependent, or both? OrganizationalBehavior and Human Decision Processes, 41, 390–404.
Budescu, D. V., & Wallsten, T. S. (1985). Consistency in interpretation of probabilistic statements. OrganizationalBehavior and Human Decision Processes, 36, 391–405.
Budescu, D. V., & Wallsten, T. S. (1995). Processing linguistic probabilities: general principles and empirical evidence.In J. Busemeyer, & D. Medin (Eds.), Decision making from a cognitive perspective: The psychology of learning andmotivation (Vol. 32, pp. 275–318). New York: Academic Press.
Buunk, B. P. (2001). Perceived superiority of one’s own relationship and perceived prevalence of happy and unhappyrelationships. British Journal of Social Psychology, 40, 565–574.
Clark, D. A. (1990). Verbal uncertainty expressions: a critical review of two decades of research. Current Psychology:Research & Reviews, 9, 203–235.
Ditto, P. H., & Jemmott, J. B. (1989). From rarity to evaluative extremity: effects of prevalence information onevaluations of negative and positive characteristics. Journal of Personality and Social Psychology, 57, 16–26.
Erev, I., & Cohen, B. L. (1990). Verbal versus numerical probabilities: efficiency, biases, and the preference paradox.Organizational Behavior and Human Decision Processes, 45, 1–18.
Flugstad, A. R., & Windschitl, P. D. (2003). The influence of reasons on interpretations of probability forecasts. Journalof Behavioral Decision Making, 16, 107–126.
Fox, C. R., & Irwin, J. R. (1998). The role of context in the communication of uncertain beliefs. Basic and Applied SocialPsychology, 20, 57–70.
Harris, P. (1996). Sufficient grounds for optimism? The relationship between perceived controllability and optimisticbias. Journal of Social and Clinical Psychology, 15, 9–52.
Harris, P., & Middleton, W. (1994). The illusion of control and optimism about health: on being less at risk but no more incontrol than others. British Journal of Social Psychology, 33, 369–386.
Hoorens, V. (1994). Unrealistic optimism in health and safety risks. In D. R. Rutter, & L. Quine (Eds.), Social psychologyand health: European perspectives (pp. 153–174). Aversbury: Aldershot.
Hoorens, V. (1996). Self-favoring biases for positive and negative characteristics: independent phenomena? Journal ofSocial and Clinical Psychology, 15, 53–67.
Hoorens, V., & Smits, T. (2001). Why do controllable events elicit stronger comparative optimism than uncontrollableevents? Revue Internationale de Psychologie Sociale/International Review of Social Psychology, 14(4), 11–43.
Jemmott, J. B., Croyle, R. T., & Ditto, P. H. (1988). Commonsense epidemiology: self-based judgments from laypersonsand physicians. Health Psychology, 7, 55–73.
Jemmott, J. B., Ditto, P. H., & Croyle, R. T. (1986). Judging health status: effects of perceived prevalence and personalrelevance. Journal of Personality and Social Psychology, 50, 899–905.
T. Smits and V. Hoorens Verbal Probabilities Interpreted Optimistically 95
Copyright # 2005 John Wiley & Sons, Ltd. Journal of Behavioral Decision Making, 18, 83–96 (2005)
Kanouse, D. E., & Hanson, L. R., Jr. (1972). Negativity in evaluations. In E. E. Jones, D. E. Kanouse, H. H. Kelley, R. E.Nisbett, S. Valins, & B. Weiner (Eds.), Attribution: Perceiving the causes of behavior (pp. 47–62). Morristown, NJ:General Learning Press.
Klein, C. T. F., & Helweg-Larsen, M. (2002). Perceived control and the optimistic bias: a meta-analytic review.Psychology and Health, 17, 437–446.
Klein, W. M., & Weinstein, N. D. (1997). Social comparison and unrealistic optimism about personal risk. In B. P.Buunk, & F. X. Gibbons (Eds.), Health, coping and well-being: Perspectives from social comparison theory (pp. 25–61). Mahwah, NJ: Erlbaum.
Kleiter, G. D., Doherty, M. E., & Brake, G. L. (2002). The psychophysics metaphor in calibration research. InP. Sedlmeier, & T. Betsch (Eds.), ETC: Frequency processing and cognition (pp. 239–258). London: OxfordUniversity Press.
Kunda, Z. (1990). The case for motivated reasoning. Psychological Bulletin, 108, 480–498.McKenna, F. P. (1993). It won’t happen to me: unrealistic optimism or illusion of control? British Journal of Psychology,84, 39–50.
Norem, J. K. (2001). Defensive pessimism, optimism, and pessimism. In E. C. Chang (Ed.), Optimism & pessimism:Implications for theory, research, and practice (pp. 77–100). Washington: American Psychological Association.
Norem, J. K., & Cantor, N. (1986). Anticipatory and post hoc cushioning strategies: optimism and defensive pessimismin ‘‘risky’’ situations. Cognitive Therapy and Research, 10, 347–362.
Rapoport, A., Wallsten, T. S., Erev, I., & Cohen, B. L. (1990). Revision of opinion with verbally and numericallyexpressed uncertainties. Acta Psychologica, 74, 61–79.
Shepperd, J. A., Carroll, P., Grace, J., & Terry, M. (2002). Exploring the causes of comparative optimism. Special issueon self–other asymmetries in social cognition. Psychologica Belgica, 42, 65–98.
Taylor, S. E., & Brown, J. D. (1988). Illusion and well-being: a social psychological perspective on mental health.Psychological Bulletin, 103, 193–210.
Teigen, K. H., & Brun, W. (1995). Yes, but it is uncertain: direction and communicative intention of verbal probabilisticterms. Acta Psychologica, 88, 233–258.
Teigen, K. H., & Brun, W. (2003). Verbal probabilities: a question of frame? Journal of Behavioral Decision Making, 16,53–72.
Wallsten, T. S., Budescu, D. V., Rapoport, A., Zwick, R., & Forsyth, B. (1986). Measuring the vague meanings ofprobability terms. Journal of Experimental Psychology: General, 115, 348–365.
Wallsten, T. S., Fillenbaum, S., & Cox, J. A. (1986). Base rate effects on the interpretations of probability and frequencyexpressions. Journal of Memory and Language, 25, 571–587.
Weinstein, N. D. (1980). Unrealistic optimism about future life events. Journal of Personality and Social Psychology, 39,806–820.
Weinstein, N. D. (1982). Unrealistic optimism about susceptibility to health problems. Journal of Behavioral Medicine,5, 441–460.
Weinstein, N. D. (2000). Perceived probability, perceived severity, and health-protective behavior. Health Psychology,19, 65–74.
Weber, E. U., & Hilton, D. J. (1990). Contextual effects in the interpretations of probability words: perceived base rateand severity of events. Journal of Experimental Psychology: Human Perception and Performance, 16, 781–789.
Authors’ biographies:
Tim Smits is a graduate student at the Katholieke Universiteit Leuven. His graduation is expected for the fall of 2004.Furthermore, he holds a masters degree in statistics.
Vera Hoorens is a professor of social psychology at the Katholieke Universiteit Leuven. She teaches courses in intro-ductory psychology, social psychology, and social cognition. Her research interests include risk perception and commu-nication, self-favoring biases in social comparison and person perception.
Authors’ address:
Tim Smits and Vera Hoorens, Laboratorium voor Experimentele Sociale Psychologie, Departement Psychologie,Katholieke Universiteit Leuven, Tiensestraat 102, B-3000 Leuven, Belgium.
96 Journal of Behavioral Decision Making
Copyright # 2005 John Wiley & Sons, Ltd. Journal of Behavioral Decision Making, 18, 83–96 (2005)