Embed Size (px)
Citation preview
Intro to Unit 3: Macroeconomics – Measuring Economic Performance
The History of Money
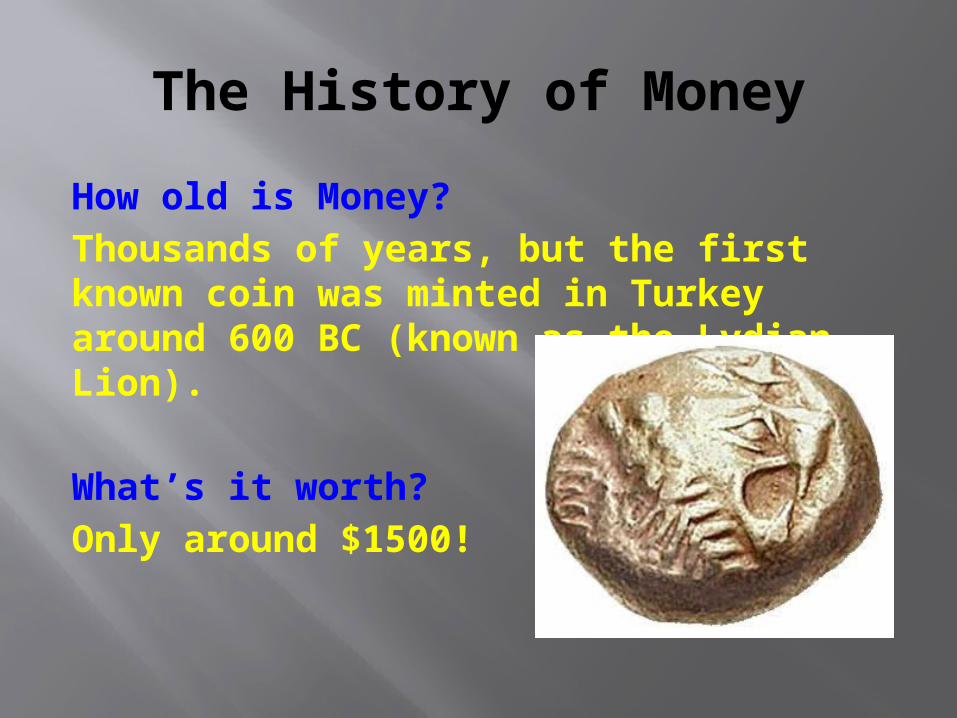
How old is Money?Thousands of years, but the first known coin was minted in Turkey around 600 BC (known as the Lydian Lion).
What’s it worth?Only around $1500!
The History of Money
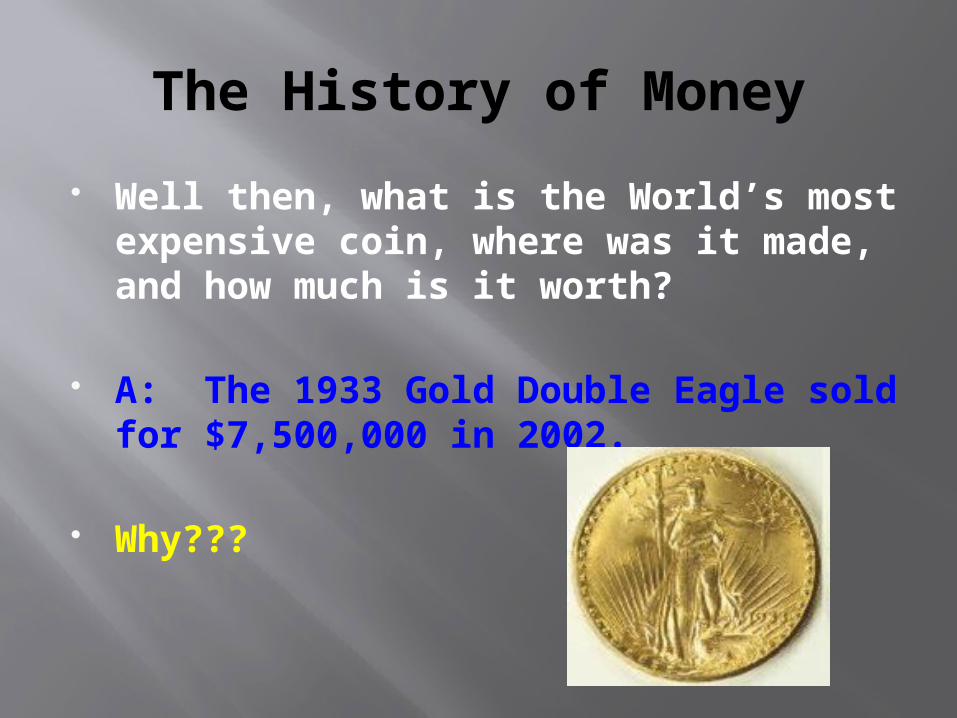
Well then, what is the World’s most expensive coin, where was it made, and how much is it worth?
A: The 1933 Gold Double Eagle sold for $7,500,000 in 2002.
Why???
The History of Money
Money, however, has been around practically as long as man.
Barter: The direct exchange of one set of goods for another (EX: trading vegetables for meat).
Still popular in many parts of the world (traditional economies).
Money
What is money?
To an economist, anything that serves as a medium of exchange, unit of account, or a store of value.
Money
Why do you think bartering would not be practical in our economy?
Because money needs to be a…1. Medium of exchange: Allows
people to buy things.A teacher does not want to be paid
300 bananas for a days work.Eliminates the need to BARTER
Money
Money must also act as a…2. Unit of Account: A means for
comparing the value of a good or service.
Example: We say money is a “unit of account” because we can use it to compare the price of different items.
We don’t have to determine how many shirts are required to buy a car. (PROVIDES A COMMON DENOMINATOR)
Money Money must also serve as a… 3. Store of Value: Something that
keeps its value of it is stored rather than used.
Example: If you store your money in the bank to save for a car, it is acting as a “store of value”.
Think about it, a bartering economy would be awful if you were trying to store your “money”.
Intro to Unit 3
Gross Domestic Product (GDP): Total dollar value of all final goods and services produced within a country in a given year.
GDP is used to measure the overall “health” of the economy.
In 2015, US GDP is projected to be $18.1 trillion, 22% of the total world GDP. (Approx. $50k per capita).
Limitations of GDP:
Review: What is GDP? Some things that are NOT included in
GDP:1. Intermediate goods (Ex: Tire on a car. Only the finished car counts. NO DOUBLE COUNTING)2. Nonproduction transactions: (Ex: Stocks and Bonds or USED goods)3. Non-Market transactions: (Things that are illegal)4. Higher Quality of present goods vs. past goods5. Leisure time people have.6. Pollution
Nominal vs. Real in Econ
“Nominal” means that the $$$ figures you see are in the actual dollar amount of the year they were calculated.
“Real” takes inflation into account.
What is inflation???
Nominal vs. Real:
What is the most
successful movie of all
time?
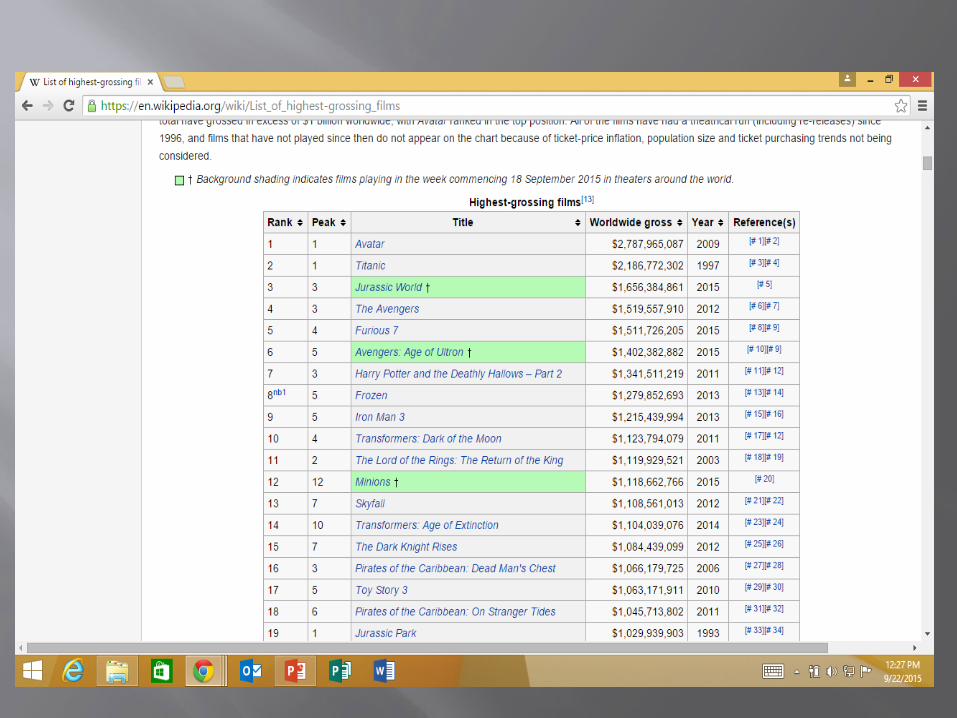
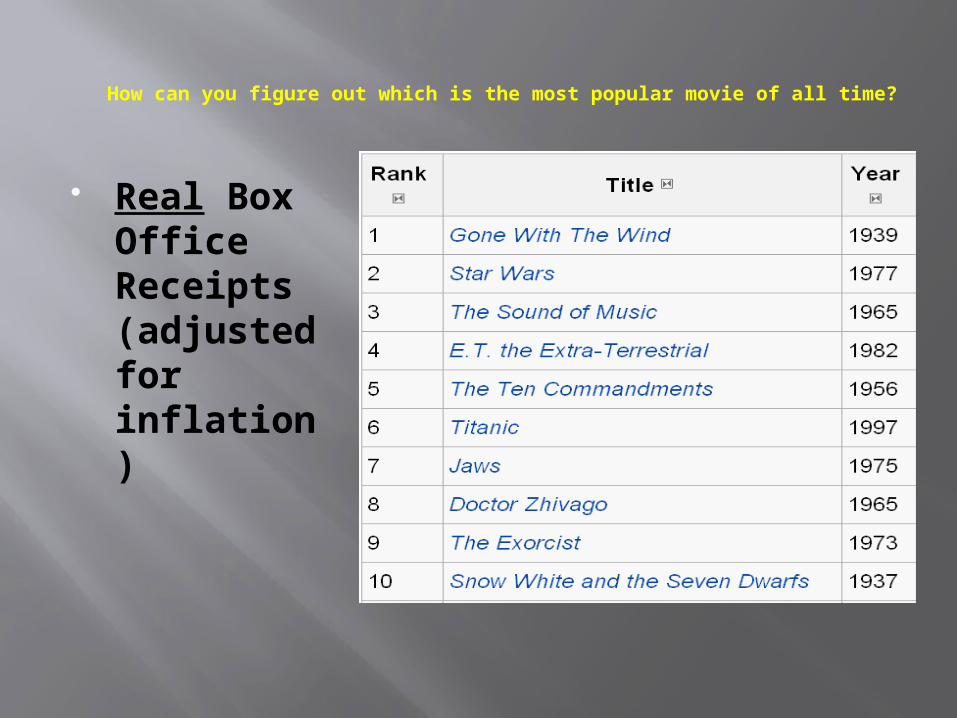
How can you figure out which is the most popular movie of all time?
Real Box Office Receipts (adjusted for inflation)
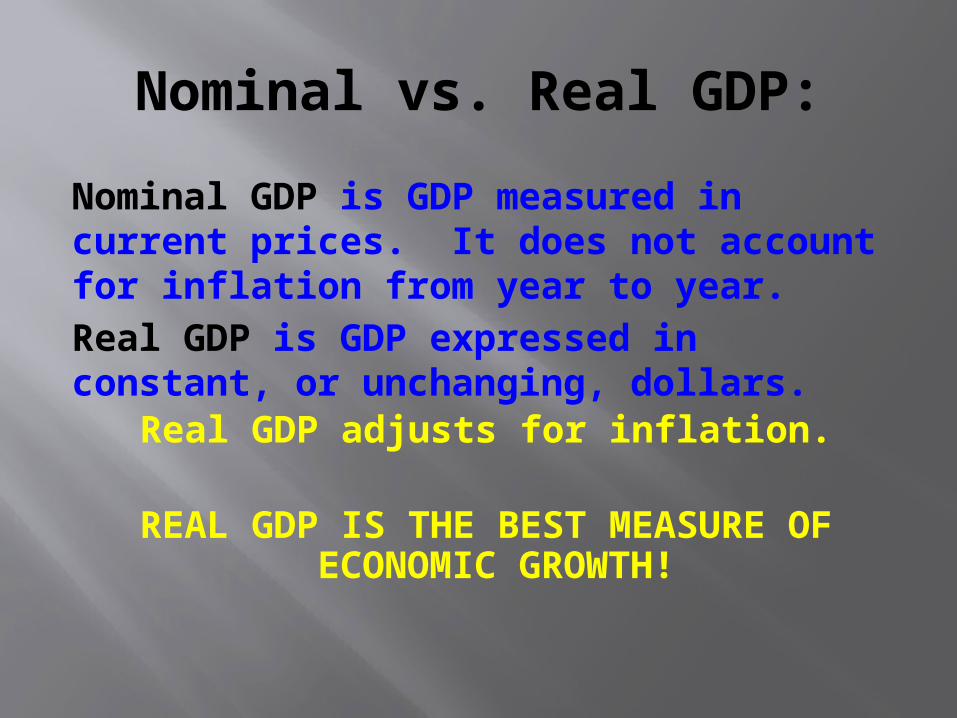
Nominal vs. Real GDP:
Nominal GDP is GDP measured in current prices. It does not account for inflation from year to year.Real GDP is GDP expressed in constant, or unchanging, dollars.
Real GDP adjusts for inflation.
REAL GDP IS THE BEST MEASURE OF ECONOMIC GROWTH!
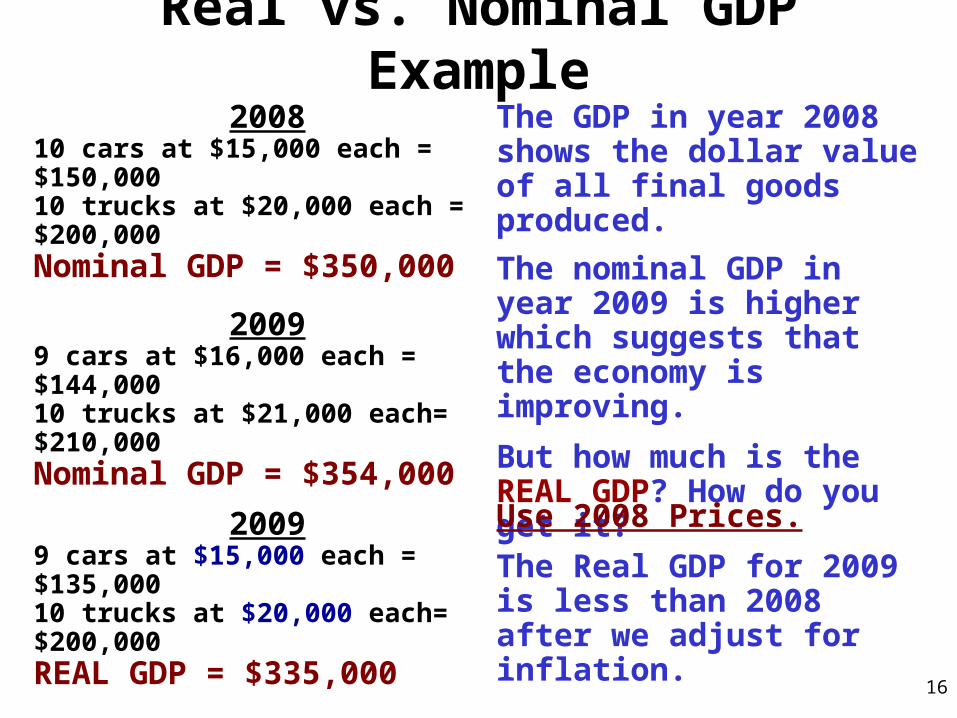
Real vs. Nominal GDP Example2008
10 cars at $15,000 each = $150,00010 trucks at $20,000 each = $200,000Nominal GDP = $350,000
20099 cars at $16,000 each = $144,00010 trucks at $21,000 each= $210,000Nominal GDP = $354,000
The GDP in year 2008 shows the dollar value of all final goods produced.
The nominal GDP in year 2009 is higher which suggests that the economy is improving.
But how much is the REAL GDP? How do you get it?
Use 2008 Prices.
The Real GDP for 2009 is less than 2008 after we adjust for inflation.
20099 cars at $15,000 each = $135,00010 trucks at $20,000 each= $200,000REAL GDP = $335,000
16
GDP Deflator:
GDP Deflator: Measures the rate of inflation in a nation.
GDP Deflator = (Nominal GDP/Real GDP) * 100
Picture has nothing to do with GDP, but the slide justcalled for a picture.
GDP Deflator:
Example: 2013 Nominal GDP = $130 2013 Real GDP = $110
GDP Deflator = ($130/$110) X 100 = 118 What does that number mean??? Inflation has increased 18% since the
BASE year.
GDP Deflator:
The GDP Deflator is reported by the Bureau of Economic Analysis (BEA), using 2005 as the base year — meaning, the deflator for 2005 is set to 100 with other years reported relative to the 2005 dollar.
Examples: The GDP Deflator for 2010 was 110.99. On
average the 2005 dollar could buy (10.99/100) 10.99% more than the 2009 dollar.
The GDP Deflator for 1950 was 14.65. On average the 1950 dollar could buy (100/14.65) 6.82 times as many goods as the 2005 dollar.
Calculating GDP:
The Expenditures Approach:
GDP = C + Ig + G + Xm
But what do each of the letters mean???
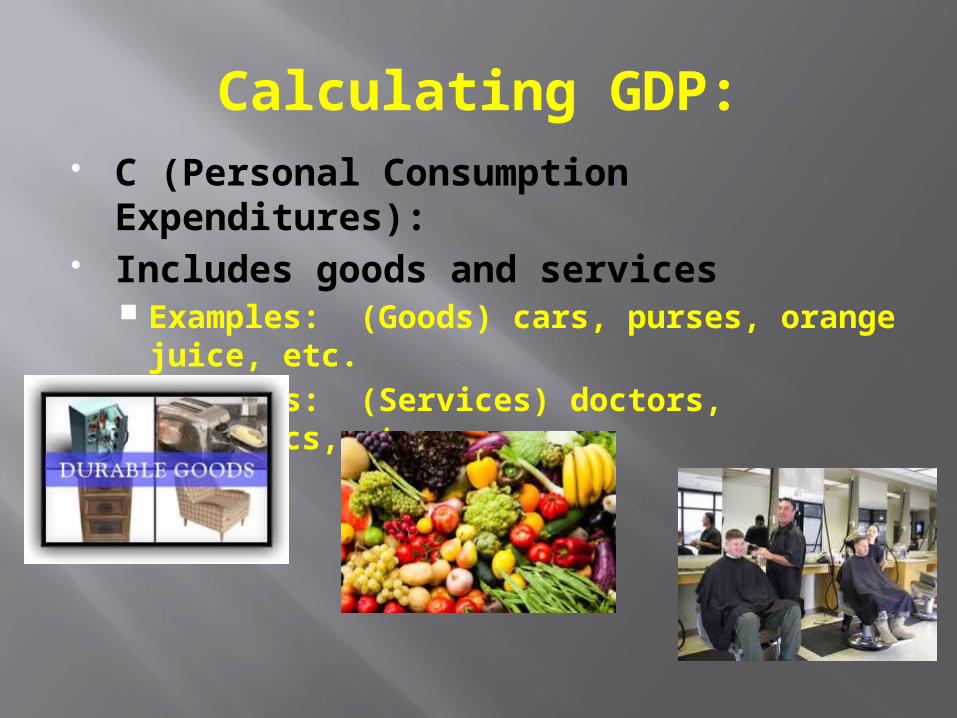
Calculating GDP: C (Personal Consumption
Expenditures): Includes goods and services
Examples: (Goods) cars, purses, orange juice, etc.
Examples: (Services) doctors, mechanics, etc.
Calculating GDP:
Ig (Gross Private Domestic Investment):
Includes: 1. All final purchases of machinery, equipment, and tools by
businesses.2. All construction3. Changes in Inventories
DOES NOT INCLUDE stocks and bonds!
Calculating GDP:
G (Government Purchases):
2 Categories:1. Gov’t spending on goods and services that Gov’t uses to provide public services.
2. Gov’t spending on social capital, such as schools and highways.
Calculating GDP:
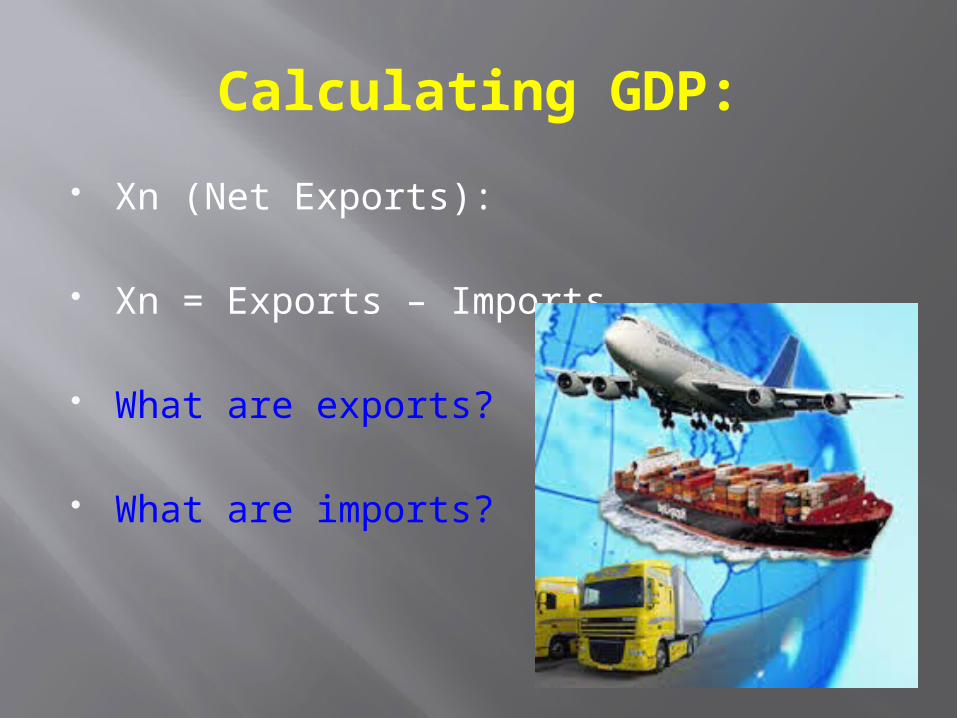
Xn (Net Exports):
Xn = Exports – Imports
What are exports?
What are imports?
Review:
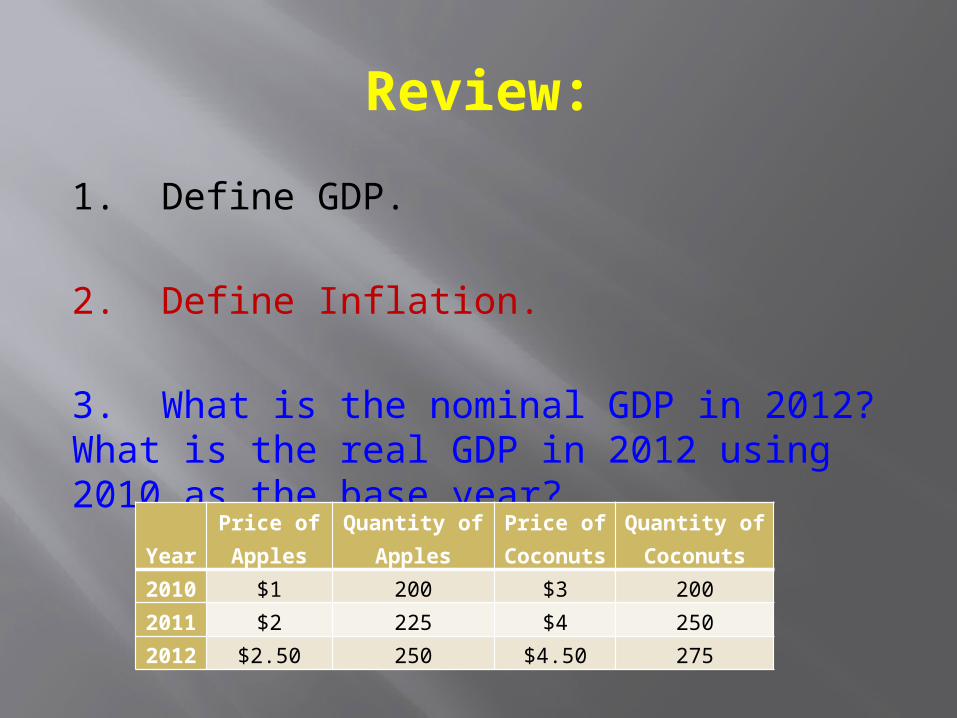
1. Define GDP.
2. Define Inflation.
3. What is the nominal GDP in 2012? What is the real GDP in 2012 using 2010 as the base year?
YearPrice of Apples
Quantity of Apples
Price of Coconut
sQuantity of Coconuts
2010 $1 200 $3 200
2011 $2 225 $4 250
2012 $2.50 250 $4.50 275
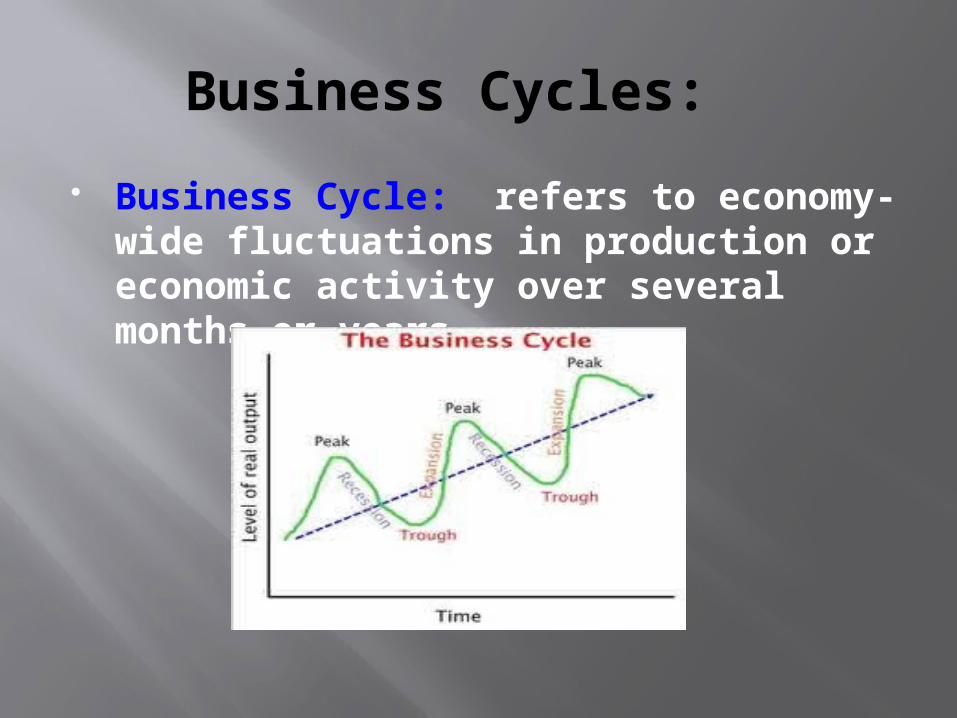
Business Cycles:
Business Cycle: refers to economy-wide fluctuations in production or economic activity over several months or years.
Business Cycle Vocab
Expansion: A period of economic growth as determined by a rise in real GDP.
Peak: The height of economic expansion (when real GDP stops rising).
Contraction: The period after reaching its peak, where real GDP starts to fall.
Trough: The lowest point of the business cycle.
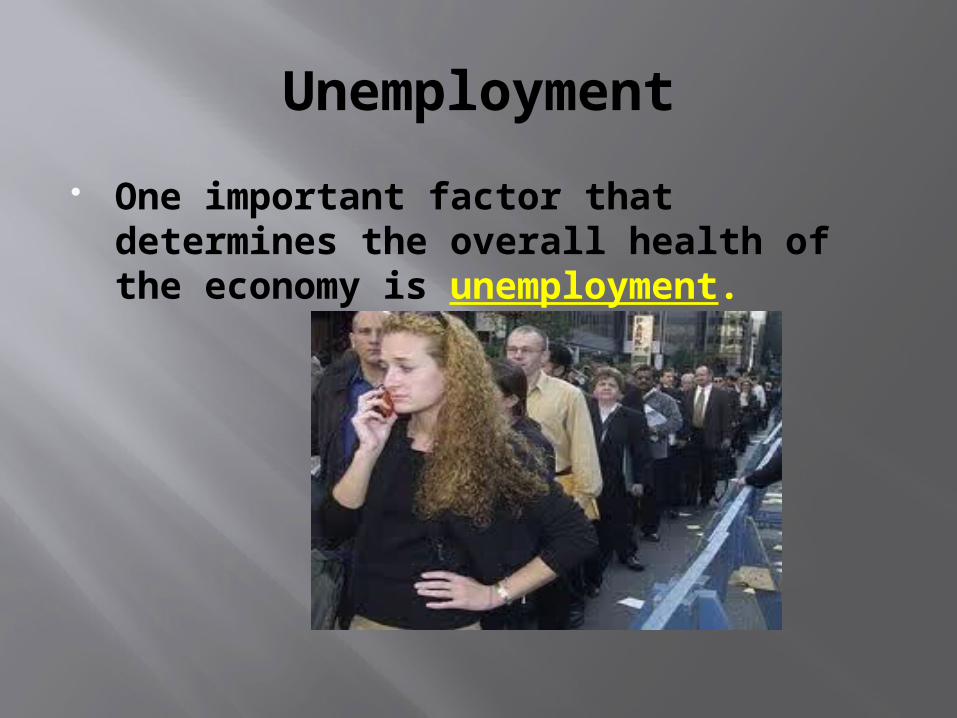
Unemployment
One important factor that determines the overall health of the economy is unemployment.
Unemployment
Unemployment Rate: The percentage of people aged 16 and older who are actively looking for a job.
In 2000, the national unemployment rate was 4%.
Today, it is 5.6%.
Unemployment Two reasons why the unemployment
rate doesn’t explain how bad things really are:
1. Discouraged Workers: People who have given up trying to find work.
2. Underemployed Workers: People who are working jobs that they are overqualified for.
Example: The accountant that works at Walmart because she can’t find work as an accountant.
Unemployment
1. Frictional Unemployment: Occurs when people take time to find a job. (EX: Tina quits her job as a cashier because she wants to find a job as a secretary).
2. Seasonal Unemployment: Occurs when industries slow or shut down for a season. (EX: Carlos is an accountant and is hired for “tax season”. He is laid-off after April 15th).
Unemployment3. Structural Unemployment: Occurs
when workers skills do not match the jobs available. (EX: Martin, who barely graduated high school, did not have the skills to operate the computer at his data-entry job, so he was fired).
4. Cyclical Unemployment: Rises when economy is doing poorly, falls when economy is doing well. Why? When the economy is doing well there is a higher demand for labor.