Embed Size (px)
Citation preview

How NonprofitsCan Use Data to Inform Decisions and Drive Performance

About First Republic’s Approach to Nonprofits
At First Republic Bank, we know that when it comes to reaching your organization’s fullest potential, you need partners who know both you and your indus-
try, inside and out. That’s why it’s important to have partners who are committed to building a long-term relationship and creating solutions designed for your
unique, nonprofit needs.
We have extensive experience working with nonprofits. In fact, roughly half of our business loans originated
with nonprofit organizations. The result is an intensive client focus that translates to greater flexibility and
tailor-made solutions to help you meet your needs, attain your goals and simplify your life.

Page 1
IntroductionWith increasing calls for visibility, accountability, and monitoring and evaluation (M&E), nonprofits must improve their use of data both in decision-making and in reporting.
Contents
Page 3
Getting Started With Metrics for Data-Driven Decision-MakingTo become a data-driven organization, begin with a review of goals, outcomes and critical activities.
Page 11
Data Dashboards: The Best Tool for Monitoring and EvaluationDashboards make it easy to monitor and report performance with at-a-glance snapshots of key metrics that chart progress and
suggest what works and what doesn’t.
Page 17
Action Plan: Up the Data GameData-informed organizations blend information, experience and context to answer key questions, support or refute assumptions
and assess efficacy and progress.
Page 23
A Model for Future SuccessNonprofits face a myriad of challenges in today’s operating environment — including a growing need for programs and services, increased competition for resources, heightened scrutiny of stewardship and efficacy, and more.

Introduction

With increasing calls for visibility, accountability and monitoring and evaluation (M&E), nonprofits must improve their use of data both in decision-making and in reporting.
Why? Because many don’t maximize their mission utilizing their current investments in data-gathering activities.
This e-book demonstrates how you can use data to achieve important goals, including how to review/choose metrics, deploy dashboards, learn keys to success and deliver
better reporting and organizational storytelling for all departments.
The hard truth about hard data While nonprofits engage heavily in collecting data, there’s room for improvement when it comes to using it to make decisions about programs, services, operations and fundraising. This missing organizational knowledge is outlined in the chart below.
How NoNprofits CaN Use Data to iNform DeCisioNs aND Drive performaNCe 2
Source: The State of Data in the Nonprofit Sector from EveryAction and Nonprofit Hub
90%
87%
50%
31%
25%
6%
5%
of nonprofits surveyed collect data
think data is at least somewhat important to their organization
aren’t sure how it can support their work
don’t know what to do with the data they gather
collect data on major gifts initiatives
are confident that their data is being used effectively
always use data to drive decision-making

Getting Started With Metrics for Data-Driven
Decision-Making

Already making data-driven decisions? Skip to page 7
How to select metricsMany nonprofits start with a review of goals, outcomes and critical activities under the mission umbrella. In the process, leaders identify key performance indicators (KPIs) that empower better decision-making.
Step 1: Start with the end in mind.
Establish measurable goals that relate directly to activities and outcomes of the organization, such as:
• Program/Service Efficacy: Allocate 90 percent of funds to be used for service provision, etc.
• Fundraising Efficacy: Spend 20 cents to raise one dollar
• Operating Efficiency: Spend 15 to 20 percent of total expenses on management/overhead
• Mission-Related Impacts:
Lower childhood mortality
Step 2: Identify key audiences.
Chart the audiences who will use the data and select items that resonate with them. Some information may be useful to multiple groups, such as board members and grantors. Your final list should reflect a set of data relevant to each stakeholder group
and help them — and your organization — do their work.
Step 3: Select KPIs.
Begin with performance metrics directly related to finances, mission-focused activities and fundraising, like these:
• Administration and Operations KPIs: 95 percent adoption of a new technology program within 30 days or 80 percent board attendance every meeting
How NoNprofits CaN Use Data to iNform DeCisioNs aND Drive performaNCe 4

• Finance KPIs: Average annual return on the endowment at 10 percent or better, or a 35 percent liability-to-assets ratio
• Fundraising and Marketing KPIs: 15 to 20 percent fundraising expense percentage or 24 percent email newsletter open rate
• Programs KPIs: 10 new students enrolled in after-school programs each quarter or 93 percent animals adopted annually
These are the most common metrics nonprofits included in GuideStar Platinum profiles
(more examples are on page 11):
• Number of volunteers (Administration and Operations)
• Number of clients served (Programs and Services)
• Average number of service recipients/program participants per month (Programs and Services)
• Number of overall donors (Fundraising and Marketing)
• Total dollar amount and number of grants awarded (Finance)
• Monetary and volunteer support received (Fundraising and Marketing, Administration and Operations)
A complete snapshot of a functional area or the entire organization builds the foundation for richer insights in the future.
How NoNprofits CaN Use Data to iNform DeCisioNs aND Drive performaNCe 5

How NoNprofits CaN Use Data to iNform DeCisioNs aND Drive performaNCe 6
Challenge: So much data can be collected that it can be difficult to prioritize. Without defined goals of a data collection program, how can you choose what data to collect and how to present it?
Solution: The Smithsonian Institution’s dashboard program uses a wide range of data points on activities, operations and infrastructure to track its efficacy. The visualizations highlight vital data on finances (including grants, endowments and fundraising); people (including number of volunteer hours completed); facilities, in-person and digital/online engagement (including clients served); collections and research. The Smithsonian collects data using business management and M&E software and direct information-gathering by staff and volunteers. Analytics updates and reporting are based on need and availability. For example, the research publications total is updated continually while collection holdings are updated yearly.
Results: This data is used internally to inform decision-making and develop programming and is reported externally to “spark even greater interest in the Smithsonian’s important work.”
Excerpted from The Smithsonian Institution’s web page, About the Dashboard.
Mini Case Study: Identifying KPIs to Measure

How NoNprofits CaN Use Data to iNform DeCisioNs aND Drive performaNCe 7
All resources required to run the organization and deliver on the mission. Includes board, funding and volunteer support.
Progress made toward objectives and engagement in activities, such as program participation, outreach completed, etc.
Goals desired, changes aspired to and the services, programs, activities and initiatives undertaken to achieve them.
Near- and intermediate-term results, such as changes in behavior, status, lifestyle, environment, etc.
Evidence of long-term impact on target population(s) or issue(s).
Inputs
Objectives/ Activities
Outputs
Evaluation
Outcomes
The Logic Model Approach
Developing more robust metrics CRM solutions are useful tools for gathering and acting on data, enabling you to:
• Improve productivity with a unified view of the entire organization and automated processes that reduce duplication of effort and data entry errors
• Enhance communication with external stakeholders and internal colleagues and empower better collaboration between internal staff and board
• Track every interaction with donors, supporters, service recipients, program participants, funders, volunteers and others
For example, an organization can match attendance records with donor history. Matching the two will enhance fundraising and increase attendance.
Another way to develop more powerful measurements is the logic model approach. The method uses five categories of information to help you identify the specific factors that lead to success and develop KPIs to track them.

Challenge: Choosing the right data to focus on begins with evaluating metrics. How can specific data points lead to a more informed internal decision-making process?
Solution: The Singularity University (SU) think tank determined the resources needed to pursue its mission (inputs) and established objectives related to forming, educating, empowering and deploying a global community of change-makers. The organization tracks outputs such as the number of people participating in programs, labs and accelerators, and the number of countries in which services are provided. To assess progress toward its vision, SU monitors outcomes, including policy initiatives created, startup companies launched and technological advancements achieved in areas like tissue engineering, mental health services for refugees and solar pasteurization to make clean water.
Results: Evaluating these data sets allows SU to understand and report the global impact of its activities.
Excerpted from Singularity University’s web page Impact at Singularity University.
Mini Case Study: Evaluating Metrics to Increase Impact
How NoNprofits CaN Use Data to iNform DeCisioNs aND Drive performaNCe 8

Data Dashboards:The Best Tool for Monitoring
and Evaluation

Dashboards make it easy to monitor and report performance with at-a-glance snapshots of key metrics that chart progress and suggest what works and what doesn’t. They also improve transparency and accountability through deeper understanding of:
• Administration and Operations: Providing insights on resources/overhead and overall effectiveness and performance
• Finance: Informing evaluation of organizational efficacy and resources/overhead
• Fundraising and Marketing: Detailing outreach and advancement resources/overhead and fundraising efficacy
• Programs and Services: Monitoring efficacy, mission and resources/overhead, and how your organization pursues its mission
Using dashboards to support decision-making and M&E:
• Empowers staff to work more effectively to serve the mission, enhance performance and achieve program goals
• Equips board members with a powerful tool for better guidance and more informed decision-making
• Educates external audiences with critical information about the organization’s
performance and value to the community
How NoNprofits CaN Use Data to iNform DeCisioNs aND Drive performaNCe 10
Challenge: Data is only useful if it’s understood. However, with so many options available, how can you choose the best way to showcase data-driven insights on critical business objectives?
Solution: The University of Colorado Office of Advancement and the fund for CU use endowment dashboards to track and share important information on proportion of endowment dollars by category, long-term investment pool balance and performance over time, annualized investment performance, and a snapshot of the number and dollar value of endowments with trustees, investors and other stakeholders via newsletters and reports.
Results: At-a-glance insights allow stakeholders across all levels of the organization to understand quickly how specific objectives are being met.
Excerpted from University of Colorado Foundation’s Spring 2016 newsletter, DashBOARD.
Mini Case Study: Identifying KPIs to Measure

Build a better dashboardThe most effective dashboards report only metrics of supreme relevance to the audience. Depending on specific needs, data may:
• Illustrate current status, trends and performance
• Indicate progress against goals
• Reflect information on a specific time period
• Show key elements within a specific area or organization-wide
• Deliver information by geographic area or by target population
Dashboard formatting should make the information easy to grasp at a glance, displaying data as simple red-green-yellow indicators on a spreadsheet or as more sophisticated infographics.
The following dashboard array shows data sets from across the organization:
Year-to-Date Visitors: Identifies trends in visitors to a cultural institution. Owner: Visitor Services Manager or Front Desk Manager Audience/Stakeholder: Internal Program and Executive Teams, Board of Directors
Fundraising Campaign Status: Tracks progress toward the fundraising goal and motivates advancement staff and volunteers. Owner: Campaign Manager Audience/Stakeholder: Development Staff, Board Members, Donors
Financial Snapshot: Visualizes key balance sheet, statement of activities, endowment performance and audit results. Owner: CFO or CPA Audience/Stakeholder: Internal Finance Team, Board Financial Committee
Risk Management Dashboard: Shows compliance with regulatory and safety requirements. Owner: CFO or Chief Compliance Officer Audience/Stakeholder: Executive Team, Board Members
How NoNprofits CaN Use Data to iNform DeCisioNs aND Drive performaNCe 11
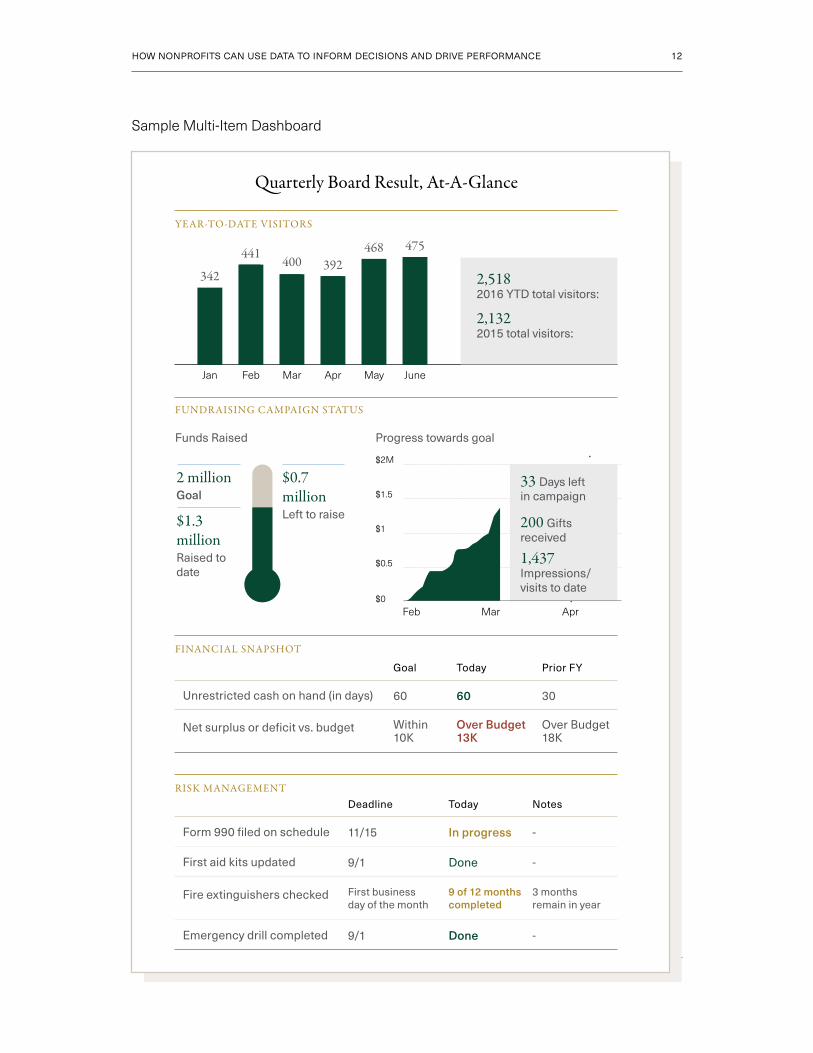
Sample Multi-Item Dashboard
How NoNprofits CaN Use Data to iNform DeCisioNs aND Drive performaNCe 12
Quarterly Board Result, At-A-Glance
Feb
441
Mar
400
Apr
392
May
468
June
475
Jan
342
YEAR-TO-DATE VISITORS
FUNDRAISING CAMPAIGN STATUS
$0
$0.5
$1
$1.5
$2M
Feb Mar Apr
$1.3 millionRaised to date
2 millionGoal
$0.7 millionLeft to raise
33 Days leftin campaign
200 Gifts received
1,437 Impressions/visits to date
Progress towards goalFunds Raised
FINANCIAL SNAPSHOT
RISK MANAGEMENT
Unrestricted cash on hand (in days)
Net surplus or deficit vs. budget
Goal
60
Within10K
Today
60
Over Budget13K
Prior FY
30
Over Budget18K
Form 990 filed on schedule
Fire extinguishers checked
Deadline
11/15
First business day of the month
Today Notes
-
First aid kits updated 9/1 -
Emergency drill completed 9/1 -
2,5182016 YTD total visitors:
2,1322015 total visitors:
3 months remain in year
In progress
9 of 12 months completed
Done
Done

Dashboard items you may not be using Here are some analytics you may not have thought about tracking and reporting on dashboards.
How NoNprofits CaN Use Data to iNform DeCisioNs aND Drive performaNCe 13
1. Fundraising Efficiency:• Shows how much is spent to raise each dollar donated for an event or overall (total
fundraising expenses/total contributions). Useful for reporting to grantors/donors and prospects to illustrate stewardship.
• Owner: Chief Development Officer
• Audience/Stakeholder: Development Staff, Board Members, Donors
FY2016
$1.00
$0.75
$0.50
$0.25
FY2015 FY2014 FY2013 FY2012
2. Board or Volunteer Accountability:• Monitors board attendance and committee activities or volunteer participation.
• Owner: Executive Director or Board Liaison
• Audience/Stakeholder: Board Members
Sue Smith
Bob James
Pat Harris
Board Member Meeting 1
Meeting 2
Meeting 3
Meeting 4
3
4
1
Committee Meeting
(3 of 5 required)

4. Year-over-Year Change in Donors:• Indicates effectiveness of donor retention efforts (or to chart changes in staff,
volunteers or program participants).
• Owner: Chief Development Officer
• Audience/Stakeholder: Development Staff, Board Members, Donors
42%donor retention
58%donor attrition rate
69,000total donors
3%net increase
in donors
83% 17%growth first-time donors growth reactivated donors
3. Program or Service Efficiency:• Illustrates percent or amount of operating versus program expenses. Helpful for
showing stewardship and effectiveness.
• Owner: Chief Program Officer
• Audience/Stakeholder: Internal Program Teams, Grantors, Community Members and Policymakers
How NoNprofits CaN Use Data to iNform DeCisioNs aND Drive performaNCe 14
Total Budget Expenses
Program Expenses
Operating Expenses:Fundraising
Operating Expenses:Administrative
Goal: 75%
Today 65%
Goal: 12%
Today 12%
Goal: 13%
Today 23%
Exceeds Goal
Meets Goal
Missed Goal
65%
12%
23%

Action PlanUp the Data Game

Data-informed organizations blend information, experience and context to answer key
questions, support or refute assumptions, and assess efficacy and progress.
This approach empowers your team to be more responsive and facilitates
improvements and innovations that can lead to success. For example, staff typically use
data to make improvements to programs, services and operations. Board members use
data to make strategic decisions about serving the mission. Donors use data to validate
their decision to support the organization.
Keys for successTo maximize your mission with data:
How NoNprofits CaN Use Data to iNform DeCisioNs aND Drive performaNCe 16
Engage the entire organization.
Help staff, volunteers and board members understand the importance of data collection and reporting with a vision statement showing how the practice supports goals and mission, and how and why participation aligns everyone behind a common purpose.
TIP: llustrate the value by showing them their data, asking them what it reveals and helping them determine how it’s valuable.
Prevent analysis paralysis.
Avoid confusing an emphasis on data with a charge to measure everything, which leads to analysis paralysis and stymies decision-making. Staff may feel compelled to over-invest time and effort in identifying and gathering information, and managers and board members may be overwhelmed by too much information to comprehend and evaluate.
TIP: Start by tracking a few key indicators of value to staff, board and external stakeholders.

How NoNprofits CaN Use Data to iNform DeCisioNs aND Drive performaNCe 17
Eschew vanity metrics.
Resist the temptation to report numbers that look good on the surface but provide little substantive information about progress or performance. Vanity metrics are often seen on marketing dashboards reporting likes, webpage visits or social media followers. These numbers may indicate popularity, but there’s more valuable data to gather, such as:
• Volunteers or event attendees activated via social, paid or earned media
• Participation in online quizzes or assessments
• New members gained from newsletter mailings
Report consistently and correctly.
Share information on a frequency that supports decision-making needs, such as weekly, monthly, quarterly or annually. In some rare cases, daily or real-time data reporting may be required to monitor systems or track usage in some areas of your organization. Make sure the information is communicated in a language and format your audience understands and responds to favorably.
Protect data.
Be sure personal health information (PHI) and personally identifiable information (PII) on dashboards meets privacy and security requirements. The U.S. Health Insurance Portability and Accountability Act and the Health Information Technology for Economic and Clinical Health Act outline technical, administrative and physical data controls required for organizations and their vendors. Additionally, the U.S. Securities and Exchange Commission considers boards responsible for insufficient PHI and PII security.
Review and revise KPIs regularly.
Update dashboard items that may change due to economic conditions, natural disaster or a shift in focus. Drop analytics that are too hard to gather or are less relevant to decision-making.
TIP: Review internal and external dashboards at least annually to ensure they deliver valuable and actionable insights consistently without creating unnecessary drag on staff.

Challenge: Not all metrics were created equal. What steps are needed to create a set of metrics that accurately represent your organization’s goals, values and imperatives?
Solution: The Tenderloin Housing Clinic (THC), which provides supportive housing to the formerly homeless, adopted a CRM solution to generate more meaningful metrics and streamline operations. The system allowed the organization to track operational data and managers and other caseworkers to simultaneously report on multiple client data points, among other benefits.
Results: The increased visibility gave staff and leadership up-to-the-minute information on program enrollments and withdrawals, occupancy, finances, outcomes and impact. These richer data sets enable THC to respond faster to client needs and make informed decisions about program and service efficacy.
Excerpted from the Bigger Boat Consulting blog post, Supportive Housing Case Study: Tenderloin Housing Clinic, by Jenifer Lambert
Mini Case Study: Avoiding Vanity Metrics
How NoNprofits CaN Use Data to iNform DeCisioNs aND Drive performaNCe 18
How NoNprofits CaN Use Data to iNform DeCisioNs aND Drive performaNCe 19
Financial Stewardship:
Staff and board members use financial M&E information to maximize cost-efficiency and –effectiveness. Reporting stewardship data to donors or grant-makers builds trust that fuels additional funding support and referrals to others. Clear financial reporting also builds organizational credibility with the general public, regulators and policymakers.
Programs, Services and Administration:
Data on program and service efficacy and administration/overhead enables your staff and board members to evaluate core activities. Information on outcomes and impact drives decisions about services and programs to continue, re-scope, discontinue or pause. It also reveals internal practices and procedures that need attention.
Benchmarks: Measuring performance against internal or external benchmarks is a helpful way to chart progress. You can even measure your organization against other
nonprofits using resources like the annual M+R Benchmarks Study.
Better reporting with data dashboardsData bolsters fundraising, enhances financial stewardship and program efficiency, and supports benchmarking.
Fundraising:
Tracking and analyzing fundraising data empowers you to prioritize development activities, understand the most cost-effective and successful tactics, discontinue costly initiatives and identify new opportunities.
TIP: Sharing data with donors, prospects and grant-makers validates their support and illustrates the results of their funding. Showing outcomes and impact also inspires subsequent donations and helps secure multi-year, recurring grants and endowments.

Better storytelling with dataDashboards are powerful information sources for mission-related content and communications.
Data-rich written and visual content illustrates progress and impact, operational efficiency and stewardship. Combined with first-person accounts, these stories make your nonprofit more relatable and differentiate it from others. When distributed online or via social media, data-infused content encourages supporters to share with their networks, amplifying messaging and extending reach.
The increased visibility engenders trust and enhances credibility — key factors in converting prospects who support your mission intellectually into donors who support your organization financially.
Use dashboard data to strengthen the influence of marketing, PR and outreach
activities such as:
How NoNprofits CaN Use Data to iNform DeCisioNs aND Drive performaNCe 20
• Advertisements and public service announcements
• Annual reports and donor reports
• Articles for organizational magazines/newsletters
• Blog posts and guest posts
• Calendar of events
• Cases for support
• Fundraising appeals and campaign materials
• IRS Form 990
• Infographics
• Marketing materials
• Opinion essays and commentaries
• Performances and galas
• Podcasts
• Press releases, advisories and pitches
• Reports to grantors and other organizational investors
• Search/social landing pages
• Social media updates
• Speeches and presentations
• Videos
• Volunteer trainings
• Web pages

These five examples show how to use data to tell better stories:
1. Cases for Support and Reports:
Back up anecdotes and explanations with data that adds credibility to claims and contextualizes impact. For example, create a dashboard for each section, highlighting key data points. Include flow charts, bar graphs and other visualizations to assist readers who skim and scan rather than read cover to cover.
Example: The Seattle Aquarium reports valuable data in thematically driven data
illustrations in its 2015 annual report.
2. IRS Form 990 and Audit:
Add a detailed narrative featuring selected data points to showcase outcomes/impact, financial stewardship and administrative efficiency. The added transparency puts the required information in context and lets grantors see the value of their support.
3. Infographics:
Use this form of data-rich visual content to illustrate a problem or showcase outcomes. Frequently shared and amplified on social media, infographics are also useful when reaching out to reporters or designing presentations.
Example: The World Bank uses infographics to frame the scope of issues it confronts, illustrate progress and showcase results, like this set produced for its Doing Business 2015 initiative.
4. Search/Social Landing Pages:
Deploy pop-ups or overlays to greet website visitors coming from social or search links, encourage signups for newsletters or email announcements — and share information on your organization’s reach, impact or programming.
5. Web Pages:
Include relevant data on every web page and in every blog post to add credibility, or create a dedicated page for dashboards and other impact data.
Example: The University of North Carolina at Chapel Hill reports on its sustainability
goals and programs via a dedicated website.
How NoNprofits CaN Use Data to iNform DeCisioNs aND Drive performaNCe 21

How NoNprofits CaN Use Data to iNform DeCisioNs aND Drive performaNCe 22
Challenge: Too many numbers can keep your point from being understood. How can you present data points in a compelling, easy-to-understand visual format?
Solution: The Environmental Defense Fund (EDF) infuses its entire website with relevant data, providing evidence of results on almost every page. The organization also features an entire section exhibiting data that quantifies the impact of its work, presented in categories aligned with its mission.
Results: With a data strategy that tracks and shares relevant data on its website, EDF engages visitors interested in one or many aspects of its work and reinforces a message of overall efficacy.
Excerpted from the Environmental Defense Fund’s website
Mini Case Study: Visualizing Data Effectively

A Model forFuture Success

Nonprofits face a myriad of challenges in today’s operating environment, including a growing need for programs and services, increased competition for resources, heightened scrutiny of stewardship and efficacy, and more. These complex factors raise the bar for performance.
Savvy nonprofit leaders respond with data-driven decision-making. Collecting, analyzing and reporting data fuels robust discussion and rapid resolution, communicates valuable information to stakeholders who matter most and empowers your nonprofit to achieve its ultimate goals.
Leveraging the true value of a data strategy is an ongoing process that benefits from iteration.
Repeat the processes outlined in this e-book to develop and report KPIs on a regular basis to ensure strategies remain viable, data points stay relevant and you reap the
benefits of making data-driven decisions.
How NoNprofits CaN Use Data to iNform DeCisioNs aND Drive performaNCe 24

The information contained in this e-book is provided to you as-is, does not constitute legal advice, is governed by our Terms and Conditions of Use and we are not acting as your attorney. We make no claims, promises or guarantees about the accuracy, completeness, or adequacy of the information contained in or linked to this ebook and its associated sites.
Nonprofit 12/9/16