Embed Size (px)
Citation preview
How Much (More) Should CEOs Make?A Universal Desire for More Equal Pay
The Harvard community has made thisarticle openly available. Please share howthis access benefits you. Your story matters
Citation Kiatpongsan, Sorapop, and Michael I. Norton. "How Much (More)Should CEOs Make? A Universal Desire for More Equal Pay."Perspectives on Psychological Science (forthcoming).
Citable link http://nrs.harvard.edu/urn-3:HUL.InstRepos:13348081
Terms of Use This article was downloaded from Harvard University’s DASHrepository, and is made available under the terms and conditionsapplicable to Open Access Policy Articles, as set forth at http://nrs.harvard.edu/urn-3:HUL.InstRepos:dash.current.terms-of-use#OAP
1
How Much (More) Should CEOs Make?
A Universal Desire for More Equal Pay
Sorapop Kiatpongsan1,2 and Michael I. Norton3
In Press, Perspectives on Psychological Science
1 Faculty of Medicine, Chulalongkorn University, Bangkok, Thailand
2 Sasin Graduate Institute of Business Administration of Chulalongkorn University, Bangkok, Thailand
3 Harvard Business School, Boston, MA, USA
2
Abstract
Do people from different countries and different backgrounds have similar preferences for how
much more the rich should earn than the poor? Using survey data from 40 countries (N =
55,238), we compare respondents’ estimates of the wages of people in different occupations –
chief executive officers, cabinet ministers, and unskilled workers – to their ideals for what those
wages should be. We show that ideal pay gaps between skilled and unskilled workers are
significantly smaller than estimated pay gaps, and that there is consensus across countries,
socioeconomic status, and political beliefs for ideal pay ratios. Moreover, data from 16 countries
reveals that people dramatically underestimate actual pay inequality. In the United States –
where underestimation was particularly pronounced – the actual pay ratio of CEOs to unskilled
workers (354:1) far exceeded the estimated ratio (30:1) which in turn far exceeded the ideal ratio
(7:1). In sum, respondents underestimate actual pay gaps, and their ideal pay gaps are even
further from reality than those underestimates.
Keywords
inequality, fairness, justice, income, wage, cross-cultural
3
Across 26 developed countries, the average minimum wage increased by just 0.7% in
2010 and actually decreased by 0.6% in 2011 (ILO, 2013), in sharp contrast to the steady rise in
compensation for executives (Morgenson, 2013). Indeed, the ratio of the pay of an average chief
executive officer (CEO) to an average employee in the United States increased from 20:1 in
1965 to 354: 1 in 2012 (AFL-CIO, 2013; Hargreaves, 2014; Mishel & Sabadish, 2013), ignoring
the advice of management guru Peter Drucker, who suggested that exceeding a 20:1 ratio would
increase employee resentment and decrease morale (McGregor, 2013). Not surprisingly, 2013
saw worker protests and strikes in cities such as New York, Chicago, Detroit and Seattle
demanding an increase in the minimum wage (Greenhouse, 2013); one survey in 2013 revealed
that 76% of Americans favored raising the federal minimum wage to $9.00 (Dugan, 2013).
Partly in response, President Obama increased the minimum wage for federal contractors from
$7.25 to $10.10 in early 2014 (Wolfgang, 2014). At the other end of the pay scale, public support
for initiatives to cap CEO pay has also increased in recent years (Beardsley, 2013; Burak, 2013;
McGregor, 2013).
Desires for increases in the minimum wage and caps to executive pay offer some indirect
evidence that at least some people wish for smaller pay gaps, but what size gaps do people
desire? People have a general aversion to outcomes that surpass some threshold of fairness (Fehr
& Schmidt, 1999) and recent research suggests that both Americans and Australians desire a
more equal distribution of wealth (Norton & Ariely, 2011; Norton, Neal, Govan, Ariely, &
Holland, in press) but little is known about people’s preferences for the distribution of wages,
and whether those preferences are universally held across people from different countries and
backgrounds. Income differs from wealth in that wages or earnings are direct compensation for
an individual’s labor and productivity whereas wealth reflects both earnings and accumulated
4
wealth (e.g., through investments and inheritance). Understanding people’s ideal distributions of
wealth can inform policies related to wealth regulation such as property and inheritance taxes;
understanding people’s ideal pay ratios – and assessing whether these ideal ratios are commonly-
held – can inform policies regarding wage regulation, progressive taxation of income, and other
interventions that might affect pay gaps.
Using survey data from 40 countries, we compare people’s perceptions (i.e., estimates) of
the current wage disparities among people in different occupations to their preferences (i.e.,
ideals) for what they feel these gaps in pay should be. These occupations were a chairman of a
large national corporation (CEO), a cabinet minister, and an unskilled worker. Data were
retrieved from the latest International Social Survey Programme (ISSP) published in December
2012 (ISSP Social Inequality IV conducted in 2009). Respondents from 40 countries (N =
55,238, Mage = 46.8, SD = 15.8; 54.7% female) completed the survey (see Table 1 for complete
list).
The ISSP working principles require that the sample from each member country is a
nationally representative random sample of the adult population, designed to achieve a norm of
1,400 cases (with a minimum of 1,000 cases) for each member country. More information about
the ISSP and ISSP Social Inequality IV can be found at the ISSP website (ISSP, 2009). The
statistical software package SPSS 21.0 (SPSS Inc., Chicago, IL) was used for all data analyses.
Statistical significance was determined at p < .05.
People Want Smaller Pay Gaps
Respondents were asked to estimate how much a chairman of a large national company
(CEO), a cabinet minister in the national government, and an unskilled factory worker actually
5
earn (“estimated pay”). Then, they reported how much these people should earn (“ideal pay”).
These responses were open-ended: respondents stated the income that they believed members of
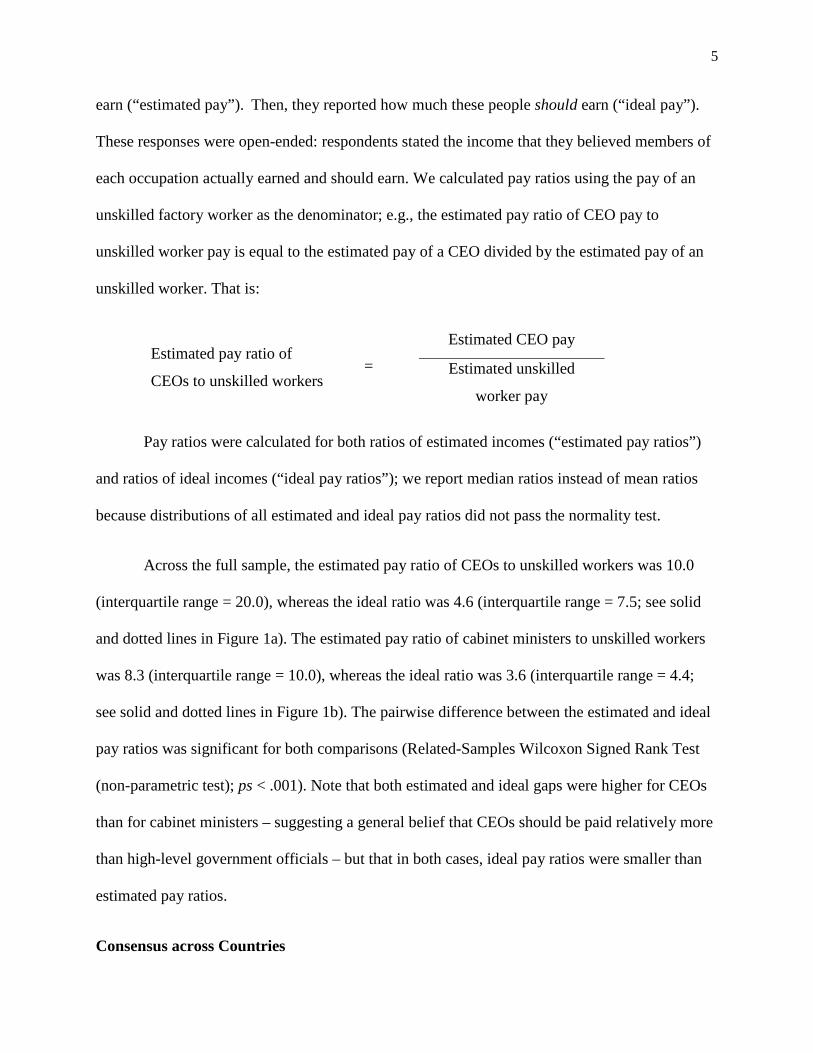
each occupation actually earned and should earn. We calculated pay ratios using the pay of an
unskilled factory worker as the denominator; e.g., the estimated pay ratio of CEO pay to
unskilled worker pay is equal to the estimated pay of a CEO divided by the estimated pay of an
unskilled worker. That is:
Estimated pay ratio of
CEOs to unskilled workers
=
Estimated CEO pay
Estimated unskilled
worker pay
Pay ratios were calculated for both ratios of estimated incomes (“estimated pay ratios”)
and ratios of ideal incomes (“ideal pay ratios”); we report median ratios instead of mean ratios
because distributions of all estimated and ideal pay ratios did not pass the normality test.
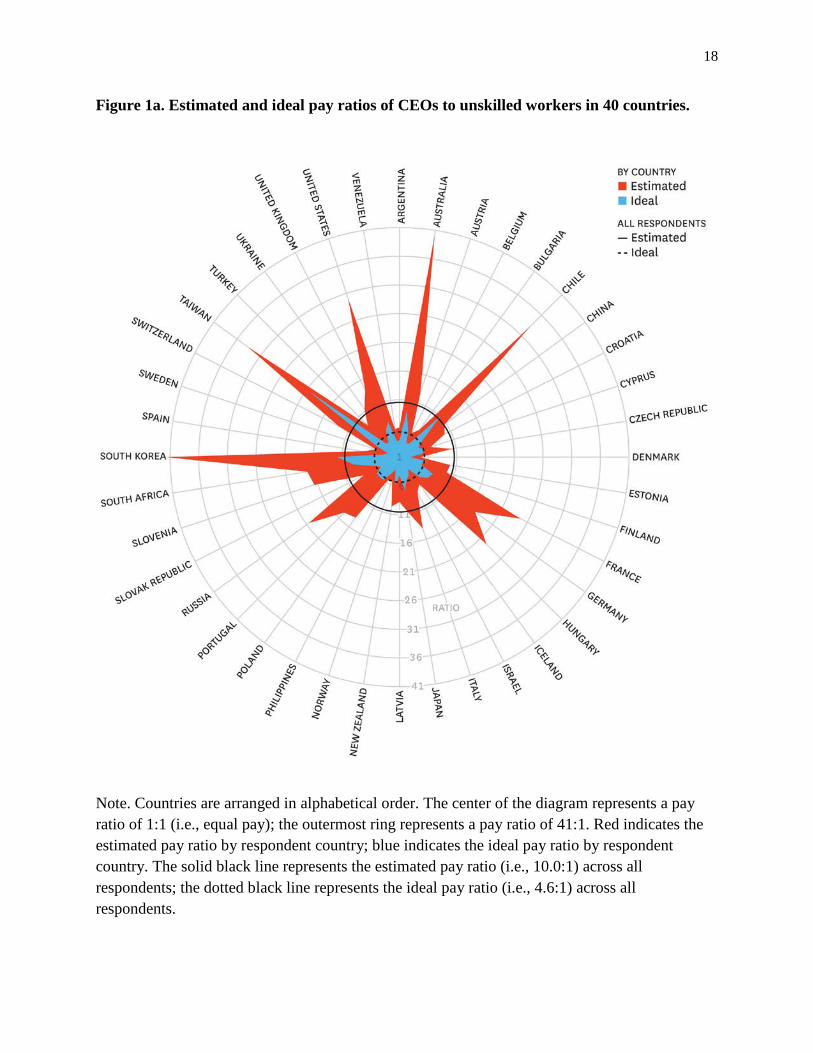
Across the full sample, the estimated pay ratio of CEOs to unskilled workers was 10.0
(interquartile range = 20.0), whereas the ideal ratio was 4.6 (interquartile range = 7.5; see solid
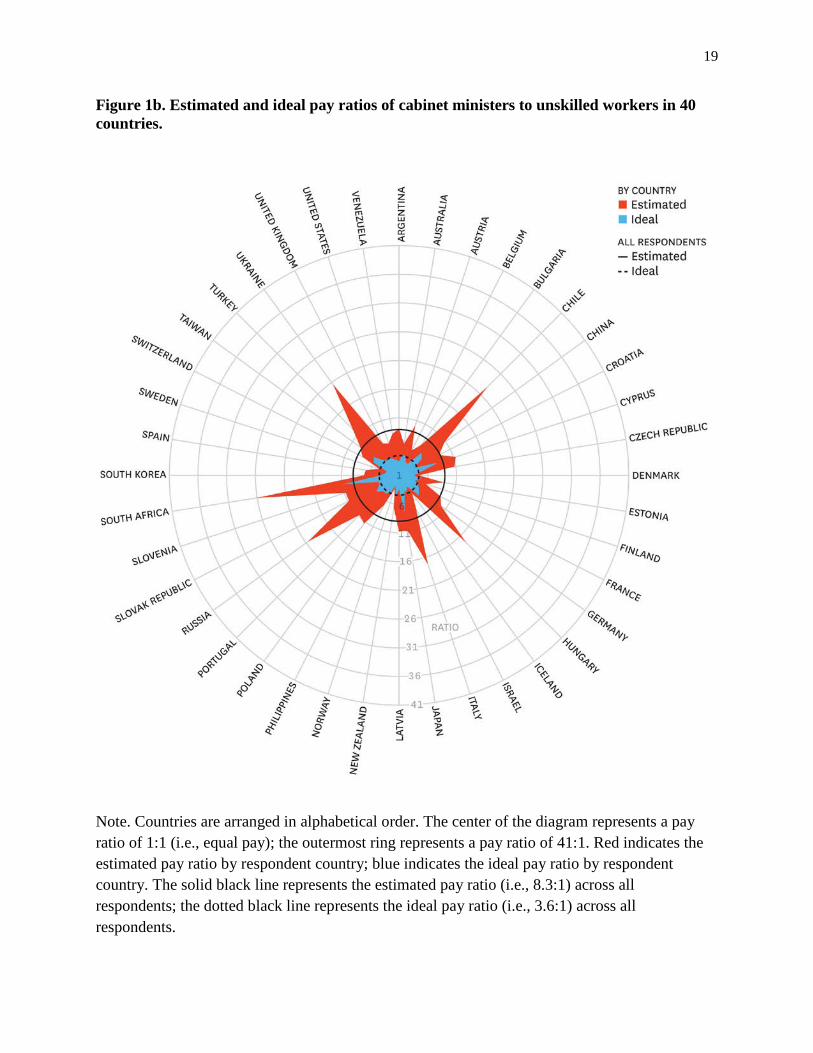
and dotted lines in Figure 1a). The estimated pay ratio of cabinet ministers to unskilled workers
was 8.3 (interquartile range = 10.0), whereas the ideal ratio was 3.6 (interquartile range = 4.4;
see solid and dotted lines in Figure 1b). The pairwise difference between the estimated and ideal
pay ratios was significant for both comparisons (Related-Samples Wilcoxon Signed Rank Test
(non-parametric test); ps < .001). Note that both estimated and ideal gaps were higher for CEOs
than for cabinet ministers – suggesting a general belief that CEOs should be paid relatively more
than high-level government officials – but that in both cases, ideal pay ratios were smaller than
estimated pay ratios.
Consensus across Countries
6
Estimated pay ratios of CEOs to unskilled workers ranged from 3.7 (in Denmark) to 41.7
(in South Korea), whereas ideal ratios ranged from 2.0 (in Denmark) to 20.0 (in Taiwan). The
pairwise differences between the estimated and ideal pay ratios of CEOs to unskilled workers
were significant in all 40 countries (Related-Samples Wilcoxon Signed Rank Test (non-
parametric test); ps < .001; Figure 1a).
How do respondents’ estimated and ideal pay ratios compare to actual current pay ratios?
In the United States in 2012, for example, the average yearly compensation for CEOs of S&P
500 companies was $12.3 million, about 354 times the pay for an average worker of $35,000
(AFL-CIO, 2013; Hargreaves, 2014). American respondents (n = 1,581) in our data estimated the
ratio of estimated incomes of CEOs to unskilled workers to be 29.6, demonstrating that
Americans drastically underestimated the gap in actual incomes between CEOs and unskilled
workers.
We compared the estimated pay ratio of CEOs to unskilled workers with the actual pay
ratio for the 16 countries where data on the pay of CEOs and the pay of average workers are
available (AFL-CIO, 2013; see Table 1 for complete list). In all 16 countries, the estimated pay
ratio of CEOs to unskilled workers was significantly lower than the actual ratio (One-Sample
Wilcoxon Signed Rank Test (non-parametric test); ps < .001; Figure 2). Note that Figure 2
includes the estimated and ideal data from Figure 1a, but both are so much smaller than actual
pay ratios that they are nearly invisible.
Again by way of comparison, estimated pay ratios of cabinet ministers to unskilled
workers ranged from 2.5 (in Norway) to 25.7 (in South Africa), whereas ideal ratios ranged from
2.0 (in Norway) to 10.0 (in South Africa). The pairwise differences between the estimated and
7
ideal pay ratios of cabinet ministers to unskilled workers were significant in all countries
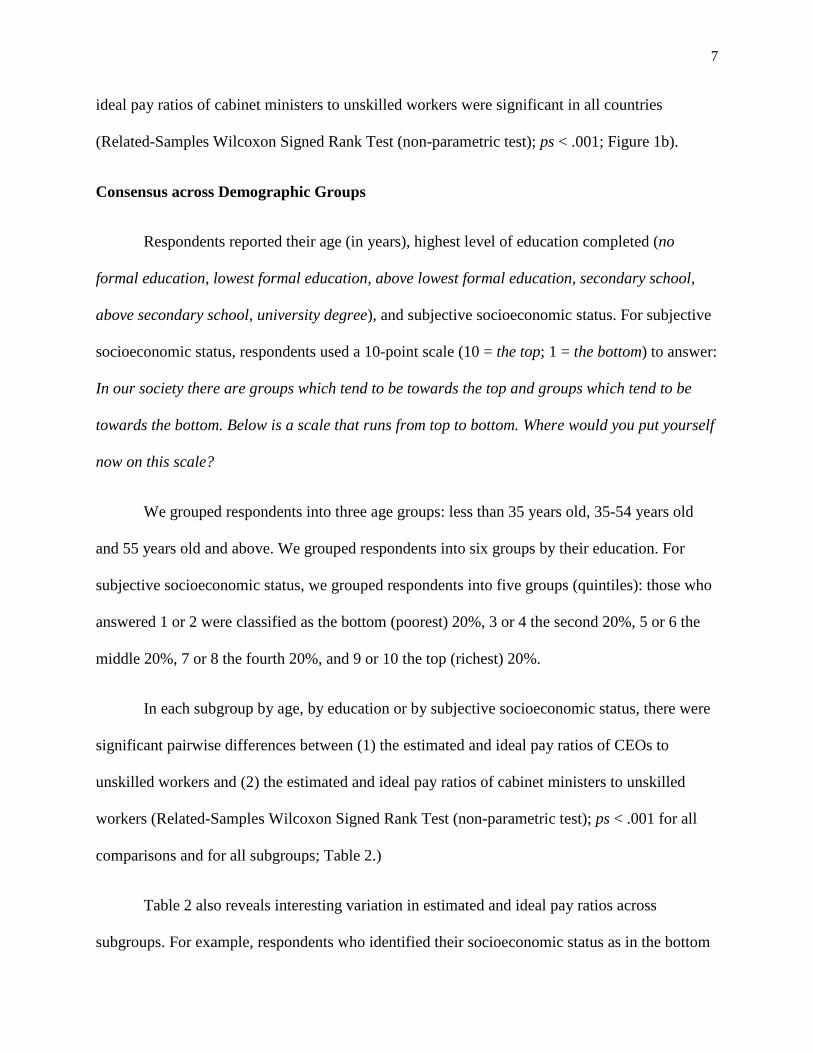
(Related-Samples Wilcoxon Signed Rank Test (non-parametric test); ps < .001; Figure 1b).
Consensus across Demographic Groups
Respondents reported their age (in years), highest level of education completed (no
formal education, lowest formal education, above lowest formal education, secondary school,
above secondary school, university degree), and subjective socioeconomic status. For subjective
socioeconomic status, respondents used a 10-point scale (10 = the top; 1 = the bottom) to answer:
In our society there are groups which tend to be towards the top and groups which tend to be
towards the bottom. Below is a scale that runs from top to bottom. Where would you put yourself
now on this scale?
We grouped respondents into three age groups: less than 35 years old, 35-54 years old
and 55 years old and above. We grouped respondents into six groups by their education. For
subjective socioeconomic status, we grouped respondents into five groups (quintiles): those who
answered 1 or 2 were classified as the bottom (poorest) 20%, 3 or 4 the second 20%, 5 or 6 the
middle 20%, 7 or 8 the fourth 20%, and 9 or 10 the top (richest) 20%.
In each subgroup by age, by education or by subjective socioeconomic status, there were
significant pairwise differences between (1) the estimated and ideal pay ratios of CEOs to
unskilled workers and (2) the estimated and ideal pay ratios of cabinet ministers to unskilled
workers (Related-Samples Wilcoxon Signed Rank Test (non-parametric test); ps < .001 for all
comparisons and for all subgroups; Table 2.)
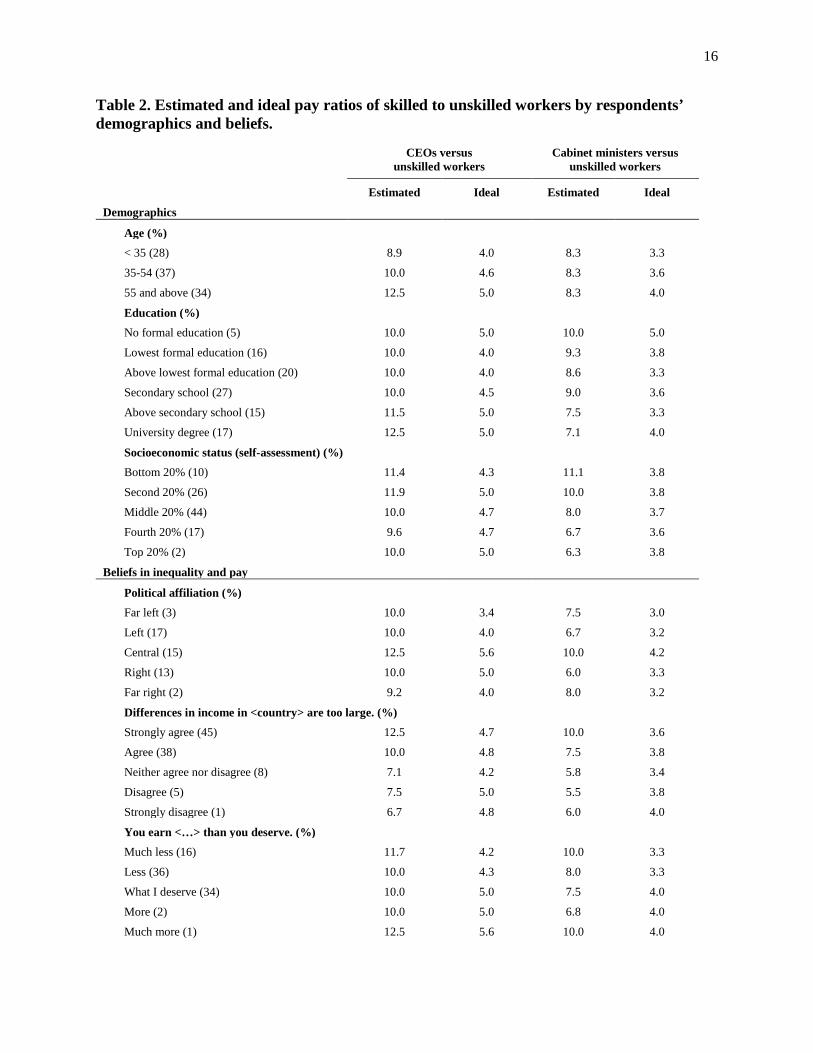
Table 2 also reveals interesting variation in estimated and ideal pay ratios across
subgroups. For example, respondents who identified their socioeconomic status as in the bottom
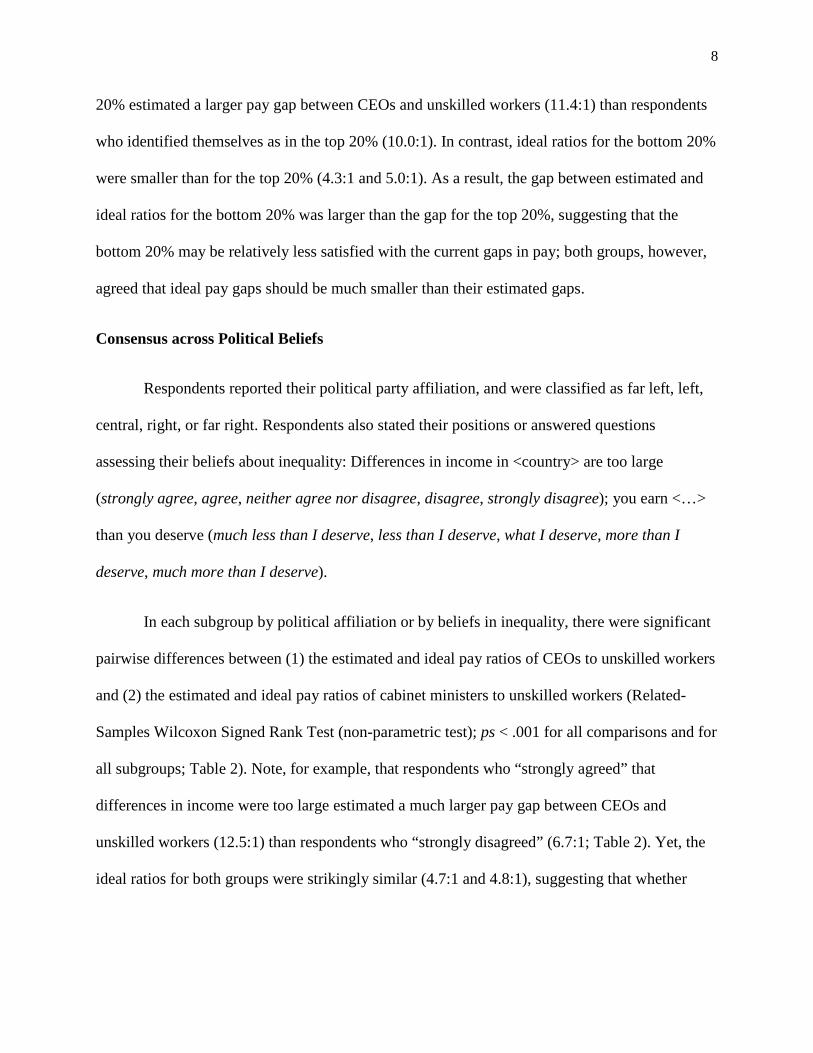
8
20% estimated a larger pay gap between CEOs and unskilled workers (11.4:1) than respondents
who identified themselves as in the top 20% (10.0:1). In contrast, ideal ratios for the bottom 20%
were smaller than for the top 20% (4.3:1 and 5.0:1). As a result, the gap between estimated and
ideal ratios for the bottom 20% was larger than the gap for the top 20%, suggesting that the
bottom 20% may be relatively less satisfied with the current gaps in pay; both groups, however,
agreed that ideal pay gaps should be much smaller than their estimated gaps.
Consensus across Political Beliefs
Respondents reported their political party affiliation, and were classified as far left, left,
central, right, or far right. Respondents also stated their positions or answered questions
assessing their beliefs about inequality: Differences in income in <country> are too large
(strongly agree, agree, neither agree nor disagree, disagree, strongly disagree); you earn <…>
than you deserve (much less than I deserve, less than I deserve, what I deserve, more than I
deserve, much more than I deserve).
In each subgroup by political affiliation or by beliefs in inequality, there were significant
pairwise differences between (1) the estimated and ideal pay ratios of CEOs to unskilled workers
and (2) the estimated and ideal pay ratios of cabinet ministers to unskilled workers (Related-
Samples Wilcoxon Signed Rank Test (non-parametric test); ps < .001 for all comparisons and for
all subgroups; Table 2). Note, for example, that respondents who “strongly agreed” that
differences in income were too large estimated a much larger pay gap between CEOs and
unskilled workers (12.5:1) than respondents who “strongly disagreed” (6.7:1; Table 2). Yet, the
ideal ratios for both groups were strikingly similar (4.7:1 and 4.8:1), suggesting that whether
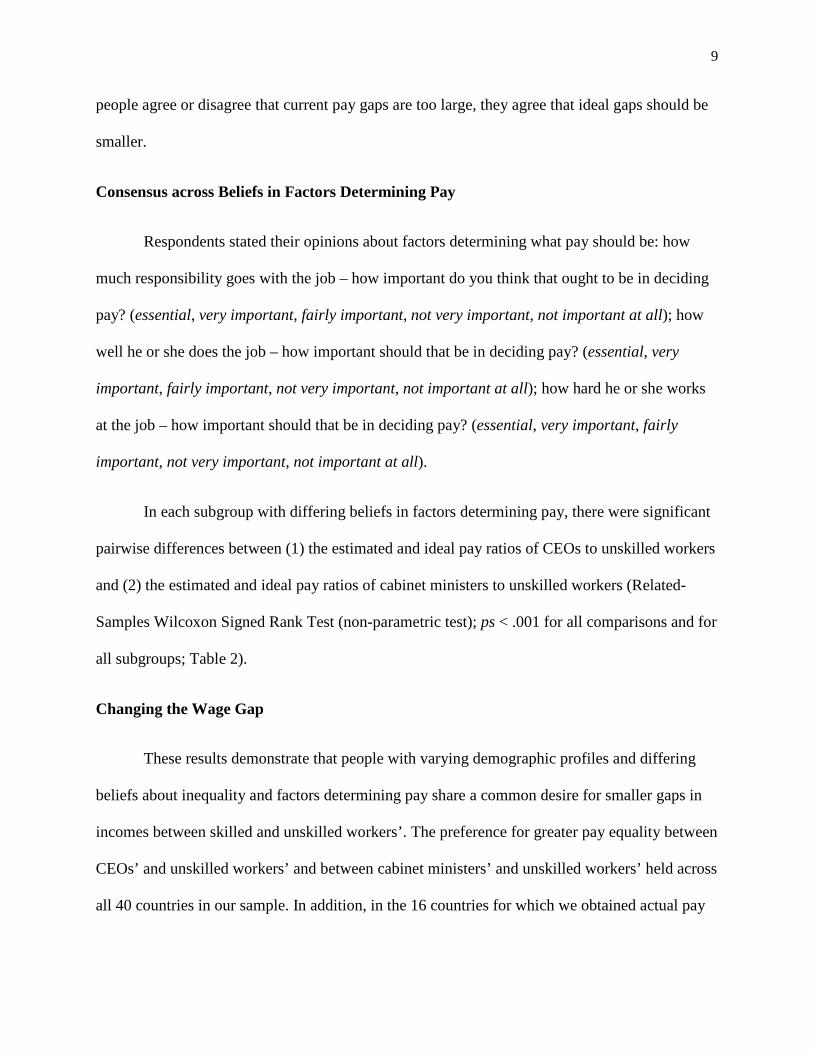
9
people agree or disagree that current pay gaps are too large, they agree that ideal gaps should be
smaller.
Consensus across Beliefs in Factors Determining Pay
Respondents stated their opinions about factors determining what pay should be: how
much responsibility goes with the job – how important do you think that ought to be in deciding
pay? (essential, very important, fairly important, not very important, not important at all); how
well he or she does the job – how important should that be in deciding pay? (essential, very
important, fairly important, not very important, not important at all); how hard he or she works
at the job – how important should that be in deciding pay? (essential, very important, fairly
important, not very important, not important at all).
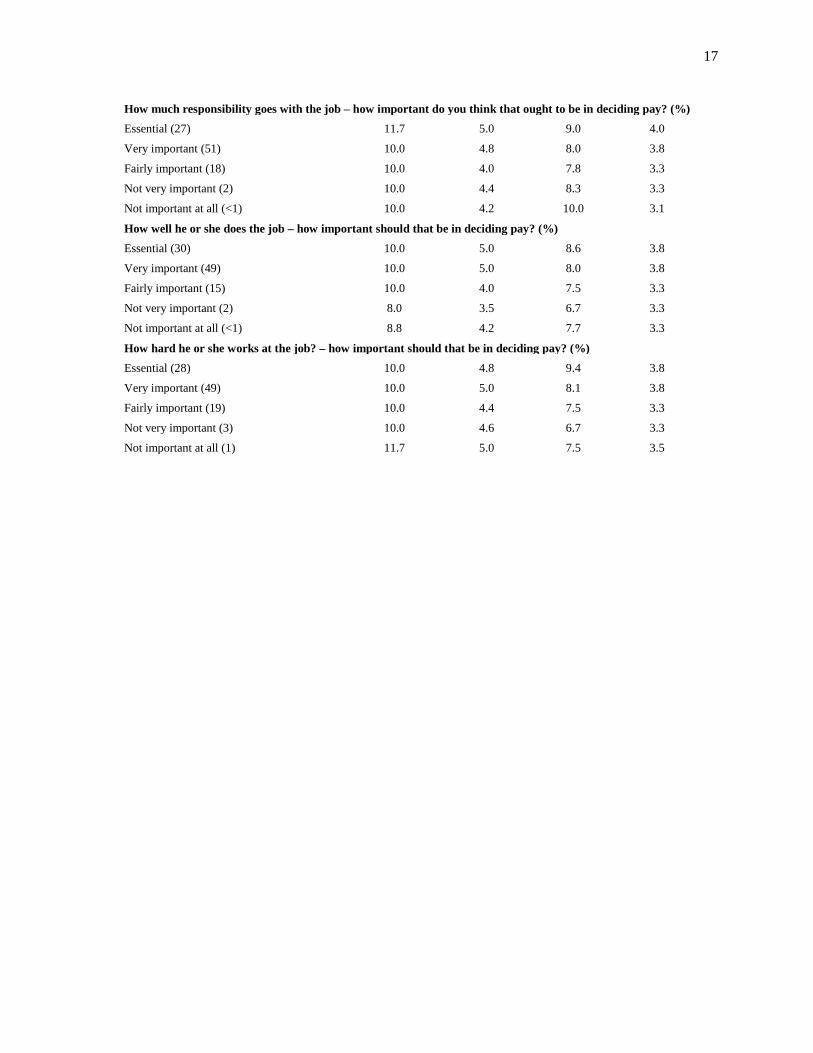
In each subgroup with differing beliefs in factors determining pay, there were significant
pairwise differences between (1) the estimated and ideal pay ratios of CEOs to unskilled workers
and (2) the estimated and ideal pay ratios of cabinet ministers to unskilled workers (Related-
Samples Wilcoxon Signed Rank Test (non-parametric test); ps < .001 for all comparisons and for
all subgroups; Table 2).
Changing the Wage Gap
These results demonstrate that people with varying demographic profiles and differing
beliefs about inequality and factors determining pay share a common desire for smaller gaps in
incomes between skilled and unskilled workers’. The preference for greater pay equality between
CEOs’ and unskilled workers’ and between cabinet ministers’ and unskilled workers’ held across
all 40 countries in our sample. In addition, in the 16 countries for which we obtained actual pay
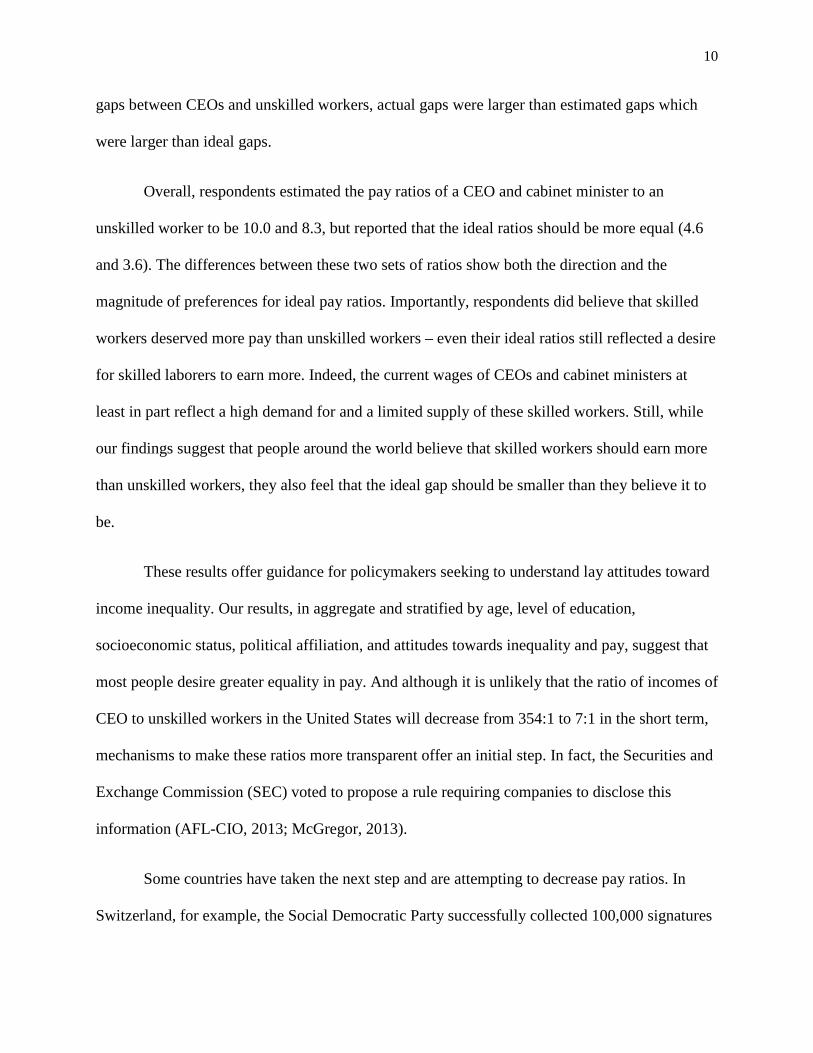
10
gaps between CEOs and unskilled workers, actual gaps were larger than estimated gaps which
were larger than ideal gaps.
Overall, respondents estimated the pay ratios of a CEO and cabinet minister to an
unskilled worker to be 10.0 and 8.3, but reported that the ideal ratios should be more equal (4.6
and 3.6). The differences between these two sets of ratios show both the direction and the
magnitude of preferences for ideal pay ratios. Importantly, respondents did believe that skilled
workers deserved more pay than unskilled workers – even their ideal ratios still reflected a desire
for skilled laborers to earn more. Indeed, the current wages of CEOs and cabinet ministers at
least in part reflect a high demand for and a limited supply of these skilled workers. Still, while
our findings suggest that people around the world believe that skilled workers should earn more
than unskilled workers, they also feel that the ideal gap should be smaller than they believe it to
be.
These results offer guidance for policymakers seeking to understand lay attitudes toward
income inequality. Our results, in aggregate and stratified by age, level of education,
socioeconomic status, political affiliation, and attitudes towards inequality and pay, suggest that
most people desire greater equality in pay. And although it is unlikely that the ratio of incomes of
CEO to unskilled workers in the United States will decrease from 354:1 to 7:1 in the short term,
mechanisms to make these ratios more transparent offer an initial step. In fact, the Securities and
Exchange Commission (SEC) voted to propose a rule requiring companies to disclose this
information (AFL-CIO, 2013; McGregor, 2013).
Some countries have taken the next step and are attempting to decrease pay ratios. In
Switzerland, for example, the Social Democratic Party successfully collected 100,000 signatures
11
and proposed a cap of the pay ratio of CEOs to the lowest paid workers at 12 (Beardsley, 2013).
Indeed, a national survey of Americans showed that 61% supported this type of cap on CEO
compensation (Burak, 2013). We note that such caps can come with risks: in the United States,
Ben & Jerry's implemented a 5 to 1 ratio for 16 years, but were forced to abandon the policy in
1995 when they were unable to find an executive willing to accept the cap (Weiss, 2013).
Conclusion
These results demonstrate a strikingly consistent belief that the gaps in incomes between
skilled and unskilled workers should be smaller than people believe them to be – and much
smaller than these gaps actually are. The consensus that income gaps between skilled and
unskilled workers should be smaller holds in all subgroups of respondents regardless of their age,
education, socioeconomic status, political affiliation and opinions on inequality and pay. As a
result, they suggest that – in contrast to a belief that only the poor and members of left-wing
political parties desire greater income equality – people all over the world, and from all walks of
life, would prefer smaller pay gaps between the rich and poor.

12
Declaration of Conflicting Interests
The authors declared that they had no conflicts of interest with respect to their authorship or the
publication of this article.
13
References
AFL-CIO. (2013). CEO-to-Worker Pay Ratios Around the World. Retrieved March 31, 2014,
from http://www.aflcio.org/Corporate-Watch/CEO-Pay-and-You/CEO-to-Worker-Pay-
Gap-in-the-United-States/Pay-Gaps-in-the-World#_ftn1
Beardsley, E. (2013). As Inequality Grows, Swiss To Vote On Curbing Executive Pay.
Retrieved January 30, 2014, from
http://www.npr.org/blogs/parallels/2013/11/22/246678622/swiss-inequality-is-growing-
would-curbing-exec-pay-matter
Burak, E. (2013). The social maximum: American attitudes toward extremely high incomes.
Research in Social Stratification and Mobility, 31, 18.
Dugan, A. (2013). Most Americans for Raising Minimum Wage. Retrieved February 24, 2014,
from http://www.gallup.com/poll/165794/americans-raising-minimum-wage.aspx
Fehr, E., & Schmidt, K. (1999). A theory of fairness, competition, and cooperation. Quarterly
Journal of Economics, 114(3), 52.
Greenhouse, S. (2013). Fighting Back Against Wretched Wages, New York Times. Retrieved
July 31, 2013. from http://www.nytimes.com/2013/07/28/sunday-review/fighting-back-
against-wretched-wages.html?hp&pagewanted=all&_r=0
Hargreaves, D. (2014). Can We Close the Pay Gap? Retrieved March 31, 2014, from
http://opinionator.blogs.nytimes.com/2014/03/29/can-we-close-the-pay-
gap/?_php=true&_type=blogs&hp&rref=opinion&_r=0
ILO. (2013). Global Wage Report 2012/13: International Labour Organization.
ISSP. (2009). ISSP 2009 Social Inequality IV. Retrieved March 1, 2013, from
http://www.gesis.org/en/issp/issp-modules-profiles/social-inequality/2009/
14
McGregor, J. (2013). What’s the right ratio for CEO-to-worker pay? Retrieved March 2014,
2014, from http://www.washingtonpost.com/blogs/on-leadership/wp/2013/09/19/whats-
the-right-ratio-for-ceo-to-worker-pay/
Mishel, L., & Sabadish, N. (2013). CEO Pay in 2012 Was Extraordinarily High Relative to
Typical Workers and Other High Earners: Economic Policy Institute.
Morgenson, G. (2013, June 29). An Unstoppable Climb in C.E.O. Pay, New York Times.
Retrieved from http://www.nytimes.com/2013/06/30/business/an-unstoppable-climb-in-
ceo-pay.html?pagewanted=all&_r=0
Norton, M. I., & Ariely, D. (2011). Building a Better America−−One Wealth Quintile at a Time.
Perspectives on Psychological Science, 6(1), 9-12.
Norton, M. I., Neal, D. T., Govan, C. L., Ariely, D., & Holland, E. (in press). The not-so-
common- wealth of Australia: Evidence for a cross-cultural desire for a more equal
distribution of wealth. Analyses of Social Issues and Public Policy.
Weiss, M. (2013). A Sweet Solution to the Sticky Wage Disparity Problem. Retrieved 2014,
March 27, from http://abcnews.go.com/Business/companies-follow-ben-jerrys-lead-
wages/story?id=19920634
Wolfgang, B. (2014). Because he says so: Acting alone, Obama boosts minimum wage for
contractors. Retrieved April 24, 2014, from
http://www.washingtontimes.com/news/2014/feb/12/obama-raise-minimum-wage-1010-
hour-federal-contrac/?page=all
15
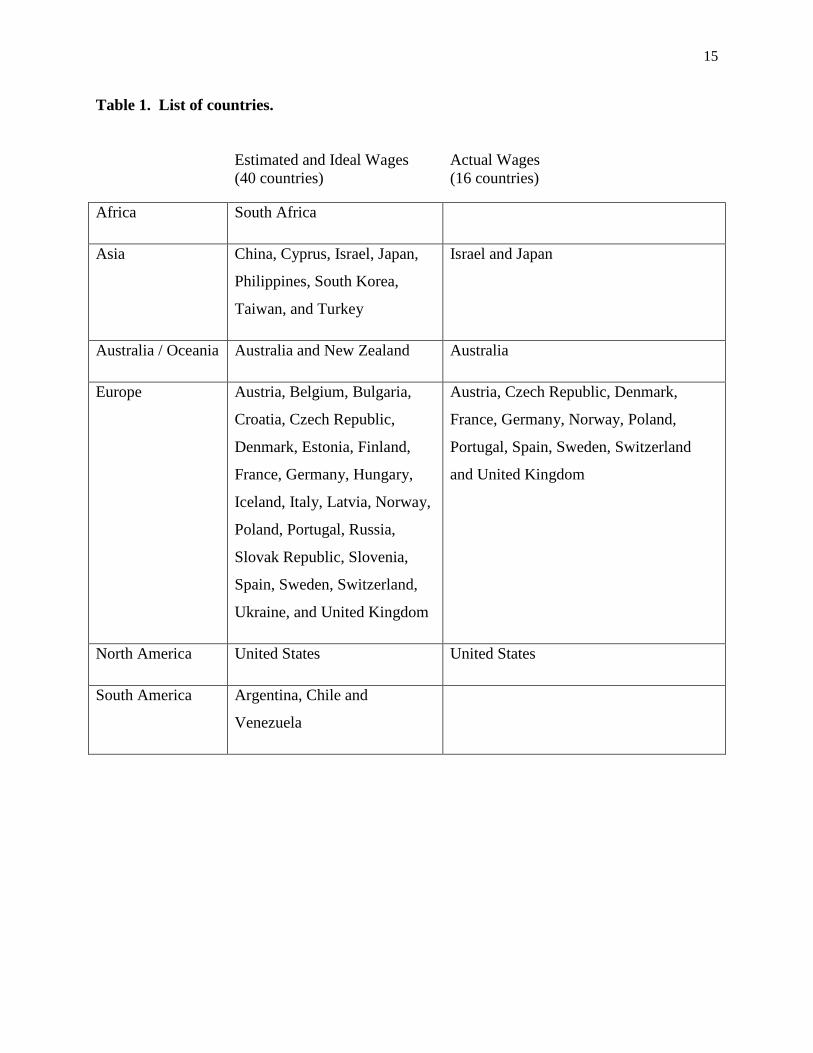
Table 1. List of countries.
Estimated and Ideal Wages (40 countries)
Actual Wages (16 countries)
Africa South Africa
Asia China, Cyprus, Israel, Japan,
Philippines, South Korea,
Taiwan, and Turkey
Israel and Japan
Australia / Oceania Australia and New Zealand Australia
Europe Austria, Belgium, Bulgaria,
Croatia, Czech Republic,
Denmark, Estonia, Finland,
France, Germany, Hungary,
Iceland, Italy, Latvia, Norway,
Poland, Portugal, Russia,
Slovak Republic, Slovenia,
Spain, Sweden, Switzerland,
Ukraine, and United Kingdom
Austria, Czech Republic, Denmark,
France, Germany, Norway, Poland,
Portugal, Spain, Sweden, Switzerland
and United Kingdom
North America United States United States
South America Argentina, Chile and
Venezuela
16
Table 2. Estimated and ideal pay ratios of skilled to unskilled workers by respondents’ demographics and beliefs.
CEOs versus unskilled workers
Cabinet ministers versus unskilled workers
Estimated Ideal Estimated Ideal
Demographics Age (%)
< 35 (28) 8.9 4.0 8.3 3.3
35-54 (37) 10.0 4.6 8.3 3.6
55 and above (34) 12.5 5.0 8.3 4.0
Education (%)
No formal education (5) 10.0 5.0 10.0 5.0
Lowest formal education (16) 10.0 4.0 9.3 3.8
Above lowest formal education (20) 10.0 4.0 8.6 3.3
Secondary school (27) 10.0 4.5 9.0 3.6
Above secondary school (15) 11.5 5.0 7.5 3.3
University degree (17) 12.5 5.0 7.1 4.0
Socioeconomic status (self-assessment) (%)
Bottom 20% (10) 11.4 4.3 11.1 3.8
Second 20% (26) 11.9 5.0 10.0 3.8
Middle 20% (44) 10.0 4.7 8.0 3.7
Fourth 20% (17) 9.6 4.7 6.7 3.6
Top 20% (2) 10.0 5.0 6.3 3.8
Beliefs in inequality and pay Political affiliation (%)
Far left (3) 10.0 3.4 7.5 3.0
Left (17) 10.0 4.0 6.7 3.2
Central (15) 12.5 5.6 10.0 4.2
Right (13) 10.0 5.0 6.0 3.3
Far right (2) 9.2 4.0 8.0 3.2
Differences in income in <country> are too large. (%)
Strongly agree (45) 12.5 4.7 10.0 3.6
Agree (38) 10.0 4.8 7.5 3.8
Neither agree nor disagree (8) 7.1 4.2 5.8 3.4
Disagree (5) 7.5 5.0 5.5 3.8
Strongly disagree (1) 6.7 4.8 6.0 4.0
You earn <…> than you deserve. (%)
Much less (16) 11.7 4.2 10.0 3.3
Less (36) 10.0 4.3 8.0 3.3
What I deserve (34) 10.0 5.0 7.5 4.0
More (2) 10.0 5.0 6.8 4.0
Much more (1) 12.5 5.6 10.0 4.0
17
How much responsibility goes with the job – how important do you think that ought to be in deciding pay? (%)
Essential (27) 11.7 5.0 9.0 4.0
Very important (51) 10.0 4.8 8.0 3.8
Fairly important (18) 10.0 4.0 7.8 3.3
Not very important (2) 10.0 4.4 8.3 3.3
Not important at all (<1) 10.0 4.2 10.0 3.1
How well he or she does the job – how important should that be in deciding pay? (%)
Essential (30) 10.0 5.0 8.6 3.8
Very important (49) 10.0 5.0 8.0 3.8
Fairly important (15) 10.0 4.0 7.5 3.3
Not very important (2) 8.0 3.5 6.7 3.3
Not important at all (<1) 8.8 4.2 7.7 3.3
How hard he or she works at the job? – how important should that be in deciding pay? (%)
Essential (28) 10.0 4.8 9.4 3.8
Very important (49) 10.0 5.0 8.1 3.8
Fairly important (19) 10.0 4.4 7.5 3.3
Not very important (3) 10.0 4.6 6.7 3.3
Not important at all (1) 11.7 5.0 7.5 3.5
18
Figure 1a. Estimated and ideal pay ratios of CEOs to unskilled workers in 40 countries.
Note. Countries are arranged in alphabetical order. The center of the diagram represents a pay ratio of 1:1 (i.e., equal pay); the outermost ring represents a pay ratio of 41:1. Red indicates the estimated pay ratio by respondent country; blue indicates the ideal pay ratio by respondent country. The solid black line represents the estimated pay ratio (i.e., 10.0:1) across all respondents; the dotted black line represents the ideal pay ratio (i.e., 4.6:1) across all respondents.
19
Figure 1b. Estimated and ideal pay ratios of cabinet ministers to unskilled workers in 40 countries.
Note. Countries are arranged in alphabetical order. The center of the diagram represents a pay ratio of 1:1 (i.e., equal pay); the outermost ring represents a pay ratio of 41:1. Red indicates the estimated pay ratio by respondent country; blue indicates the ideal pay ratio by respondent country. The solid black line represents the estimated pay ratio (i.e., 8.3:1) across all respondents; the dotted black line represents the ideal pay ratio (i.e., 3.6:1) across all respondents.
20
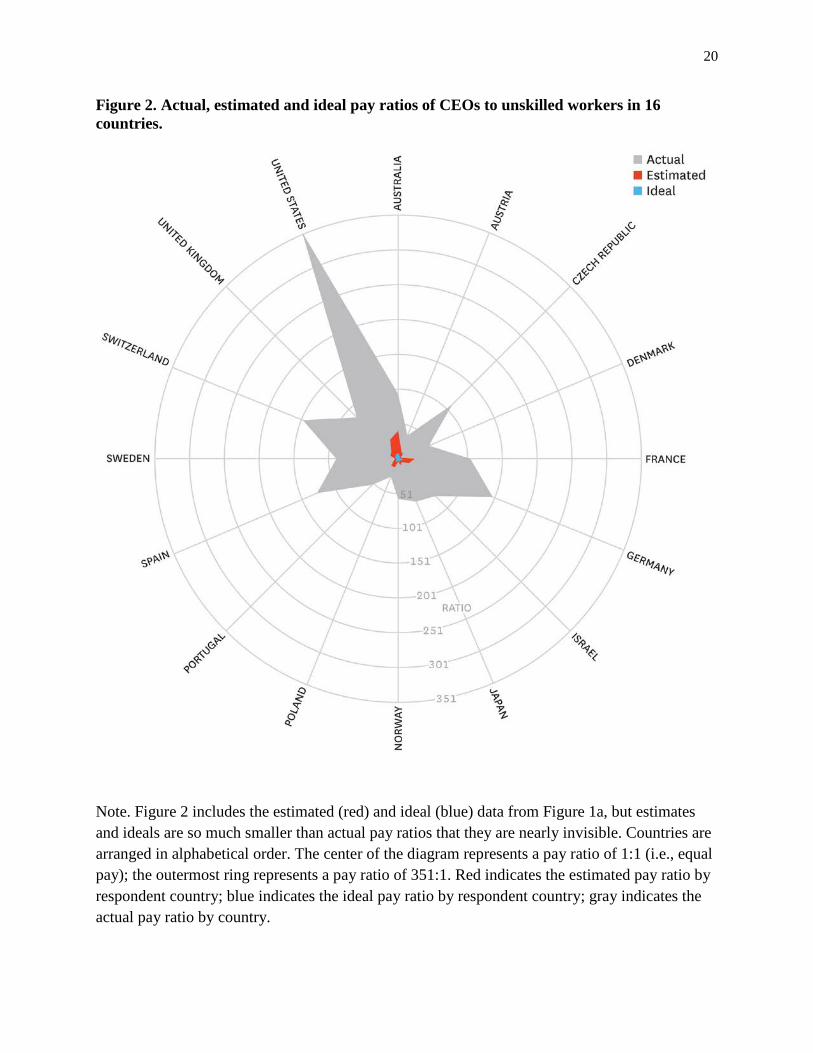
Figure 2. Actual, estimated and ideal pay ratios of CEOs to unskilled workers in 16 countries.
Note. Figure 2 includes the estimated (red) and ideal (blue) data from Figure 1a, but estimates and ideals are so much smaller than actual pay ratios that they are nearly invisible. Countries are arranged in alphabetical order. The center of the diagram represents a pay ratio of 1:1 (i.e., equal pay); the outermost ring represents a pay ratio of 351:1. Red indicates the estimated pay ratio by respondent country; blue indicates the ideal pay ratio by respondent country; gray indicates the actual pay ratio by country.