Embed Size (px)
Citation preview
Running head: BAYESIAN REANALYSIS OF VIOLENT MEDIA 1
How Much Evidence Is p > .05? Stimulus Pre-Testing and Null Primary Outcomes in Violent
Video Games Research
Joseph Hilgard, Christopher R. Engelhardt, Bruce D. Bartholow, and Jeffrey N. Rouder
University of Missouri - Columbia
Author Note
Joseph Hilgard, Annenberg Public Policy Center, University of Pennsylvania, and
Department of Psychological Sciences, University of Missouri; Christopher R. Engelhardt,
Department of Health Psychology, University of Missouri, and Thompson Center for Autism and
Neurodevelopmental Disorders; Bruce D. Bartholow, Department of Psychological Sciences,
University of Missouri; Jeffrey N. Rouder, Department of Psychological Sciences, University of
Missouri.
This work is supported in part by the Bond Life Sciences Fellowship awarded to Joseph
Hilgard and by the National Science Foundation grants BCS-1240359 and SES-102408 to
Jeffrey Rouder.
We thank Andrew Przybylski and Dirk Mügge for providing critiques of an early
version of this manuscript. We thank Christopher Ferguson, Eric-Jan Wagenmakers, and an
unnamed reviewer for peer reviews.
Correspondence concerning this article should be addressed to Joseph Hilgard,
Annenberg Public Policy Center, University of Pennsylvania, PA, 19104.
E-mail: [email protected]
BAYESIAN REANALYSIS OF VIOLENT MEDIA 2
Abstract
Research on the effects of violent video games frequently relies on arguments for the null
hypothesis. Proponents of the effects argue that there are no meaningful differences save violent
content between the violent and nonviolent games played, while critics of the effects argue that
their nonsignificant study results constitute evidence for the null hypothesis of no difference.
However, neither argument can be supported through the use of traditional null-hypothesis
significance testing, as such tests can only ever reject or retain the null, never rejecting the
alternative hypothesis in favor of the null. Therefore, to evaluate these claims, we apply a more
appropriate Bayesian analysis to measure evidence for or against the null hypothesis relative to
reasonable alternative hypotheses. We conclude that current methodological standards cannot
rule out substantial confounds between violent and nonviolent video games. Furthermore, we
find that studies that claim to find an absence of violent video game effects vary substantially in
the strength of evidence, with some strongly supporting the null, others weakly supporting the
null, and some others finding evidence of differences between conditions. We recommend the
use of Bayesian analyses, larger sample sizes, and the creation of custom-designed games for
experimental research.
BAYESIAN REANALYSIS OF VIOLENT MEDIA 3
How Much Evidence Is p > .05? Stimulus Pre-Testing and Null Primary Outcomes in Violent
Video Games Research
Despite more than two decades of research, the scientific literature on whether violent
video games cause aggressive outcomes remains divided and contentious. To date, this
relationship has been examined in hundreds of individual studies and in aggregate by several
different meta-analyses. Even the meta-analyses are divided and contentious—some argue that
there is a meaningfully large effect (Anderson et al., 2010; Greitemeyer & Mügge, 2014) and
others argue there is no meaningful effect (e.g., Ferguson & Kilburn, 2009; Sherry, 2001). Note
here that both positions, that video game violence increases aggression and that video game
violence has no effect on aggression, are theoretically important and a priori plausible. They
both deserve serious and fair consideration.
A typical experiment in this literature tests for an effect of violence on aggressive
outcomes by randomly assigning participants to play a violent or nonviolent video game. After
gameplay, an aggressive outcome such as hostile affect, aggressive-word accessibility, or
aggressive behavior is measured. The outcome is compared across groups to estimate an effect
size and determine statistical significance. In theory, then, assessing the effect of violent video-
game content should be straightforward, and there is little reason to expect such controversy.
The controversy, in part, stems from questions of experimental control. Commercially-
available violent and nonviolent video games are not typically designed to be exactly like one
another except for violent content. Although the experimenter has experimental control over the
video game a participant plays, the experimenter does not have experimental control over the
BAYESIAN REANALYSIS OF VIOLENT MEDIA 4
content of the video game. This lack of control generates the possibility that the violent and
nonviolent games differ in dimensions besides violent content. Such differences may constitute
confounds that are responsible for observed post-play differences in aggressive outcomes. For
example, if the violent game is also more arousing and more frustrating than the nonviolent
game, these differences may cause increases in aggressive outcomes, even if violent content does
not.
Many researchers attempt to rule out such confounds in order to ensure experimental
control. Experiments testing the effects of violent media therefore often begin with an attempt to
demonstrate that the violent and nonviolent games are as similar as possible on all other
dimensions. This would minimize the possibility of confounds and support the argument that any
observed effects are due to violent content alone.
The efficacy of this approach is the topic of some debate. On one hand, some researchers
claim that certain pairs of violent and non-violent games are well matched and that experimental
control is maintained over possible confounds (e.g., Anderson et al., 2004). On the other hand,
other researchers have argued that there are other unmeasured confounds that are responsible for
the observed effects. For example, Adachi and Willoughby (2011) argue that it is competition
rather than violence that causes increases in aggressive behavior, and that matching violent and
nonviolent games on competitive content eliminates the purported effect of violence. Elson,
Bruer, Van Looy, Kneer, and Quandt (2013) argue that changes in aggressive behavior are
caused by differences in pace of action rather than violent content. Przybylski, Deci, Rigby, and
Ryan (2014) observed that competence-impeding games can influence aggressive outcomes but
did not detect effects of violent content. Although these authors made no inference regarding the
effects of violent content, one might interpret these results as indicating an absence of an effect.
BAYESIAN REANALYSIS OF VIOLENT MEDIA 5
Each of these arguments favors the position that, under certain circumstances, there is no effect
of video game violence on aggression.
Statistical Arguments for the Null Hypothesis
Both proponents and skeptics of violent-game effects make arguments favoring the null
hypothesis. Proponents argue for the null hypothesis when comparing two video games and
arguing that they do not differ in potential confounds. Such a comparison is considered a success
if the two games differ significantly in violent content but do not differ significantly in
confounds. The nonsignificant test result is considered evidence for the truth of the null
hypothesis. On the other hand, skeptics report conducting their own experiments and finding
nonsignifcant results of violent games on aggressive outcomes. Skeptics consider these statistics
as providing evidence for the null hypothesis of no effect.
This need to make substantive claims supporting the null raises important and unresolved
statistical issues. Null-hypothesis significance testing (NHST), the nearly ubiquitous approach
for inference in psychological research, cannot be used to state evidence for the null hypothesis
that the true effect size is zero. In NHST, the probability of the data is evaluated given the
assumption that there is no true effect. If the probability of the data or more extreme data is less
than 1-in-20 (p < .05), the data are said to be sufficiently unusual given the null hypothesis of no
effect, and the null hypothesis is rejected in favor of an alternative hypothesis of some effect.
However, NHST cannot be used to reject the alternative hypothesis in favor of the null
hypothesis. A p-value greater than .05 may reflect a true effect size of zero, but it also may
reflect insufficient power to detect a true nonzero effect. Therefore, it is unknown whether the
previously discussed null findings reflect evidence for the null hypothesis or a lack of power.
BAYESIAN REANALYSIS OF VIOLENT MEDIA 6
Researchers need a method for stating positive evidence for the null rather than a lack of
evidence for an effect.
In the present manuscript, we examine the strength of evidence for null claims from both
proponents and skeptics of violent-game effects. To do so, we present methods for Bayesian
inference that allow researchers to state positive evidence for either hypothesis as determined by
the data.
First, we present these Bayesian methods and explain how they can be used not only to
find evidence for effects of experimental factors, but also evidence for invariance (i.e., the null
hypothesis) in outcomes with respect to experimental factors. Following this, we assess whether
violent and nonviolent game stimuli appear to be well-matched by reanalyzing several exemplars
of pilot studies in violent video game research for which necessary statistics were available. We
then examine the strength of evidence for the lack of an effect in those studies reporting no
significant effect of violent content. Finally, results are summarized and used to inform practical
suggestions offered for stronger, more informative research. The present manuscript is not
intended as a systematic review, but is intended to highlight common inferential problems that
impede progress in violent-media research.
Bayesian Inference
Bayesian model comparison is ideally suited for assessing the strength of evidence for an
effect or for an invariance, and it has a long history in statistics and psychology. Perhaps the first
to suggest the methods we cover was Laplace (1829, republished in 1986), whose work was
followed by seminal advances from Jeffreys (1961). Edwards, Lindman, and Savage (1963) were
perhaps the first psychologists to recommend the approach and did so with uncommon gusto in
their landmark Psychological Review article. The method has gained increasing popularity in
BAYESIAN REANALYSIS OF VIOLENT MEDIA 7
statistics and psychology in recent years (Berger & Delampady, 1987; Gallistel, 2009; Raftery,
1995; Rouder, Speckman, Sun, Morey, & Iverson, 2009; Wagenmakers, 2007). The main hurdles
to adoption have often been the difficulty of computation and the unavailability of software
(Gallistel, 2009), but these barriers have been largely removed with Morey and Rouder’s (2014)
BayesFactor library for the R statistics language and with the freeware statistics program JASP
(http://jasp-stats.com).
In Bayesian analysis, probabilities are used to confer a degree of belief on events,
parameters, and even theoretically important positions. Analysts start with stated beliefs and then
update those beliefs rationally and optimally using Bayes’ rule. For updating beliefs about
positions, we use the following form of Bayes’ rule:
𝑃𝑟(𝐻0|Data)
𝑃𝑟(𝐻1|Data)=𝑃𝑟(Data|𝐻0)
𝑃𝑟(Data|𝐻1)×𝑃𝑟(𝐻0)
𝑃𝑟(𝐻1)
It is best to start with the term on the far right, Pr(H0) / Pr(H1) which is called the prior odds.
This term describes the researcher’s beliefs about the plausibility of the positions before
collecting the data. The term on the left, Pr(H0|Data) / Pr(H1|Data), called the posterior odds,
describes the researcher’s beliefs after collecting the data. The key question is how did the data
affect the beliefs, or, restated, what is the strength of evidence from the data. This evidence is
described by the middle term, Pr(Data|H0) / Pr(Data|H1), which is also called the Bayes factor.
We will denote the Bayes factor with B, and subscript it to indicate which hypothesis is in the
numerator and denominator:
𝐵01 =𝑃𝑟(Data|𝐻0)
𝑃𝑟(Data|𝐻1)and𝐵10 =
𝑃𝑟(Data|𝐻1)
𝑃𝑟(Data|𝐻0)
Bayes factor values range from 0 to 1 and describe how much more probable the data are under
one position than another. For example, B01 = 10 means that the data are ten times more probable
BAYESIAN REANALYSIS OF VIOLENT MEDIA 8
than under the null than under the alternative, while B01 = 0.1 means that the data are ten times
more probable under the alternative than under the null. Infinite support for the null and
alternative are obtained when B01 = 1 and B01 = 0, respectively. A Bayes factor of B01 = B10 = 1
expresses equivalency; the data do not discriminate at all among the positions.
One of the key properties of Bayes factors is that they describe changes in beliefs rather
than beliefs themselves. Consequently, two researchers may not agree about the plausibility of
positions a priori, and, in this case, they will not agree about the posterior plausibility.
Nonetheless, they may agree about the Bayes factors, the evidence from data. Therefore, the
Bayes factor is not dependent on these prior odds and serves as evidence regardless of beliefs
about the initial plausibility of positions. Because Bayes factors describe evidence or change in
belief rather than belief itself, it is considered an ideal statistic for scientific communication
(Jeffreys, 1961). This property contrasts favorably with NHST, which is about making decisions
with long-term error rates controlled rather than about expressing evidence from data.
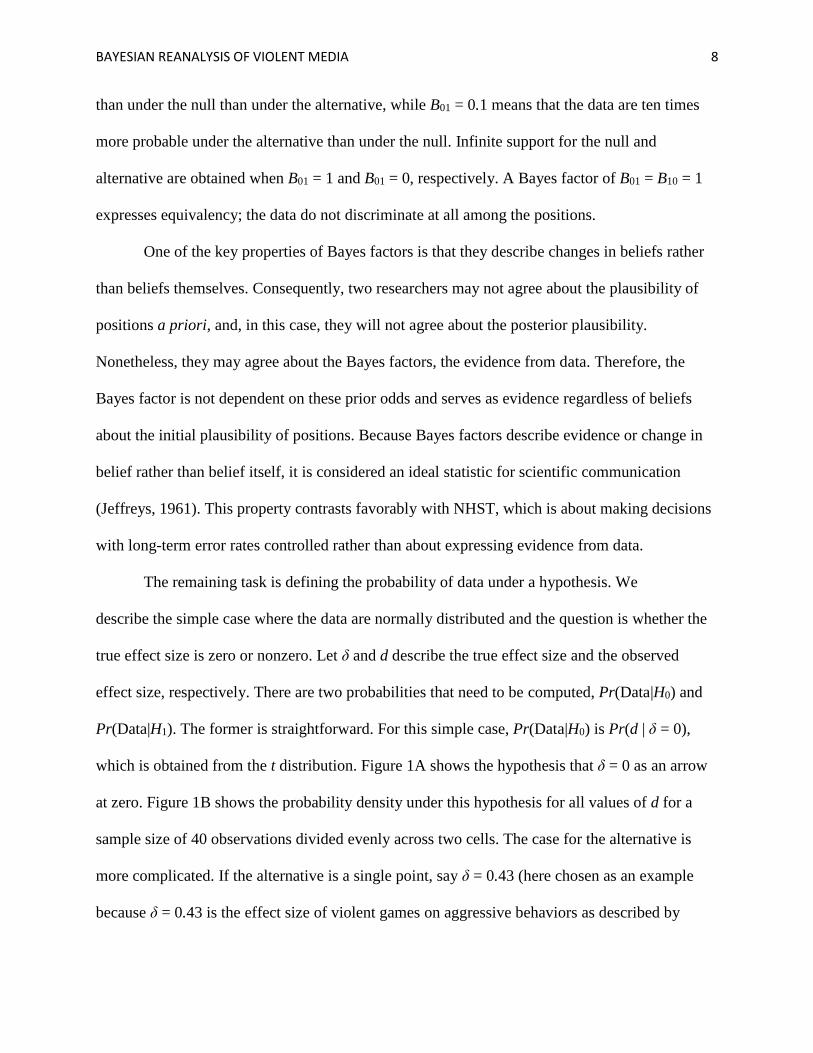
The remaining task is defining the probability of data under a hypothesis. We
describe the simple case where the data are normally distributed and the question is whether the
true effect size is zero or nonzero. Let δ and d describe the true effect size and the observed
effect size, respectively. There are two probabilities that need to be computed, Pr(Data|H0) and
Pr(Data|H1). The former is straightforward. For this simple case, Pr(Data|H0) is Pr(d | δ = 0),
which is obtained from the t distribution. Figure 1A shows the hypothesis that δ = 0 as an arrow
at zero. Figure 1B shows the probability density under this hypothesis for all values of d for a
sample size of 40 observations divided evenly across two cells. The case for the alternative is
more complicated. If the alternative is a single point, say δ = 0.43 (here chosen as an example
because δ = 0.43 is the effect size of violent games on aggressive behaviors as described by
BAYESIAN REANALYSIS OF VIOLENT MEDIA 9
Anderson et al., 2010)1, then it is relatively straightforward to compute the probability Pr(d | δ =
0.43), which is obtained from a noncentral t distribution. This alternative too is represented as an
arrow in Figure 1A, and the probability density under this alternative is also shown in Figure 1B.
The Bayes factor is simply the ratio of the probabilities. So, for example, if the observed
effect size is d = 0.1, as shown by the empty circles in Figure 1B, then the probability density for
H0 is 0.38, the probability density for H1 is 0.23, and the Bayes factor B01, their ratio, is 1.6. On
the other hand, if the observed effect size is larger, say d = 0.7, as shown by the filled circles in
Figure 1B, then the probability density for H0 is 0.04, the probability density for H1 is 0.27, and
the Bayes factor B01 is 0.14, or 7.2-to-1 in favor of the alternative hypothesis.
The specification of a point alternative, though often done in power analyses, strikes us as
too constrained. In Bayesian analysis, the analyst can consider a range of alternatives. Figure 1C
shows the point null and a distributed alternative. Under this alternative, smaller effects are more
weighted than larger ones, and positive effects are as weighted as negative ones. The shown
alternative is the default one recommended by Rouder and Morey and colleagues (Morey &
Rouder, 2011; Rouder & Morey, 2012; Rouder, Morey, Speckman, & Province, 2012; Rouder et
al., 2009) as being broadly appropriate for research in psychological sciences. This alternative
takes the form of a Cauchy distribution, a fat-tailed distribution defined by a scale parameter that
specifies the 50% probability interval. The distribution δ ~ Cauchy(0.4), then, describes the
effect size as having 50% probability of being between −0.4 and +0.4. The appropriateness of
this prior is supported by work by Jeffreys (1961), Liang, Paulo, Molina, Clyde, and Berger
(2008), and Zellner and Siow (1980). The probability density under this alternative for all values
1 Although effect sizes in this literature are often described in terms of the Pearson correlation ρ, we will typically
convert such effect sizes to their equivalent values in terms of the standardized mean difference δ for the sake of
simplicity and consistency.
BAYESIAN REANALYSIS OF VIOLENT MEDIA 10
of d is shown in Figure 1D, and the density is more diffuse than that for the null. As before,
Bayes factor values are computed as the ratio of these probability densities. As an example
again, if the observed effect size is d = 0.1, as shown by the circles in Figure 1D, then the
probability density for H0 is again 0.38, the probability density of this H1 is 0.14, and the Bayes
factor B01, their ratio, is 2.7. For the larger observed effect d = 0.7, the probability density of H0
is 0.04, the probability density of H1 is 0.05, and B01 is 0.73, or 1.4-to-1 in favor of the
alternative hypothesis.
In the above examples, the obtained Bayes factors are fairly small. There is not much
evidence to be gleaned from forty observations between two cells. However, with a larger
sample, say two hundred observations between two cells, the probability density function for
each hypothesis becomes sharper. Differences between the hypotheses are exaggerated, and
stronger Bayes factors may be obtained. Figure 1E shows the previous case of two point
hypotheses of H0: δ = 0 and H1: δ = 0.43, now with two hundred observations. The Bayes factor
for the small observed effect d = 0.1 is now B01 = 12, while the Bayes factor for the larger
observed effect d is more than 10,000-to-1 in favor of the alternative. The larger sample has
afforded better resolution for discriminating between the two hypotheses. Figure 1F shows the
point null and distributed alternative scenario, again with the larger sample size of two hundred
observations. For a small observed effect, the Bayes factor is B01 = 4.3; for a large observed
effect, the Bayes factor is 5,000-to-1 in favor of the alternative.
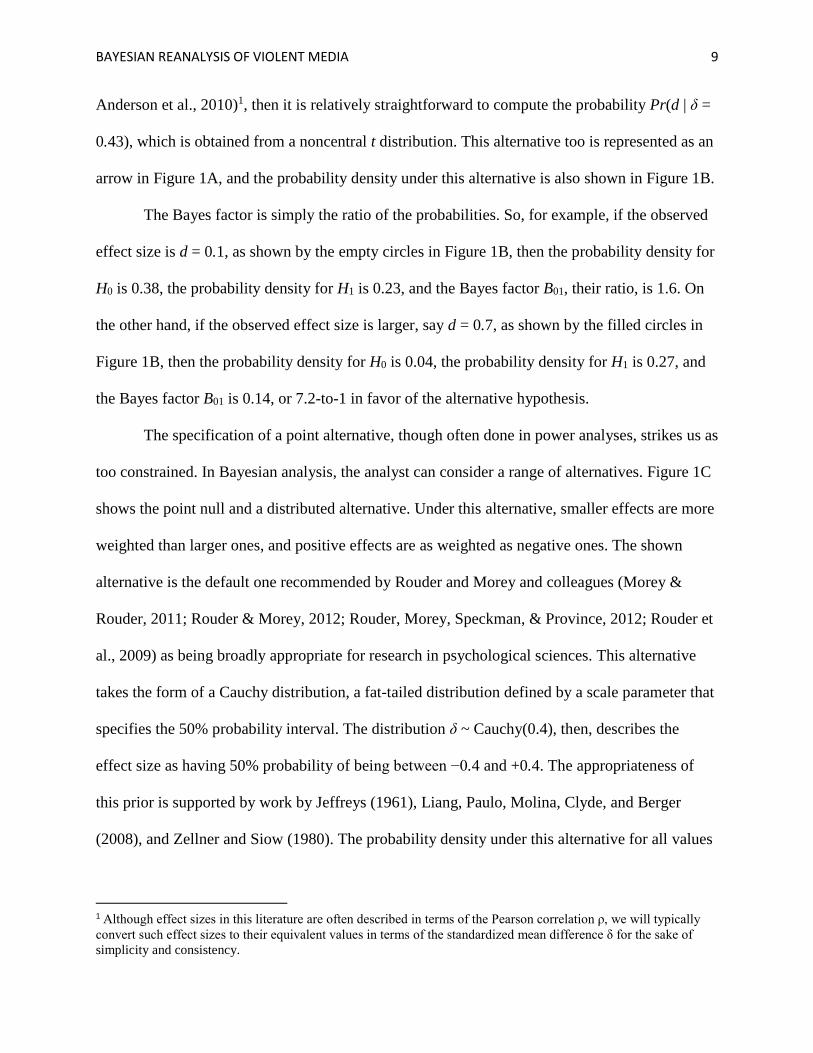
The relationships between observed effect size, sample size, and Bayes factor are further
plotted in Figure 2. Figure 2A shows Bayes factor values for the null vs. the point-alternative
hypothesis. Figure 2B shows Bayes factor values for the null vs. the default alternative as a
function of observed effect size. A small sample of n = 40 is plotted as the solid line, while a
BAYESIAN REANALYSIS OF VIOLENT MEDIA 11
larger sample of n = 200 is plotted as the dashed line. As can be seen, small observed effect sizes
correspond to evidence for the null while larger values correspond to increased evidence for the
alternative. When sample sizes are large, the hypotheses are easier to discriminate, and Bayes
factors more readily diverge from 1. For an accessible introduction to specifying alternative
hypotheses and appropriate software tools for hypothesis comparison, we suggest the interested
reader consult recent work by Dienes (2011, 2014) and by Rouder and Morey (2012) and Rouder
et al. (2012). Additionally, the freeware software program JASP (https://jasp-stats.org) provides
Bayes factors for t-tests and ANOVA in a point-and-click SPSS-like environment and may be
useful for users not yet comfortable with R.
Sample Size and the Strength of Evidence
A common problem in violent-games research, as in most psychological research,
concerns statistical power. Many studies arguing the absence of effects (both between stimuli in
pilot testing and between conditions in aggressive outcomes) are based on relatively small
sample sizes. For example, the typical pilot test features about 20 subjects for within-subjects
testing (e.g., Arriaga, Esteves, Carneiro, & Monteiro, 2008) or about 12-15 per cell for between-
subjects testing (e.g., Anderson et al., 2004; Valadez & Ferguson, 2012). In such small samples,
only very large effects like |δ| = 1.0 could be tested with 80% power. It is not unusual when such
a pilot test ends in failure to detect significant differences between stimuli, and it remains
unknown whether this failure reflects a true null or a lack of power.
Statistical power is also a concern in research argued to demonstrate that violent games
do not influence aggressive outcomes. In this literature, some studies are well-powered but
others are not. If one assumes that the true effect size of violent content on aggressive affect,
cognition, and behavior are as reported in Anderson et al. (2010)’s meta-analysis, then one needs
BAYESIAN REANALYSIS OF VIOLENT MEDIA 12
sample sizes of n = 69, n = 127, and n = 136, respectively, to test them with 80% one-tailed
power. Some studies meet or exceed these recommended sample sizes, while others fall short to
varying degrees. Using NHST to claim an invariance creates a perverse incentive to underpower
studies—the smaller the sample size, the more likely a failure-to-reject result. An underpowered
study will almost always indicate that two games have no significant differences or that an effect
of violent games could not be detected. In some cases, statistical power can be further reduced by
the application of harsh multiple comparison corrections. NHST in this context implicitly and
subtly rewards researchers for collecting insufficient data by yielding the desired research
conclusion.
By comparison, there is no such perverse incentive when using Bayes factors. If the
sample size is too small, then the Bayes factors will hover around the value 1, representing no
change in beliefs. Bayes factors only become substantially larger or smaller, that is, representing
stronger evidence, when the sample size becomes large. Analysis by Bayes factors therefore sets
up the correct incentives — researchers must have sufficiently large samples to obtain
compelling Bayes factor values. This inferential structure is vastly preferable to an NHST
approach in which the desired p > .05 can almost always be obtained by collection of small,
uninformative samples.
But how large must a Bayes factor be to become compelling? Recall that posterior beliefs
are the product of prior beliefs and the Bayes factor. There can be no objective threshold that
separates “sufficient evidence” from “insufficient evidence,” as prior beliefs are inherently
subjective. Thus, to the question “How much evidence do I need?” the answer is simply “Enough
to convince your reviewers, readers, critics, and yourself.” If the obtained Bayes factor is not
sufficiently large, more data can be collected. Although such optional or conditional stopping is a
BAYESIAN REANALYSIS OF VIOLENT MEDIA 13
serious and dangerous form of research flexibility in NHST (Simmons, Nelson, & Simonsohn,
2011), it is not a problem for Bayes factor (Dienes, 2011; Rouder, 2014). Thus, data could be
freely collected until the obtained Bayes factor is satisfyingly convincing (e.g., Matzke et al.,
2015).
Arguing the Null in Pilot Testing of Matched Stimuli
In the research literature on violent games, proponents have suggested that this process of
matching demonstrates that the effects of violent video games are specifically due to violent
content and not other confounds (Anderson et al., 2004). At the same time, skeptics have
suggested that matching games on certain dimensions eliminates the effect of violent games
(Adachi & Willoughby, 2011). However, interpretation of these pilot tests has been improper and
incoherent. For example, pilot tests in this research domain have sometimes estimated the
differences between stimuli as being large, but because the results were not statistically
significant, the null hypothesis was considered confirmed. In one particularly remarkable case,
post-hoc Bonferroni correction for multiple comparisons was applied to control the Type I error
rate across comparisons on 14 dimensions, lowering the critical value of p to .0036 (Arriaga et
al., 2008). Differences as large as d = 1.25 were observed but escaped consideration due to the
small sample size and harsh multiple comparison correction. To their credit, the authors
acknowledge that the pilot sample was small, but still do not entertain the possibility that the
pilot test provided evidence of differences; instead, they conclude that the pilot test indicates that
the games are relatively well-matched.
To address the problems of poor power and the improper application of NHST, we apply
the Bayesian approach described above to interpreting the results of several stimulus-matching
BAYESIAN REANALYSIS OF VIOLENT MEDIA 14
pilot tests for which necessary statistics were available. This novel analytic approach allows
quantification of the evidence for the absence of confounds.
We reevaluate some exemplar pilot tests by applying Bayesian model comparison,
proposing two hypotheses for pilot testing. The first is a null hypothesis of no difference in
potential confounds, H0: δ = 0, and the alternative hypothesis is a hypothesis of a moderate
difference, H1: δ ~ Cauchy(0.5).2 This choice of scale in the alternative hypothesis is subjective
but appropriate. Effects of violent games are expected to be small, about δ = 0.43, so confounds
should be examined on a similarly small scale. We use the ttestBF function in the
BayesFactor package (Morey & Rouder, 2014) to calculate paired-sample or two-sample
Bayesian t-tests with scale on effect size set to 0.5. (For a comparison against a null interval over
[-0.1, 0.1], consult the supplementary materials.) By entering the sample size and the obtained t-
value of each test, we obtain a Bayes factor describing the strength of evidence for or against the
null relative to this alternative hypothesis.
Reanalysis of Select Pilot Tests in Violent Media Research
We re-examined pilot data from Arriaga et al. (2008) and present the results in Table 1.
Given that the two tested video games, Unreal Tournament (a first-person shooter game) and
Motocross Madness (a racing game), come from very different game genres with very different
rules of play, one might have some prior belief that the games are not well matched. We find that
the pilot test, with its sample of n = 20 (within subjects), has not provided strong evidence of
matching between stimuli on all dimensions. Bayes factors reveal that there is evidence that
some dimensions do not differ, but evidence that other dimensions do. After the pilot test, the
2 If it is unreasonable to expect that the stimuli are perfectly matched, a null hypothesis of minimal difference can be
used instead to treat very small differences as practically equivalent to zero (e.g., H0 : δ ~ Uniform(-.1, .1), see the
nullInterval argument for the ttestBF function in the BayesFactor R package).
BAYESIAN REANALYSIS OF VIOLENT MEDIA 15
readers and researchers are roughly three times more confident the games do not differ in
involvement, presence, boredom, satisfaction, identification, or excitement. However, they
should also be twice as concerned that the games differ in feelings of competence, and nearly
four times as concerned that they differ in difficulty. Tests of whether the games differed in
discomfort, realism, pleasure, action, or disorientation were largely uninformative.
These conclusions are very different from those reached by Arriaga and colleagues, who
interpret the nonsignificant results of the pilot test as evidence that the games are equivalent on
all measures, or at worst, that the results might be merely inconclusive. It is possible, then, that
the primary results from this study, in which the violent game was associated with greater
aggressive behavior and hostility, are not caused by violent content specifically, but may be
caused instead by differences in experienced competence or the difficulty of gameplay.3
Another classic pilot test in this literature is found in Anderson et al. (2004, study 1), in
which 120 subjects each played one of 10 games (i.e, n = 12 per cell). The games Glider Pro and
Marathon 2 were selected as a matched pair differing in violent content but not in other
dimensions. Our reanalysis is summarized in Table 1. Evidence for the null hypothesis is slight,
and reanalysis indicates that the games instead may differ in amount of action.4 Further data
collection would be necessary to arrive at certainty about the equivalence or difference of these
two games on these dimensions.
Mistaken inferences regarding the results of pilot testing are also found among skeptics
of violent media effects. We re-evaluate the pilot test from Valadez and Ferguson (2012). This
3 It is necessary in conventional analyses to account for the effects of multiple comparisons on desired long-run error
rates. Bayesians, in contrast, are interested in the quantification of evidence, not the control of such error rates, so
there is no need for such corrections (Dienes, 2011; Royall, 1997). 4 We computed slightly different t-values than the original authors from the reported summary statistics. We used
the reported MSE which is an averaged variance which may not well reflect individual-cell variabilities. These
differences are of minimal concern—given the small sample size per cell, the Bayes factor values are necessarily
close to 1.0.
BAYESIAN REANALYSIS OF VIOLENT MEDIA 16
study used a three-level one-way ANOVA design to compare a violent game condition to two
non-violent game control conditions. In the violent game condition, participants played a
segment from the later stages of the open-world shooter game Red Dead Redemption. In one
control condition, participants played a segment from the beginning of Red Dead Redemption,
argued to contain little or no violence because of the early stage of the game, and in the other
control condition, participants played the soccer game FIFA, a nonviolent game. A small sample
was collected (cell ns = 15, 10, and 15, respectively, between-subjects), to rate each game on
difficulty, competitiveness, and pace of action. Differences in difficulty and competitiveness
were reported as not significant, F(2, 40) = 2.36, p > .05 and F(2, 40) = 3.09, p > .05,
respectively, while differences in pace of action were significant F(2, 40) = 4.27, p = .02. This
last variable was explored through Bonferroni post-hoc analysis, and it was decided that the two
nonviolent-game conditions differed from each other but not from the violent-game condition.
To determine the strength of evidence for or against invariance in the Valadez and
Ferguson data set, we computed all pairwise t-values and corresponding Bayes factors. The
results are reported in Table 2. Contrary to the authors’ conclusions, the results of the pilot test
indicate that the games are not well matched. In particular, Bayes factors indicate evidence that
the two Red Dead Redemption conditions differ in competitiveness and the two control
conditions differ in all dimensions. Most other comparisons are largely uninformative, as might
be expected of the small sample size. Given our prior beliefs that the early stages of a game are
often rather easier than the later stages, given that Red Dead Redemption and FIFA are very
different genres of game, and given that the evidence indicates differences between the
conditions, we are again not convinced that the stimuli are well-matched. Rather than
BAYESIAN REANALYSIS OF VIOLENT MEDIA 17
demonstrate that the stimuli are matched, the pilot test has instead indicated that the games are
probably quite different.
Adachi and Willoughby (2011) report two pilot studies intended to demonstrate that the
games used (Conan, an action-adventure combat game, and Fuel, a racing game) were matched
on certain game dimensions but differed in violent content. In the first pilot, n = 14 participants
played each of two games (within-subjects). This pilot provided slight evidence that the two
games did not differ in competition, difficulty, or pace of action, Bs = 2.61, 2.48, and 2.22 in
favor of the null, respectively. The subsequent Study 1 provided little further evidence that the
games did not differ, Bs = 2.43, 1.06, and 1.05 in favor of the null relative to the alternative,
respectively. Again, considering that the two games came from very different genres (action-
adventure, racing), this may not be sufficient to convince everyone that the games are identical in
all ways besides violent content. Note also that neither this study nor Valadez and Ferguson
(2012) tested games for equivalence in frustration or feelings of competence, so it is possible that
other confounds exist but were not tested.5
Given the minimal evidence yielded by these pilot studies, one might wonder at which
sample sizes it becomes possible to provide substantial evidence in favor of the null hypothesis.
Figure 3 shows the relationships between sample size, p-value, and evidence for the null in
between-subject and within-subject study designs. Supposing one desires at least 3-to-1 evidence
in favor of the null, a between-subjects design needs at least 66 subjects and a within-subjects
design needs at least 17 subjects. This makes the optimistic assumption that the observed
5 Again, if it seems too conservative to expect that stimuli are exactly matched, and minor differences are acceptable, the null hypothesis could instead be specified as the interval δ ~ Uniform[-0.1, 0.1]. In that case, the Bayes factors change little, and are as follows. In the pilot test, Bs = 3.37, 3.11, and 2.68 in favor of the null for competition, difficulty, or pace of action, respectively. In the first study, Bs = 3.04, 1.07, and 1.06 in favor of the null, respectively.
BAYESIAN REANALYSIS OF VIOLENT MEDIA 18
difference is exactly zero (e.g. p = 1.0). In practice, nonzero differences are likely to be observed,
providing less support for the null and sometimes even favoring the alternative hypothesis.
Although the present manuscript is not intended as a comprehensive review, we note that
few pilot tests have sample sizes as large as the bare minima recommended by Figure 3. Thus,
although the above studies were picked as examples, they may be representative of the literature.
To the best of our knowledge, the largest pilot test that did not find significant confounds was
reported by Anderson and Carnagey (2009). This pilot test manipulated game violence as a
within-subjects factor with a sample of n = 32 and found no significant confounds of competition
or excitement. Other similarly-sized pilot studies typically find significant confounds, which are
then later applied as covariates in analysis (e.g., Anderson & Dill, 2000; Gitter, Ewell,
Guadagno, Stillman, & Baumeister, 2013).
In general, we have found few pilot studies that collected more than 20 subjects in a
within-subjects design or more than 40 subjects in a between-subjects design. Thus, while the
examples provided above do not constitute a systematic review, we expect that these criticisms
apply to a majority of studies in the literature.
Studies without Pilot Tests
Not all studies conduct pilot tests to attempt to demonstrate the equivalence of game
stimuli. In such cases, there is no evidence one way or the other and no change in beliefs. The
researcher, reader, and reviewers have only their prior beliefs concerning the equivalence or
inequivalence of stimuli. Scientific skepticism may require that researchers consider stimuli
unmatched until evidence indicates otherwise. Examples of experiments not reporting pilot tests
for equivalence include Bartholow and Anderson (2002), Bartholow, Sestir, and Davis (2005),
and Hasan, Bègue, and Bushman (2012).
BAYESIAN REANALYSIS OF VIOLENT MEDIA 19
Summary
Because NHST cannot provide evidence in favor of the null hypothesis, it is
inappropriate to argue that two experimental stimuli are matched on the basis of a non-significant
test result. Non-significant test results can almost always be obtained, even if the null hypothesis
is false, through collection of an arbitrarily small sample size and application of harsh multiple-
comparison corrections. Previous criticism of this stimulus-matching approach has focused on
potential unmeasured confounds but assumed that nonsignificant results were indeed evidence of
matching — by contrast, we find that there may be substantial differences even on the confounds
that were measured. Although it is indeed a good idea to match stimuli, pilot tests from this
literature often provide little evidence that stimuli are matched, and in fact, often indicate that the
two stimuli involve some confounds. That said, although the past evidence for matching is not
compelling, future research studies may be able to use larger pilot studies to provide better
evidence of matching.
As an alternative to NHST, we advocate the use of Bayesian statistics. Bayes factor
evidence may favor the null hypothesis of no difference, may favor an alternative hypothesis of a
confounding difference, or may favor neither, indicating an absence of evidence for either
hypothesis.
We note that another approach used in this literature is to not equate stimuli at all, but
rather to collect measurements of potential confounds and apply them as covariates to attempt to
adjust the groups to equality (e.g., Bushman & Anderson, 2002, 2009; Carnagey, Anderson, &
Bushman, 2007; Sestir & Bartholow, 2010). Although this practice is sometimes recommended
as “destructive testing” (Anderson & Anderson, 1996; Prot & Anderson, 2013), the
appropriateness of this practice is controversial and rests upon several delicate statistical
BAYESIAN REANALYSIS OF VIOLENT MEDIA 20
assumptions. A full exploration of the issue is beyond the scope of the present manuscript, but
the interested reader may find a number of arguments against attempting to equate unequal
groups through ANCOVA (e.g., Miller & Chapman, 2001). Thus, much as in the insufficient
pretesting examples above, one cannot be certain that this approach completely eliminates the
effect of confounds on the dependent variable.
Setting aside the issue of matched stimuli, it is necessary to assess the degree of evidence
for the null hypothesis in those studies reporting no significant effects of video game violence.
These reported studies vary substantially in their sample sizes and estimated effect sizes and so
vary too in their evidence for or against the null. We reanalyze these findings in the following
section.
Bayesian Reanalysis of Nonsignificant Results
Some researchers have argued that there is no effect of violent game contents when the
video games are well matched on confounding dimensions. Research exploring these confounds
has found significant effects of the confound but nonsignificant effects of violent content. Such
research suggests that previous studies have overestimated the effect of violent media by
mistaking the effects of confounding game features for the effect of violence. If true, this would
indicate that effect size estimates from previous meta-analyses (e.g., d = 0.43, Anderson et al.,
2010) are overstated.
Yet there seem to be inferential difficulties in the claim that there are no effects. At one
extreme, consider the results of Elson et al. (2013) in which one of the reported outcomes has a
p-value of .073, which barely misses the conventional .05 criterion. Not only is this p-value
small, the observed effect size of d = .41 is about the same size as the meta-analytic value of d =
BAYESIAN REANALYSIS OF VIOLENT MEDIA 21
.43 reported by Anderson et al. (2010). This may seem to be more a confirmation of the effect
than a refutation.
Bayesian Model Comparison and Hypothesis Specification
To assess the strength of evidence for or against the null hypothesis, we re-evaluate these
null findings through Bayesian model comparison. Unlike in pilot testing, where we had only
vague hypotheses about effects, violent-game-effects research can use existing information to
describe more specific hypotheses. These more-specific hypotheses can each be compared
against the null hypothesis to assess the strength of evidence for or against each belief in the
effect.
We compare four hypotheses: a null hypothesis, a vague alternative hypothesis, a less
vague alternative hypothesis, and a highly specific alternative hypothesis. As before, the null
hypothesis describes the true effect size as exactly zero: H0: δ = 0. The three alternative
hypotheses are more involved and are described next.
The vague alternative hypothesis is that the true effect is probably small-to-medium in
magnitude, but we know little about the direction of effect or which magnitudes are particularly
likely. We will refer to this minimally-informative alternate hypothesis as HA1, the first
alternative hypothesis, and model it with a minimally-informative Cauchy prior. HA1 is specified
as δ ~ Cauchy(0.4). By evaluating the probability of this hypothesis relative to the null
hypothesis, we create Bayes factor B01, the probability ratio of H0 as compared to HA1. We
calculate B01 by using the BayesFactor package for R (Morey & Rouder, 2014).
A second, more specific alternative hypothesis is that the true effect is small-to-medium
in magnitude but strictly positive. We model this with a folded Cauchy distribution, restricting
the probability to only positive values. This one-tailed hypothesis HA2 is specified as δ ~
BAYESIAN REANALYSIS OF VIOLENT MEDIA 22
Cauchy+(0.4). Comparing the probabilities of H0 and HA2 yields B02, the evidence for the null
relative to this one-tailed alternative. We calculate B02 with the metaBF function for R provided
by Rouder and Morey (2011).
The most precise alternative hypothesis is that the true effect is equal to that estimated by
previous meta-analysis, e.g. d = .43 [.35, .52] (Anderson et al., 2010). In other words, this
alternative hypothesis is stated as HA3: δ ~ Normal(.43, .04), where .43 and .04 are the mean and
standard deviation of the effect size. By again comparing the probability of the data given H0
against the probability given HA3, we create Bayes factor B03, which measures the evidence for
the null hypothesis relative to the meta-analytic expectation of the effect size. (Note that the
mean and standard deviation used in HA3 will vary depending on the particular outcome tested:
aggressive cognition, aggressive behavior, and aggressive affect each have slightly different
meta-analytic effect size estimates. The above example references the effect of violent game
content on aggressive behavior.) We calculate B03 using R code provided by Christie, Baguley,
and Kaye found on Dienes’ website
(http://www.lifesci.sussex.ac.uk/home/Zoltan_Dienes/inference/bayesFactorCalc2.R).
Note that one need not believe personally in these hypotheses for the obtained Bayes
factor to be useful. Proponents do not believe in the null hypothesis, but it is useful to be able to
state evidence against it and in favor of an effect. Similarly, while skeptics may believe that the
meta-analytic estimates provided by Anderson et al. (2010) are overestimated by publication
bias, these estimates nonetheless approximate the beliefs of proponents. Thus, it is useful to test
the strength of evidence for the null hypothesis relative to the meta-analytic estimate. One could
even test the evidence for a bias-corrected effect size relative to the meta-analytic estimate and
relative to the null hypothesis.
BAYESIAN REANALYSIS OF VIOLENT MEDIA 23
With these Bayes factors, researchers can assess the relative evidence for all three
alternative hypotheses relative to the null hypothesis. The nonspecific alternative hypothesis HA1
could be supported by effect sizes of various magnitudes and either sign, and B01 < 1 indicates
support for this broad hypothesis relative to the null. HA2 describes a hypothesized increase of
modest magnitude, and B02 summarizes the strength of evidence for the null relative to this
increase. Finally, HA3 precisely describes the meta-analytic estimate. B03 > 1 indicates evidence
for the null relative to the meta-analytic expectation, while B03 < 1 indicates evidence consistent
with the meta-analytic estimate.
Reanalysis of Null Findings in VVG Research
We apply this approach to the current literature of studies interpreted as finding evidence
of no effect of violent video games on aggressive behavior. Each study has a confidence interval
that overlaps with d = 0 which caused researchers to retain and argue for the null hypothesis. Our
analysis quantifies the strength of evidence for the null, if any.
As is typical in research, the presented analyses required making some choices. We make
these as transparently and judiciously as we know how, but at the same time note that others may
make different choices. Some studies had unusual experimental or control conditions that
required careful consideration. In Ferguson et al. (2008), half of participants were allowed to
choose their own game condition (violent or nonviolent), rather than being randomly assigned to
play a violent or nonviolent game. While interesting in its own right, these conditions are not
relevant to our hypothesis test. We exclude those participants from this analysis, as the absence
of random assignment implies a loss of experimental control. In Ferguson and Rueda (2010),
some subjects were not assigned to play any video game, but were instead made to wait in a
room for 45 minutes due to a purported computer error. This control condition does not seem
BAYESIAN REANALYSIS OF VIOLENT MEDIA 24
relevant to our hypothesis; therefore, we compare only those subjects who were randomly
assigned to play a violent or nonviolent video game. In Tear and Nielsen (2014), participants
were assigned to play a nonviolent, violent, or extremely violent game; we treat the violent and
extremely violent groups as a single, combined group. The reader is advised that our exclusion of
conditions causes a loss of sample size and will necessarily move the Bayes Factor closer to 1
than if we had used the full sample, but we cannot calculate a Bayes Factor on the basis of
hypothesis-irrelevant data.
Findings are summarized in Table 3. We find that, among these null results, the strength
of evidence for the null varies substantially. In studies with small sample sizes (Ferguson et al.,
2008, Study 1; Adachi & Willoughby, 2011, Study 1 and 2), evidence for the null in each
experiment is slight. In contrast, studies with larger sample sizes (Ivory & Kalyanaraman, 2007,
aggressive cognition; Przybylski et al., 2014, Study 1, 2, and 5; Tear & Nielsen, 2014), provide
stronger evidence for the null. Finally, in cases where effect sizes were close to d = 0.43 but the
confidence interval failed to exclude zero, we do not interpret the study as disproving HA3 in
favor of H0. Bayes factors recognize that d = 0.41 much more closely resembles δ = 0.43 than it
does δ = 0. Thus, re-examination of the reported effect of violent game content in Elson et al.
(2013) indicates one agnostic result (effects on mean noise duration) and one moderately
informative replication (effects on mean noise intensity). The non-significant result has been
misinterpreted as support for the null when instead the evidence supports the alternative.
Slight evidence of a difference between means was similarly misinterpreted as evidence
for the null hypothesis in Valadez and Ferguson (2012). In this study, participants’ hostile
feelings were measured before and after playing one of three games: a late-game section of Red
Dead Redemption (the violent condition), an early-game section of Red Dead Redemption (one
BAYESIAN REANALYSIS OF VIOLENT MEDIA 25
non-violent control condition), and FIFA (a second non-violent control condition). Participants’
aggressive affect decreased from pre-test to post-test overall, F(1,94) = 8.15, p = .01. The authors
then examined the time (pre-, post) × game (active, controls 1 & 2) interaction to determine
whether game condition affected aggressive feelings. As the test statistic was not significant,
F(1, 94) = 3.11, p = .09, d = 0.35, the authors argued positive evidence for the null hypothesis.
On the contrary, there is little evidence one way or the other, and if one expected a post-test
difference between conditions on the scale of meta-analytic estimate of the effects of violent
games on aggressive affect (d = 0.61, [0.52, 0.72], Anderson et al., 2010), the data favor a
difference, not an equivalence, at 1-to-1.9 odds.
Of course, this difference appears in the context of an overall pre-post decrease, and as
detailed in our section on pilot-testing, may involve substantial confounds. Future research could
explore the possibility of decreased aggressive affect in both violent and nonviolent video game
use through application of repeated measures designs to determine whether purported increases
caused by violent games instead reflect smaller decreases. For the purposes of the current
manuscript, our point is simply that an argument for no difference based on p > .05 risks
mislabeling the available evidence.
In summary, while all nonsignificant findings receive the same uninformative “failure-to-
reject” decision in NHST, a Bayesian analysis provides a more nuanced perspective by providing
a quantification of continuous amounts of evidence for or against the null relative to selected
alternatives. Attention to the strength of evidence will help researchers to determine whether they
have evidence of no effect, evidence of an effect, or inconclusive evidence. This evidence tells
researchers whether a research finding has been replicated, an effect has been disconfirmed, or a
boundary of the phenomenon has been reached.
BAYESIAN REANALYSIS OF VIOLENT MEDIA 26
Bayes Factor Is Still Influenced by Researcher Flexibility
We describe above how Elson et al. (2013) seem to have found evidence for the theorized
effect despite their original argument for the null. In our correspondence with these authors, they
asked that we consider their criticism that the Competitive Reaction Time Task measure of
aggression used in this and other studies can be quantified flexibly, potentially allowing
researchers to selectively report the quantification with the biggest effect size or the smallest p-
value (Elson, Mohseni, Breuer, Scharkow, & Quandt, 2014). In the Competitive Reaction Time
Task, participants administer blasts of noise to another participant, selecting the noise and
intensity of the noise blast. Elson and colleagues point out that, in this literature, this particular
measure is quantified in many different ways across studies: mean intensity, mean duration,
standardized sum of intensity and duration, product of intensity and duration, count of high-
intensity trials, first-trial intensity, and more. They suggest that researchers may inspect several
different quantifications until one yields statistical significance, then censor the nonsignificant
results from report. Bayesian model comparison is not immune to these problems, as Bayes
factors are still a function of the data and thus still susceptible to flexibility in quantification or
censorship in report.
To support their argument, Elson et al. (2014) demonstrated that the same experiment can
yield substantially various effect sizes and p-values depending on which quantification strategy
is used. In the same way, the obtained B03 varies substantially depending on the quantification: if
mean intensity is used, B03 favors the alternative, 1-to-5, but if mean duration is used, B03 favors
neither hypothesis, 1-to-1. We examine these fluctuations in Bayes factor across quantification
strategy in Table 4. As Elson et al. (2014) had noticed, various quantification strategies yielded
effect sizes ranging from ω = −.32 (count of low-volume trials, here reported as negative, as it is
BAYESIAN REANALYSIS OF VIOLENT MEDIA 27
in the direction opposite to that hypothesized) to ω = .00 (first-trial volume) to ω = .39 (count of
high-volume trials). Similarly, B03 ranges from 1400-to-1 (count of low-volume trials) to 3.5-to-1
(first-trial volume) to 1-to-280 (count of high-volume trials). To minimize potential flexibility in
quantification, we suggest that researchers preregister their primary study outcomes, share the
raw task data, and provide evidence of the validity of particular quantifications, when possible.
Summary
Although many of the studies analyzed were claimed by p > .05 to support a null violent-
content video-game effect, the evidence varied considerably. Some studies provided strong
evidence for the null, others provided only slight evidence for the null, and still others actually
provided some evidence for the hypothesized phenomenon. As in the pilot testing example
above, failure to reject the null does not necessarily constitute evidence in favor of the null and
may instead represent insufficient sample size. Even when sample sizes are sufficient, a
principled quantification is needed to express the strength of evidence for or against the null
relative to a reasonable and meaningful alternative hypothesis. This principled quantification
may be accomplished by the application of Bayesian model comparison techniques presented by
Rouder and Morey (2012), Rouder et al. (2012), and Dienes (2011, 2014).
Reanalysis indicates that some null findings have substantial evidence, while others have
less. Results from Przybylski et al. (2014) provide a sizable Bayes factor value for B03, indicating
that the effect of violent games on aggressive affect is more likely to be zero than it is to be that
estimated in previous meta-analysis so long as experimental control is maintained over feelings
of competence. On the other hand, Bayes factor values of B03 from Adachi and Willoughby
(2011) are modest. A larger experiment might be necessary to more firmly establish that
aggressive behavior is influenced by competitive rather than violent game content. Attention to
BAYESIAN REANALYSIS OF VIOLENT MEDIA 28
the strength of evidence may aid in theory development, indicating where evidence of boundary
conditions is strong and where evidence is less certain.
Finally, Bayesian analysis is not a panacea for all difficulties in analysis and reporting. It
is a function of the data and cannot address concerns about selective reporting. When data are
selectively reported according to the hypothesis they support, Bayes factor will be biased. It is
thereby important that all studies be reported. We further urge researchers to pre-register their
hypotheses and analytic strategies, including their method of CRTT quantification. A thorough
and systematic validation of the noise-blast CRTT may be helpful in choosing a preferred
quantification.
Discussion
Making principled and coherent arguments for the null hypothesis is a crucial part of the
scientific process. In violent media research, the null hypothesis is of critical importance in
matching stimulus materials in pilot testing and in demonstrating the boundary conditions or
absence of an effect of violent media. Despite this importance, traditional statistical practices
cannot be used to support the null, at least not in a coherent fashion.
As an alternative, we suggest Bayesian model comparison, which allows for fair and
inferentially-consistent tests between the null hypothesis and reasonable alternative hypotheses.
Our re-analysis found that research in this area would benefit from larger samples and more
finely-graded interpretations of results. Inspection of select pilot studies found that few provided
much evidence of matching, and some even provided evidence of confounding differences
between game stimuli. These results indicate that pilot tests often fail in their intended purpose
and that violent and nonviolent game stimuli used in research may not be well-matched. Larger
BAYESIAN REANALYSIS OF VIOLENT MEDIA 29
samples would provide stronger evidence, and Bayesian analysis would provide more nuanced,
less dichotomous results.
In similar fashion, main study results argued to show no effect of violent game content
were found to vary substantially in the strength of evidence for the null. In two cases, a p-value
very close to the critical threshold was presented as evidence of no difference (Elson et al., 2013;
Valadez & Ferguson, 2012); re-evaluation of these reports indicates instead some evidence of a
difference between groups. We applaud and encourage research efforts in this area which strive
to test the boundaries and causal substrates of the effects (if any) of violent games on aggressive
thoughts, feelings, and behavior. However, such research efforts will likely require larger sample
sizes to provide sufficiently compelling evidence.
Other Approaches to Support the Null
We note that Bayesian analysis is not the only way to provide evidence for the null
hypothesis relative to some alternative. One option is to perform a significance test against a
second point hypothesis of some effect. For example, when failing to detect an anticipated effect,
one could test against the expected effect size θ0 with the secondary point hypothesis H02: δ = θ0,
where θ0 is a previously-reported effect size or an effect size necessary for some level of
statistical power. If the study retains H0 while rejecting H02, it could be argued that the study data
are sufficiently unlikely given that the true effect size is θ0 (e.g., Simonsohn, Simmons, &
Nelson, 2014). For example, if a study estimates the effect of violent games on aggressive
behavior as d = 0.06, [−0.25, 0.37], one might say that the result is improbable (p < .05) if the
true effect size were δ = 0.43.
However, this approach yields dichotomous inferences, and so it cannot discriminate
between no evidence, a little evidence, and a lot of evidence. The problems of dichotomous test
BAYESIAN REANALYSIS OF VIOLENT MEDIA 30
results are particularly salient when one considers how slight changes in p-value lead to opposite
conclusions, such as how the null is rejected at p = .049 but the null is retained at p = .051.
NHST also cannot handle small amounts of evidence well. Given slight evidence, either the null
is retained and the slight evidence is mislabeled as no evidence at all, or the null is rejected and
the effect size is grossly misestimated. Finally, this approach only accepts a single point value δ0
as the hypothesis. This is too constraining; there are often a range of values that are probable
given a hypothesis.
Among the studies that we reanalyzed, many had CIs that included the meta-analytic
estimate (Table 3). Application of this significance test, then, would report that these studies
were simply uninformative. Our Bayesian analysis indicates instead that there is some evidence,
even if it is not strong enough to be “statistically significant.”
A second alternative is to quantify the effect size and its confidence interval (ESCI). This
approach has the advantage relative to NHST of being continuous in quantification. However,
ESCI provides neither quantifiable nor inferentially consistent statistics (see Morey, Rouder,
Verhagen, & Wagenmakers, 2014), and when making inferences using ESCI, researchers seem
to mentally convert them to NHST anyway (Hoekstra, Morey, Rouder, & Wagenmakers, 2014).
Although it is true that values near the ends of the confidence interval are less likely, one cannot
know exactly how much less likely they are. Similarly, a wide CI indicates that more samples
would be necessary to provide a more precise estimate of the effect size, but there is no way of
knowing at what point the CI becomes sufficiently precise for inference. ESCI is a useful
descriptive tool but does not permit inferences about the strength of evidence.
Practical Recommendations
BAYESIAN REANALYSIS OF VIOLENT MEDIA 31
We offer some practical recommendations to improve pilot testing and primary tests of
hypotheses in this literature. First, we note that it may not be feasible to pilot test and match
game stimuli to necessary precision. Because the hypothesis-relevant effects of violent game
content are hypothesized to be small, hypothesis-irrelevant confounds must be controlled for on a
similarly small scale. Because an alternative hypothesis of such small scale closely resembles the
null, large amounts of data are likely to be necessary to disentangle the two. Worse, collection of
a large sample does not guarantee that the Bayes factor indeed will favor the null. One could
potentially invest many subjects in such a test only to find that the games are not well matched.
As an alternative to pilot testing commercially-available games for equivalence, we
instead favor the approach of software modification. In this approach, researchers take an
existing game and modify it with software tools so that the core game is the same, but the
construct of interest varies across conditions (see Elson & Quandt, 2014). It is not unlike
adjusting the parameters of a computer task’s script to observe the parameters’ effects on
participants’ behavior. The unmodified portions of the game’s code are kept identical between
versions. Because games developed in this way are more obviously matched, it requires less pilot
evidence to conclude that they are indeed matched, and if such evidence is sought, it is more
likely to be obtained. One such manipulation, which involves identical game files which vary in
violent content and in the difficulty of gameplay, has been made publicly available for use on
OSF (Hilgard, 2014).
However, such homemade game modifications may have their limits. It will be infeasible
to make professional-quality game modifications with graphics, gameplay, and acting on par
with some modern popular video games. Although research suggests that graphical fidelity is not
an important moderator of game effects (Barlett, Rodeheffer, Baldassaro, Hinkin, & Harris,
BAYESIAN REANALYSIS OF VIOLENT MEDIA 32
2008; Ivory & Kalyanaraman, 2007), it is possible that such homemade games do not capture the
full real-world phenomenon of video gaming.
As a second practical recommendation, we ask that researchers consider strategies to
increase sample size. Effects in this research domain are hypothesized to be small, and so large
samples will be necessary to discriminate effectively between the null and alternative
hypotheses. To collect larger pilot samples, pilot tests might be conducted as an appendix to
another experiment. However, primary study outcomes will remain time-consuming to detect. It
is possible that some effects are too small to be feasibly studied in single-institution experiments.
Multi-site investigations could help to increase sample sizes.
Antagonistic multi-site collaborations could be especially productive and may alleviate
concerns of differences in bias or competence across research teams. In other research areas,
some researchers are already conducting such preregistered antagonistic collaborations, agreeing
to collect data until a sufficiently large Bayes factor is obtained in support of one hypothesis over
the other (e.g., Matzke et al., 2015). Because the conditions of such experiments are agreed to in
advance by both skeptics and proponents, these provide a fair and informative test of a
hypothesis.
Better Research through Bayes
We close with an optimistic thought about how Bayesian analysis might further shape the
scientific process. It is well understood that, historically, papers finding significant (p < .05)
effects are more likely to be published than are papers without significant effects (Atkinson,
Furlong, & Wampold, 1982; Cooper, DeNeve, & Charlton, 1997; McDaniel, Rothstein, &
Whetzel, 2006). This process is thought to contribute to publication bias, in that only research
obtaining p < .05 gets published, and questionable research practices, in that researchers muss
BAYESIAN REANALYSIS OF VIOLENT MEDIA 33
with their results until the necessary p < .05 threshold is reached. Both of these processes will
lead to overestimated effect sizes and the propagation of Type I errors. With Bayes factors, there
is no such dichotomization or sufficient threshold; instead, evidence is collected and its strength
reported. Acceptance of evidence as a continuous quantity may, we hope, reduce journals’ and
researchers’ preference for results that just pass an arbitrary threshold that unjustly separates
“sufficient evidence” from “insufficient evidence.” By assessing the finely-quantified weight of
evidence for each argument from each experiment, we can reach a greater understanding of what
is certain, what is uncertain, where evidence is truly contradictory, and where we are arguing
over sampling error.
Code and Materials
All R code used to generate the statistics, tables, and figures is freely available at
https://github.com/Joe-Hilgard/VG2-Bayes.
BAYESIAN REANALYSIS OF VIOLENT MEDIA 34
References
Adachi, P. J. C., & Willoughby, T. (2011). The effects of video game competition and violence on
aggressive behavior: Which characteristic has the greatest influence? Psychology of Violence, 1
(4), 259-274. DOI: 10.1037/a0024908
Anderson, C. A., & Anderson, K. B. (1996). Violent crime rate studies in philosophical context: A
destructive testing approach to heat and southern culture of violence effects. Journal of
Personality and Social Psychology, 70 (4), 740-756. DOI: 10.1037/0022-3514.70.4.740
Anderson, C. A., & Carnagey, N. L. (2009). Causal effects of violent sports video games on aggression:
Is it competitiveness or violent content? Journal of Experimental Social Psychology, 45 (4), 731-
739. DOI: 10.1016/j.jesp.2009.04.019
Anderson, C. A., Carnagey, N. L., Flanagan, M., Benjamin, J., A. J., Eubanks, J., & Valentine, J. C.
(2004). Violent video games: Specific effects of violent content on aggressive thoughts and
behavior. Advances in Experimental Social Psychology, 36, 199-249. Retrieved from
http://www.researchgate.net/profile/Arlin_Benjamin_Jr/publication/237308783_Violent_video_g
ames_Specific_effects_of_violent_content_on_aggressive_thoughts_and_behavior/links/0a85e5
3b5fa8eb0e0e000000.pdf
Anderson, C. A., & Dill, K. E. (2000). Video games and aggressive thoughts, feelings, and behavior in
the laboratory and in life. Journal of Personality and Social Psychology, 75 (4), 772-790. DOI:
10.1037/0022-3514.78.4.772
Anderson, C. A., Shibuya, A., Ihori, N., Swing, E. L., Bushman, B. J., Sakamoto, A., . . . Saleem, M.
(2010). Violent video game effects on aggression, empathy, and prosocial behavior in eastern
BAYESIAN REANALYSIS OF VIOLENT MEDIA 35
and western countries: A meta-analytic review. Psychological Bulletin, 136 (2), 151-173. DOI:
10.1037/a0018251
Arriaga, P., Esteves, F., Carneiro, P., & Monteiro, M. B. (2008). Are the effects of Unreal violent video
games pronounced when playing with a virtual reality system? Aggressive Behavior, 34 (5), 521-
538. DOI: 10.1002/ab.20272
Atkinson, D. R., Furlong, M. J., & Wampold, B. E. (1982, March). Statistical significance, reviewer
evaluations, and the scientific process: Is there a (statistically) significant relationship? Journal
of Counseling Psychology, 29 (2), 189-194. DOI: 10.1037/0022-0167.29.2.189
Barlett, C., Rodeheffer, C. D., Baldassaro, R., Hinkin, M. P., & Harris, R. J. (2008). The effect of
advances in video game technology and content on aggressive cognitions, hostility, and heart
rate. Media Psychology, 11 (4), 540-565. DOI: 10.1080/15213260802492018
Bartholow, B. D., & Anderson, C. A. (2002). Effects of violent video games on aggressive behavior:
Potential sex differences. Journal of Experimental Social Psychology, 38 (3), 283-290. DOI:
10.1006/jesp.2001.1502
Bartholow, B. D., Sestir, M. A., & Davis, E. B. (2005). Correlates and consequences of exposure to
video game violence: Hostile personality, empathy, and aggressive behavior. Personality and
Social Psychology Bulletin, 31 (11), 1573-1586. Retrieved from DOI:
10.1177/0146167205277205
Berger, J. O., & Delampady, M. (1987). Testing precise hypotheses. Statistical Science, 2 (3), 317-335.
Retrieved from http://www.jstor.org/pss/2245772
Boekel, W., Wagenmakers, E.-J., Belay, L., Verhagen, J., Brown, S., & Forstmann, B. U. (2014). A
purely confirmatory replication study of structural brain-behavior correlation. Cortex. Retrieved
from http://newcl.org/publications/boekel-cortex.pdf
BAYESIAN REANALYSIS OF VIOLENT MEDIA 36
Bushman, B. J., & Anderson, C. A. (2002). Violent video games and hostile expectations: A test of the
general aggression model. Personality and Social Psychology Bulletin, 28 (12), 1679-1686. DOI:
10.1177/014616702237649
Bushman, B. J., & Anderson, C. A. (2009). Comfortably numb: Desensitizing effects of violent media
on helping others. Psychological Science, 20 (3), 273-277. DOI: 10.1111/j.1467-
9280.2009.02287.x
Carnagey, N. L., Anderson, C. A., & Bushman, B. J. (2007). The effect of video game violence on
physiological desensitization to real-life violence. Journal of Experimental Social Psychology,
43 (3), 489-496. DOI: 10.1016/j.jesp.2006.05.003
Cooper, H., DeNeve, K., & Charlton, K. (1997, December). Finding the missing science: The fate of
studies submitted for review by a human subjects committee. Psychological Methods, 2 (4), 447-
452. DOI: 10.1037/1082-989X.2.4.447
Dienes, Z. (2011). Bayesian versus orthodox statistics: Which side are you on? Perspectives on
Psychological Science, 6, 274-290. DOI: 10.1177/1745691611406920
Dienes, Z. (2014). Using Bayes to get the most out of non-significant results. Frontiers in
Quantitative Psychology and Assessment. DOI: 10.3389/fpsyg.2014.00781
Edwards, W., Lindman, H., & Savage, L. J. (1963). Bayesian statistical inference for psychological
research. Psychological Review, 70, 193-242. DOI: 10.1037/h0044139
Elson, M., Bruer, J., Van Looy, J., Kneer, J., & Quandt, T. (2013). Comparing apples and oranges?
Evidence for pace of action as a confound in research on digital games and aggression.
Psychology of Popular Media Culture, 4, 112-125. DOI: 10.1037/ppm0000010
Elson, M., Mohseni, M. R., Breuer, J., Scharkow, M., & Quandt, T. (2014). Press CRTT to
BAYESIAN REANALYSIS OF VIOLENT MEDIA 37
measure aggressive behavior: The unstandardized use of the competitive reaction time task in aggression
research. Psychological Assessment, 26 (2), 419-432. DOI: 10.1037/a0035569
Elson, M., & Quandt, T. (2014). Digital games in laboratory experiments: Controlling a complex
stimulus through modding. Psychology of Popular Media Culture. Online first publication. DOI:
10.1037/ppm0000033
Ferguson, C. J., & Kilburn, J. (2009). The public health risks of media violence: A meta-analytic review.
The Journal of Pediatrics, 154 (5), 759-763. DOI: 10.1016/j.jpeds.2008.11.033
Ferguson, C. J., & Rueda, S. M. (2010). The Hitman study: Violent video game exposure effects on
aggressive behavior, hostile feelings, and depression. European Psychologist, 15 (2), 99-108.
DOI: 10.1027/1016-9040/a000010
Ferguson, C. J., Rueda, S. M., Cruz, A. M., Ferguson, D. E., Fritz, S., & Smith, S. M. (2008). Violent
video games and aggression: Causal relationship or byproduct of family violence and intrinsic
violence motivation? Criminal Justice and Behavior, 35 (3), 311-332. DOI:
10.1177/0093854807311719
Gallistel, C. R. (2009). The importance of proving the null. Psychological Review, 116, 439-453. DOI:
10.1037/a0015251
Gitter, S. A., Ewell, P. J., Guadagno, R. E., Stillman, T. F., & Baumeister, R. F. (2013). Virtually
justifiable homicide: The effects of prosocial contexts on the link between violent video games,
aggression, and prosocial and hostile cognition. Aggressive Behavior, 39 (5), 346-354. DOI:
10.1002/ab.21487
Greitemeyer, T., & Mügge, D. O. (2014). Video games do affect social outcomes: A meta-analytic
review of the effects of violent and prosocial video game play. Personality and Social
Psychology Bulletin, 40 (5), 578-589. DOI: 10.1177/0146167213520459
BAYESIAN REANALYSIS OF VIOLENT MEDIA 38
Hasan, Y., Bègue, L., & Bushman, B. J. (2012). Viewing the world through “blood-red tinted glasses”:
The hostile expectation bias mediates the link between violent video game exposure and
aggression. Journal of Experimental Social Psychology, 48 (4), 953-956. DOI:
10.1016/j.jesp.2011.12.019
Hilgard, J. (2014). Hilgard’s modified video game paradigm. Retrieved from https://osf.io/3cb9m/
(Modified ZDoom .wad files for manipulating video game violence and difficulty)
Hoekstra, R., Morey, R. D., Rouder, J. N., & Wagenmakers, E.-J. (2014). Robust misinterpretation of
confidence intervals. Psychonomic Bulletin & Review, 21 (5), 1157-1164. DOI: 10.3758/s13423-
013-0572-3
Ivory, J. D., & Kalyanaraman, S. (2007, September). The effects of technological advancement and
violent content in video games on players’ feelings of presence, involvement, physiological
arousal, and aggression. Journal of Communication, 57 (3), 532-555. DOI: 10.1111/j.1460-
2466.2007.00356.x
Jeffreys, H. (1961). Theory of probability (3rd edition). New York: Oxford University Press.
Laplace, P. S. (1986). Memoir on the probability of the causes of events. Statistical Science, 1 (3), 364–
378. Retrieved from http://www.jstor.org/stable/2245476
Liang, F., Paulo, R., Molina, G., Clyde, M. A., & Berger, J. O. (2008). Mixtures of g-priors for Bayesian
variable selection. Journal of the American Statistical Association, 103 , 410-423. DOI:
10.1198/016214507000001337
Matzke, D., Nieuwenhuis, S., van Rijn, H., Slagter, H. A., van der Molen, M. W., & Wagenmakers, E.-J.
(2015). The effect of horizontal eye movements on free recall: A preregistered adversarial
collaboration. Journal of Psychology: General, 144 (1), e1-e15. DOI: 10.1037/xge0000038
BAYESIAN REANALYSIS OF VIOLENT MEDIA 39
McDaniel, M. A., Rothstein, H. R., & Whetzel, D. L. (2006). Publication bias: A case study of four test
vendors. Personnel Psychology, 59 (4), 927-953. DOI: 10.1111/j.1744-6570.2006.00059.x
Miller, G. A., & Chapman, J. P. (2001). Misunderstanding analysis of covariance. Journal of Abnormal
Psychology, 110 (1), 40-48. DOI: 10.1037/0021-843X.110.1.40
Morey, R. D., & Rouder, J. N. (2011). Bayes factor approaches for testing interval null hypotheses.
Psychological Methods, 16, 406-419. DOI: 10.1037/a0024377
Morey, R. D., & Rouder, J. N. (2014). Bayesfactor: Computation of Bayes factors for common designs.
Retrieved from http://CRAN.R-project.org/package=BayesFactor (R package version 0.9.9)
Morey, R. D., Rouder, J. N., Verhagen, J., & Wagenmakers, E.-J. (2014). Why hypothesis tests are
essential for psychological science: A comment on Cumming. Psychological Science, 1289-
1290. DOI: 10.1177/0956797614525969
Prot, S., & Anderson, C. A. (2013). Research methods, design, and statistics in media psychology. In K.
E. Dill (Ed.), p. 109-136. Oxford University Press.
Przybylski, A. K., Deci, E. L., Rigby, C. S., & Ryan, R. M. (2014). Competence-impeding electronic
games and players’ aggressive feelings, thoughts, and behaviors. Journal of Personality and
Social Psychology, 106 (3), 441-457. DOI: 10.1037/a0034820
Raftery, A. E. (1995). Bayesian model selection in social research. Sociological Methodology, 25, 111-
163. DOI: 10.2307/271063
Rouder, J. N. (2014). Optional stopping: No problem for Bayesians. Psychonomic Bulletin & Review,
21, 301-308. DOI: 10.3758/s13423-014-0595-4
Rouder, J. N., & Morey, R. D. (2011). A Bayes factor meta-analysis of Bem’s ESP claim. Psychonomic
Bulletin & Review, 18, 682-689. DOI: 10.3758/s13423-011-0088-7
BAYESIAN REANALYSIS OF VIOLENT MEDIA 40
Rouder, J. N., & Morey, R. D. (2012). Default Bayes factors for model selection in regression.
Multivariate Behavioral Research, 47, 877-903. DOI: 10.1080/00273171.2012.734737
Rouder, J. N., Morey, R. D., Speckman, P. L., & Province, J. M. (2012). Default Bayes factors for
ANOVA designs. Journal of Mathematical Psychology, 56, 356-374. DOI:
10.1016/j.jmp.2012.08.001
Rouder, J. N., Speckman, P. L., Sun, D., Morey, R. D., & Iverson, G. (2009). Bayesian t-tests for
accepting and rejecting the null hypothesis. Psychonomic Bulletin and Review, 16, 225-237.
DOI: 10.3758/PBR.16.2.225
Royall, R. (1997). Statistical evidence: A likelihood paradigm. New York: CRC Press.
Sestir, M. A., & Bartholow, B. D. (2010). Violent and nonviolent video games produce opposing effects
on aggressive and prosocial outcomes. Journal of Experimental Social Psychology, 46 (6), 934-
942. DOI: 10.1016/j.jesp.2010.06.005
Sherry, J. L. (2001). The effects of violent video games on aggression. Human Communication
Research, 27 (3), 409-431. DOI: 10.1111/j.1468-2958.2001.tb00787.x
Simmons, J. P., Nelson, L. D., & Simonsohn, U. (2011). False-positive psychology: Undisclosed
flexibility in data collection and analysis allows presenting anything as significant. Psychological
Science, 22, 1359–1366. DOI: 10.1177/0956797611417632
Simonsohn, U., Simmons, J. P., & Nelson, L. D. (2014). Anchoring is not a false-positive: Maniadis,
Tufano, and List’s (2014) ‘failure-to-replicate’ is actually entirely consistent with the original.
Available at SSRN: http://dx.doi.org/10.2139/ssrn.2351926.
Tear, M. J., & Nielsen, M. (2014, December). Video games and prosocial behavior: A study of the
effects of non-violent, violent and ultra-violent gameplay. Computers in Human Behavior, 41, 8-
13. DOI: 10.1016/j.chb.2014.09.002
BAYESIAN REANALYSIS OF VIOLENT MEDIA 41
Valadez, J. J., & Ferguson, C. J. (2012). Just a game after all: Violent video game exposure and time
spent playing effects on hostile feelings, depression, and visuospatial cognition. Computers in
Human Behavior, 28, 608-616. DOI: 10.1016/j.chb.2011.11.006
Wagenmakers, E.-J. (2007). A practical solution to the pervasive problem of p values. Psychonomic
Bulletin and Review, 14, 779-804. DOI: 10.3758/BF03194105
Zellner, A., & Siow, A. (1980). Posterior odds ratios for selected regression hypotheses. In J. M.
Bernardo, M. H. DeGroot, D. V. Lindley, & A. F. M. Smith (Eds.), Bayesian statistics:
Proceedings of the First International Meeting held in Valencia (Spain) (pp. 585–603).
University of Valencia.
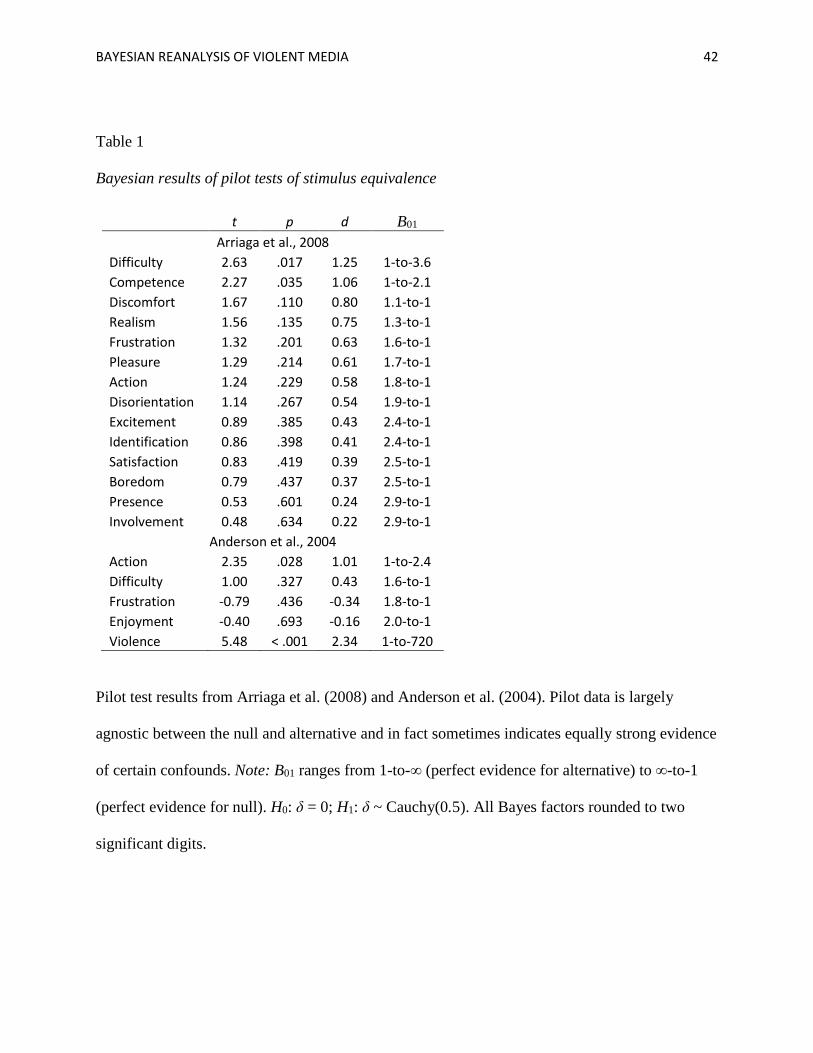
BAYESIAN REANALYSIS OF VIOLENT MEDIA 42
Table 1
Bayesian results of pilot tests of stimulus equivalence
t p d B01
Arriaga et al., 2008
Difficulty 2.63 .017 1.25 1-to-3.6
Competence 2.27 .035 1.06 1-to-2.1
Discomfort 1.67 .110 0.80 1.1-to-1
Realism 1.56 .135 0.75 1.3-to-1
Frustration 1.32 .201 0.63 1.6-to-1
Pleasure 1.29 .214 0.61 1.7-to-1
Action 1.24 .229 0.58 1.8-to-1
Disorientation 1.14 .267 0.54 1.9-to-1
Excitement 0.89 .385 0.43 2.4-to-1
Identification 0.86 .398 0.41 2.4-to-1
Satisfaction 0.83 .419 0.39 2.5-to-1
Boredom 0.79 .437 0.37 2.5-to-1
Presence 0.53 .601 0.24 2.9-to-1
Involvement 0.48 .634 0.22 2.9-to-1
Anderson et al., 2004
Action 2.35 .028 1.01 1-to-2.4
Difficulty 1.00 .327 0.43 1.6-to-1
Frustration -0.79 .436 -0.34 1.8-to-1
Enjoyment -0.40 .693 -0.16 2.0-to-1
Violence 5.48 < .001 2.34 1-to-720
Pilot test results from Arriaga et al. (2008) and Anderson et al. (2004). Pilot data is largely
agnostic between the null and alternative and in fact sometimes indicates equally strong evidence
of certain confounds. Note: B01 ranges from 1-to-∞ (perfect evidence for alternative) to ∞-to-1
(perfect evidence for null). H0: δ = 0; H1: δ ~ Cauchy(0.5). All Bayes factors rounded to two
significant digits.
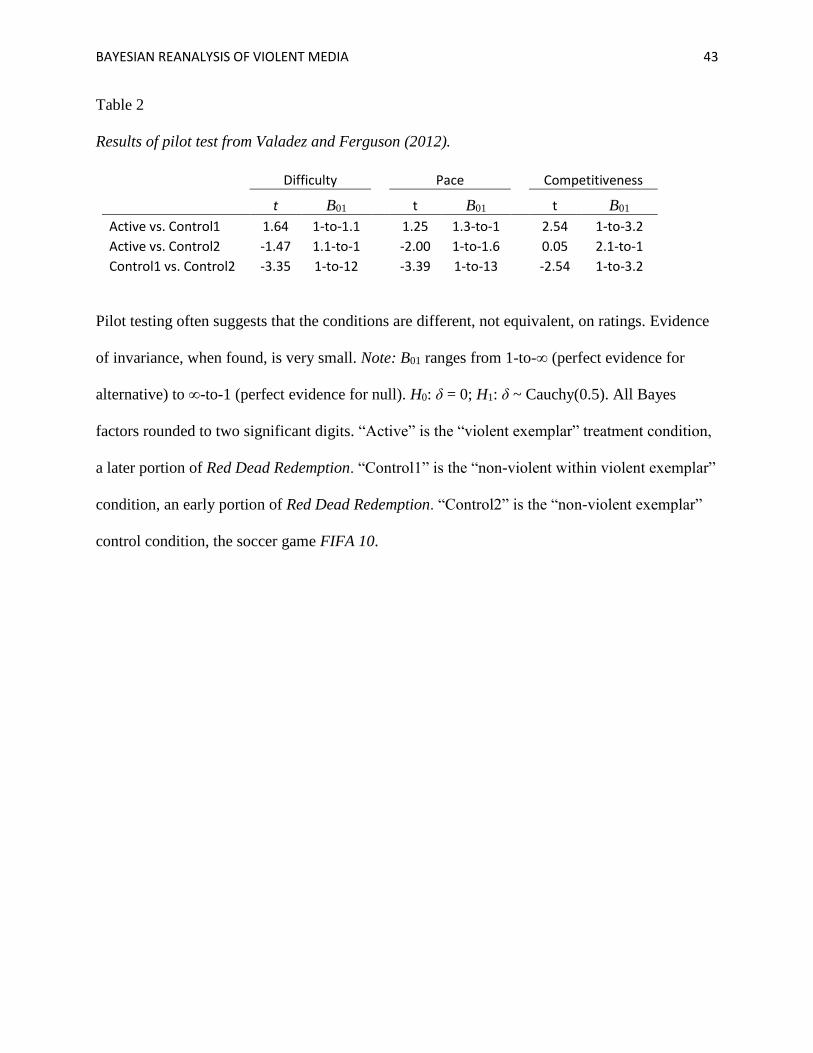
BAYESIAN REANALYSIS OF VIOLENT MEDIA 43
Table 2
Results of pilot test from Valadez and Ferguson (2012).
Difficulty Pace Competitiveness
t B01 t B01 t B01
Active vs. Control1 1.64 1-to-1.1 1.25 1.3-to-1 2.54 1-to-3.2
Active vs. Control2 -1.47 1.1-to-1 -2.00 1-to-1.6 0.05 2.1-to-1
Control1 vs. Control2 -3.35 1-to-12 -3.39 1-to-13 -2.54 1-to-3.2
Pilot testing often suggests that the conditions are different, not equivalent, on ratings. Evidence
of invariance, when found, is very small. Note: B01 ranges from 1-to-∞ (perfect evidence for
alternative) to ∞-to-1 (perfect evidence for null). H0: δ = 0; H1: δ ~ Cauchy(0.5). All Bayes
factors rounded to two significant digits. “Active” is the “violent exemplar” treatment condition,
a later portion of Red Dead Redemption. “Control1” is the “non-violent within violent exemplar”
condition, an early portion of Red Dead Redemption. “Control2” is the “non-violent exemplar”
control condition, the soccer game FIFA 10.
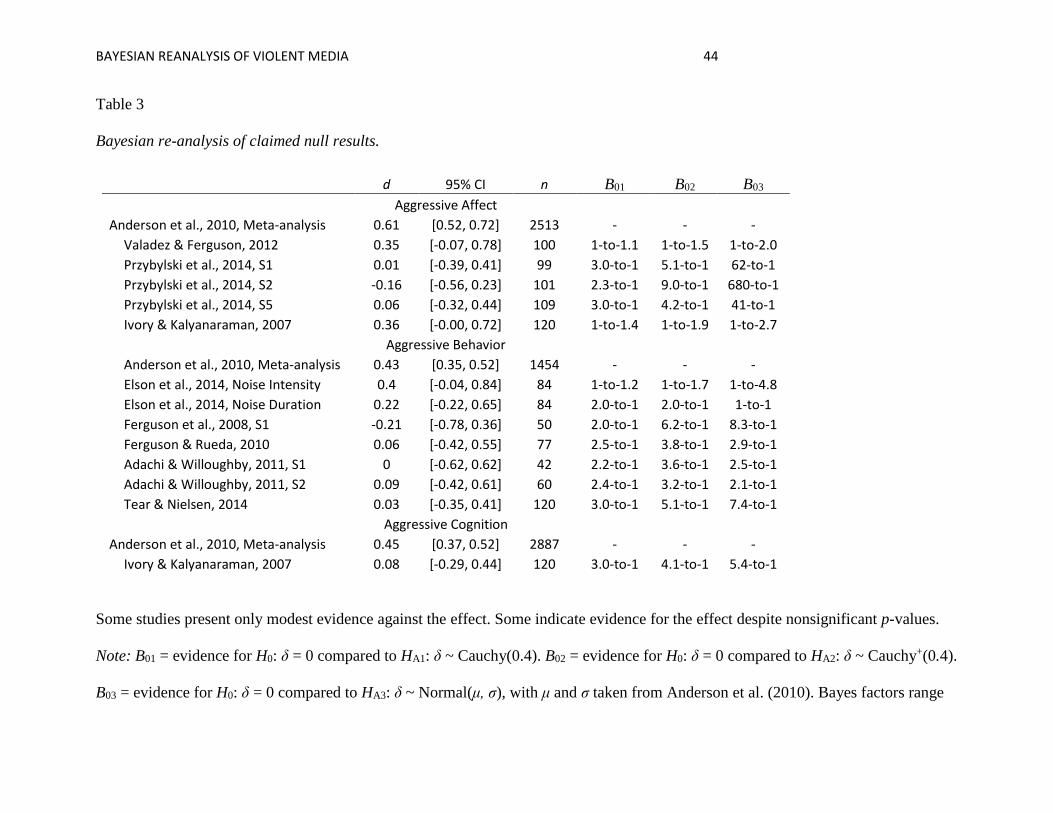
BAYESIAN REANALYSIS OF VIOLENT MEDIA 44
Table 3
Bayesian re-analysis of claimed null results.
d 95% CI n B01 B02 B03
Aggressive Affect
Anderson et al., 2010, Meta-analysis 0.61 [0.52, 0.72] 2513 - - -
Valadez & Ferguson, 2012 0.35 [-0.07, 0.78] 100 1-to-1.1 1-to-1.5 1-to-2.0
Przybylski et al., 2014, S1 0.01 [-0.39, 0.41] 99 3.0-to-1 5.1-to-1 62-to-1
Przybylski et al., 2014, S2 -0.16 [-0.56, 0.23] 101 2.3-to-1 9.0-to-1 680-to-1
Przybylski et al., 2014, S5 0.06 [-0.32, 0.44] 109 3.0-to-1 4.2-to-1 41-to-1
Ivory & Kalyanaraman, 2007 0.36 [-0.00, 0.72] 120 1-to-1.4 1-to-1.9 1-to-2.7
Aggressive Behavior
Anderson et al., 2010, Meta-analysis 0.43 [0.35, 0.52] 1454 - - -
Elson et al., 2014, Noise Intensity 0.4 [-0.04, 0.84] 84 1-to-1.2 1-to-1.7 1-to-4.8
Elson et al., 2014, Noise Duration 0.22 [-0.22, 0.65] 84 2.0-to-1 2.0-to-1 1-to-1
Ferguson et al., 2008, S1 -0.21 [-0.78, 0.36] 50 2.0-to-1 6.2-to-1 8.3-to-1
Ferguson & Rueda, 2010 0.06 [-0.42, 0.55] 77 2.5-to-1 3.8-to-1 2.9-to-1
Adachi & Willoughby, 2011, S1 0 [-0.62, 0.62] 42 2.2-to-1 3.6-to-1 2.5-to-1
Adachi & Willoughby, 2011, S2 0.09 [-0.42, 0.61] 60 2.4-to-1 3.2-to-1 2.1-to-1
Tear & Nielsen, 2014 0.03 [-0.35, 0.41] 120 3.0-to-1 5.1-to-1 7.4-to-1
Aggressive Cognition
Anderson et al., 2010, Meta-analysis 0.45 [0.37, 0.52] 2887 - - -
Ivory & Kalyanaraman, 2007 0.08 [-0.29, 0.44] 120 3.0-to-1 4.1-to-1 5.4-to-1
Some studies present only modest evidence against the effect. Some indicate evidence for the effect despite nonsignificant p-values.
Note: B01 = evidence for H0: δ = 0 compared to HA1: δ ~ Cauchy(0.4). B02 = evidence for H0: δ = 0 compared to HA2: δ ~ Cauchy+(0.4).
B03 = evidence for H0: δ = 0 compared to HA3: δ ~ Normal(μ, σ), with μ and σ taken from Anderson et al. (2010). Bayes factors range
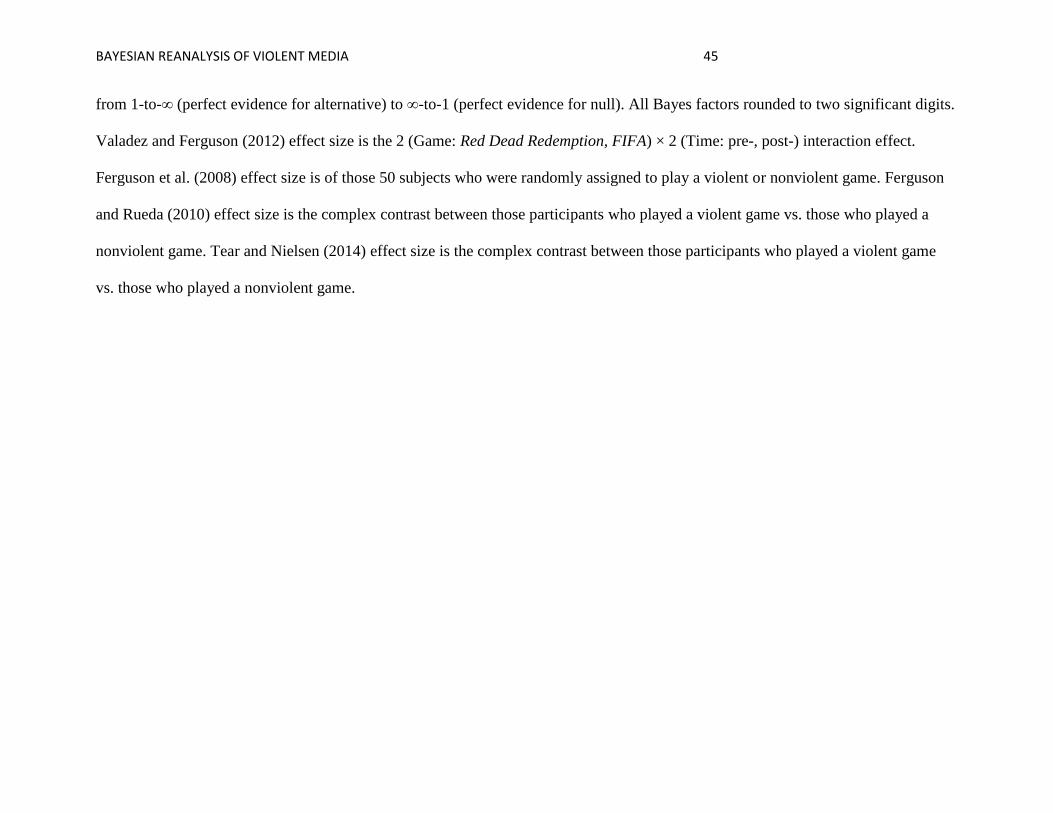
BAYESIAN REANALYSIS OF VIOLENT MEDIA 45
from 1-to-∞ (perfect evidence for alternative) to ∞-to-1 (perfect evidence for null). All Bayes factors rounded to two significant digits.
Valadez and Ferguson (2012) effect size is the 2 (Game: Red Dead Redemption, FIFA) × 2 (Time: pre-, post-) interaction effect.
Ferguson et al. (2008) effect size is of those 50 subjects who were randomly assigned to play a violent or nonviolent game. Ferguson
and Rueda (2010) effect size is the complex contrast between those participants who played a violent game vs. those who played a
nonviolent game. Tear and Nielsen (2014) effect size is the complex contrast between those participants who played a violent game
vs. those who played a nonviolent game.
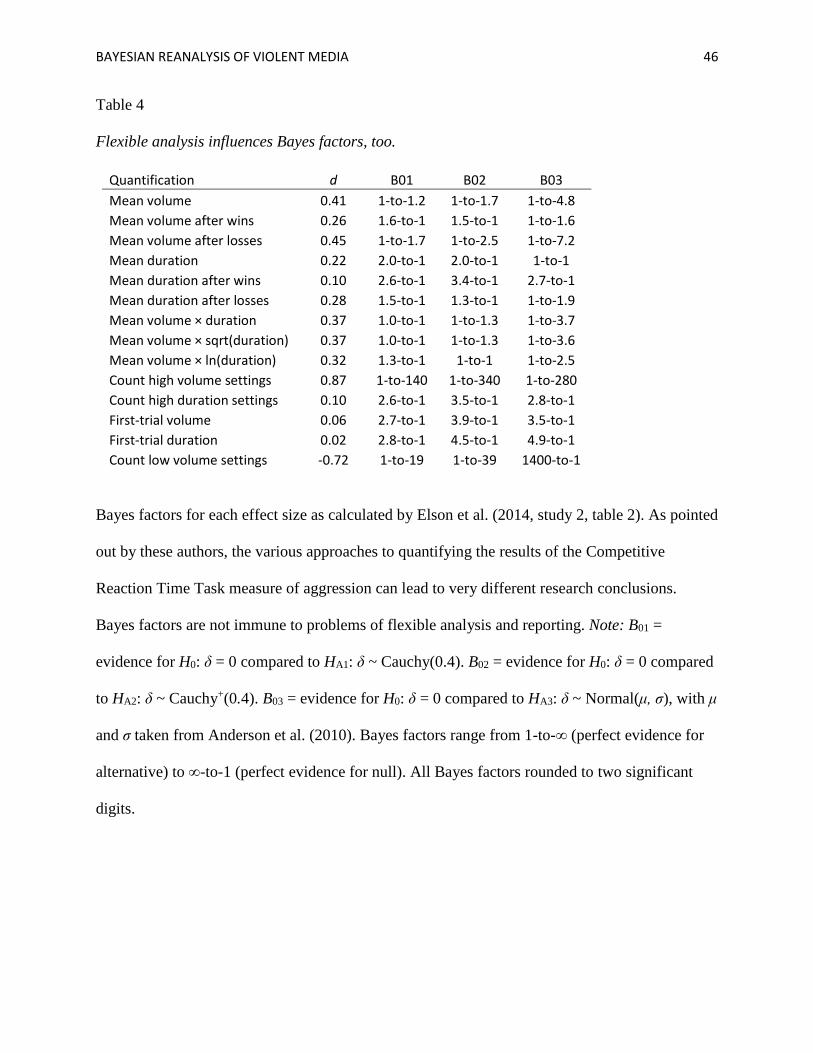
BAYESIAN REANALYSIS OF VIOLENT MEDIA 46
Table 4
Flexible analysis influences Bayes factors, too.
Quantification d B01 B02 B03
Mean volume 0.41 1-to-1.2 1-to-1.7 1-to-4.8
Mean volume after wins 0.26 1.6-to-1 1.5-to-1 1-to-1.6
Mean volume after losses 0.45 1-to-1.7 1-to-2.5 1-to-7.2
Mean duration 0.22 2.0-to-1 2.0-to-1 1-to-1
Mean duration after wins 0.10 2.6-to-1 3.4-to-1 2.7-to-1
Mean duration after losses 0.28 1.5-to-1 1.3-to-1 1-to-1.9
Mean volume × duration 0.37 1.0-to-1 1-to-1.3 1-to-3.7
Mean volume × sqrt(duration) 0.37 1.0-to-1 1-to-1.3 1-to-3.6
Mean volume × ln(duration) 0.32 1.3-to-1 1-to-1 1-to-2.5
Count high volume settings 0.87 1-to-140 1-to-340 1-to-280
Count high duration settings 0.10 2.6-to-1 3.5-to-1 2.8-to-1
First-trial volume 0.06 2.7-to-1 3.9-to-1 3.5-to-1
First-trial duration 0.02 2.8-to-1 4.5-to-1 4.9-to-1
Count low volume settings -0.72 1-to-19 1-to-39 1400-to-1
Bayes factors for each effect size as calculated by Elson et al. (2014, study 2, table 2). As pointed
out by these authors, the various approaches to quantifying the results of the Competitive
Reaction Time Task measure of aggression can lead to very different research conclusions.
Bayes factors are not immune to problems of flexible analysis and reporting. Note: B01 =
evidence for H0: δ = 0 compared to HA1: δ ~ Cauchy(0.4). B02 = evidence for H0: δ = 0 compared
to HA2: δ ~ Cauchy+(0.4). B03 = evidence for H0: δ = 0 compared to HA3: δ ~ Normal(μ, σ), with μ
and σ taken from Anderson et al. (2010). Bayes factors range from 1-to-∞ (perfect evidence for
alternative) to ∞-to-1 (perfect evidence for null). All Bayes factors rounded to two significant
digits.
BAYESIAN REANALYSIS OF VIOLENT MEDIA 47
Figure 1. Bayesian model comparison. Panel A shows two point hypotheses H0: δ = 0 and H1: δ
= 0.43. Panel B shows the probability of an observed effect size given these hypotheses and a
sample of 40 observations between two cells. Panel C shows a null hypothesis and a distributed
alternative hypothesis H1: δ ~ Cauchy(0.4). Panel D shows the probabilities of the observed
effect size given these hypotheses and a sample of 40 observations between two cells. Panels E
and F recreate Panels C and D, respectively, with a larger sample of two hundred observations.
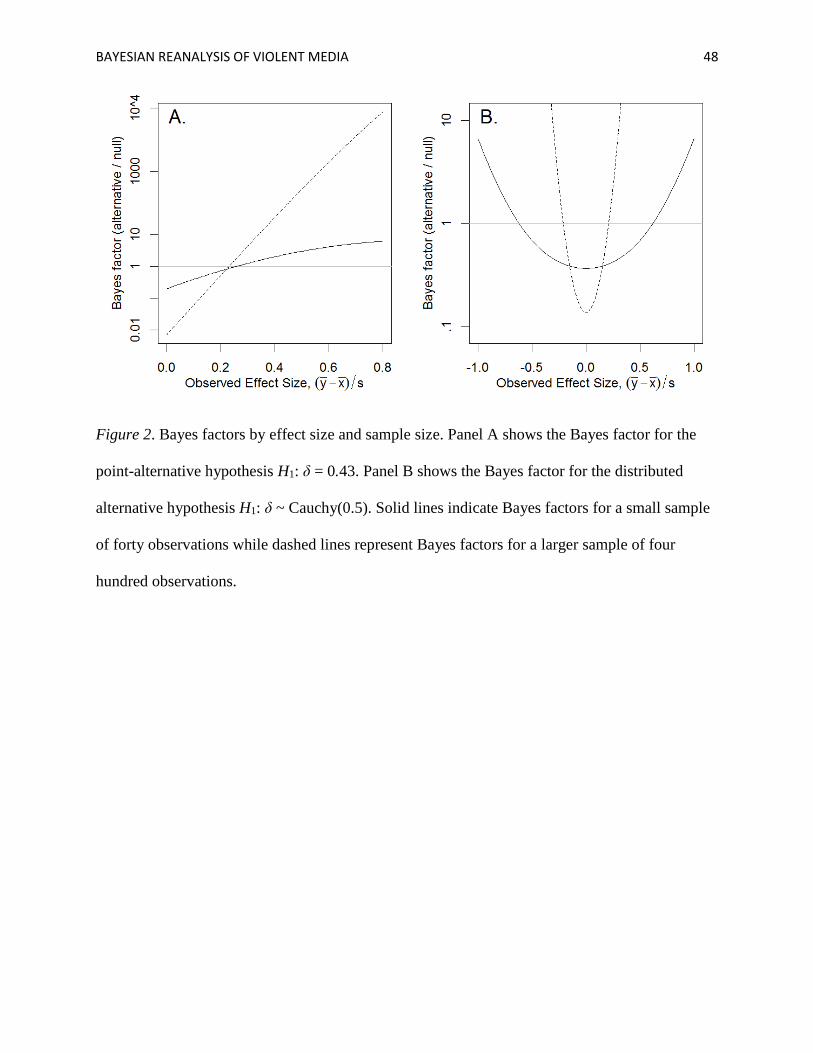
BAYESIAN REANALYSIS OF VIOLENT MEDIA 48
Figure 2. Bayes factors by effect size and sample size. Panel A shows the Bayes factor for the
point-alternative hypothesis H1: δ = 0.43. Panel B shows the Bayes factor for the distributed
alternative hypothesis H1: δ ~ Cauchy(0.5). Solid lines indicate Bayes factors for a small sample
of forty observations while dashed lines represent Bayes factors for a larger sample of four
hundred observations.
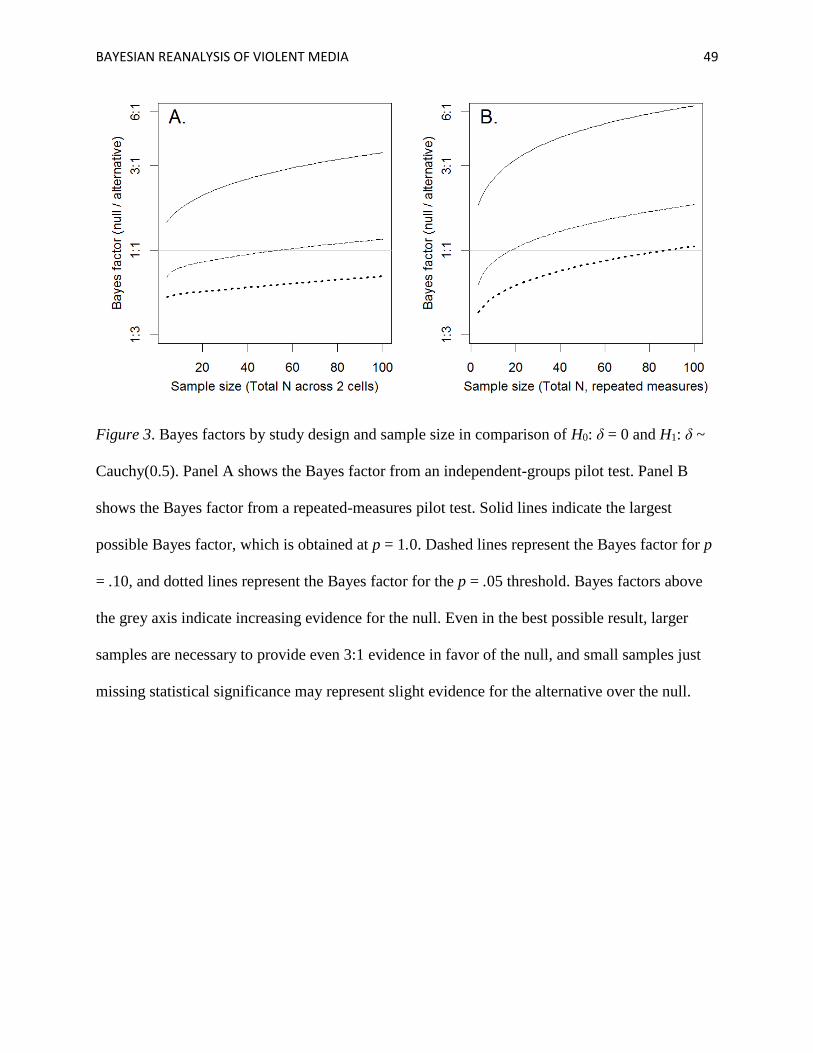
BAYESIAN REANALYSIS OF VIOLENT MEDIA 49
Figure 3. Bayes factors by study design and sample size in comparison of H0: δ = 0 and H1: δ ~
Cauchy(0.5). Panel A shows the Bayes factor from an independent-groups pilot test. Panel B
shows the Bayes factor from a repeated-measures pilot test. Solid lines indicate the largest
possible Bayes factor, which is obtained at p = 1.0. Dashed lines represent the Bayes factor for p
= .10, and dotted lines represent the Bayes factor for the p = .05 threshold. Bayes factors above
the grey axis indicate increasing evidence for the null. Even in the best possible result, larger
samples are necessary to provide even 3:1 evidence in favor of the null, and small samples just
missing statistical significance may represent slight evidence for the alternative over the null.