Embed Size (px)
Citation preview
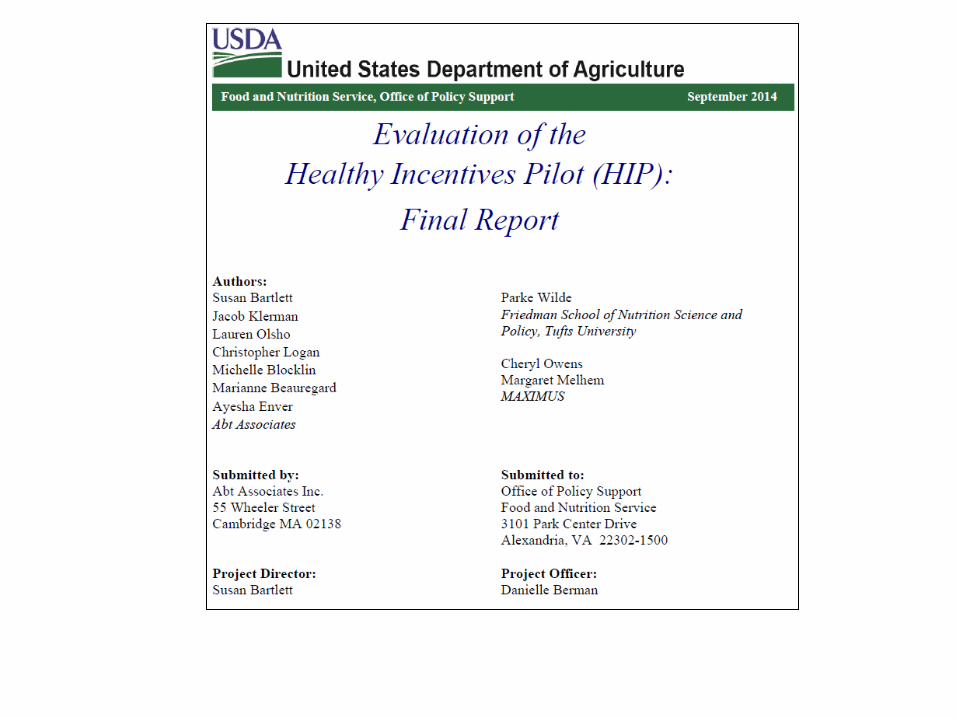
Nutrition is our Agendanutrition.tufts.edu
How Much Does a SNAP Rebate Increase
Fruit and Vegetable Consumption?
APPAM February 2, 2016
Parke Wilde, Tufts University
This presentation is the responsibility of the authors. Conclusions do not necessarily reflect the position of the U.S. Department of Agriculture.
Outline
• The pilot • The evaluation design • Main impact: fruit and vegetable intake • Mechanism: fruit and vegetable spending • Local food retail access • Looking forward
Outline
• The pilot • The evaluation design • Main impact: fruit and vegetable intake • Mechanism: fruit and vegetable spending • Local food retail access • Looking forward
Healthy Incentives Pilot
Abt Associates | pg 6
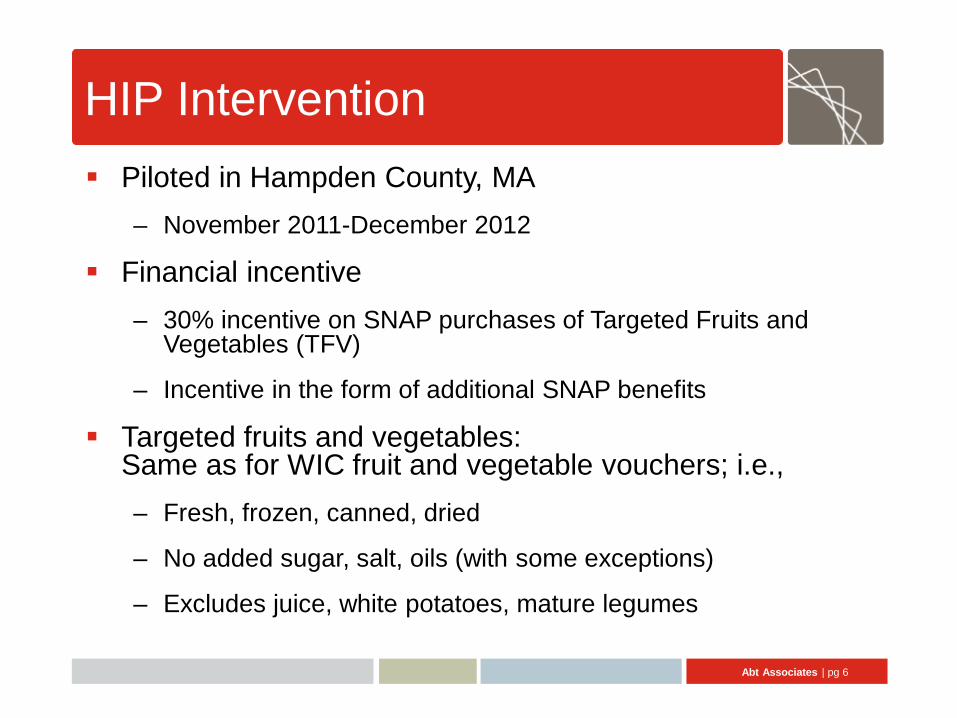
HIP Intervention Piloted in Hampden County, MA
– November 2011-December 2012
Financial incentive – 30% incentive on SNAP purchases of Targeted Fruits and
Vegetables (TFV)
– Incentive in the form of additional SNAP benefits
Targeted fruits and vegetables: Same as for WIC fruit and vegetable vouchers; i.e., – Fresh, frozen, canned, dried
– No added sugar, salt, oils (with some exceptions)
– Excludes juice, white potatoes, mature legumes
Abt Associates | pg 7
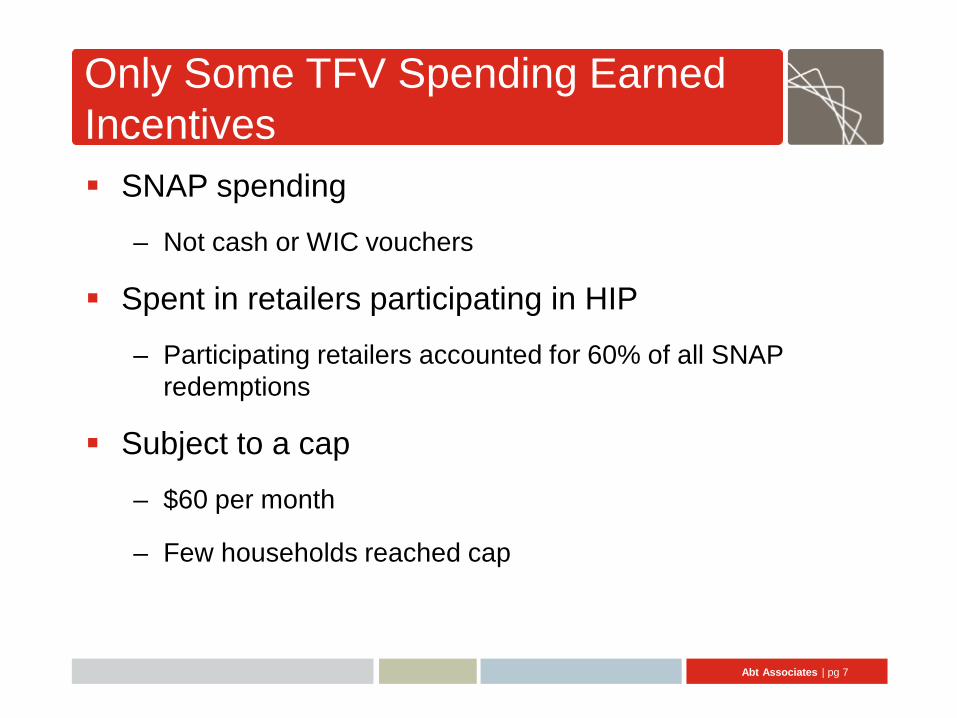
Only Some TFV Spending Earned Incentives SNAP spending
– Not cash or WIC vouchers
Spent in retailers participating in HIP
– Participating retailers accounted for 60% of all SNAP redemptions
Subject to a cap
– $60 per month
– Few households reached cap
Abt Associates | pg 8
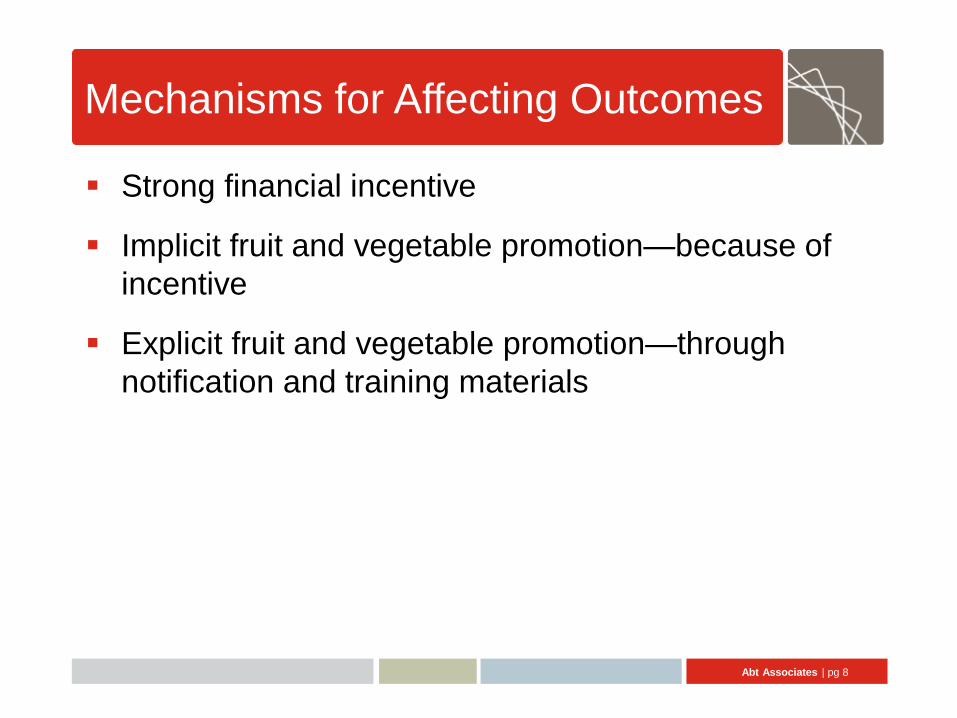
Mechanisms for Affecting Outcomes
Strong financial incentive
Implicit fruit and vegetable promotion—because of incentive
Explicit fruit and vegetable promotion—through notification and training materials
Outline
• The pilot • The evaluation design • Main impact: fruit and vegetable intake • Mechanism: fruit and vegetable spending • Local food retail access • Looking forward
Abt Associates | pg 11
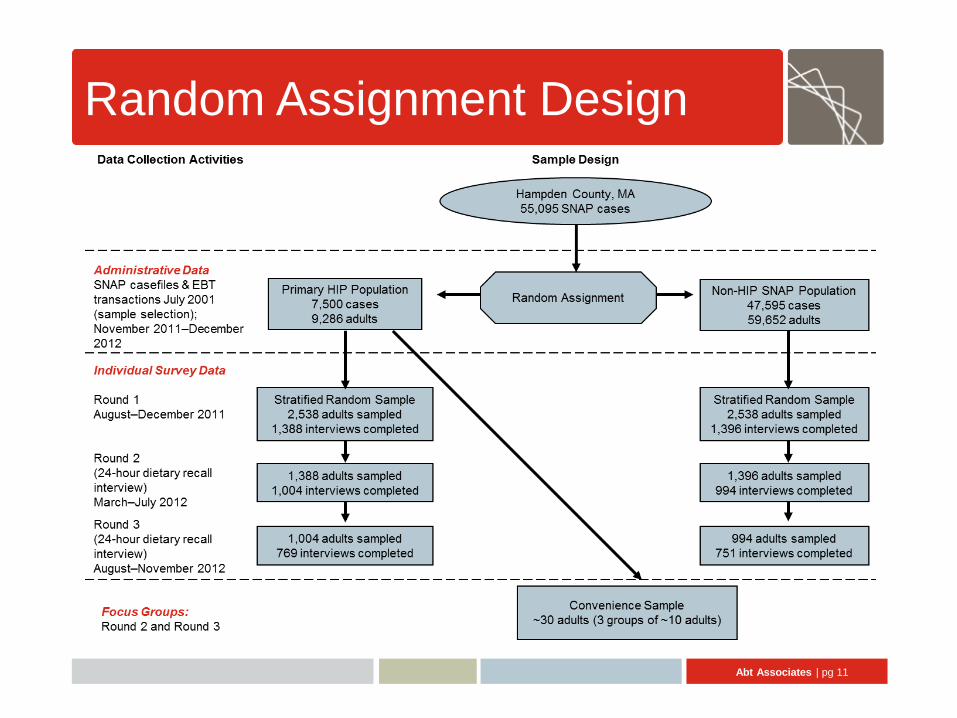
Random Assignment Design
Outline
• The pilot • The evaluation design • Main impact: fruit and vegetable intake • Mechanism: fruit and vegetable spending • Local food retail access • Looking forward
Abt Associates | pg 13
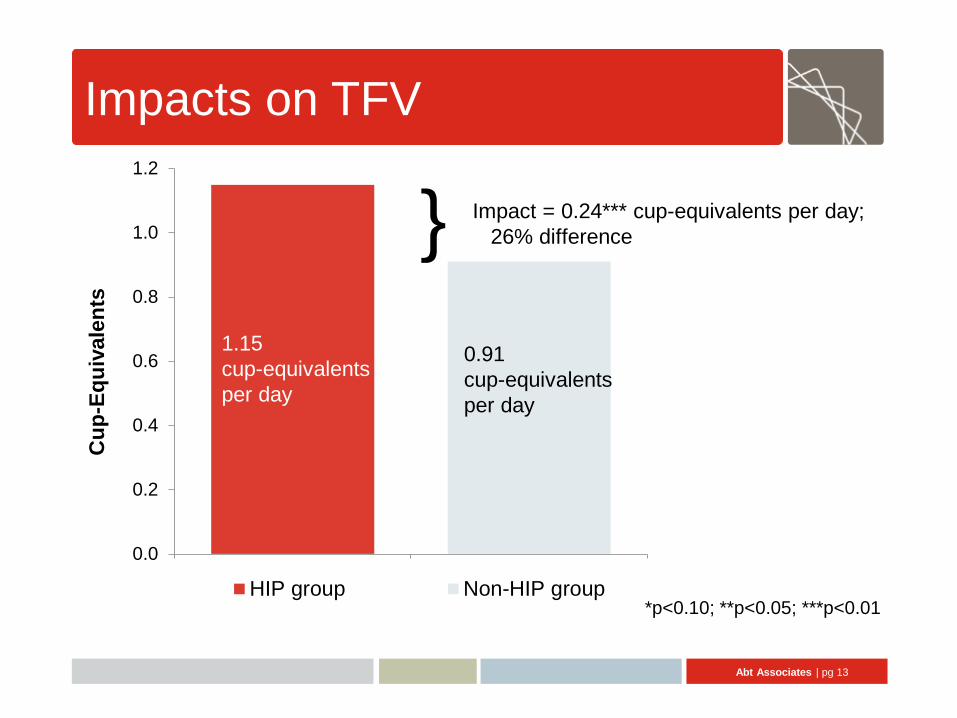
Impacts on TFV
0.0
0.2
0.4
0.6
0.8
1.0
1.2
Cup
-Equ
ival
ents
HIP group Non-HIP group
} Impact = 0.24*** cup-equivalents per day; 26% difference
1.15 cup-equivalents per day
0.91 cup-equivalents per day
*p<0.10; **p<0.05; ***p<0.01
Abt Associates | pg 14
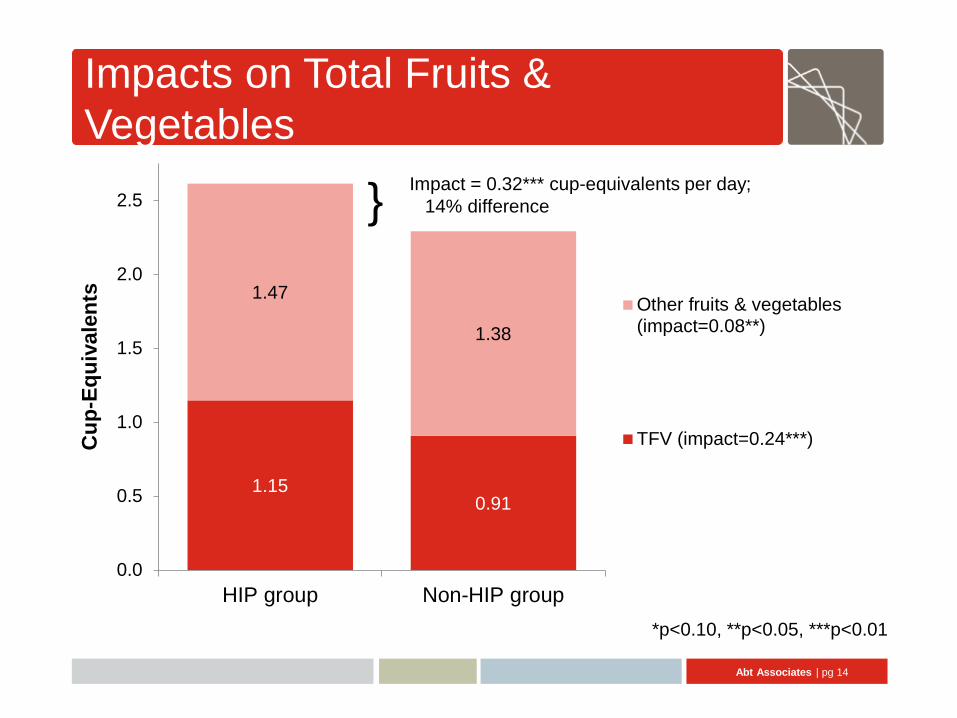
Impacts on Total Fruits & Vegetables
1.15 0.91
1.47
1.38
0.0
0.5
1.0
1.5
2.0
2.5
HIP group Non-HIP group
Cup
-Equ
ival
ents
Other fruits & vegetables(impact=0.08**)
TFV (impact=0.24***)
Impact = 0.32*** cup-equivalents per day; 14% difference
*p<0.10, **p<0.05, ***p<0.01
}
Outline
• The pilot • The evaluation design • Main impact: fruit and vegetable intake • Mechanism: fruit and vegetable spending • Local food retail access • Looking forward
Abt Associates | pg 16
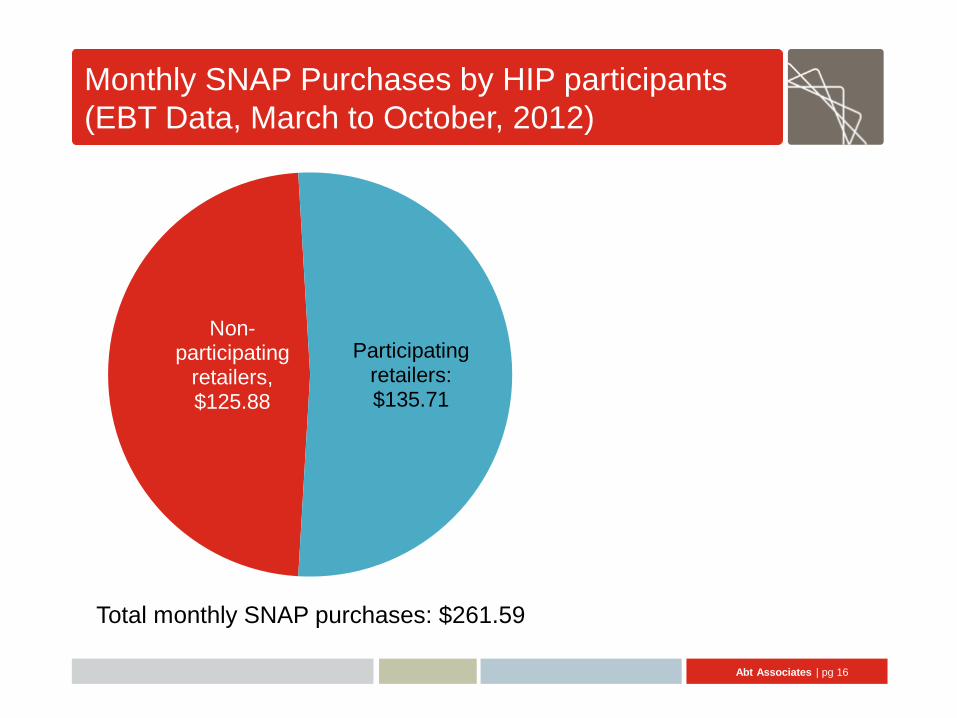
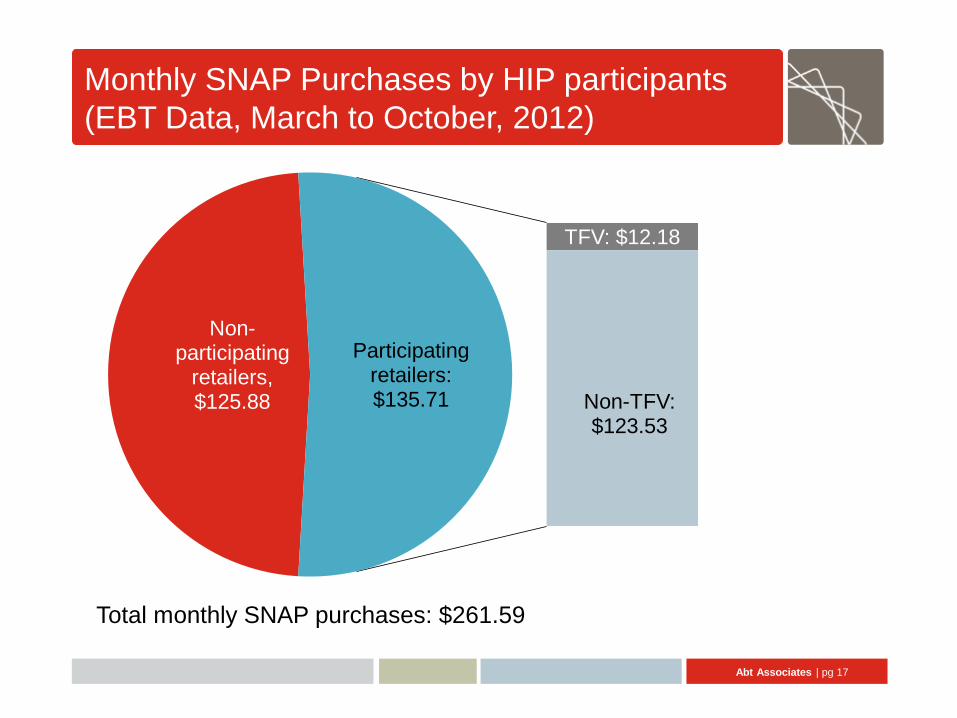
Monthly SNAP Purchases by HIP participants (EBT Data, March to October, 2012)
Non-participating
retailers, $125.88
TFV: $12.18
Participating retailers: $135.71
Total monthly SNAP purchases: $261.59
Abt Associates | pg 17
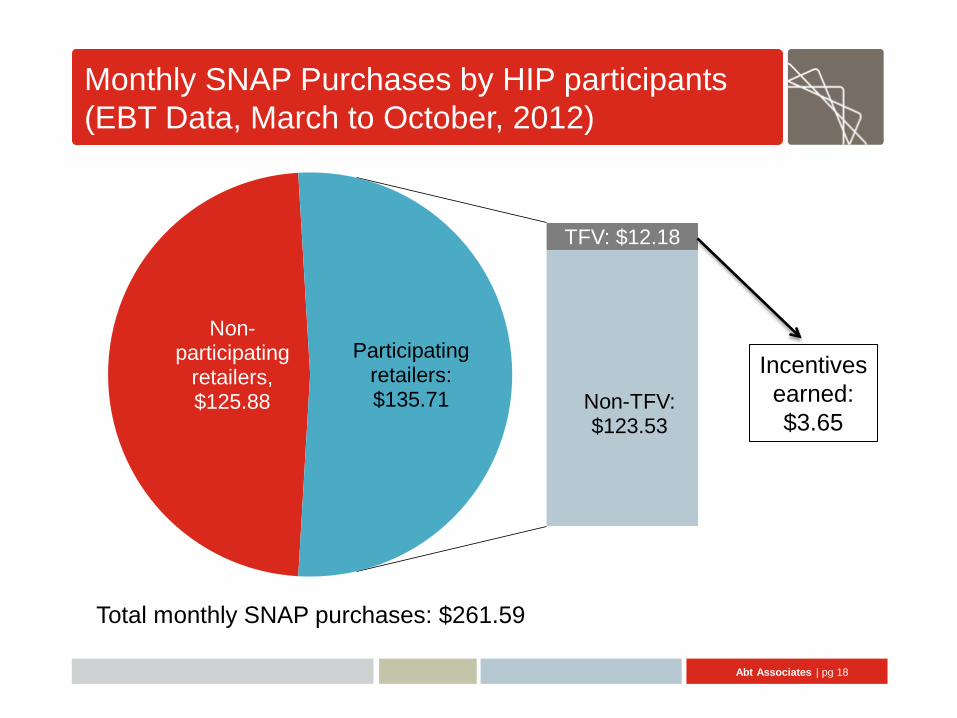
Monthly SNAP Purchases by HIP participants (EBT Data, March to October, 2012)
Non-participating
retailers, $125.88
TFV: $12.18
Non-TFV: $123.53
Participating retailers: $135.71
Total monthly SNAP purchases: $261.59
Abt Associates | pg 18
Monthly SNAP Purchases by HIP participants (EBT Data, March to October, 2012)
Non-participating
retailers, $125.88
TFV: $12.18
Non-TFV: $123.53
Participating retailers: $135.71
Total monthly SNAP purchases: $261.59
Incentives earned: $3.65
Abt Associates | pg 19
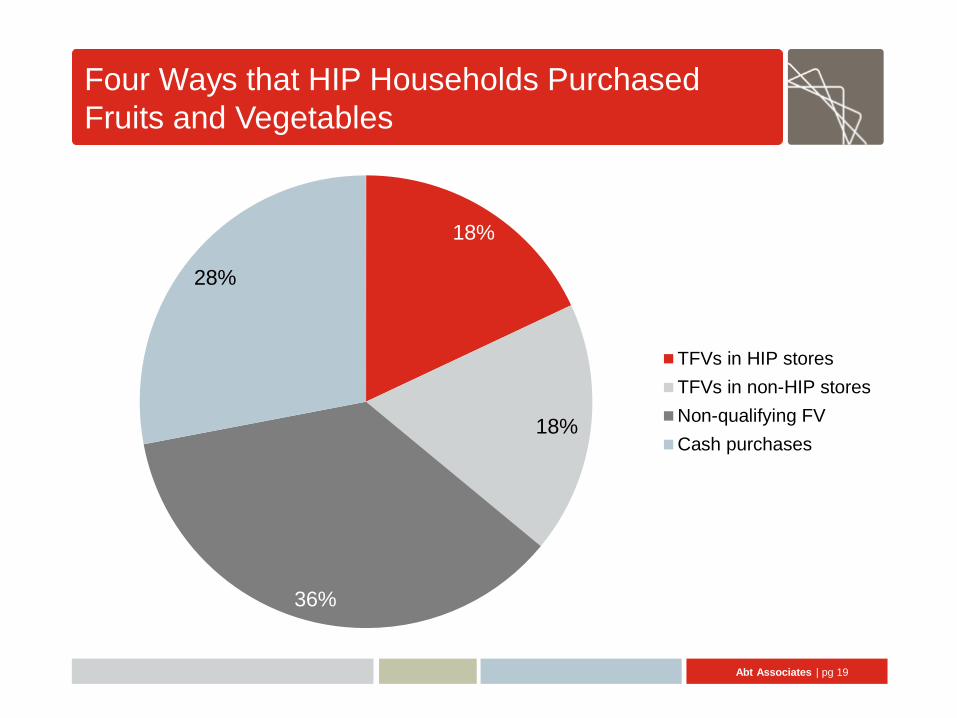
Four Ways that HIP Households Purchased Fruits and Vegetables
18%
18%
36%
28%
TFVs in HIP storesTFVs in non-HIP storesNon-qualifying FVCash purchases
Abt Associates | pg 20
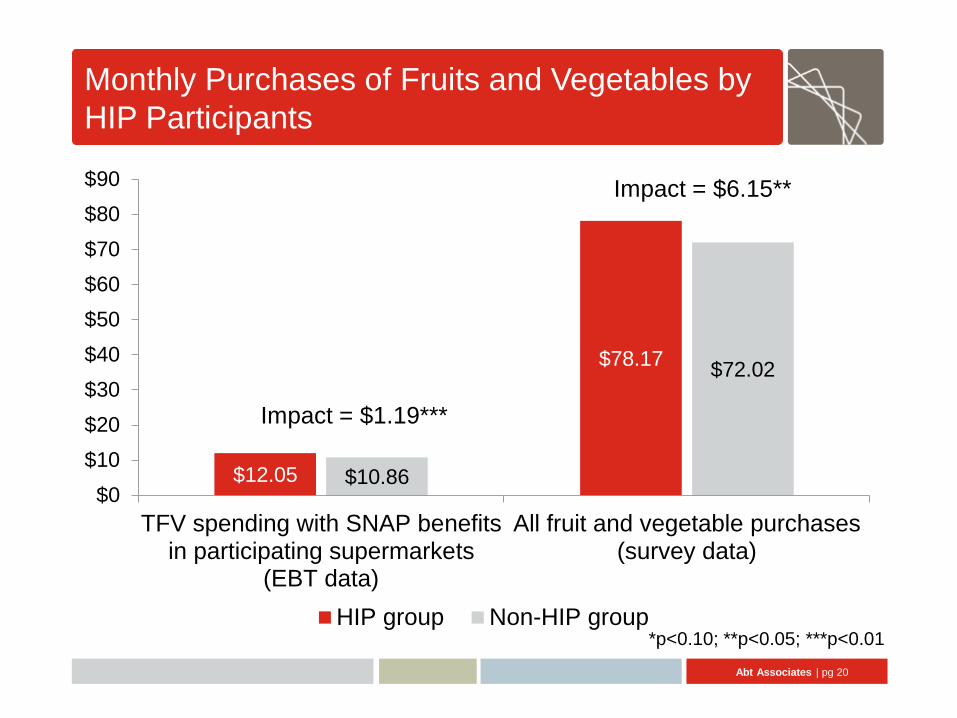
Monthly Purchases of Fruits and Vegetables by HIP Participants
$12.05
$78.17
$10.86
$72.02
$0$10$20$30$40$50$60$70$80$90
TFV spending with SNAP benefitsin participating supermarkets
(EBT data)
All fruit and vegetable purchases(survey data)
HIP group Non-HIP group
Impact = $1.19***
Impact = $6.15**
*p<0.10; **p<0.05; ***p<0.01
Outline
• The pilot • The evaluation design • Main impact: fruit and vegetable intake • Mechanism: fruit and vegetable spending • Local food retail access • Looking forward
Abt Associates | pg 22
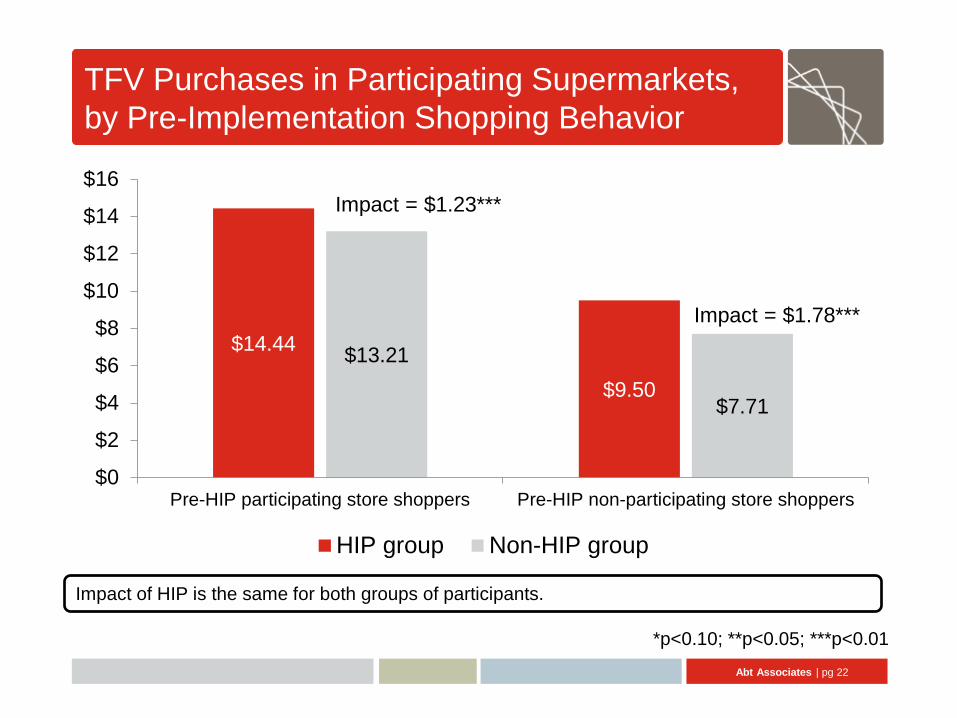
TFV Purchases in Participating Supermarkets, by Pre-Implementation Shopping Behavior
$14.44
$9.50 $13.21
$7.71
$0
$2
$4
$6
$8
$10
$12
$14
$16
Pre-HIP participating store shoppers Pre-HIP non-participating store shoppers
HIP group Non-HIP group
Impact = $1.23***
Impact = $1.78***
*p<0.10; **p<0.05; ***p<0.01
Impact of HIP is the same for both groups of participants.
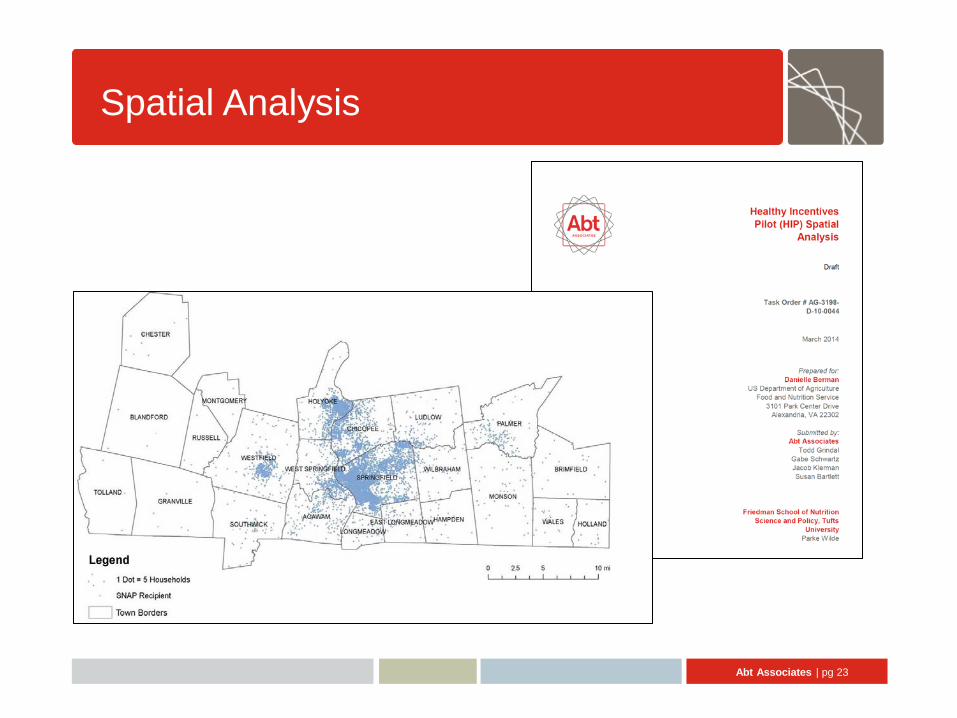
Abt Associates | pg 23
Spatial Analysis
Outline
• The pilot • The evaluation design • Main impact: fruit and vegetable intake • Mechanism: fruit and vegetable spending • Local food retail access • Looking forward
Further Interest in Healthy Incentives
• Food Insecurity Nutrition Incentives (FINI) • Council of Economic Advisers • National Hunger Commission • White House Conversation on Child Hunger in
America