Embed Size (px)
Citation preview

How much do banks use credit derivatives to reduce risk?
Bernadette A. Minton, René Stulz, and Rohan Williamson*
June 2006
This paper examines the use of credit derivatives by US bank holding companies from 1999 to 2003 with assets in excess of one billion dollars. Using the Federal Reserve Bank of Chicago Bank Holding Company Database, we find that in 2003 only 19 large banks out of 345 use credit derivatives. Though few banks use credit derivatives, the assets of these banks represent on average two thirds of the assets of bank holding companies with assets in excess of $1 billion. To the extent that banks have positions in credit derivatives, they tend to be used more for dealer activities than for hedging activities. Nevertheless, a majority of the banks that use credit derivative are net buyers of credit protection. Banks are more likely to be net protection buyers if they engage in asset securitization, originate foreign loans, and have lower capital ratios. The likelihood of a bank being a net protection buyer is positively related to the percentage of commercial and industrial loans in a bank’s loan portfolio and negatively or not related to other types of bank loans. The use of credit derivatives by banks is limited because adverse selection and moral hazard problems make the market for credit derivatives illiquid for the typical credit exposures of banks.
*Respectively, Associate Professor, The Ohio State University; Everett D. Reese Chair of Banking and Monetary Economics, The Ohio State University and NBER; and Associate Professor, Georgetown University. We are grateful to Jim O’Brien and Mark Carey for discussions. Minton acknowledges the Dice Center of Financial Research and Fisher College of Business for financial support.

2
1. Introduction
Credit derivatives are bilateral financial contracts with payoffs linked to a credit related event such as
a default, credit downgrade or bankruptcy. A bank can use a credit derivative to transfer some or all of the
credit risk of a loan to another party or to take additional risks. In principle, credit derivatives are tools
that enable banks to manage their portfolio of credit risks more efficiently. The promise of these
instruments has not escaped regulators and policymakers. In various speeches, Alan Greenspan concludes
that credit derivatives and other complex financial instruments have contributed “to the development of a
far more flexible, efficient, and hence resilient financial system than existed just a quarter-century ago.”
(Greenspan, 2004). He further states in the same speech that “The new instruments of risk dispersion
have enabled the largest and most sophisticated banks in their credit-granting role to divest themselves of
much credit risk by passing it to institutions with far less leverage.”
Statistics from the Bank for International Settlements (BIS) show that the market for credit
derivatives has grown dramatically in recent years. The notional amount of credit derivatives increased
from $698 billion at the end of June 2001 to $4,664 billion by the end of June 2004, an annual growth rate
of 88% (see BIS, 2004). The largest sector of the credit derivatives market is the credit default swap
market where the most liquid names on which credit derivatives are written are large US investment grade
firms, foreign banks, and large multinational firms (Fitch, 2004). Despite the growth of the credit
derivatives market, we know little about how banks use credit derivatives to change their credit
exposures. In particular, we know of no published academic research which investigates whether banks
systematically use credit derivatives to reduce their overall credit risk. In this paper, we examine the use
of credit derivatives by U.S. bank holding companies with total assets greater than one billion dollars for
the period from 1999 to 2003.
The use of credit derivatives is not widespread among banks. During the sample period, roughly 6%
of banks use credit derivatives. In 2003, for example, there are 345 banks in our sample and only 19 of
these banks, or 5.51%, report the use of credit derivatives. The total amount of credit protection bought
and sold by these 19 banks is $988 billion. Through a detailed study of the disclosures of these banks, we

3
find that much of the gross amount of positions they have on their books is there for dealer activities and
not for risk management. With the available data, the best proxy for whether a bank uses credit
derivatives to reduce its credit risk exposure is whether the bank is a net buyer of credit protection. In
2003, the last year in our sample, 17 of the 19 banks using credit derivatives (4.93% of the banks in 2003)
are net buyers of credit protection. The total net notional amount of credit protection bought by these
banks amounts to $67 billion, or 1.83% of all bank loans and 3.61% of the loans of banks that are net
buyers of credit protection.
After documenting that the use of credit derivatives is limited to a small number of banks and that the
net transfer of credit risk from the banking system using credit derivatives is small, we investigate why
this is so. We first compare banks that are net buyers of protection to the other banks in our sample.
Consistent with existing empirical research on derivatives use by financial and non-financial firms, net
buyers of protection are larger firms.1 While the two groups of banks are not different with respect to the
average ratio of total loans to total assets, they differ with respect to the composition of their loan
portfolios. Net buyers of protection have larger fractions of commercial and industrial (C&I) loans and
foreign loans than non-users and a lower fraction of loans secured by real estate than non-users. In
general, net buyers of protection have higher levels of risk than other banks: they have lower capital
ratios, lower balances of liquid assets, a higher ratio of risk-based assets to total assets, and a higher
fraction of non-performing assets than the non-users of credit derivatives. Finally, a larger percentage of
banks that are net buyers of protection also use interest-rate, foreign exchange, equity, and commodity
derivatives.
We examine the extent to which the use of credit derivatives to hedge can be predicted using existing
theories about why firms hedge. Hedging theories typically predict that firms with a greater probability of
costly distress are more likely to hedge.2 If higher profitability is associated with a lower probability of
financial distress, then the likelihood of a bank using credit derivatives to hedge should be lower for more
1 See, for example, Nance, Smith, and Smithson (1993), Géczy, Minton, and Schrand (1997), Mian (1996) and Graham and Rogers, (2002), among others. 2 See Stulz (2003) for a review of hedging theories.

4
profitable firms. Using probit regression analysis, we find this to be the case. The likelihood of using
credit derivatives is negatively related to a bank’s equity capital, tier I risk capital, net income, net interest
margin, and liquid assets. Consistent with existing research on banks’ and non-financial firms’ use of
interest-rate, foreign exchange, and commodity derivatives, we find that an increase in bank size is
positively and significantly associated with the likelihood of hedging with credit derivatives. From these
findings, it follows that the use of credit derivatives is consistent with the predictions of hedging theories.
We also study whether the likelihood of hedging with credit derivatives is related to the type of loans
a bank makes. We find that banks are more likely to be net buyers of credit protection if they have more
C&I loans in their portfolio and they originate foreign-denominated loans. However, while statistically
significant, the point estimates on the C&I loan variable imply small economic increases in the likelihood
of hedging with credit derivatives.
Banks also can manage the credit risk of their loans by selling loans directly or through loan
securitization. We find that banks that securitize loans or sell loans are more likely to be net buyers of
credit protection. Consequently, the various tools banks can use to reduce their credit risk appear to be
complements rather than substitutes.
Our results provide an explanation for the limited use of credit derivatives. Larger bank holding
companies are more likely to have exposures to larger investment grade US firms, foreign banks and
foreign multinational firms and are more likely to be net buyers of credit protection than are small bank
holding companies. A bank choosing to manage credit risk exposures with credit derivatives must
consider liquidity costs, transactions costs, and basis risk. As mentioned previously, the most liquid
names in the credit default swap market (the largest sector of the credit derivatives market) are large
investment grade US firms, foreign banks, and large foreign multinational companies. This is not
surprising since adverse selection and moral hazard problems are substantial for loans to firms where
banks have their greater comparative advantage over the capital markets (see Duffee and Zhou, 2001).
These adverse selection and moral hazard problems make the market for credit derivatives illiquid for
single-name protection precisely for the credit risks that most banks would often want to hedge with such

5
protection. The positive coefficient estimates on C&I loan and foreign loan shares in a bank’s loan
portfolio are consistent with the hypothesis that banks are more likely to hedge with credit derivatives if
they have more loans to credits for which the credit derivatives market is more liquid. Consequently, the
lack of liquidity of the credit derivatives market for typical credit exposures for most banks explains in
part their limited use of credit derivatives for hedging loans.
This paper proceeds as follows. Section 2 describes the sample and investigates the extent to which
banks use credit derivatives. Section 3 discusses testable hypotheses explaining the use of credit
derivatives for hedging based on theories of risk management and banking intermediation. Section 4
looks at derivatives use of individual banks and shows what they say about their use of credit derivatives
in their disclosures. Section 5 presents our empirical results on why banks use credit derivatives. Section
6 concludes.
2. Sample Description
We construct our sample of banks from the Federal Reserve Bank of Chicago Bank Holding
Company database.3 Using this database, we select all commercial bank holding companies with total
assets greater than $1 billion (book value) and non-missing data on credit derivatives use for fiscal year-
ends 1999 to 2003. We then exclude banks which are major subsidiaries of foreign banks and other
domestic bank holding companies. A bank is classified as a major subsidiary if at least 50% of its shares
are owned by another domestic bank holding company or foreign bank. The sample includes 260 banks in
1999 and 345 in 2003. The average amount of total assets for the banks in the sample is $21 billion in
2003, but the median is only $2 billion, reflecting the extraordinarily skewed distribution of bank sizes.
To examine the use of derivatives by banks, we report in Table 1 selected descriptive statistics on
banks’ use of derivatives, bank loan sales, and securitization activities for year-ends 2000 to 2003. Data
on banks’ use of derivatives are from Schedule HC-L of banks’ FR Y-9C filings by bank holding
companies (see Appendix 1 for data details). 3 http://www.chicagofed.org/economicresearchanddata/data/bhcdatabase/index.cfm

6
Credit derivatives include “credit default swaps, total rate of return swaps, synthetic collateralized
loan, debt, and commercial paper obligations, and other credit derivative instruments.” (Instructions for
Preparation of Reporting Form FY-9C). Table 1 shows that over our sample period, the largest percentage
of banks using credit derivatives is in 2001. In that year, 8.16% of the banks used credit derivatives.
Regulators require banks to report separately the notional amount of credit derivatives for which the
bank is the guarantor in the credit derivative and for which the bank is the beneficiary in the credit
derivative. As the guarantor in the transaction, the bank is selling credit risk protection. As the
beneficiary in the transaction, the bank is buying credit risk protection. As reported in table 1, except for
2002, the percentage of banks buying credit protection exceeds the percentage of banks selling protection.
This means that each year, except for 2002, there are some banks that only buy credit protection.
Table 1 also reports percentages of banks engaged in loan sales and asset securitization, activities
which also can be used by banks to manage credit risk exposures. Data on asset sales and asset
securitizations are from Schedule HC-S of banks’ FR Y-9C filings. Loans secured by one-to-four family
residential real estate represent the largest groups of loan sales which is not surprising since banks
typically keep only a fraction of the mortgages they originate. Loan sales are small for other types of
loans, but C&I loans are typically the second most important type of loans sold. Insofar as securitizations
are concerned, mortgages again represent by far the largest category of loans securitized.4
Loan sales and securitizations reduce the credit exposures of banks on the loans sold or securitized,
but the extent to which the credit exposures fall depends on the extent of the risk transferred. Whereas
buying credit protection with a credit default swap on a name for which a bank has an exposure hedges
the bank’s credit risk to the extent of the notional amount of the credit default swap, loan sales without
recourse achieve the same reduction in credit exposure. With securitizations, the same is also true as long
as the bank does not keep any of the securities issued in the securitization or does not make implicit
4 A securitization involves a loan sale. The category loan sale therefore only involves the loans sold but not securitized.

7
guarantees.5 Overall, it is evident from Table 1 that loan sales and securitization of mortgages are much
more pervasive in the banking system than credit derivatives usage.
Among the credit management activities considered in Table 1, selling loans is by far the most
common activity among banks. Though we do not report these results in a table, it is interesting to note
that in 2003, over 60% of the banks do not use loan sales, asset securitization, or credit derivatives as
credit risk management strategies. Using only loan sales is the most frequently used credit risk
management strategy. In 2003, 16.23% of bank holding companies reported only using loan sales. By
contrast, only 8.99% and 0.87% of banks reported using only asset securitization and only credit
derivatives respectively in 2003. Only about 3% of the banks engaged in all three credit risk management
activities, i.e., securitization, loan sales, and use of credit derivatives. There are almost no banks which
report that they do not sell and do not securitize loans, but use credit derivatives. In 2003, only three
banks behaved that way.
The last part of Table 1 considers the use of other derivatives by banks. Banks also are required to
report the notional amount of the types of interest-rate, foreign exchange, equity, and commodity
derivatives used, as well as, the notional amounts of total interest-rate, foreign exchange, equity and
commodity derivatives used for trading and non-trading purposes. Interest-rate derivatives represent the
largest type of derivatives used by banks. Over 50% of the sample banks report using interest-rate
derivatives at year-ends 2000 to 2003.6 Foreign exchange derivatives are the second largest type of
derivatives used by banks with about 20% of the banks reporting the use of foreign exchange derivatives.
Less than ten percent of the sample banks report using equity and commodity derivatives.7
5 See Gorton and Souleles (2005) and Franke and Krahnen (2005). 6 This number is significantly higher than previous studies which focus on all commercial banks and not large bank holding companies. For example, in a recent study of risk management by US commercial banks by Purnanandam (2003), only 5% of the commercial banks reported using interest-rate derivatives. Unlike our sample of bank holding companies with at least $1 billion in total assets, Purnanandam’s sample includes all banks with non-missing assets. 7 While not reported in table 2, data on the breakdown of derivatives use for trading and non-trading purposes show that for banks that report using interest-rate derivatives, interest-rate derivatives represent only 16.3% of the total notional of interest-rate derivatives used by these banks. In contrast, for equity and commodity derivatives users, derivatives used for trading purposes represent, on average, 65.0% and 91.7% of total equity and commodity

8
Table 2 provides a more detailed look at the use of credit derivatives. This table makes it possible to
understand how purchases and sales of credit protection relate to loans of all banks as well as to the loans
of the banks that use credit derivatives. Unfortunately, the data we present is limited by the fact that,
unlike for other derivatives, banks are not required by bank regulators to report information about the type
of credit derivatives instruments used and banks do not have to split the total notional amount of credit
derivatives positions between positions taken for trading and non-trading purposes.
Table 2 reports statistics on the notional amounts of credit derivatives used. As reported in panel A,
the total notional amount of credit risk protection bought and sold by banks with total assets of at least $1
billion was $988 billion at year-end 2003, up from $439 billion at year-end 2001. The total notional
amount of credit risk protection bought and sold was 13.44% of the total assets of all sample banks and
26.75% of the total loans of the same banks at year-end 2003, compared to only 7.57% and 14.08%,
respectively, in 2001. Thus, the total notional amounts on bank books increased sharply both in dollars
and as fractions of loans or assets. However, it is important to note that not all of the derivatives recorded
in these calculations represent transfers of risk with counterparties outside the sample. For instance, it is
likely that some derivatives bought are sold by other banks in the sample. We have no way of knowing
when that is the case.
As a group, buyers and sellers of credit risk protection represent a large fraction of the sample’s total
assets and total loans. The total amount of assets for these banks represents over 60% of the total assets
for all sample banks. The total loans of buyers and sellers of credit risk protection similarly represent
over 60% of total loans of sample banks in most sample years. Hence, while few banks use credit
derivatives, those that do own two thirds of the assets of all banks in our sample.8
Panel B shows that the net amount of protection bought relative to total loans outstanding is less than
2% of total loans by the banks in our sample. However, the net amount of protection bought as a
derivatives. About 53% of the banks which use foreign exchange derivatives use them for trading purposes. These patterns and those reported in table 2 are not surprising given that interest-rate exposure is the largest type of exposure faced by banks. 8 The top three banks in terms of total notional amount of credit protection bought and sold represent 30% of total loans of all sample banks.

9
percentage of total loans increased by 64.86% from 2001 to 2003. This increase would be consistent with
credit derivatives playing a greater risk transfer role towards the end of our sample period.
The next three panels report averages across banks. Panel C reports the average total notional amount
of credit protection bought and sold by users of credit derivatives. The first row shows the numbers of
banks that use credit derivatives. The highest number of banks reporting using credit derivatives is 20 in
2001. This number does not change much in our sample since it is 18 in 1999 and 19 in 2003. The
average percentages of total assets and of total loans are smaller than the percentages reported in Panel A.
This can only be the case if the larger banks have larger percentages of total notional amount to assets and
to loans than the smaller banks in the sample.
So far, we have focused on the total notional amount of credit protection bought and sold. We now
turn to the banks that are net buyers of credit protection. A recent survey by Fitch (2003) reports that 113
global banks (77 European and Asian, 36 North American) were net buyers of protection. The first row of
Panel D shows the number of banks that are net buyers of credit protection in our sample. This number
varies across years. Though it is 17 in 2003, it is only eight in 2002. The average net notional amount of
credit protection bought is small compared to the total notional amount of credit bought and sold. The
average net notional amount bought by banks in 2003 is roughly $4 billion, which is less than 8% of the
total notional amount bought and sold. The net amounts bought represent less than 3% of total assets and
total loans.
We finally turn to banks which are net sellers of credit protection in Panel E. Only two banks are net
sellers in 2003. The total amount of net protection sold in 2003 represents 1.68% of the total notional
amount of protection bought and sold. So far we have discussed the extent to which banks hedge and in
specifically their use of credit derivatives. The next obvious question is why banks use credit derivatives
for risk management and the theory that supports it.

10
3. Why do banks use credit derivatives to manage risk? There is a growing literature that examines why firms hedge. Some of that literature addresses
directly issues concerning banks, but most of it does not. In this section, we use the risk management and
banking literature to derive predictions on when banks are likely to use credit derivatives to hedge.
3.1. Why banks hedge?
In Diamond (1984), banks are delegated monitors with comparative advantage in assessing and
monitoring the credit risk of obligors. In his model, it is optimal for banks to eliminate all hedgeable risks
because the resulting equilibrium ensures that banks monitor credits efficiently and avoid costly
liquidations. We would therefore expect banks to hedge all their interest rate risk as well as other risks in
which they do not have a comparative advantage such as foreign currency risk. To extend Diamond’s
(1984) model, one would have to allow for hedging of risks in which the bank has a comparative
advantage. The literature that focuses on the comparative advantage of banks in monitoring points out,
however, that this comparative advantage of banks is likely to be smaller for loans to large firms because
these firms tend to be more transparent and monitored more actively by other market participants. One
would expect banks to hedge these credit risks and take on the credit risk in which they had a relative
comparative advantage. Thus, banks with exposures to large investment grade firms or large foreign
rated firms might be more likely to hedge these exposures using credit derivatives because they do not
have a relative comparable advantage.
More generally, risk management theories emphasize the benefit from hedging risks that increase the
expected costs of financial distress (Smith and Stulz, 1985). We would therefore expect banks that are
more likely to bear greater costs of financial distress to hedge more. In the banking literature, banks
benefit from leverage. In particular, deposits can be a source of information (Fama, 1985) and a source of
cheap capital if competition is imperfect. Further, following Diamond and Rajan (2000), higher leverage
increases the incentives of banks to monitor and prevents hold-up problems. Since banks benefit from
higher leverage, they can increase their value through hedging since it allows them to have more leverage

11
for a given probability of financial distress. Through hedging, banks also can take on more risks for which
they have a comparative advantage for a given probability of financial distress. Schrand and Unal (1998)
provide empirical evidence of this phenomenon for savings and loan institutions.
We would expect banks with less capital, banks with more non-performing loans, with weaker
liquidity, and with smaller interest margins to be more likely to hedge since such banks are more likely to
face financial distress. We investigate the impact of these determinants of hedging with the following
variables. Liquidity is measured as cash and liquid assets as a percentage of total assets. Non-performing
assets equals the sum of loans over 90 days late and loans not accruing, all divided by total assets.
Profitability is measured using the return on assets (net income scaled by total assets), return on equity
(net income scaled by total equity capital), and net interest income scaled by total assets. We expect the
likelihood of credit derivatives use to be positively associated with non-performing assets and loan loss
provisions, and negatively associated with liquidity and profitability.
The presumption is, however, that the banks have a sufficiently high franchise value that costs of
financial distress are significant for them, since otherwise they might be tempted to take on risk to take
advantage of the deposit insurance put option they hold (James, 1988).
3.2. Why do banks use credit derivatives to manage risks?
Banks have a comparative advantage in monitoring credits and hence in bearing credit risks. This
suggests that the reasoning for why banks use credit derivatives has to be more subtle than the reasoning
that leads the literature to conclude that banks should hedge interest rate risks.9 Morrison (2001) argues
that the availability of credit derivatives could adversely affect banks by reducing their incentives to
monitor and to screen borrowers. Further, the use of credit derivatives could make bank loans less
valuable to borrowers because the loans would entail less of a certification effect.
A clean loan sale or securitization removes the risk of a loan completely from the bank’s balance
sheet. Hence, if a bank does not want to bear the risk associated with all or part of a loan, such 9 Kiff, Michaud, and Mitchell (2002) review the issues that arise with various instruments for credit risk transfer.

12
transactions can achieve that purpose leaving no residual risk or capital requirements. In practice,
however, the lemons problem in loan sales and securitizations forces banks to take steps to reduce that
problem. As discussed by Gorton and Pennachi (1995) and others, loan sales do so through implicit
guarantees and by retaining risk associated with the loans. For instance, in loan sales banks do not sell the
whole loan and with securitizations banks may keep first loss positions.
By using credit derivatives, banks keep the loan on their balance sheet. Transferring credit risks with
credit derivatives therefore has risks that credit risk transfers with loan sales or securitizations do not
have. Banks using these derivatives have to bear associated counterparty, operational, and legal risks.
Further, banks often are unable to use hedge accounting when using credit derivatives, so that their
accounting earnings are not hedged even when credit derivatives are used for hedging purposes. As
Duffee and Zhou (2001) point out, these difficulties associated with the use of credit derivatives suggest
that everything else equal a bank would rather sell loans or securitize loans when these mechanisms can
be used at low cost. Consequently, credit derivatives are most likely to be used when the costs of selling
or securitizing loans are too high.
Loans could be expensive to sell for a number of reasons. We already discussed the adverse selection
and moral hazard problems that arise with banks wanting to reduce their exposure to a counterparty.
These problems are reduced if banks want to reduce their exposure for a period that terminates before
maturity of the loan. A credit derivative would achieve that purpose if it matures before maturity of the
loan. Since the bank would have exposure at maturity of the loan, it would have greater incentives to
screen and monitor the borrower.
Most importantly, the existence of a relationship between the lender and the borrower will make it
less likely that the loan will be sold. First, the borrower may not want the loan to be sold since it would be
harder to negotiate with a lender who has no experience with the borrower. Second, the lender may want
to protect the relationship with the borrower. Third, relationship-based lending can involve implicit
commitments on both parties that would become worthless if the loan is sold. In all these cases, the bank
may not be in a position to sell the loan either by itself or through a securitization. In general, these issues

13
do not arise with small loans that meet recognizable criteria, such as mortgages, retail loans, and credit
card loans because these loans can be packaged in pools and relationships do not play much of a role in
how borrowers are treated in the event of default when the bank is large.
We expect banks to be more likely to sell or securitize loans secured by real estate and retail loans. In
contrast, we would expect banks to be more likely to retain C&I loans, agriculture loans (loans to finance
agricultural production and other loans to farmers), and foreign loans.
When banks want to reduce their credit exposure by buying credit protection, they create a lemon
problem. The protection seller has to be concerned that the bank wants credit protection because it has
adverse information about the name on which it wants to buy protection. Duffee and Zhou (2001) argue
that banks can use a credit-derivative contract to transfer loan risk for which their informational
advantage is small and retain the portion of risk for which their bank’s relative informational advantage is
relatively large. The lemon’s problem is sharply reduced when a bank buys credit protection on a name
with a credit rating since the rating provides a public evaluation of credit quality for the name. The
problem also is much smaller when credit derivatives and public debt are actively traded for the name
since adverse private information is likely to find its way into prices. We would therefore expect banks to
find it more advantageous to use credit derivatives to hedge credit exposures to rated names and to names
for which there is a market for credit instruments. However, if that is the case, banks are most likely to
use credit derivatives on those loans where their comparative advantage is smallest and be unable to use
them where their comparative advantage is largest.
We expect banks to use all available instruments to manage risk. Therefore, we would expect banks
that use other derivatives or other forms of credit risk management to be more likely to use credit
derivatives. In our sample, all the banks that use credit derivatives also use interest-rate derivatives. We
expect banks that use loan sales, securitization, foreign exchange, equity or commodity derivatives also to
use credit derivatives. Since, as mentioned earlier, there are economies of scale in using derivatives, we
expect larger banks to be more likely to use credit derivatives.

14
Credit derivatives also can be used by banks in their intermediary roles. In particular, banks can offer
credit support in transactions they underwrite using credit derivatives. They can also make a market in
credit derivatives. For example, banks can sell credit protection to clients who wish to hedge their credit
exposures and buy credit protection (i.e., sell credit risk) from other clients who want to be long the same
credit exposures.
If banks use credit derivatives in an intermediary capacity, then we would expect banks which are
dealers in the derivatives market or have clients with which they trade or for which they provide hedging
products to be more likely to use credit derivatives. If credit derivatives are used as credit enhancement
for commercial paper conduit facilities or asset securitization facilities, then we expect the use of credit
derivatives to be positively related to asset securitization. If larger banks and banks which use other
derivatives are more likely to have trading departments for bank and client accounts, we expect to observe
positive associations between the likelihood of using credit derivatives and bank size, and the use of
foreign exchange, equity and commodity derivatives.10
4. Which banks are large users and what do they say about their use of credit derivatives?
Table 2 showed that a small fraction of large bank holding companies use credit derivatives. Because
sufficiently few banks use credit derivatives, it is possible to examine what they say about their use of
credit derivatives. Table 3 reports, for 2003, the list of banks that use credit derivatives. In this section, we
summarize the information provided by these banks in their financial statements in light of the predictions
derived in the previous section. In the next section, we empirically test these predictions.
For each bank in table 3, we provide information on their use of these derivatives. It shows that
within this small group of banks that have positions in credit derivatives, credit derivatives use is even
more concentrated. The most striking fact in the table is that the total notional amount of credit
derivatives bought and sold by J.P. Morgan Chase & Co. ($578 billion) exceeds the total notional amount
10 We do not include interest rate derivatives use in our empirical tests because all banks in the sample which use credit derivatives also use interest rate derivatives.

15
bought and sold by all other banks in our sample combined ($410 billion). More than half the banks have
a net notional amount of credit protection bought representing less than 1% of the assets. However, J.P.
Morgan Chase & Co. bought credit protection for an amount that exceeds its total loans and bought a net
amount of credit protection corresponding to 11.74% of its loans.
Like the Basel Committee on Banking Supervision (2004), we find that bank holding companies
make credit risk disclosures in various places in their filings. In general, users of credit derivatives
provide information about their credit exposure, net of provisions for loan losses, in their disclosures
about the credit risk of their loans. Information about credit risk exposure broken down by credit rating,
geographic segments, and industrial segments varies across banks.
Appendix 2 summarizes the disclosures about credit derivatives use for the banks in our sample.
These disclosures vary greatly across banks. When information is disclosed, it is discussed in various
footnotes to the financial statements including trading accounts and related trading revenues footnotes,
derivatives instruments footnotes, fair value of instrument footnotes, securitization footnotes, and in the
management’s discussion of credit risk management. Some banks note that credit default swaps that are
used to manage the credit risk of the bank’s loan portfolio often do not qualify for hedge accounting. In
cases in which banks are both sellers and buyers of credit risk protection, banks disclose if the
transactions are offsetting. Some banks note that the marking-to-market of these two groups of credit
derivatives act like natural hedges. In other cases, banks disclose the amount of loans hedged by the
credit derivatives but in most cases they do not. Finally, banks disclose that credit default swaps are used
to create synthetic collateralized debt, collateralized loan, or collateralized commercial paper obligations.
The 2002 10-K filing for J.P. Morgan Chase has a section on credit derivatives within management’s
discussion of credit risk management. J.P. Morgan Chase reports a sizeable gain from credit derivatives
for 2002. This gain of $127 million is included in trading revenue. However, the following year it makes
a loss of $746 million on credit derivatives used to manage the firms’ credit exposure that it attributes to a
tightening of credit spreads. The bank divides its use of credit derivatives to asset portfolio and
dealer/client activity. More than 90% of the total notional amount of credit derivatives bought and sold is
16
related to dealer/client activity. The bank also reports a net purchase of credit protection in the credit
portfolio section of its 10-K. The amount reported there is equal to the net amount of credit protection the
bank bought for asset portfolio activities. It therefore corresponds to a hedge of its credit portfolio.
However, at the same time, the bank is a net seller for $13.70 billion for dealer/client activity.
Citigroup is the second highest user of credit derivatives. It reports that at year-end 2002, it hedged
$9.6 billion of credit risk exposure through the use of credit derivatives and other risk mitigating
techniques. Given the size of the total notional amount of credit protection bought and sold, it also
follows for Citigroup that the main use of credit derivatives is for trading purposes rather than for hedging
credit exposures in the banking book.
Eight of the 28 banks reviewed, such as Wells Fargo, disclose using credit derivatives for trading and
“customer accommodation”. Wells Fargo notes that almost all the protection purchases are exact offsets
of sales of credit protection. In contrast, other banks, such as Bank One, disclose primarily using credit
derivatives to hedge the credit risk of their commercial loans and loan commitments. Some banks that do
not disclose using credit derivatives to hedge are net protection buyers. It could be, therefore, that treating
all banks that are net protection buyers as hedgers overstates the number of banks that hedge credit risk
from loans.
In sum, while the use of credit derivatives is concentrated in a few banks, the reasons reported for
their use are varied. A review of the bank’s financial statements suggest that banks use credit derivatives
for a variety of reasons such as to hedge the credit risk of their loan portfolio and in their role as financial
intermediaries. In the section, we examine empirically the determinants of banks use of credit derivatives.
5. Empirical results
We first compare the characteristics of banks that are net buyers of credit derivatives to other banks.
After having done this, we estimate probit models to test the predictions derived in Section 3 about which
banks are likely to be net buyers of credit protection.

17
5.1. Univariate comparisons
The results of these comparisons are reported in Table 4 for the banks in our sample at year-end 2003.
Sample statistics are similar for other years. We report means and medians.
The size of the average and median bank holding company (BHC) that is not a net buyer of credit
protection, as measured by the book value of total assets, are $11.322 and $2.195 billion, respectively, at
year-end 2003. The difference between the mean and median is not surprising given the skewed
distribution of bank size. The mean and median of net buyers of credit protection are extremely large
compared to the mean and median of the other banks. This result confirms previous research documenting
that larger firms use derivatives more. The median assets of net buyers of credit are roughly 50 times the
median assets of the other banks in the sample.
We turn next to the composition of the balance sheet of the banks in our sample. Surprisingly, the
proportion of loans and the proportion of deposits to total assets are smaller for net buyers of credit
protection. However, banks that are net buyers have more C&I loans relative to total loans (23% of the
total loan portfolio compared to 17% for all other banks), more consumer loans, and more foreign loans.
Their loans secured by real estate are dramatically less (48.35% of total loans versus 68.15%) and they
make fewer agricultural loans.
The huge difference in the proportion of loans secured by real estate is the most striking difference
between banks that hedge with credit derivatives and those that do not. Banks that make mortgage loans
are not expected to use credit derivatives to hedge these loans – though more recently credit default swaps
on commercial mortgages have become available. C&I loans and foreign loans are more likely to be
hedged with credit derivatives than other loans because most liquid names in the credit default swap
market (the largest sector of the credit derivatives market) are large investment grade US firms, foreign
banks, and large foreign multinational companies (Fitch 2004). Thus, it is not surprising that the net
buyers of credit protection have relatively more such loans.
We turn next to profitability measures. There is no significant difference in return on assets between
net buyers and other banks, but net buyers have a higher return on equity and a lower net interest margin.

18
The higher return on equity means that the net buyers are more highly levered and hence more vulnerable
to shocks. One would expect such banks to be more likely to hedge.
When we compare capitalization measures, we see that net buyers are less well capitalized than other
banks. For example, the mean tier-1 risk-adjusted capital ratio for net buyers of credit risk protection is
8.98% compared with 12.30% for all other banks. These results are consistent with Cebenoyan and
Strahan (2002) who find that banks that sell loans have less capital. The net buyers also have more risk-
adjusted assets. In other words, they have more risky assets, but less capital to support them. However,
while the net buyers have more non-performing assets than other banks, the difference is not significant.
The last panel considers derivatives use. At this point, it is not surprising that firms that use credit
derivatives are more likely to use other derivatives. In fact, all firms that are net buyers of credit
protection also use interest-rate derivatives. Almost all banks that buy credit protection also securitize
assets and sell loans.
The last two rows show the total trading revenue of banks and total trading revenue scaled by total
assets. This trading revenue includes derivatives trading. Though banks using credit derivatives have
dramatically more trading revenue on average than other banks, there is enough dispersion in that trading
revenue that the difference has a p-value of 0.13 and hence is not statistically significant at conventional
levels of significance. However, the comparison of medians has a p-value of less than 0.01. Strikingly, the
median trading revenue of banks which do not use credit derivatives is zero. When we control for bank
size using total assets, mean and median trading revenue are significantly greater for banks that are net
buyers of credit protection.
5.2. Regression analysis
We now turn to probit regressions to test the predictions derived in Section 3 about the determinants
of the decision to hedge with credit derivatives.
We report estimates of probit regressions in Table 5. The dependent variable is the probability of
being a net buyer of credit protection using credit derivatives. We have four years of data, but the early

19
years do not have data on all the variables we use. Further, the market for credit derivatives evolved
during that period. We therefore proceed as follows. We estimate the regressions separately for 2002 and
2003. We also estimate regressions for 2002 and 2003 allowing for a common component in the residuals
for each year. These three sets of regressions lead to qualitatively similar conclusions. We therefore report
and focus on the regressions for 2003, except for Model (1) which includes all sample years. The table
reports the marginal effect of each regressor and the associated probability value (p-value) of the test that
the marginal probability is equal to zero. For indicator variables, the coefficient represents the change in
the probability associated with moving the indicator from 0 to 1.
Panel A uses equity capital as the capitalization measure. Panel B uses tier 1 risk-adjusted capital as
the capitalization measure. Model (1) uses only variables that are available in all sample years.
Overall, the results in panel A are very supportive of the predictions of our analysis of the
determinants of hedging of Section 3. We find that a bank is less likely to be a net buyer of credit
protection if it has more capital, is more profitable, and has more agricultural loans. It is more likely to be
a net buyer of credit protection if it is larger and has more C&I loans. All these results (except those for
agricultural loans) are expected in light of the discussion of Section 3. We would expect banks with more
consumer loans to be less likely to be net buyers of credit protection since a large fraction of consumer
loans are more standardized and can easily be securitized or sold. Though the coefficient on consumer
loans is negative, it is not significant. Model (2) is model (1) estimated for 2003 only. The results are
similar.
In model (3), we replace total assets with a dummy variable for whether a bank uses equity or
commodity derivatives. A bank that trades actively or is a derivatives dealer will report use of such
derivatives, but other banks are unlikely to do so. We find that banks reporting the use of such derivatives
are significantly more likely to use credit derivatives. The other coefficients remain similar to model (2).
In regressions we do not report, we use trading income instead of the dummy variable for the use of
equity and commodity derivatives. Not surprisingly given the results for univariate comparisons, trading
revenue does not have a significant coefficient.

20
In model (4), we find that banks that fund themselves more with deposits are less likely to be net
buyers of credit protection. This could be because banks that use more borrowings to finance themselves
instead of deposits are more vulnerable to adverse changes in their credit condition. Alternatively,
hedging with derivatives decreases the value of the deposit insurance put for a given amount of equity
capital. More liquid banks are also less likely to be net buyers of credit protection. Nonperforming assets
does not have a significant coefficient.
The next regression adds to model (4) a dummy variable that takes value one if a bank securitizes
loans. We find that banks that securitize loans are more likely to be net buyers of credit protection.
Similarly, in model (6), we show that banks that sell loans are more likely to be net buyers of credit
protection.
Finally, in model (7), we show that if a bank extends foreign loans, it is more likely to be a net buyer
of credit protection. The marginal probability is significant and positive in the probit regression. Total
C&I loans is replaced by total US C&I loans in this regression. C&I loans remains statistically
significant and positive.
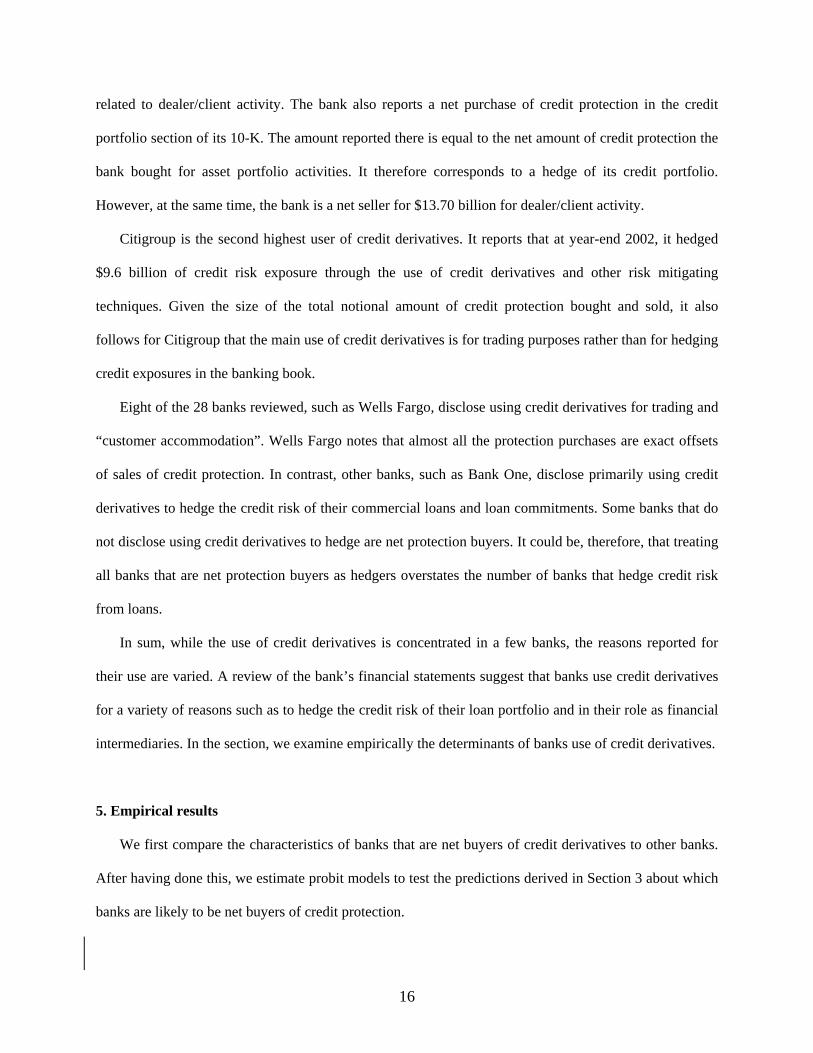
Panel B has similar results to Panel A. Instead of using equity capital as our measure of equity
capitalization, we use instead the tier I risk-adjusted capital ratio. We find that this ratio always has a
significant negative coefficient (but the marginal effect are smaller), so that banks with less regulatory
capital measured by this ratio are more likely to be net buyers of credit derivatives. The other regression
coefficients of panel B do not differ much from the comparable coefficients of panel A. In some cases,
coefficients that are significant in panel A are not significant in panel B, but this does not affect our main
conclusions.
In the regressions, we only include explanatory variables with correlation coefficients of less than 0.3
(Table A.1 in Appendix III reports correlation coefficients.) For example, the ratio of loans secured by
real estate to total assets is highly negatively correlated with the ratios of C&I loans to total assets and of
total consumer loans to total assets. Thus, we do not include a measure of loans secured by real estate in
the probits. In robustness tests, we include this measure and exclude the other two measures of loan

21
activity. The other regression coefficients are not affected.
In other robustness tests, we use alternative measures of profitability and capitalization. Specifically,
we include the ratio of net income to total assets as a measure of profit instead of net interest margin.
Overall the results are qualitatively similar to those reported in panel A of table 5. When we measure
capitalization using the tier 1 risk-adjusted capital ratio (panel B), the coefficient estimates on net income
are not statistically significant in models that use net income instead of net interest margin. We also
estimate probit regressions using total risk adjusted capital and the ratio of risk-based assets to total assets
as measures of capitalization. The results are qualitatively similar to those reported in panel A of table 5.
Finally, we estimate the regressions reported in table 5 excluding banks which are net sellers of credit risk
protection. Doing so does not affect our results.
6. Conclusion
In this paper, we examine the use of credit derivatives by bank holding companies in the U.S. with
assets in excess of $1 billion. We find that few of these companies use credit derivatives. Further, among
the banks that have positions in credit derivatives, a detailed review of their disclosures reveals that the
typical position in credit derivatives is taken on for dealer activities rather than for hedging credit
exposures from loans. Even though the median amount of credit protection bought by banks is zero in our
sample, the largest banks typically are net buyers of credit protection. We find that the predictions of
hedging theories are supported by our regression analysis, in that banks that according to these theories
would benefit more from hedging are more likely to be net buyers of credit protection. We argue that the
use of credit derivatives is limited by the lack of liquidity of the credit derivatives market for the credits
that banks would most want to hedge.
Though there has been much discussion about the benefits of credit derivatives for the soundness of
banks, our results show that one has to be careful in drawing conclusions. A small number of banks buy
net credit protection, but these banks also have less capital. To the extent that credit derivatives make it
easier for banks to maximize their value with less capital, they do not increase the soundness of banks as

22
much as their purchases of credit derivatives would imply. However, if credit derivatives enable banks to
save capital, they ultimately reduce the cost of loans for bank customers and make banks more
competitive with the capital markets for the provision of loans.

23
References
Basel Committee on Banking Supervision, 2004, Financial disclosure in the banking, insurance and securities sections: Issues and analysis.
Board of Governors of the Federal Reserve System, 2002, Line item instruction for consolidated financial
statements for bank holding companies – FR Y-9C. Cebenoyan, A. and P. Strahan, 2002, Risk management, capital structure and lending at banks, working
paper, Boston College. Diamond, D. 1984, Financial intermediation and delegated monitoring, Review of Economic Studies 51,
393-414. Diamond, D.W. and R.G. Rajan, 2000, A theory of bank capital, Journal of Finance 55, 2431-2465. Duffee, G. and C. Zhou, 2001, Credit derivatives in banking: Useful tools for managing risk?, Journal of
Monetary Economics 48, 25-54. Fama, E. F., 1985, What's different about banks?, Journal of Monetary Economics 15, 29-40. FitchRatings, 2004, CDS market liquidity: Show me the money. Franke, G., and J. Krahnen, 2005, Default risk sharing between banks and markets: the contribution of
collateralized debt obligations, in The Risks of Financial Institutions, eds. M. Carey and R. Stulz, University of Chicago Press, forthcoming.
Géczy, C., Minton, B., Schrand, C., 1997, Why firms use currency derivatives, Journal of Finance 52,
1323-1354.
Gorton, G. and G Pennacchi, 1995, Bank loan sales: Marketing nonmarketable assets, Journal of Monetary Economics 35, 389-411.
Gorton, G. and N. Souleles, 2005, Special purpose vehicles and securitization, in The Risks of Financial
Institutions, eds. M. Carey and R. Stulz, University of Chicago Press, forthcoming. Greenspan, A., 2004, Economic flexibility, speech to HM Treasury Enterprise Conference, London, U.K.
Graham, J. and D. Rogers, 2002, Do Firms Hedge in Response to Tax Incentives?, Journal of Finance 57, 815 – 839.
James, C. 1988 The use of loan sales and standby letters of credit by commercial banks, Journal of Monetary Economics 22, 399-422.
Kiff, J., F.-L. Michaud, and J. Mitchell, 2002, Instruments of credit risk transfer: Effects on financial
contracting and financial stability, working paper, Bank of Canada. Mian, S. L., 1996, Evidence on corporate hedging policy, Journal of Financial and Quantitative Analysis
31, 419-439.

24
Morrison, Alan, 2001, Credit derivatives, disintermediation and investment decisions, working paper Oxford Financial Research Center.
Nance, D.R., C.W. Smith, Jr. and C.W. Smithson, 1993, On the determinants of corporate hedging,
Journal of Finance 48, 267-284. Purnanandam, A. 2004, Do banks hedge in response to financial distress costs?, working paper, Cornell
University. Schrand, C. and Unal, H., 1998, Hedging and coordinated risk management: Evidence from thrift
conversions, Journal of Finance 53, 979-1013.
Smith, Clifford, and René Stulz, 1985, The Determinants of Firms' Hedging Policies, The Journal of Financial and Quantitative Analysis 28, 391-405.
Stulz, R., 2003, Risk Management and Derivatives, South-Western Publishing.

25
Appendix I Variable names and definitions
Variables used in study. Data items are from the FR Y-9C (Consolidated Financial Statements for Bank Holding Companies) filings with the Federal Reserve System for fiscal year-ends 1999 to 2003.
Variable BHC Data Item Total assets BHCK2170 Total loans BHCK2122 Total deposits BHDM6631 + BHDM6636 + BHFN6631 +
BHFN6636 Total C&I loans BHCK1763 +BHCK1764 US C&I loans BHCK1763 Loans secured by real estate BHCK1410 Agriculture loans BHCK1590 Consumer loans BHCKB538 + BHCK2011 Total foreign loans (including C&I) BHCK1764 + BHCK1296 + BHCK2081 Return on assets BHCK4340/(total assets) Return on equity BHCK4340/BHCK3210 Interest margin/total assets BHCK4074/(total assets) Total equity capital/total assets BHCK3210/(total assets) Total risk-adjusted capital ratio BHCK7205 Tier 1 risk-adjusted capital ratio BHCK7206 Total risk-adjusted assets/total assets BHCK2223/(total assets) Nonperforming loans BHCK5525 + BHCK5526 Liquid assets BHCK0081 + BHCK0395 +BHCK0397
+ BHCK1350 +BHCK1754 + BHCK1773

26
Appendix II Summary of banks’ disclosures about the use credit derivatives. Information is from year-end selected 10-K filings and annual reports for fiscal year-ends 2001, 2002, and 2003. In some cases, information is from 1999 year-end financial statements. Amsouth: Amsouth reports using credit default swaps (CDS) to buy credit protection at year-end 2001 (notional amount = $85 million) on the BHC database. We are unable to find information in the 10-K filing or annual report for year-end 1999. The bank reports using no credit derivatives at year-ends 2002 and 2003. Bank of America (BOA): In BOA’s annual report and 10-K filing for fiscal year-end 2002, the following information is disclosed: The Global Corporate and Investment Bank Sector of BOA is responsible for managing loan and portfolio counterparty risk. The group uses risk mitigation techniques including credit default swaps (CDS). In footnote (1) of Table VIII (page 62), BOA discloses using credit derivatives to provide credit protection (single name CDS, basket CDS, and CLOs) for loan counterparties in the amounts of $16.7 billion and $14.5 billion at year-end 2002 and 2001, respectively. In BOA’s discussion of its trading accounts, BOA discloses trading-related net interest income of $893 million and $1,054 million at year-end 2002 and 2001, respectively, for credit derivatives. In footnote (3) of this table, BOA discloses that credit derivatives include credit fixed income, credit derivatives, hedges of credit exposure and mortgage banking assets. In its’ 10-K filings, the bank reports trading revenue related to its credit portfolio hedges of -$330 million and $84 million in 2003 and 2002, respectively. At year-end 2002 and 2001, BOA discloses that the notional amount of credit derivatives held by BOA were $92 billion and $57 billion, respectively. The related credit exposure of the credit derivatives was $1,253 million and $631 million, respectively. This credit risk does not take into consideration the value of any collateral. It does, however, take into consideration the effects of legally enforceable master netting agreements. BOA also provides credit derivatives to “sophisticated customers who wish to hedge existing credit exposures” or take on additional credit risk to generate revenue. BOA’s credit derivative positions consisted primarily of CDS and total return swaps. Bank of New York (BONY): BONY discloses using credit derivatives in footnote 1 under the “Credit risk management” section in its 2002 10-K filing. The bank also uses total return swaps (CDS) to provide credit enhancements to its commercial paper securitization program. The fair value of the company’s credit derivatives that are held for trading purposes were $7 million in assets and $3 million in liabilities at year-end 2002 ($8 and $3 million, respectively at year-end 2001). The non-interest income related to trading activities in credit derivatives was -$5 million in 2002 and $3 million in 2001. The notional amount of BONY’s credit derivatives outstanding at year-end was $1,818 million and $1,636 million at year-end 2002 and 2001, respectively. The disclosed credit exposure related to the credit derivatives was $6 million and $8 million at year-end 2002 and 2001, respectively. Bank One: Bank One primarily uses CDS and short bond positions as protection against the deterioration of credit quality on commercial loans and loan commitments. The change in the fair value of credit derivatives is included in trading results in the bank’s corporate financial statements, “while any credit assessment change in the identified commercial credit exposure is reflected as a change in the allocated credit reserves.” At year-end 2002, the notional amount of credit derivatives “economically hedging” commercial credit exposure equaled $7.3 billion and related trading revenue was $42 million.

27
Cathay Bancorp: Cathay only reported using credit derivatives in 1999. On BHC database, $20 million was reported for credit derivatives in which the bank was guarantor (ie, sold credit risk protection). In the footnotes of the bank’s 1999 10-K filing, the bank disclosed a commercial commitment issued by the bank to guarantee the credit performance of $20 million of corporate debt. Charter One Financial: Charter One reports using credit derivatives in 1999, 2000, and 2001 on the BHC database. We are unable to find any information on the use of credit derivatives by Charter One in the financial statements for these fiscal-year ends. Chase Manhattan: Chase is in the sample in 1999. After this time, the bank is part of JP Morgan Chase. According the BHC database, the bank was a net seller of credit risk protection in 1999. We are unable to find information on the use of credit derivatives by Chase in its 10-K filing for fiscal year-end 1999. Citigroup: Citigroup reported large notional amounts of credit derivatives on the BHC database. In its 2003 10-K filings, Citigroup reports its total notional amount of credit derivatives for year-ends 2003 and 2002. In the bank’s discussion of “credit risk mitigation,” the bank discloses using credit derivatives to hedge portions of the credit risk in its portfolio. At year-ends 2003 and 2002, $11.1 billion and $9.6 billion of credit risk exposure was hedged through the use of credit derivatives and other risk mitigating techniques. The credit risk protection was hedging underlying credit exposure with risk ratings of 35% AAA/AA/A and 55% BBB. Any gains or losses on credit derivatives are part of trading revenues.Credit derivatives also are used for trading purposes. Trading-related revenue related to credit derivatives is reported as part of fixed income trading-related revenue in footnote (9). Citibank provides guarantees to customers in the form of CDS, total return swaps, and other written options. Citigroup also uses credit derivatives to create synthetic collateralized debt obligations. Commerce Bancorp: Commerce is a seller of credit risk protection for all years in the sample and never a buyer of credit risk protection. The bank uses CDS to diversify its loan portfolio by assuming credit exposure from different borrowers or industries without actually extending credit in the form of a loan. Community Banks: Community Banks only reports using credit derivatives for fiscal year-end 2003 on the BHC database. At year-end 2003, the bank is a buyer of credit risk protection. The notional amount of this protection is $7 million. We are unable to find information on the use of credit derivatives by Community Banks in its 10-K filing for fiscal year-end 2003. First Bancorp: First Bancorp is only in the sample as a user of credit derivatives in 1999. At year-end 1999, the bank was net buyer of credit protection ($460.12 million bought and $1.88 million sold) according to the BHC database. We are unable to find information on the use of credit derivatives by First Bancorp in its 10-K filing for fiscal year-end 1999. First South Bancorp: First South Bancorp is only in the sample as a user of credit derivatives in 2003. At year-end 2003, the bank was seller of credit protection (notional amount = $25 million) according to the BHC database. We

28
are unable to find information on the use of credit derivatives by First South in its 10-K filing for fiscal year-end 2003. First Tennessee National Corp: First Tennessee is always a seller of credit protection and never a buyer of credit protection. The bank uses CDS in a synthetic collateralized loan obligation (CLO) structure. FleetBoston Financial: FleetBoston uses credit derivatives to hedge domestic credit risk ($24 million notional amount) and international credit risk of variable loans ($392 million notional amount). The bank also uses CDSs to provide direct credit support to commercial paper conduits. FleetBoston discloses entering into offsetting credit derivatives with third parties. Credit derivatives also are used in trading activities. Credit derivatives are entered into to satisfy customers’ investment and risk management needs. The majority of the credit derivatives in the trading portfolios consists of offsetting or back-to-back positions. JPMorgan Chase: The bank discusses the use of credit derivatives in a number of places in its 10-K filings. It has the most extensive discussion of credit derivatives of all the sample banks. On page 52 of its 2002 filing, JPMorgan discloses the use of these instruments in the “Credit derivatives” section. The bank discloses that the marking-to-market treatment of these hedges provide some natural offset. Gains of $127 million in 2002 related to credit derivatives used to hedge the firm’s credit exposures were included in trading revenue. JPMorgan reports credit derivatives use related to its asset portfolio and dealer/client activity. The notional amount of protection bought was $34.262 billion and $158.795 billion, respectively, for the portfolio management and dealer/client activity. The notional amount of protection sold was $495 billion and $172.494 billion, respectively, for the portfolio management and dealer/client activity. The total sum of all these positions ($366.045 billion) is reported under credit derivatives under “Derivatives contracts” section. Credit derivatives use also is disclosed in “Credit portfolio” section of the 2002 financial statements. The notional amount reported ($33.767 billion) equals the net credit protection bought and reported on page 52 and discussed above. The bank notes that these derivatives do not qualify for hedge accounting. Johnson International: Johnson International is a buyer of credit risk protection only in 2001 according to the BHC database. The notional amount of the credit protection is $10.24 million. We are not able to find disclosures about the bank’s use of credit derivatives in its financial statements. KeyCorp: KeyCorp was buyer of credit risk protection in years 1999 to 2001 and 2003. It only sold credit risk protection in 2000 and 2001. The bank did not use credit derivatives in 2002. We are unable to find information on the use of credit derivatives by KeyCorp in its 10-K filing for fiscal year-ends 1999, 2000, 2001, and 2003. Mellon Financial: Mellon uses credit derivatives in 2001 and 2003 but not in 2002. In both of these years (2001 and 2003), the bank is only a buyer of credit risk protection ($552.19 million and $612.44 million, respectively). Mellon discloses using CDS to hedge the credit risk associated with commercial lending activities. These hedges do not qualify as hedges for accounting purposes. The bank disclosed a net trading loss of $4 million in 2003 related to its use of CDS. The notional amount of CDS outstanding at fiscal year-end 2003 is reported in “other products” of the table in the bank’s footnote on derivative instruments used for trading and risk management purposes.

29
Midwest Banc Holdings: Midwest Banc Holdings is in the sample as a user of credit derivatives in 2002. At year-end, the notionam amount of credit derivatives was $50 million. This amount represents two CDSs in which the bank sold credit risk protection. The credit ratings of the CDSs were Aa2/AA and Aa1/AAA. The bank receives a quarterly fee of 1.25% of the notional amount and 1% of the notional amount for entering into the swap. National City: National City reports using credit derivatives in 1999, 2000, 2001, and 2003. In all years, the bank was a net buyer of credit risk protection. In its 2001 annual report, the bank discusses other derivatives as a group but we are unable to find any direct information on credit derivatives use in the 2001 and 2003 financial statements. Northern Trust: Northern Trust is a buyer of credit protection in all years that the bank is a user of credit derivatives according to the HBC database. The financial statements appear to disclose information about these instruments under “other derivatives.” We were unable to find any disclosures specifically related to credit derivatives use. PNC Financial Services Group: PNC Bank uses credit default swaps to hedge credit risk associated with commercial lending activities. The bank discloses that the net realized income in connection with the CDS for 2002 is not significant. The bank also discloses in its filing statements that CDS are used to lower required regulatory capital associated with commercial lending activities (2000 10-K). Provident: Provident is a user of credit derivatives from 2001 to 2003. For all of these years, the bank is a buyer of credit risk protection, except in 2001 when the bank is a net buyer of credit risk protection. The bank discloses using credit risk transfer arrangements to transfer over 97.5% of the credit risk on an auto lease portfolio. Provident discloses that the use of credit derivatives allows the bank to lower its concentration in auto leasing while reducing its regulatory capital requirements. Summit Bancorp: Summit was a user of credit derivatives in 2000. At year-end 2000, the bank reports buying $9.83 million in credit risk protection according to the BHC database. We are unable to find disclosures about credit derivatives use in Summit’s financial statements. Suntrust: Suntrust buys and sells credit risk protection to customers and dealers using CDS. The notional amounts of these CDS referenced in the “trading activities” footnotes in the 2002 annual report ($180 and $150 million for 2002 and 2001, respectively) correspond to the notional amounts of credit protection sold in the BHC database for these years. Suntrust also sold credit risk protection in 2003. The bank bought credit risk protection in 2001 and 2003. In 2001, the bank was net seller of credit protection. In 2003, the bank was a net buyer of credit risk protection. U.S. Bancorp: U.S. Bancorp uses credit derivatives in its trading activities according to the bank’s financial statements. The bank buys and sells credit protection to customers and dealers using CDS. These credit derivatives are accounted for as trading assets and any gain or loss in market value is recorded in bank’s trading income. The notional amounts of credit derivatives are not reported in tables listing derivatives used for risk management purposes.

30
First Union and Wachovia: First Union is in the sample as a user of credit derivatives in 1999 and 2000. In 2001, First Union merges with Wachovia Bank. The merged bank is called Wachovia Corporation. Wachovia Corporation is a user of credit derivatives in 2001, 2002, and 2003. Note that Wachovia (old) also used credit derivatives prior to the merger. Wells Fargo: Wells Fargo discloses the use of CDS in Note 26 (Derivative Financial Instruments) of its 2002 annual report (pages 104 to 106). The bank uses CDS for trading and “customer accommodations.” In the footnote to the table, the Wells Fargo states that it bought $2.2 billion in credit protection and sold $2.5 billion (which correspond to the numbers on the BHC database). The bank also notes that almost all of the protection purchases are exact offsets (defined by the bank as use of the same reference obligation and maturity) to the contracts in which the bank is providing credit protection to a counterparty.

31
Appendix III Table A.1. Pearson correlations of selected explanatory variables
Pearson correlation coefficients for selected explanatory variables used in the probit regressions for year-end 2003. The sample includes all bank holding companies which filed report FR Y-9C (Consolidated Financial Statements for Bank Holding Companies) with the Federal Reserve System with total assets (book value) equal to or greater than one billion dollars. Data are obtained from Federal Reserve Bank of Chicago Bank Holding Companies Database. KA is the total equity capital ratio. LNTA equals the natural logarithm of total assets. NETINCTA equals net income scaled by total assets. NETINTA equals net interest margin scaled by total assets. L_CITOT equals the ratio of US C&I loans to total loans. L_UCITOT equals the ratio of US C&I loans scaled by total loans. L_RETOT equals the ratio of loans secured by real estate to total loans. L_AGTOT equals the ratio of agricultural loans scaled by total loans. L_TOTCONTTOT equals the ratio of total consumer loans loans to total loans. FOREIGN is an indicator variable equal to one if a bank originates foreign-denominated loans and zero otherwise. SEC is an indicator variable equal to one if a bank is engages in securitization activity and zero otherwise. SAL is an indicator variable equal to one if a bank is engages in loan sales and zero otherwise. TOTDEPA equals total deposits scaled by total assets. LIQA equals total liquid assets scaled by total assets. NPA equals non-performing assets scaled by total assets. *, **, and *** indicate significance at the 10%, 5% and 1% levels, respectively.
KA LNTA NETINCTA NETINTA L_UCITOT L_RETOT L_AGTOT L_TOTCONTOT FOREIGN SEC
LNTA -0.037
NETINCTA 0.508*** 0.079
NETINTA -0.016 -0.162*** -0.020
L_UCITOT 0.068 -0.003 0.187*** 0.022
L_RETOT -0.174*** -0.304*** -0.247*** 0.126** -0.488***
L_AGTOT 0.089 -0.184*** 0.021 0.169*** 0.158*** -0.190***
L_TOTCONTOT 0.151*** 0.213*** 0.130** 0.066 -0.158*** -0.568*** 0.014
FOREIGN -0.025 0.518*** -0.039 -0.060 0.207*** -0.316 -0.073 0.057
SEC 0.075 0.614*** 0.131** -0.147 -0.032 -0.225 -0.105* 0.208*** 0.364***
SAL -0.100* 0.394** -0.007 0.032 -0.017 0.038 -0.073 -0.023 0.173*** 0.270*** Continued on next page

32
Table A.1. Pearson correlations of selected explanatory variables (continued)
TOTDEPA LIQA NPA
TOTDEPA
LIQA -0.1237**
NPA -0.0175 -0.2624***
KA -0.1774*** -0.0313 -0.1007*
LNTA -0.4415*** -0.0147 0.0573
NETINTA 0.3582*** -0.4369*** 0.1926***
L_CITOT 0.1106** -0.0497 0.0477
L_UCITOT 0.0820 -0.0489 0.0142
L_RETOT 0.2306*** -0.04555 0.021
L_AGTOT 0.1926*** -0.0382 -0.0032
L_TOTCONTOT -0.1586*** -0.0842 -0.0300
SEC -0.3487 -0.1154 0.0965
SAL -0.0859 -0.1348 0.1476**
FOREIGN -0.1104** -0.0504 0.0739

33
Table 1. Derivatives, loan sales, and securitization activities Frequency of derivatives, loan sales, and securitization activities by large US bank holding companies compiled from data reported in Schedule HC-L of the Federal Reserve System’s FY-9C filings (Consolidated Financial Statements for Bank Holding Companies) for bank holding companies at year-end. The sample includes all bank holding companies which filed report FR Y-9C with the Federal Reserve System with total assets (book value) equal to or greater than one billion dollars. Credit derivatives are off-balance-sheet arrangements that allow one party (the ‘‘beneficiary’’) to transfer the credit risk of a ‘‘reference asset’’ to another party (the ‘‘guarantor’’). Credit derivatives include credit default swaps, total rate of return swaps, synthetic collateralized loan, debt, and commercial paper obligations, and other credit derivative instruments.”(Instructions for Preparation of Reporting Form FY-9C). 2003 2002 2001 2000 (n = 345) (n = 305) (n=245) (n=286) Credit derivatives User of credit derivatives 5.51% 4.92% 8.16% 5.94% Seller of credit risk protection
3.77 4.26 5.31 3.85
Buyer of credit risk protection
5.22 3.61 7.35 4.90
Loan Sales Auto Loans 0.87% 0.66% 0.42% NA 1-4 Family Residential 23.19 22.92 20.75 NA Credit Card Receivables 1.74 1.66 1.67 NA Other Consumer Loans 0.87 1.66 1.67 NA C&I loans 3.19 4.32 4.98 NA Other loans 3.48 3.65 3.75 NA Loan Securitization Auto Loans 4.64% 6.64% 9.58% NA 1-4 Family Residential 12.75 15.28 16.94 NA Home Equity Lines 3.77 3.99 4.96 NA Credit Card Receivables 2.90 3.65 5.00 NA Other Consumer Loans 3.48 4.32 5.42 NA C&I loans 3.19 4.30 4.15 NA Other loans 5.22 5.65 5.83 NA Other derivatives use Interest rate 56.23% 53.09% 51.61% 50.17% Foreign exchange 19.13 19.34 20.33 21.40 Equity 8.70 7.54 7.76 7.04 Commodity 2.90 3.93 4.08 3.17

34
Table 2. Credit derivatives use Selected descriptive statistics on credit derivatives use by large US bank holding companies compiled from data reported in Schedules HC-L and HC-S of the Federal Reserve System’s FY-9C filings (Consolidated Financial Statements for Bank Holding Companies) for bank holding companies at year-end. The sample includes all bank holding companies which filed report FR Y-9C with the Federal Reserve System with total assets (book value) equal to or greater than one billion dollars. Data are obtained from Federal Reserve Bank of Chicago Bank Holding Companies Database. 2003 2002 2001 Panel A: Total notional amount of credit risk protection bought and sold by all banks Notional amount ($US millions) by all banks $988,215 $630,152 $438,851 Percentage of total assets 13.44% 9.44% 7.57% Percentage of total loans 26.75 18.30 14.08 Buyers and sellers of credit risk protection Total assets of buyers and sellers of credit risk
protection/total assets of all banks 66.69% 61.02% 71.80%
Total loans of buyers and sellers of credit risk protection/total loans of all banks 64.42 57.59 67.04
Panel B: Total net notional amount of credit risk protection bought by all banks Notional amount ($US millions) by all banks $67,720 $58,412 $34,748 Percentage of total loans 1.83% 1.70% 1.11%
Average [Median]
Average [Median]
Average [Median]
Panel C: Total notional amount of credit risk protection bought and sold by users of credit derivatives Number of banks using credit derivatives 19 15 20 Notional amount ($US millions) per user of credit
derivatives user $52,011
[612] $42,010 [1,818]
$21,943 [1,094]
Percentage of total loans 21.70% [2.98]
18.27% [5.68]
10.88% [1.79]
Panel D: Average net notional amount of credit risk protection bought by net buyers of credit risk protection Number of banks 17 8 13
Net notional amount ($US millions) per net buyer $3,984 [166]
$7,301 [1,793]
$2,673 [198]
Percentage of total loans 2.84% [0.69]
4.94% [3.06]
3.26% [0.64]
Panel E: Average net notional amount of credit risk protection sold by net sellers of credit risk protection Number of banks 2 7 7
Net notional amount ($US millions) per net seller $8,312 [8,312]
$673 [233]
$5,065 [546]
Percentage of total loans 3.13% [3.13]
1.38% [0.64]
2.79% [1.57]

35
Table 3. Sample of Bank Holding Companies Credit Protection Activity for year-end 2003 Sample of credit derivatives activity for sample banks which disclosed using credit derivatives at year-end 2003. Data are from FY-9C filings (Consolidated Financial Statements for Bank Holding Companies) with the Federal Reserve System. The sample includes all bank holding companies which filed report FR Y-9C with the Federal Reserve System with total assets (book value) equal to or greater than one billion dollars. Data are obtained from Federal Reserve Bank of Chicago Bank Holding Companies Database.
Credit Risk Protection Percentage of Total Loans
Bank Total Loans
($ Mils) Bought ($ Mils)
Sold ($ Mils)
Total Notional ($ Mils) Bought-Sold Bought Sold
J.P. Morgan Chase & Co. $219,518.00 $301,738.00 $275,955.00 $577,693.00 $25,783.00 137.45% 125.71% Citigroup Inc. 504,803.00 87,742.00 104,341.00 192,083.00 -16,599.00 17.38 20.67
Bank Of America Corporation 380,371.00 83,094.83 53,692.38 136,787.21 29,402.45 21.85 14.12 Wachovia Corporation 184,884.00 20,358.00 15,239.00 35,597.00 5,119.00 11.01 8.24 Bank One Corporation 171,511.00 11,675.00 8,749.00 20,424.00 2,926.00 6.81 5.10 Fleetboston Financial Corporation 127,983.00 8,930.00 7,000.00 15,930.00 1,930.00 6.98 5.47 Wells Fargo & Company 289,597.00 2,759.00 2,657.00 5,416.00 102.00 0.95 0.92
The Bank Of New York Company 35,769.90 852.95 559.60 1,412.54 293.35 2.38 1.56 Suntrust Banks, Inc. 86,284.38 246.00 195.00 441.00 51.00 0.29 0.23 U.S. Bancorp 119,668.00 127.00 64.00 191.00 63.00 0.11 0.05 National City Corporation 94,646.41 85.21 62.54 147.76 22.67 0.09 0.07 First South Bancorp, Inc. 839.93 0.00 25.00 25.00 -25.00 0.00 2.98
Keycorp 62,700.36 40.00 20.00 60.00 20.00 0.06 0.03 Amsouth Bancorporation 29,476.00 6.00 0.00 6.00 6.00 0.02 0.00 Community Banks, Inc. 1,084.68 7.50 0.00 7.50 7.50 0.69 0.00 Mellon Financial Corporation 7,450.77 612.44 0.00 612.44 612.44 8.22 0.00 Northern Trust Corporation 17,838.71 68.75 0.00 68.75 68.75 0.39 0.00
PNC Financial Services Group, Inc. 35,507.61 165.63 0.00 165.63 165.63 0.47 0.00 Provident Financial Group, Inc. 9,541.23 1,147.55 0.00 1,147.55 1,147.55 12.03 0.00

36
Table 4. Selected Characteristics of net buyers of credit risk protection and all other banks Selected characteristics of banks that were net buyers of credit risk protecting based on their use of credit derivatives at year-end 2003. A bank is defined as a net of buyer of credit protection if the notional amount outstanding of credit derivatives on which the reporting bank is beneficiary is greater than the notional amount outstanding of credit derivatives on which the reporting bank is a guarantor on Schedule HC-L of form FR Y-9C (Consolidated Financial Statements for Bank Holding Companies).. All data are measured as of fiscal year-end 2003. The last column report p-values for tests of the equality of means (medians) between credit derivative users and non users. *, **, and *** indicate significance at the 10%, 5% and 1% levels, respectively. All other banks Net buyers of
credit protection p-values for tests
of equality of:
Variable
Mean [Median]
Mean [Median]
Means [Medians]
Total assets ($ million) $11,321.72 [2,194.81]
$213,390.7 [113,933.5]
0.003*** [0.000]***
Total loans/total assets 0.6266 [0.6549]
0.5536 [0.5575]
0.050** [0.026]**
Total deposits/total assets 0.7234 [0.7536]
0.6043 [0.6122]
0.000*** [0.000]***
Composition of loan portfolio Total C&I /total loans 0.1698
[0.1497] 0.2274
[0.2204] 0.001***
[0.001]*** Loans secured by real estate/total loans
0.6815 [0.7138]
0.4835 [0.4967]
0.000*** [0.000]***
Agriculture/total loans 0.0131 [0.0014]
0.0030 [0.0014]
0.000*** [0.804]
Total consumer loans/total loans 0.0887 [0.0525]
0.1174 [0.1302]
0.066* [0.001]
Total foreign loans/total loans 0.0053 [0.000]
0.0226 [0.0062]
0.036** [0.000]***
Profitability measures Return on assets 0.0120
[0.0113] 0.0130
[0.0125] 0.347
[0.794] Return on equity 0.1375
[0.1317] 0.1598
[0.1456] 0.023**
[0.006]*** Net Interest Margin/total assets 0.0338
[0.0338] 0.0271
[0.0282] 0.000***
[0.006]*** Continued on next page

37
All other banks Net buyers of
credit protection p-values for tests
of equality of:
Variable
Mean [Median]
Mean [Median]
Means [Medians]
Risk Measures Total equity capital/total assets 0.0889
[0.0855] 0.0808
[0.0809] 0.048**
[0.218] Tier 1 risk-adjusted capital ratio (%) 12.30
[11.12] 8.98
[8.55] 0.000***
[0.002]***
Total risk-adjusteded capital ratio (%)
14.03 [12.84]
12.55 [12.44]
0.000*** [0.227]***
Risk adjusted assets/total assets
0.7113 [0.7243]
0.8016 [0.7872]
0.001*** [0.006]***
Liquidity/total assets 0.2924 [0.2740]
0.2606 [0.2749]
0.336 [0.813]
Non-performing assets/total assets 0.0057 [0.0046]
0.0084 [0.0070]
0.518 [0.448]
Credit management and derivative activities
Mean
Mean
p-value for tests of equality means
Asset securitization 16.16% 88.24% 0.000*** Loan sales 23.78 70.59 0.0258** Use interest-rate derivatives 53.96 100.00 NA Use foreign exchange derivatives 15.24 94.12 0.000*** Use equity derivatives 5.49 70.59 0.000*** Use commodity derivatives 1.22 35.29 0.000*** Total trading revenue $19.13
[0.00] $425.78 [129.91]
0.1289 [0.000]***
Total trading revenue/total assets 0.0002 [0.000]
0.0017 [0.0007]
0.005*** [0.000]***

38
Table 5. The likelihood of buying net credit risk protection using credit derivatives Probit regression estimates of the likelihood of buying net credit risk protection using credit derivatives. The dependent variable equals one if a bank is a net buyer of credit risk protection and zero otherwise. ΔProb measures the change in the probability of using credit derivatives per unit change in the relevant explanatory variables. For indicator variables, the coefficient represents the change in the probability associated with moving the indicator from 0 to 1. Panel A uses a banks total equity capital ratio as a measure of a bank’s capital ratio. Panel B uses tier 1 risk-adjusted capital ratio as a measure of a bank’s capital ratio. Model (1) is estimated using a cross-sectional time series panel using all sample years for which data are available. The regression is estimated with robust standard errors to control for heteroskedasticity across sample years. Model (2) is estimated using the 2003 sample with robust standard errors to control for heteroskedasticity across banks. Models (3) to (7) are estimated using the 2003 sample with robust standard errors to control for heteroskedasticity across banks. All explanatory variables are lagged one year. *, **, and *** indicate significance at the 10%, 5% and 1% levels, respectively. P-values are in parentheses.
Panel A: Model (1) Model (2) Model (3) Model (4) Model (5) Model (6) Model (7)
Variable
ΔProb (p-value)
ΔProb (p-value)
ΔProb (p-value)
ΔProb (p-value)
ΔProb (p-value)
ΔProb (p-value)
ΔProb (p-value)
Total equity capital ratio
-0.0421** (0.027)
-0.0678 (0.198)
-0.1844* (0.098)
-0.7275*** (0.003)
-0.2739*** (0.007)
-0.5618*** (0.007)
-0.2663** (0.012)
Natural logarithm(total assets) 0.0051***(0.000)
0.0063***(0.000)
— — — — —
Net interest margin/total assets -0.2380***(0.001)
-0.967*** (0.001)
-0.6918* (0.085)
— — — —
Total deposits/total asset — — — -0.0995*** (0.000)
-0.0189 (0.114)
-0.8133*** (0.000)
-0.0350***(0.003)
Liquidity ratio — — — -0.1058** (0.044)
0.0250 (0.104)
-0.0669 (0.147)
-0.0179 (0.350)
Non performing loans/total assets
— — — 0.6552 (0.420)
0.1820 (0.668)
0.5970 (0.402)
0.5738* (0.097)
Total C&I loans/total loans
0.0129***(0.000)
0.0193* (0.091)
0.0552*** (0.003)
0.1677*** (0.000)
0.0397** (0.010)
0.1327*** (0.000)
—
US C&I loans/total loans
— — — — — — 0.0553*** (0.004)
Agricultural loans/total loans -0.1736***(0.000)
-0.1264 (0.421)
-0.8106* (0.085)
-0.8925** (0.014)
-0.2798 (0.164)
-0.7491** (0.024)
-0.3245 (0.137)
Total consumer loans/total loans -0.0025 (0.774)
0.0104 (0.489)
0.0246 (0.230)
0.0637 (0.106)
0.0082 (0.674)
0.0495 (0.141)
0.0125 (0.579)

39
Panel A, continued:
Model (1) Model (2) Model (3) Model (4) Model (5) Model (6) Model (7) Variable
ΔProb (p-value)
Coeff. (p-value)
ΔProb (p-value)
ΔProb (p-value)
ΔProb (p-value)
ΔProb (p-value)
ΔProb (p-value)
Uses equity or commodity derivatives
— — 0.2150*** (0.000)
Securitizes loans — — — — 0.2208*** (0.000)
— —
Sells loans — — — — — 0.0876*** (0.003)
—
Originates foreign loans — — — — — — 0.0846*** (0.000)
Pseudo R2 0.5192 0.5718 0.4136 0.2362 0.4588 0.2975 0.4014
Number of observations. 1,029 301 297 301 301 301 301
40
Panel B
Model (1) Model (2) Model (3) Model (4) Model (5) Model (6) Model (7) Variable
ΔProb (p-value)
ΔProb (p-value)
ΔProb (p-value)
ΔProb (p-value)
ΔProb (p-value)
ΔProb (p-value)
ΔProb (p-value)
Tier 1 risk-adjusted capital ratio -0.0002***(0.000)
-0.0004***(0.004)
-0.0010*** (0.007)
-0.0020** (0.001)
-0.0008*** (0.001)
-0.0014*** (0.001)
-0.0010** (0.001)
Natural logarithm(total assets) 0.0052***(0.000)
0.0010 (0.000)
— — — — —
Net interest margin/total assets -0.0731***(0.000)
-0.1551*** (0.000)
-0.2203*** (0.001)
— — —
Total deposits/total asset — — — -0.0115** (0.014)
-0.0024 (0.268)
-0.0078** (0.018)
-0.0063** (0.016)
Liquidity ratio — — — 0.0026 (0.776)
0.0103*** (0.003)
0.0042 (0.526)
0.0044 (0.322)
Non performing loans/total assets
— — — 0.0492 (0.698)
0.0185 (0.781)
0.0390 (0.684)
0.0821 (0.241)
Total C&I loans/total loans
0.0017***(0.006)
0.0024 (0.317)
0.0024 (0.560)
0.0142** (0.018)
0.0025 (0.412)
0.0088** (0.040)
—
US C&I loans/total loans
— — — — — — 0.0086** (0.046)
Agricultural loans/total loans -0.0262 (0.154)
-0.0327 (0.363)
-0.1201* (0.077)
-0.1116** (0.049)
-0.0478 (0.180)
-0.0775* (0.075)
-0.0675 (0.183)
Total consumer loans/total loans 0.0019 (0.381)
-0.0003 (0.940)
0.0014 (0.693)
-0.0034 (0.614)
-0.0029 (0.330)
-0.0025 (0.596)
-0.0028 (0.588)
Uses equity or commodity derivatives
0.0400*** (0.000)
Securitizes loans — — — — 0.0621*** (0.000)
— —
Sells loans — — — — — 0.0131*** (0.004)
—
Originates foreign loans — — — — — — 0.0115*** (0.000)
Pseudo R2 .0.6017 0.6212 0.5172 0.3683 0.5309 0.4212 0.4636
Number of observations. 529 298 294 298 298 298 298