Embed Size (px)
Citation preview

United StatesDepartmentof Agriculture
EconomicResearchService
AgricultureInformationBulletin Number 790
How Much Do Americans Pay for Fruits and Vegetables?Jane ReedElizabeth FrazãoRachel Itskowitz
ElectronicReport

United States Department of Agriculture
www.ers.usda.gov
Electronic Report from the Economic Research Service
July 2004
AgricultureInformationBulletin Number 790
How Much Do AmericansPay for Fruits andVegetables?
Jane Reed, Elizabeth Frazão, and Rachel Itskowitz
Abstract
Americans do not consume recommended levels of fruits and vegetables.One argument is that they are expensive, especially when purchased fresh.This analysis uses A.C. Nielsen Homescan data on 1999 household foodpurchases from all types of retail outlets to estimate an annual retail priceper pound for 69 forms of fruits and 85 forms of vegetables. Since manyfruits and vegetables contain much that is nonedible in the purchase weight,cost per pound might not be a good indicator of cost per amount consumed.Therefore, this analysis also estimated the number of servings per pound ofpurchased item after excluding all parts of the fruits and vegetables notusually eaten. According to this formula, consumers can meet the recom-mendations of three servings of fruits and four servings of vegetables dailyfor 64 cents. Since this represents only 12 percent of daily food expendi-tures per person in 1999, consumers still have 88 percent of their food dollarleft to purchase the other three food groups. (Even low-income householdshave 84 percent of their food dollar left.) Although cost differences amongfresh and processed forms were generally small, our study also found thatafter adjusting for waste and serving size, 63 percent of fruits and 57percent of vegetables were cheapest in their fresh form.
Keywords: Fruits, vegetables, fresh, processed, retail price, serving.
Contents
Executive Summary . . . . . . . . . . . . . . . . . . . . . . . . . . . . . . . . . . . . . . . . . .iii
Introduction . . . . . . . . . . . . . . . . . . . . . . . . . . . . . . . . . . . . . . . . . . . . . . . . .1
Methodology . . . . . . . . . . . . . . . . . . . . . . . . . . . . . . . . . . . . . . . . . . . . . . . . .3
What Are We Buying? . . . . . . . . . . . . . . . . . . . . . . . . . . . . . . . . . . . . . . . . .7
How Expensive are Fruits and Vegetables? . . . . . . . . . . . . . . . . . . . . . .11
Cost of Meeting Dietary Recommendations . . . . . . . . . . . . . . . . . . . . . .24
Most and Least Expensive Ways To Buy . . . . . . . . . . . . . . . . . . . . . . . . .27
Conclusion . . . . . . . . . . . . . . . . . . . . . . . . . . . . . . . . . . . . . . . . . . . . . . . . .34
References . . . . . . . . . . . . . . . . . . . . . . . . . . . . . . . . . . . . . . . . . . . . . . . . . .35
iiHow Much Do Americans Pay for Fruits and Vegetables / AIB-790
Economic Research Service/USDA
National Agricultural Library Cataloging Record Reed, Jane How much do Americans pay for fruits and vegetables [electronic resource]? (Agriculture information bulletin ; no. 790) 1. Fruit--Prices--United States. 2. Vegetables--Prices--United States. 3. Food prices--United States. I. Frazão, Elizabeth. II. Iskowitz, Rachel.III. United States. Dept. of Agriculture. Economic Research Service.IV. Title.HD9244
The U.S. Department of Agriculture (USDA) prohibits discrimination in its programs and activities on the basis of race, color, national origin, sex, religion, age, disability, political beliefs, sexual orientation, or marital or family status. (Not all prohibited bases apply to all programs.) Persons with disabilities who require alternative means for communication of program information (Braille, large print, audiotape, etc.) should contact USDA's TARGET Center at (202) 720-2600 (voice and TDD).
To file a complaint of discrimination, write USDA, Director, Office of Civil Rights, Room 326-W, Whitten Building, 14th and Independence Ave., SW, Washington, DC 20250-9410, or call (202) 720-5964 (voice and TDD). USDA is an equal opportunity provider and employer.

iiiHow Much Do Americans Pay for Fruits and Vegetables / AIB-790
Economic Research Service/USDA
Executive Summary
Americans consume only half as much fruit as recommended. Vegetableconsumption, although close to recommendations, has a third of total serv-ings coming from French fries, potato chips, and iceberg lettuce. One argu-ment for not consuming more fruits and vegetables is that they areexpensive, especially when purchased fresh. But how expensive are fruitsand vegetables? Do fresh fruits and vegetables really cost more than theirprocessed counterparts? And if so, does it hold for all fruits and vegetables,or only for some?
This analysis uses A.C. Nielsen Homescan data on 1999 household foodpurchases from all types of retail outlets to estimate an annual retail price perpound for 69 forms of fruits and 85 forms of vegetables. Since many fruitsand vegetables contain much that is nonedible in the purchase weight, cost perpound might not be a good indicator of cost per amount consumed. Thisanalysis also estimated the number of servings per pound of purchased itemafter excluding all parts of the fruits and vegetables not usually eaten. Ouranalysis also examined the costs of fruits and vegetables needed to meet thedietary recommendations. Among the 154 forms of fruits and vegetables wepriced, more than half were estimated to cost 25 cents or less per serving.Consumers can meet the recommendations of three servings of fruits and fourservings of vegetables daily for 64 cents. Since this represented only 12percent of daily food expenditures per person in 1999, consumers still had 88percent of their food dollar left to purchase the other three food groups. Evenlow-income households still had 84 percent left.
The study also found that after adjusting for waste and serving size, 63percent of fruits and 57 percent of vegetables were least expensive in theirfresh form. Even though fresh fruits and vegetables may be less expensive toeat than processed, for many fruits and vegetables the difference in price perserving between the least and most expensive versions was often less than 25cents. For some, this price difference may be a small price to pay for theconveniences—such as longer shelf life, ease of preparation, and greater avail-ability—associated with processed forms.

1How Much Do Americans Pay for Fruits and Vegetables / AIB-790
Economic Research Service/USDA
Despite the increasing knowledge about the health benefits of diets high infruits and vegetables, data from the U.S. food supply show that, in 2000,Americans consumed only half as much fruit as recommended by the FoodGuide Pyramid (FGP) for a 2,200-calorie diet. Vegetable consumption wasclose to recommendations, although French fries, potato chips, and iceberglettuce—vegetable forms that are either high in fat or low in nutrients—constituted a third of total daily vegetable servings (Putnam et al., 2000).
The gap between the recommended amounts and the actual consumption offruits and vegetables cannot be entirely attributed to consumer ignorance ofthe health benefits associated with their consumption. According to a surveyby the Food Marketing Institute, among the nearly 70 percent of shopperswho believe their diet could be at least “somewhat” or “a lot healthier,” themost common response among all shoppers on how to improve the health-fulness of their diets was eating more fruits and vegetables (68 percent).This was three times as many people as those responding they would eatless fats and oils (22 percent) or less red meat (22 percent), less junk food(18 percent), or less sugar (17 percent) (Food Marketing Institute, 2000).
Nonetheless, consumers seem to find it difficult to eat more fruits andvegetables. Some also believe they are too expensive (Kurtzweil, 1997) ortoo expensive to serve every day, especially when purchased fresh (Raynoret al., 2002).
One of the problems consumers face is that few know what constitutes aFGP serving of fruits and vegetables (Hogbin and Hess, 1999). Many areconfused because the serving size on the nutrition label often differs fromthe FGP serving size and both probably differ from the amount consumerstypically consume. Consumers are therefore unable to accurately assess thecost of eating a FGP serving of fruits and vegetables and may erroneouslybelieve that cost is a barrier. For example, they may balk at the idea ofpaying 97 cents for a pound of peaches, not realizing that they will begetting 4 FGP servings (½ cup) in a pound, which translates to 21 cents perserving. Consumers may cite cost as a barrier, when other factors such astaste, preferences, and availability may be more important (Shankar andKlassen, 2001). For example, Stewart et al. (2003) found that a marginalincrease in income was not likely to induce low-income households (below130 percent of the poverty line) to spend more on fruits and vegetables,possibly because they have higher priority needs or wants.
How Much Do Americans Payfor Fruits and Vegetables?
IntroductionJane Reed, Elizabeth Frazão,
and Rachel Itskowitz
2How Much Do Americans Pay for Fruits and Vegetables / AIB-790
Economic Research Service/USDA
So, how expensive are fruits and vegetables? And do fresh fruits and vegeta-bles really cost more than processed, as is widely believed? If so, does thishold for all fruits and vegetables, or only for some?
The purpose of this report then is twofold: to examine the purchase andserving prices of fresh and processed fruits and vegetables, and to calculatethe cost of meeting fruit and vegetable recommendations in terms of the FGP.
3How Much Do Americans Pay for Fruits and Vegetables / AIB-790
Economic Research Service/USDA
Methodology
To determine the cost of fruits and vegetables, we used 1999 A.C. NielsenHomescan data, which collect information from a sample of consumers onthe foods they buy from all types of retail outlets (see box, “About theData”). We restricted the data to the most common fresh fruits and vegeta-bles, excluding more exotic items such as guava or bok choy. We included25 different fresh fruits and 29 different fresh vegetables. For some of thefresh vegetables, we included more than one type of that vegetable, such aswhole and baby carrots, and broccoli and broccoli florets. We then matchedall the fresh fruits and vegetables with their plain (e.g., unsweetened, unfla-vored) processed counterparts. Some of the processed items included morethan one form of that fruit or vegetable. For example, for processed cherrieswe included canned and frozen sweet and tart cherries, and for asparagus,we included cut and whole canned and frozen asparagus. We also includedin the analysis one processed fruit (dried figs) and one processed vegetable(canned beets) for which we were unable to obtain fresh prices. Weexcluded fresh cranberries, all forms of lemons and limes, and dehydratedonions because they are not typically consumed as a serving, but rather usedas an ingredient. We also excluded dried beans. The final sample consistedof 27 fruits and 30 vegetables, in 69 different forms of these fruits and 85different forms of these vegetables (table 1).
Because the analysis included only plain processed versions, many popularitems are excluded, such as tomato sauce, sweetened or flavored applesauce,fruits canned in syrup, frozen vegetables in sauces, and all mixtures of fruits orvegetables—such as carrots and peas or mixed melon balls. Our final sampleaccounted for 66 percent of all fruit retail sales (in dollars) and 59 percent ofall vegetable sales. (Dried beans alone, which were not included in theanalysis, accounted for 4.5 percent of all vegetable sales in dollars.)
For each item, we estimated the 1999 retail price per pound (weighted-average) by dividing the total dollars spent on that item by the total volumesold. This retail price per pound is the cost of buying fruits and vegetables.These prices represent the average price for all households’ purchases.
However, many fruits and vegetables contain much that is nonedible in thepurchase weight. For example, we do not eat the cob and husk of fresh corn,or the rind on fresh watermelon. In addition, some edible parts are oftenremoved during food preparation, such as stalks of celery or fresh broccoli.Among canned forms, the canning liquid was not counted as part of theserving except in the case of fruits packed in fruit juice, in which case thecanning liquid—a fruit juice—was considered part of the fruit serving.
As a result of these corrections, a comparison of the price per pound maynot be a good indicator of the cost per amount consumed. Therefore, foreach item, we used conversion factors from the USDA Food and NutritionService’s Food Buying Guide for Child Nutrition Programs, 2000, to esti-mate the number of FGP servings obtained from a pound of the purchaseditem. These factors exclude all parts of the fruits and vegetables not usuallyeaten, such as the canning liquid in canned green beans (see box on how weestimated the number of servings). Using the number of servings per pound,

4How Much Do Americans Pay for Fruits and Vegetables / AIB-790
Economic Research Service/USDA
We obtained retail prices usingA.C. Nielsen Homescan data
for 1999. These data represent 7,195 households’ food purchases at avariety of retail outlets nationwide, such as supermarkets, grocery stores,farmers’ markets, mass merchandising outlets, and drugstores. Includedhouseholds were in the sample for at least 10 months of the year. After ashopping occasion, households scanned each item purchased. The datacaptured only foods purchased at retail, not foods purchased at a foodser-vice outlet, such as restaurants or fast-food places.
The analysis covered fruits and vegetables that are estimated in theNational Food Supply, for which we were able to obtain prices (27 fruits,30 vegetables—see table 1). For comparison, and to eliminate nutritionaldifferences, we selected processed versions –canned, frozen, dried, or juiceproducts—that were most similar to the fresh version. For example, to theextent possible, we priced only unsweetened fruit juice, canned fruitpacked in water or juice, and plain frozen fruits and vegetables with noadditional ingredients. As a result, popular products—such as cannedtomato sauce, ketchup, frozen mixtures of peas and carrots, frozen mixedmelon balls, canned fruit packed in syrup, sweetened juices, or sweetenedapplesauce—are not included in the analysis. We did not include freshcranberries, all forms of lemons and limes, and dehydrated onions sincethey are more commonly used as a flavoring and are not usually consumedas a serving. We also excluded “specialty” products such as Portabellomushrooms, frozen shredded carrots, and any products labeled organic.
Some data limitations were related to using of the UPC code, where thedescriptions were often so vague that many assumptions had to be made.For example, for some items, we assumed that the “regular” versionsrepresented the plain version, such as canned mushrooms and sweet pota-toes, whereas for other items additional descriptors were available. Inaddition, for some items, the description was too vague to be used, aswhen greens were described only as “greens.” Also, some fresh fruits andvegetables were measured in counts instead of pounds, and it was notalways clear what that represented. Some items could not be reliablypriced. For some items, such as grapes and bell peppers, it was notpossible to separate out the different types (such as green or red), so alltypes had to be grouped together. Finally, time limitations prevented usfrom pricing dry beans, because of their enormous variety.
Where price appeared to differ among the same product, we separated outdifferent cuts (whole, sliced, shredded, pieces). Juices were also differenti-ated by whether they were shelf-stable, refrigerated, or frozen. Includingthe different forms (fresh, canned, frozen, dried, and juice), the finalsample included 85 vegetables items and 69 fruit items.
To estimate the price per pound, we divided the total weighted dollarsspent for each item by the total weighted sales volume for each item. Toestimate the price per serving, we used the Food and Nutrition Service’sFood Buying Guide for Child Nutrition Programs, 2000, which provides
About the Data
Continued on page 5

5How Much Do Americans Pay for Fruits and Vegetables / AIB-790
Economic Research Service/USDA
*Note: Servings for fresh fruit are ½cup even when the FGP servings are 1piece of fruit. For collard greens, okra,and turnip greens, which are leafy veg-etables, the FGP serving is 1 cup; theconversion factors for these vegetablesis for ½ cup of cooked vegetable.
we then estimated a price per serving for each item. We refer to this price asthe cost of eating fruits and vegetables.
All prices estimated for this report reflect national annual average prices forfresh and processed fruits and vegetables purchased at retail. The cost offruits and vegetables consumed away from home—at restaurants or fast-food outlets, for example—is not included in the estimated prices. Further-more, the estimated prices do not reflect the prices that any one individualpaid for that particular fruit or vegetable. For example, where the item ispurchased—a farmers’ market versus a supermarket, or even what super-market—will affect the price. Whether the item is on sale, whether thecustomer uses a coupon, and what brand the customer chooses will alsoaffect the price. For fresh produce, in particular, seasonality is likely to havea large effect on both the price and the quantity purchased. In addition,economies of scale are often associated with purchasing larger containers,so that the per-pound cost of buying a 26-ounce can of tomatoes is usuallylower than the per-pound cost of buying a 14.5-ounce can (as is the cost ofeating a serving of said tomatoes). For this analysis, prices are averaged outthroughout the year, across all types of retail outlets and package sizes andbrands, yielding a weighted-average price.
information on the serving yield for most fruits and vegetables, in fresh orprocessed form. For example, according to the Guide, a pound of freshpears yields 4.1 ½-cup servings of pear, a pound can of sliced green beansprovides 8.2 ½-cup servings of drained green beans, and a 16-ouncecontainer of frozen peaches provides 5.46 ¼-cup servings. We convertedthe Guide’s servings to FGP-serving sizes (1 cup of raw, leafy vegetables;½ cup of fresh, canned, or frozen fruits and vegetables; ¾ cup of juice; or¼ cup of dried fruits or vegetables*). To estimate the price per serving, wedivided the price per pound by the total number of servings per pound forthe product. For example, the weighted-average retail price of fresh apri-cots was $1.48 per pound and there are 5.95 ½-cup servings in eachpound. Dividing $1.48 by 5.95 results in a price per serving of 25 centsper serving for fresh apricots.
Continued from page 4

6How Much Do Americans Pay for Fruits and Vegetables / AIB-790
Economic Research Service/USDA
Table 1—Fruits and vegetables included in the study
Fruits Vegetables
Apples Honeydew melon, fresh Asparagus Collard greens PotatoesFresh Kiwi fruit, fresh Fresh Fresh FreshCanned1 Mangoes Canned5 Canned6 Canned6
Apples Fresh Cut/tips Frozen6 Frozen6
Applesauce Frozen1 Whole/spears Corn, sweet Dried6
Juice1 Canned Frozen5 Fresh Radishes, freshShelf stable Nectarines, fresh Cut/tips Canned, whole kernel6 SpinachRefrigerated Oranges Whole/spears Frozen, whole kernel6 FreshFrozen concentrate2 Fresh Beans, green Cucumbers, fresh Canned6
Apricots Canned, Mandarin3 Fresh Eggplant, fresh Frozen6
Fresh Juice1 Canned6 Kale SquashCanned3 Shelf stable Cut/sliced Fresh Fresh, zucchiniDried Refrigerated Whole Canned6 Canned, summer6
Avocados, fresh Frozen concentrate2 Frozen6 Frozen6 Frozen, zucchini6
Bananas, fresh Frozen, not concentrated Cut/sliced Lettuce, iceberg SweetpotatoesBlackberries Papayas Whole Lettuce, leaf7 FreshFresh Fresh Beets, canned6 Lettuce, Romaine Canned5
Frozen1 Frozen1 Broccoli Mushrooms8 Frozen5
Canned Canned Fresh Fresh TomatoesBlueberries Peaches Whole Whole FreshFresh Fresh Fleurets Sliced Regular sizedFrozen1 Frozen1 Frozen6 Canned5 Cherry/grapeCanned Canned, Clingstone3 Chopped/cut Whole Roma/plum
Cantaloupe, fresh Pears Spears Sliced Canned6
Cherries Fresh Fleurets Broken JuiceFresh Canned3 Brussels sprouts Frozen5 Turnip greensFrozen1 Pineapple Fresh Mustard greens Fresh
Tart Fresh, whole Canned5 Fresh Canned5
Sweet Canned3 Cabbage, green Canned6 Frozen6
Canned Juice1 4 Fresh Frozen6
Tart3 Plums Canned, sauerkraut5 OkraSweet Fresh Carrots Fresh
Cranberries, juice1 4 Dried, prunes Fresh Canned5
Figs, dried Juice1 4 Whole Frozen6
Grapefruit Raspberries Baby OnionsFresh Fresh Canned6 FreshCanned3 Frozen1 Sliced/cut Canned5
Juice1 Canned Whole/other Frozen, pearl6
Shelf stable Strawberries Frozen6 Peas, greenRefrigerated Fresh Cauliflower FreshFrozen concentrate2 Frozen1 Fresh Canned6
Grapes Canned Whole Frozen6
Fresh Tangelos, fresh Fleurets Peppers, bell, freshDried, raisins Tangerines, fresh Frozen6
Juice1 Watermelon, fresh FleuretsShelf stable CutFrozen concentrate2 Celery, fresh
1 Unflavored/unsweetened.2 Reconstituted.3 Packed in juice/water.4 Shelf stable.5 Regular type.6 Plain.7 Red and green leaf lettuce.8 Excludes "specialty" types of mushrooms, like Portobello and Shitake.

What Are We Buying?
According to the Homescan data, consumers spent $223 billion on food atretail stores in 1999. Expenditures on fruits and vegetables accounted for7.6 percent and 7.7 percent of this total. Fresh fruits and vegetablesaccounted for more than half of all expenditures on fruits and vegetables,while canned vegetables and fruit juices accounted for almost one-third ofexpenditures. In comparison, consumers spent 9 percent on bakery products,8 percent on red meat, 6 percent on carbonated soft drinks, 4.3 percent oncheese, 3.4 percent on breakfast cereals, and 3.2 percent on candy (table 2).
We ranked the 27 fruits and 30 vegetables in our sample according to quan-tity purchased, expenditures, and total servings purchased, regardless of theform in which they were purchased (fresh, canned, frozen, or juice). Again,totals include only the processed products that are plain, unflavored, and/orunsweetened (to the extent possible).
Among the 27 fruits, Americans spent the most money on oranges, boughtthe most pounds of bananas, and ate the most servings of apples (table 3).These three fruits were the top three in quantity and servings, and amongthe top four in expenditures (consumers spent more on grapes than apples).For most fruits (except for watermelon and plums), quantity, cost, and serv-ings are closely related.
Among the 30 vegetables, potatoes accounted for the largest share of expen-ditures, pounds purchased, and servings eaten (table 4). Potato totals weremore than three times as many pounds purchased, and nearly four times asmany servings (but only 15 percent more dollars) as tomatoes, the secondmost popular vegetable in all three categories.
7How Much Do Americans Pay for Fruits and Vegetables / AIB-790
Economic Research Service/USDA
Potato totals were
more than three times
as many pounds pur-
chased, and nearly
four times as many
servings as tomatoes,
the second most popu-
lar vegetable.

8How Much Do Americans Pay for Fruits and Vegetables / AIB-790
Economic Research Service/USDA
Table 2—Expenditures on food purchased at retail outlets, 1999
Food Category Dollars % of total Food Category Dollars % of total
All foods 222,862,762,989 100
Meat, poultry, and fish 41,078,298,793 18.4 Salty snacks including nuts 9,082,146,112 4.1Red meat 17,664,342,800 7.9 Potato chips and sticks 2,500,371,872 1.1Cold cuts, hot dogs, and spreads 8,559,269,929 3.8 Nuts and seeds 2,073,034,267 0.9Poultry 6,429,383,509 2.9 Corn chips 1,624,490,878 0.7Fish and shellfish 4,718,826,619 2.1 Popcorn 969,086,339 0.4Bacon and sausage 3,706,475,935 1.7 Miscellaneous 885,989,636 0.4
Pretzels 582,217,099 0.3Bakery, cereal, and grain products 38,005,481,355 17.1 Cheese products 446,956,021 0.2Cakes, pies, cookies, and other sweet products 11,881,544,428 5.3Bread, rolls, bagels, biscuits, and muffins 9,148,486,715 4.1 Candy, gum, and mints 8,104,053,108 3.6Cereal 7,496,772,893 3.4 Candy 7,163,102,158 3.2Crackers, croutons, and bars 4,812,948,468 2.2 Gum 650,816,951 0.3Rice, pasta, and noodles 2,410,965,454 1.1 Mints 175,090,160 0.1Crusts, shells, and tortillas 1,280,885,167 0.6 Marshmallows 115,043,838 0.1Barley, meal, grits, and flour 629,221,254 0.3Miscellaneous 344,656,975 0.2 Sauces, gravies, marinades, etc. 5,796,967,387 2.6
Sauces 3,819,277,789 1.7Dairy, eggs, and dairy/egg substitutes 30,560,579,959 13.7 Catsup, mustard, relish 859,817,937 0.4Milk, cream, and milk/cream substitutes 10,535,389,250 4.7 Dips and spreads 451,324,196 0.2Cheese 9,614,062,455 4.3 Gravy 364,609,882 0.2Desserts, toppings, and yogurt 7,389,271,370 3.3 Vinegar and cooking wine 211,079,375 0.1Eggs and egg mixes 1,584,148,655 0.7Butter 969,467,368 0.4 Salad dressings, cooking fats and oils 4,937,384,840 2.2Sour cream 468,240,860 0.2 Salad dressing 2,284,275,202 1.0
Margarine 1,264,788,199 0.6Beverages other than juice 22,978,356,323 10.3 Cooking oil 1,215,793,487 0.5Soft drinks 13,284,342,252 6.0 Shortening and lard 172,527,951 0.1Coffee, tea, cocoa, and breakfast drinks 5,653,300,350 2.5Fruit drinks and cider 2,903,185,329 1.3 Sugar/sugar substitutes, syrups, jams, etc. 3,819,112,513 1.7Water 1,047,754,065 0.5 Sugar 1,171,015,097 0.5
Peanut butter 879,583,291 0.4Prepared meals/foods and soups 21,824,493,722 9.8 Jams, jellies, etc. 588,370,669 0.3Entrees 9,688,724,654 4.3 Syrup 518,034,553 0.2Miscellaneous 5,160,473,481 2.3 Sugar substitutes 289,307,738 0.1Soups and stews 4,058,105,056 1.8 Honey 172,445,256 0.1Pizza 2,375,599,930 1.1Snacks 541,590,601 0.2 Baking ingredients, gelatin, and pudding 2,214,189,078 1.0
Chocolate syrup and chips 528,776,413 0.2Vegetables 17,078,081,999 7.7 Pudding, gelatin, and other desserts 1,300,739,961 0.6Fresh vegetables 8,465,366,602 3.8 Frosting and icing 351,249,832 0.2Canned vegetables 4,837,535,868 2.2Frozen vegetables 2,663,600,587 1.2 Baby food 547,893,734 0.2Vegetable juice 575,116,743 0.3Dried vegetables 536,462,198 0.2
Fruits 16,835,724,066 7.6Fresh fruit 8,610,268,154 3.9Fruit juices 5,532,993,792 2.5Canned fruit 1,575,493,542 0.7Dried fruit 938,922,676 0.4Frozen fruit 178,045,903 0.1
Source: Nielsen HomeScan database.

9How Much Do Americans Pay for Fruits and Vegetables / AIB-790
Economic Research Service/USDA
Table 3—Fresh and processed fruits: Quantity purchased at retail outlets, expenditures,and servings, 1999
Item Quantity purchased Expenditures Servings
Million pounds Ranking Million dollars Ranking Millions Ranking
Apples 2,243.2 3 1,530.5 4 1,3026.0 1Apricots 48.8 22 91.4 18 374.6 18Avocados 91.8 17 94.5 17 376.2 17Bananas 3,606.5 1 1,622.6 2 9,737.6 2Blackberries1 5.9 26 21.6 24 31.8 26Blueberries 86.9 18 136.3 16 511.5 15Cantaloupes 696.3 7 422.5 7 1998.4 9Cherries 100.3 16 173.4 14 415.1 16Cranberries 50.4 21 37.1 23 134.7 22Figs 0.2 27 0.6 27 1.7 27Grapefruit 753.4 6 411.7 8 2,252.0 7Grapes 1,323.4 4 1,541.9 3 6,877.6 4Honeydew 118.3 15 79.7 19 289.9 19Kiwi 55.5 20 49.9 22 232.4 21Mangoes 65.0 19 50.8 21 246.3 20Nectarines 209.4 13 215.6 13 1,120.3 12Oranges 2,836.7 2 1,687.8 1 7,038.7 3Papayas 20.9 24 16.3 26 89.1 24Peaches 365.1 10 353.3 10 1,594.6 10Pears 259.5 12 230.7 12 1,051.5 13Pineapples 409.7 9 346.2 11 1,410.2 11Plums/prunes 346.5 11 790.8 5 2,414.8 6Raspberries 16.9 25 64.4 20 102.0 23Strawberries 418.8 8 620.8 6 2,174.0 8Tangelos 21.9 23 20.9 25 73.1 25Tangerines 154.1 14 154.0 15 599.6 14Watermelon 1,166.8 5 375.5 9 3,558.7 5
Total 15,472.4 11,140.9 57,732.5
Note: Includes only plain, unflavored, and/or unsweetened (to the extent possible) processed products.1Excludes some fresh blackberries that were included in a category called 'other berries' that could not be separated by type of berry.
Source: Calculated by the authors using Nielsen HomeScan Database.

10How Much Do Americans Pay for Fruits and Vegetables / AIB-790
Economic Research Service/USDA
Table 4—Fresh and processed vegetables: Quantity purchased at retail outlets, expenditures,and servings, 1999
Item Quantity purchased Expenditures Servings
Million pounds Ranking Million dollars Ranking Millions Ranking
Asparagus 127.5 18 211.0 14 316.4 21Beans, green 997.5 5 594.0 6 4,320.1 5Beets 43.0 22 28.0 23 124.4 23Broccoli 429.9 10 433.7 9 3,325.4 8Brussels sprouts 32.4 23 43.1 22 156.8 22Cabbage 464.5 9 195.9 15 3,666.1 6Carrots 997.3 6 796.3 3 5,668.2 4Cauliflower 156.0 17 174.9 17 980.4 15Celery 350.0 12 281.0 12 2,135.2 12Collard greens 20.0 25 18.5 25 57.3 26Corn, sweet 1,096.8 4 726.3 4 3,434.5 7Cucumber 368.1 11 276.3 13 2,282.3 11Eggplant 26.0 24 25.3 24 87.2 24Kale1 5.3 30 4.7 30 24.5 30Lettuce, iceberg 621.2 7 484.1 8 3,230.4 9Lettuce, red leaf/green leaf 82.2 20 86.9 20 446.1 20Lettuce, romaine, fresh 109.2 19 128.0 19 854.5 17Mushrooms 220.0 15 527.6 7 1,778.2 13Mustard greens1 9.3 29 8.5 29 45.0 27Okra1 13.3 27 18.0 26 65.6 25Onions 1,292.0 3 717.2 5 6,007.0 3Peas, green 525.7 8 340.3 11 1,741.2 14Pepper, bell 342.4 13 381.5 10 2,516.5 10Potatoes 4,964.9 1 1,717.6 1 26,226.8 1Radishes 76.2 21 62.0 21 582.9 18Spinach 172.1 16 162.5 18 555.7 19Squash, summer 10.9 28 12.8 28 40.4 29Sweetpotatoes 291.2 14 176.8 16 937.8 16Tomatoes 1,618.5 2 1,495.1 2 6,970.3 2Turnip greens1 16.3 26 13.7 27 45.0 28
Total 15,479.7 10,141.7 78,622.1
Note: Includes only plain, unflavored (to the extent possible) processed products.1Excludes some fresh greens that were included in a category called 'other vegetables' that could not be separated by specific vegetable.
Source: Calculated by the authors using Nielsen HomeScan Database.

How Expensive Are Fruits andVegetables?
Prices for fruits and vegetables—in fresh and processed forms—varywidely. Fruit prices ranged from 32 cents per pound for fresh watermelon to$4.00 per pound for prunes. Among vegetables, prices ranged from 31 centsper pound for fresh potatoes to $4.57 per pound for frozen asparagus spears.
Purchase Price Versus Serving Price - Fruit
Among the 25 different types of fresh fruit, prices ranged from 32 cents perpound for watermelon to $3.94 per pound for blackberries, with a weighted-average price of 71 cents per pound and a median price of 97 cents (fig. 1a).Only grapefruit, bananas, and the three types of melons cost less than theweighted-average price. However, these five fruits accounted for 56 percentof fresh fruit pounds purchased in 1999.
11How Much Do Americans Pay for Fruits and Vegetables / AIB-790
Economic Research Service/USDA
How much does fresh fruit cost to buy?Figure 1a
Dollars per pound
Source: Nielsen HomeScan data, 1999.
The weighted average price for all fresh fruit was $0.71 per pound and the price difference between the most and least expensive item was $3.62 per pound.
Watemelon
Bananas
Grapefruit
Cantaloupe
Honeydew
Oranges
Papaya
Mangoes
Apples
Pears
Kiwi
Tangelos
Peaches
Tangerines
Nectarines
Avocados
Plums
Grapes
Pineapple
Strawberries
Apricots
Blueberries
Cherries
Raspberries
Blackberries
0.32
0.45
0.55
0.61
0.67
0.74
0.75
0.77
0.83
0.88
0.90
0.96
0.97
1.00
1.03
1.03
1.16
1.28
1.43
1.47
1.48
1.52
1.70
3.87
3.94

After adjusting for waste and serving size (because a pound providesanywhere from 2 to 14 servings), the price per serving for fresh fruits dropsto a range of 11 cents a serving for apples and watermelon to 66 cents aserving for blackberries (fig. 1b). Almost two-thirds of the fresh fruits, 16out of 25, cost 25 cents or less per serving, and only 2 of the 25 cost morethan 50 cents per serving. The weighted-average price per serving for allfresh fruits was 18 cents per serving. Due to their very low serving yield perpound, oranges and honeydew were among the top 10 most expensive fruitsper serving, despite being among the 10 least expensive fresh fruits at retail.
The sample included 16 different types and forms of canned fruit, includingtwo types of canned cherries. Prices for canned fruit ranged from 66 centsfor a pound of unsweetened applesauce to $2.71 for a pound of cannedblackberries, with a weighted-average price of 90 cents per pound (fig. 2a).As with fresh fruit, only three canned fruits cost less than the weighted-average price, but they accounted for over 70 percent of total cannedpurchases. Three-fourths of the canned fruits (12 out of 16) cost less than
12How Much Do Americans Pay for Fruits and Vegetables / AIB-790
Economic Research Service/USDA
How much does fresh fruit cost to eat?Figure 1b
Dollar per serving
Source: Nielsen HomeScan data, 1999. Converted to servings using factors obtained from The Food Buying Guide for Child Nutrition Programs, U.S. Department of Agriculture, Food and Nutrition Service, revised November 2001.
The weighted average price for all fresh fruit was $0.18 per serving and the price difference between the most and least expensive item was $0.56 per serving.
Watermelon
Apples
Papayas
Grapefruit
Bananas
Nectarines
Mangoes
Pears
Peaches
Kiwi
Cantaloupe
Plums
Grapes
Blueberries
Avocados
Apricots
Tangerines
Honeydew
Strawberries
Tangelos
Cherries
Oranges
Pineapple
Raspberries
Blackberries
0.11
0.11
0.17
0.17
0.17
0.19
0.20
0.21
0.21
0.21
0.21
0.23
0.24
0.25
0.25
0.25
0.26
0.27
0.28
0.29
0.40
0.42
0.45
0.64
0.66
Almost two-thirds of
the fresh fruits, 16 out
of 25, cost 25 cents or
less per serving

$2.00 per pound. Canned fruits ranged in price from 19 cents per serving forunsweetened applesauce to 92 cents for canned blackberries (fig. 2b). Eventhough only 5 of the 16 canned fruits were priced at 25 cents or less perserving, the weighted-average price for all canned fruit was 24 cents perserving. This was due to the high volume of less expensive canned fruit(canned apples/applesauce, pineapples, peaches, and pears).
Our nine different types of frozen fruits ranged in price from $1.24 for apound of frozen papaya to $3.39 for a pound of frozen raspberries, with aweighted-average price of $2.04 per pound (fig. 3a). Four of the nine typesof frozen fruit were below the weighted-average price and five were above.The four cheapest frozen fruits accounted for nearly three quarters of allfrozen fruit purchased. Frozen fruit are the most expensive form of fruits byserving, with a weighted-average price of 51 cents per serving (fig. 3b).Interestingly, frozen raspberries, the most expensive frozen fruit to buy,dropped to fifth cheapest to eat, at 54 cents per serving.
Counting shelf-stable, refrigerated, and frozen versions for each of the sevenfruit juices separately, prices for the 15 items ranged from 36 cents per pintfor unsweetened, frozen apple juice to 74 cents per pint for shelf-stablecranberry juice, with a weighted-average price of 53 cents per pint (fig 4a).Price per serving varied little among the different fruit juices (fig. 4b), with
13How Much Do Americans Pay for Fruits and Vegetables / AIB-790
Economic Research Service/USDA
How much does canned fruit cost to buy?Figure 2a
Dollars per pound
1Packed in juice or water. 2Unsweetened/unflavored.
Source: Nielsen HomeScan data, 1999.
The weighted average price for all canned fruit was $0.90 per pound and the price difference between the most and least expensive item was $2.05 per pound.
Applesauce2
Apples2
Pineapple1
Peaches1
Pears1
Oranges, mandarin1
Strawberries
Mangoes
Apricots1
Cherries, tart1
Grapefruit1
Cherries, sweet
Blueberries
Papaya
Raspberries
Blackberries
0.66
0.77
0.82
0.93
0.95
1.25
1.26
1.31
1.34
1.82
1.96
1.96
2.03
2.12
2.69
2.71

14How Much Do Americans Pay for Fruits and Vegetables / AIB-790
Economic Research Service/USDA
How much does canned fruit cost to eat?Figure 2b
Dollar per serving
1Packed in juice or water. 2Unsweetened/unflavored.
The weighted average price for all canned fruit was $0.24 per serving and the price difference between the most and least expensive item was $0.74 per serving.
Source: Nielsen HomeScan data, 1999. Converted to servings using factors obtained from The Food Buying Guide for Child Nutrition Programs, U.S. Department of Agriculture, Food and Nutrition Service, revised November 2001.
Applesauce2
Apples2
Pineapple1
Pears1
Peaches1
Oranges, mandarin1
Mangoes
Apricots1
Strawberries
Grapefruit1
Papaya
Cherries, tart1
Cherries, sweet
Raspberries
Blueberries
Blackberries
0.19
0.20
0.22
0.25
0.25
0.34
0.34
0.37
0.43
0.52
0.56
0.63
0.68
0.69
0.69
0.92
How much does frozen fruit cost to buy?Figure 3a
Dollars per pound for unsweetened frozen fruits
The weighted average price for all unsweetened frozen fruit was $2.04 per pound and the price difference between the most and least expensive item was $2.14 per pound.
Source: Nielsen HomeScan data, 1999.
Papaya
Mangoes
Strawberries
Peaches
Cherries, tart
Blueberries
Cherries, sweet
Blackberries
Raspberries
1.24
1.41
1.72
1.99
2.05
2.73
2.97
2.97
3.39

15How Much Do Americans Pay for Fruits and Vegetables / AIB-790
Economic Research Service/USDA
How much does juice cost to buy?Figure 4a
Dollar per pint for unsweetened fruit juices
Source: Nielsen HomeScan data, 1999.
The weighted average price for all fruit juice was $0.53 per pint and the price difference between the most and least expensive item was $.38 per pint.
Apple, fz., reconstituted
Grapefruit, fz., reconstituted
Orange, fz., reconstituted
Apple, shelf stable
Apple, refrigerated
Grapefruit, shelf stable
Pineapple, shelf stable
Grape, fz., reconstituted
Orange, shelf stable
Grapefruit, refrigerated
Orange, refrigerated
Prune, shelf stable
Orange, fz., not concentrate
Grape, shelf stable
Cranberry, shelf stable
0.36
0.38
0.39
0.40
0.44
0.50
0.52
0.55
0.55
0.58
0.60
0.62
0.65
0.66
0.74
How much does frozen fruit cost to eat?Figure 3b
Dollar per serving for unsweetened frozen fruits
The weighted average price for all unsweetened frozen fruit was $0.51 per serving and the price difference between the most and least expensive item was $0.39 per serving.
Source: Nielsen HomeScan data, 1999. Converted to servings using factors obtained from The Food Buying Guide for Child Nutrition Programs, U.S. Department of Agriculture, Food and Nutrition Service, revised November 2001.
Strawberries
Papaya
Blueberries
Mangoes
Raspberries
Cherries, tart
Blackberries
Peaches
Cherries, sweet
0.46
0.46
0.46
0.52
0.54
0.59
0.66
0.73
0.85

frozen apple juice (13 cents a serving) the cheapest and cranberry juice (28cents) the most expensive. The weighted-average price for all unsweetenedfruit juice was 20 cents per serving.
Retail prices for the four types of dried fruit included in our sample rangedfrom $2.01 per pound for raisins to $4.00 per pound for prunes, with aweighted-average price of $3.07 (fig. 5a). However, retail prices for driedfruit are deceiving. Because the serving size for dried fruit is much smallerthan the serving size for other fruits (¼ cup versus ½ cup for other fruit and¾ cup for juice), the cost per serving becomes reasonable, ranging from 16cents per serving for raisins to 38 cents for prunes (fig. 5b). This is cheaperthan the price per serving for most canned and all frozen fruits.
In summary, although retail prices for fruits might appear high on a per-pound basis, few people may realize that a pound provides 3-5 servings formost fruits. Therefore, the price per serving is considerably lower. In 1999,it was possible to eat a serving of any of the 69 forms of fruits included inour analysis for less than a dollar. In fact, 37 of the fruit items cost 25 centsor less per serving, 54 items cost under 50 cents, and only 2 of the 69 fruititems cost more than 75 cents per serving.
16How Much Do Americans Pay for Fruits and Vegetables / AIB-790
Economic Research Service/USDA
How much does juice cost to drink?Figure 4b
Dollar per serving for unsweetened fruit juices
Source: Nielsen HomeScan data, 1999. Converted to servings using factors obtained from The Food Buying Guide for Child Nutrition Programs, U.S. Department of Agriculture, Food and Nutrition Service, revised November 2001.
The weighted averageprice for all fruit juice was $0.20 per serving and the price difference between the most and least expensive item was $0.14 per serving.
Apple, fz., reconstituted
Grapefruit, fz. reconstituted
Orange, fz., reconstituted
Apple, shelf stable
Apple, refrigerated
Grapefruit, shelf stable
Pineapple, shelf stable
Grape, fz., reconstituted
Orange, shelf stable
Grapefruit, refrigerated
Orange, refrigerated
Prune, shelf stable
Orange, fz., not concentrate
Grape, shelf stable
Cranberry, shelf stable
0.13
0.14
0.15
0.15
0.16
0.19
0.19
0.20
0.21
0.22
0.22
0.23
0.24
0.25
0.28
It was possible to eat a
serving of any of the 69
forms of fruits included
in our analysis for less
than a dollar.

Purchase Price Versus Serving Price - Vegetables
Among the 35 fresh vegetable items included in the analysis, retail pricesranged from 31 cents per pound for potatoes to $2.97 per pound for fresh,sliced mushrooms (fig. 6a). The weighted-average price for all fresh vegeta-bles was 64 cents per pound. Only 5 of the 35 fresh vegetables were pricedbelow the weighted-average price, 12 were priced below $1.00 per pound,and all but 3 cost less than $2.00 per pound. The five cheapest vegetables—potatoes, cabbage, whole carrots, onions, and sweet potatoes—accountedfor 62 percent of all fresh vegetable purchases by weight.
Per serving, prices ranged from 4 cents for cabbage to 91 cents for shelledgreen peas, with a weighted-average price of 12 cents per serving (fig. 6b).More than two-thirds of the 35 fresh vegetables cost 25 cents or less per
17How Much Do Americans Pay for Fruits and Vegetables / AIB-790
Economic Research Service/USDA
How much does dried fruit cost to buy?Figure 5a
Dollars per pound
The weighted average price for all dried fruit was $3.07 per pound and the price difference between the most and least expensive item was $2.00 per pound.
Source: Nielsen HomeScan data, 1999.
Raisins
Apricots
Figs
Prunes
2.01
2.53
3.71
4.00
How much does dried fruit cost to eat?Figure 5b
Dollar per serving
The weighted average price for dried fruit was $0.27 per serving and the price difference between the most and least expensive item was $0.22 per serving.
Source: Nielsen HomeScan data, 1999. Converted to servings using factors obtained from The Food Buying Guide for Child Nutrition Programs, U.S. Department of Agriculture, Food and Nutrition Service, revised November 2001.
Raisins
Apricots
Figs
Prunes
0.16
0.22
0.36
0.38

18How Much Do Americans Pay for Fruits and Vegetables / AIB-790
Economic Research Service/USDA
How much do fresh vegeables cost to buy?Figure 6a
Dollars per pound
Source: Nielsen HomeScan data, 1999.
The weighted average price for all fresh vegetables was $0.64per pound and the price difference between the most and least expensive item was $2.67 per pound.
Potatoes
Cabbage
Carrots, whole
Onions
Sweetpotatoes
Cucumbers
Lettuce, iceberg
Celery
Radishes
Sweet corn
Broccoli, regular
Eggplant
Broccoli, fleurets
Tomatoes, plum
Lettuce, leaf
Green beans
Cauliflower, head
Bell peppers
Lettuce, Romaine
Tomatoes, regular
Brussels sprouts
Carrots, baby
Spinach
Squash, zucchini
Cauliflower, fleurets
Kale
Mustard greens
Asparagus
Turnip greens
Okra
Green peas
Tomatoes, cherry
Mushrooms, whole
Collard greens
Mushrooms, sliced
0.31
0.38
0.54
0.55
0.60
0.75
0.78
0.80
0.81
0.86
0.88
0.97
1.02
1.04
1.06
1.07
1.08
1.11
1.17
1.21
1.25
1.28
1.35
1.42
1.48
1.51
1.63
1.67
1.68
1.69
1.83
1.87
2.33
2.92
2.97

19How Much Do Americans Pay for Fruits and Vegetables / AIB-790
Economic Research Service/USDA
How much do fresh vegeables cost to eat?Figure 6b
Dollar per serving
Source: Nielsen HomeScan data, 1999. Converted to servings using factors obtained from The Food Buying Guide for Child Nutrition Programs, U.S. Department of Agriculture, Food and Nutrition Service, revised November 2001.
The weighted average price for all fresh vegetables was $0.12 per serving and the price difference between the most and least expensive item was $0.87 per serving.
Cabbage
Potatoes
Broccoli, fleurets
Carrots, whole
Radishes
Onions
Cucumbers
Mustard greens
Celery
Bell peppers
Lettuce, Romaine
Lettuce, iceberg
Cauliflower, fleuretsKale
Cauliflower, head
Sweetpotatoes
Broccoli, regular
Lettuce, leaf
Green beans
Carrots, baby
Spinach
Tomatoes, regular
Tomatoes, plum
Squash, zucchini
Mushrooms, whole
Eggplant
Brussels sprouts
Tomatoes, cherry
Mushrooms, slicedOkra
Turnip greens
Sweet corn
Collard greens
Asparagus
Green peas
0.04
0.06
0.07
0.10
0.11
0.12
0.12
0.13
0.13
0.15
0.15
0.15
0.16
0.17
0.17
0.18
0.18
0.19
0.19
0.20
0.21
0.23
0.24
0.24
0.25
0.29
0.29
0.31
0.32
0.38
0.52
0.52
0.56
0.70
0.91

serving. A salad containing one cup of fresh Romaine lettuce leaves, ¼ cup ofsliced onions, ½ cup of cucumbers, and ¼ cup of sliced carrots costs a total of43 cents and provides 3 FGP servings. For an additional 50 cents, you couldadd a serving each of tomatoes and mushrooms.
Among the 25 plain/regular canned vegetable items, retail prices rangedfrom 49 cents per pound for canned, sliced green beans to $4.41 per poundfor canned, whole mushrooms (fig. 7a). The weighted-average price for allcanned vegetable items was 60 cents per pound. Only 6 of the 25 cannedvegetables priced below the weighted-average price, although 15 priced ator below 75 cents per pound. Only mushrooms (three types) were pricedabove $2.00 per pound. As with fresh vegetables, the canned vegetablespriced below the weighted-average price accounted for a majority of soldweight (85 percent).
Per serving, plain/regular canned vegetables ranged from 12 cents a servingfor canned, sliced green beans to 76 cents for canned, whole mushrooms, with
20How Much Do Americans Pay for Fruits and Vegetables / AIB-790
Economic Research Service/USDA
How much do canned vegetables cost to buy?Figure 7a
Dollars per pound for plain/regular, canned vegetables
Source: Nielsen HomeScan data, 1999.
The weighted average price for all plain/regular canned vegetables was $0.60 per pound and the price difference between the most and least expensive item was $3.92 per pound.
Green beans, sliced
Sweet corn
Potatoes
Carrots, sliced
Green peas
Tomatoes
Spinach
Mustard greens
Turnip greens
Sweetpotatoes
Cabbage, sauerkraut
Beets
Kale
Collard greens
Green beans, whole
Squash
Carrots, whole
Okra
Asparagus, cut/tips
Onions
Brussels sprouts
Asparagus, spears
Mushrooms, pieces
Mushrooms, sliced
Mushrooms, whole
0.49
0.51
0.52
0.52
0.54
0.59
0.62
0.62
0.63
0.63
0.65
0.65
0.68
0.71
0.75
0.98
1.07
1.25
1.33
1.35
1.38
1.95
2.11
4.04
4.41
A salad containing one
cup of fresh Romaine
lettuce leaves, ¼ cup
of sliced onions, ½ cup
of cucumbers, and ¼
cup of sliced carrots
costs a total of 43
cents and provides 3
FGP servings.

a weighted-average price of 17 cents per serving (fig. 7b). The cost perserving was less than 25 cents for 11 of the 25 canned vegetables and lessthan 50 cents for 20 of the 25 canned vegetables. Consumers who believe thatcanned vegetables are the best bargain might be surprised that they can save81 cents on their homemade pizza by using a serving each of fresh onions andfresh, sliced mushrooms rather than a serving each of the canned equivalents.
Among the 23 plain/regular frozen vegetable items, prices ranged from 89cents per pound for frozen onions (pearl onions) to $4.57 per pound forwhole, frozen asparagus, with a weighted-average price of $1.11 (fig. 8a).Approximately one-third of the frozen vegetables were at or below theweighted-average price, and they accounted for almost three-quarters offrozen vegetables by sales volume.
Per serving, prices ranged from 17 cents for frozen, cut green beans to 85cents for frozen, whole asparagus, with a weighted-average price of 22
21How Much Do Americans Pay for Fruits and Vegetables / AIB-790
Economic Research Service/USDA
How much do canned vegetables cost to eat?Figure 7b
Dollar per serving for plain/regular, canned vegetables
Source: Nielsen HomeScan data, 1999. Converted to servings using factors obtained from The Food Buying Guide for Child Nutrition Programs, U.S. Department of Agriculture, Food and Nutrition Service, revised November 2001.
The weighted average price for all plain/regular canned vegetables was $0.17 per serving and the price difference between the most and least expensive item was $0.64 per serving.
Green beans, sliced
Tomatoes
Potatoes
Sweet corn
Carrots, sliced
Peas
Green beans, whole
Kale
Beets
Sweetpotatoes
Cabbage, sauerkraut
Brussels sprouts
Turnip greens
Mustard greens
Spinach
Carrots, whole
Collard greens
Mushrooms, pieces
Okra
Squash
Asparagus, cut/tips
Onions
Asparagus, spears
Mushrooms, sliced
Mushrooms, whole
0.12
0.16
0.16
0.17
0.17
0.18
0.18
0.21
0.23
0.24
0.24
0.27
0.28
0.29
0.30
0.34
0.35
0.36
0.40
0.49
0.53
0.55
0.59
0.70
0.76
Consumers who
believe that canned
vegetables are the best
bargain might be sur-
prised that they can
save 81 cents on their
homemade pizza by
using fresh onions and
fresh, sliced mush-
rooms rather than the
canned equivalents.
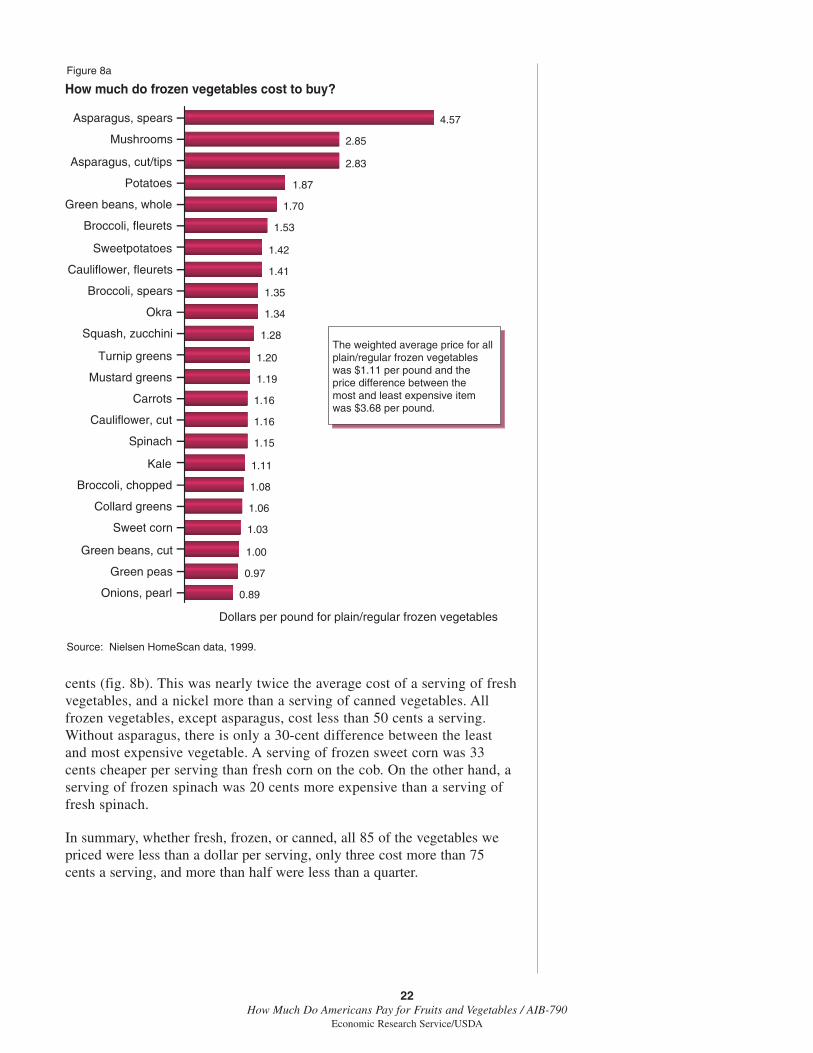
cents (fig. 8b). This was nearly twice the average cost of a serving of freshvegetables, and a nickel more than a serving of canned vegetables. Allfrozen vegetables, except asparagus, cost less than 50 cents a serving.Without asparagus, there is only a 30-cent difference between the leastand most expensive vegetable. A serving of frozen sweet corn was 33cents cheaper per serving than fresh corn on the cob. On the other hand, aserving of frozen spinach was 20 cents more expensive than a serving offresh spinach.
In summary, whether fresh, frozen, or canned, all 85 of the vegetables wepriced were less than a dollar per serving, only three cost more than 75cents a serving, and more than half were less than a quarter.
22How Much Do Americans Pay for Fruits and Vegetables / AIB-790
Economic Research Service/USDA
How much do frozen vegetables cost to buy?Figure 8a
Dollars per pound for plain/regular frozen vegetables
Source: Nielsen HomeScan data, 1999.
The weighted average price for all plain/regular frozen vegetables was $1.11 per pound and the price difference between the most and least expensive item was $3.68 per pound.
Onions, pearl
Green peas
Green beans, cut
Sweet corn
Collard greens
Broccoli, chopped
Kale
Spinach
Cauliflower, cut
Carrots
Mustard greens
Turnip greens
Squash, zucchini
Okra
Broccoli, spears
Cauliflower, fleurets
Sweetpotatoes
Broccoli, fleurets
Green beans, whole
Potatoes
Asparagus, cut/tips
Mushrooms
Asparagus, spears
0.89
0.97
1.00
1.03
1.06
1.08
1.11
1.15
1.16
1.16
1.19
1.20
1.28
1.34
1.35
1.41
1.42
1.53
1.70
1.87
2.83
2.85
4.57

23How Much Do Americans Pay for Fruits and Vegetables / AIB-790
Economic Research Service/USDA
How much do frozen vegetables cost to eat?Figure 8b
Dollar per serving for plain/regular frozen vegetables
Source: Nielsen HomeScan data, 1999. Converted to servings using factors obtained from The Food Buying Guide for Child Nutrition Programs, U.S. Department of Agriculture, Food and Nutrition Service, revised November 2001.
The weighted average price for all plain/regular frozen vegetables was $0.22 per serving and the price difference between the most and least expensive item was $0.68 per serving.
Green beans, cut
Kale
Sweet corn
Green peas
Mustard greens
Onions, pearl
Broccoli, chopped
Collard greens
Carrots
Turnip greens
Cauliflower, cut
Broccoli, spears
Okra
Broccoli, fleurets
Cauliflower, fleurets
Sweetpotatoes
Green beans, whole
Squash, zucchini
Potatoes
Spinach
Mushrooms
Asparagus, cut/tips
Asparagus, spears
0.17
0.18
0.19
0.20
0.20
0.22
0.22
0.23
0.23
0.25
0.25
0.25
0.26
0.28
0.31
0.31
0.32
0.37
0.37
0.41
0.47
0.70
0.85

Cost of Meeting DietaryRecommendations
Dietary recommendations for an average dietary intake of 2,200 calories callfor three servings of fruit daily, with consumption fairly evenly dividedbetween (a) citrus, melons, and berries; and (b) other fruit. Dietary recommen-dations also call for four servings of vegetables daily, with consumptioncoming from (a) dark-green and leafy vegetables, (b) deep-yellow vegetables,(c) starchy vegetables, including potatoes, dry beans, peas, and lentils; and (d)other vegetables. Figures 9 and 10 show price per serving of all the fruits andvegetables in the study, based on the least expensive form for each fruit andvegetable. For example, fresh apples cost 11 cents per serving; canned apples,20 cents; canned applesauce, 19 cents; and apple juice, 13-15 cents per serving.Therefore, we use the least expensive form for apples: fresh.
Based on Homescan data, three servings of fruit, with equal servings fromthe two subgroups, can cost as little as 37 cents. This includes ½ cup eachof cut, fresh watermelon and apple, a little less than ½ cup of grapefruitjuice, and 1/8 cup of raisins. Together, these fruits supply over 75 percent ofthe Daily Value for Vitamin C for 150 calories and less than 1 gram of fat.
24How Much Do Americans Pay for Fruits and Vegetables / AIB-790
Economic Research Service/USDA
Pyramid subgroups - fruitFigure 9
Dollar per serving for the least expensive form of fruit
Source: Nielsen HomeScan data, 1999. Converted to servings using factors obtained from The Food Buying Guide for Child Nutrition Programs, U.S. Department of Agriculture, Food and Nutrition Service, revised November 2001.
Citrus, berries, melons,and kiwi
Other fruit
CherriesFigs
AvocadoPlums
ApricotsPears
PeachesMangoesPineapple
NectarinesPapaya
BananasGrapesApples
0.40
0.360.25
0.230.22
0.210.21
0.200.190.19
0.170.17
0.16
0.11
BlackberriesRaspberries
TangelosStrawberriesCranberriesHoneydewTangerinesBlueberries
KiwiCantaloupe
OrangesGrapefruit
Watermelon
0.660.54
0.29
0.280.28
0.27
0.26
0.250.21
0.21
0.150.14
0.11

Four servings of vegetables, with one serving from each of the foursubgroups, can be obtained for an additional 27 cents. This includes ½ cupeach of fresh carrots, broccoli fleurets, potatoes, and cabbage. Totaling just75 calories, this combination provides 100 percent of the Daily Value forVitamins A and C, and 15 percent of fiber.
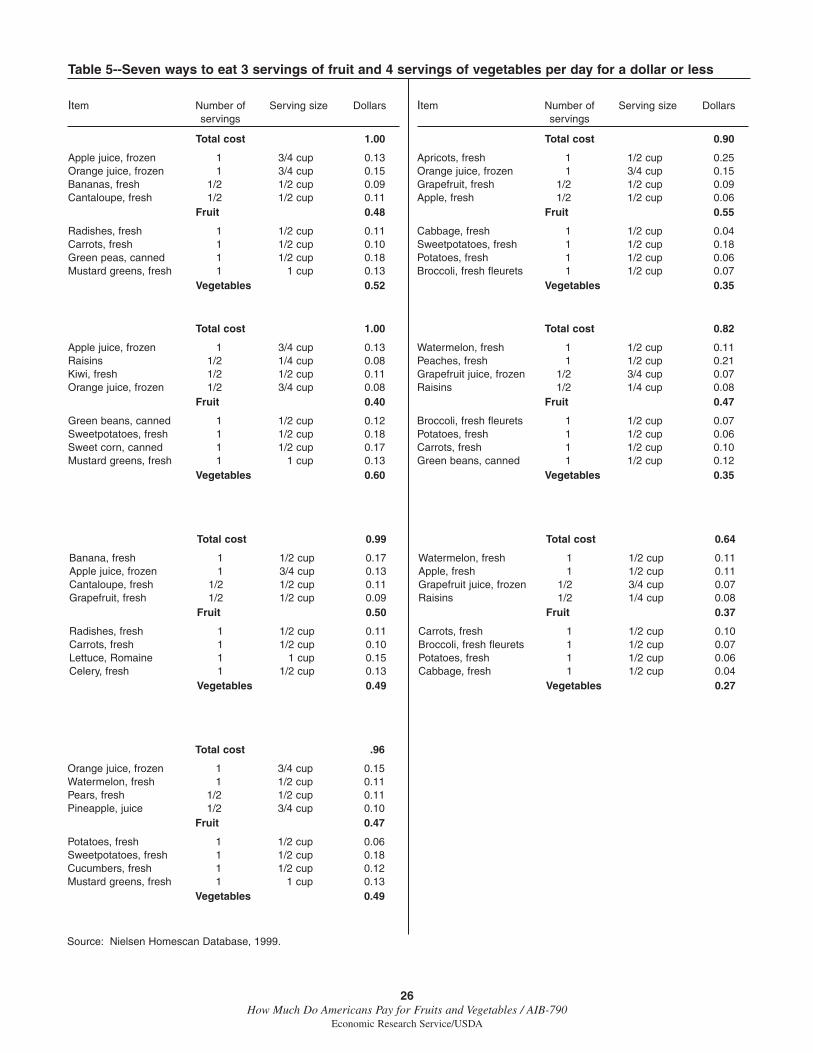
That’s a lot of good nutrition for 64 cents, only 225 calories, and less than 1gram of fat. According to the Consumer Expenditure Survey, in 1999 Amer-icans spent an average of $5.50 per person per day on food. So consumerstrying to follow the Food Guide Pyramid can meet their daily recommenda-tions for two out of the five major food groups for only 12 percent of theirdaily food expenditures. That leaves 88 percent of their food dollar left forthe other three food groups. Even consumers from households whoseincome is less than 130 percent of the poverty line, and spend $4.07 perperson per day on food, have 84 percent of their food dollar left. Sinceconsumers have different tastes and crave variety, table 5 shows sevendifferent ways (one for each day of the week) to eat three servings of fruitand four servings of vegetables per day for a dollar or less.
25How Much Do Americans Pay for Fruits and Vegetables / AIB-790
Economic Research Service/USDA
Pyramid subgroups - vegetablesFigure 10
Dollar per serving for the least expensive form of each vegetable
Source: Nielsen HomeScan data, 1999. Converted to servings using factors obtained from The Food Buying Guide for Child Nutrition Programs, U.S. Department of Agriculture, Food and Nutrition Service, revised November 2001.
Deep yellow
Dark green, leafy
Starchy
Other
SweetpotatoesCarrots
0.18
0.10
Turnip greensCollard greens
SpinachLeaf lettuce
KaleRomaine lettuceMustard greens
0.250.23
0.210.19
0.170.15
0.13
PeasCorn
Potatoes
0.180.17
0.06
AsparagusEggplant
Brussels, sproutsOkra
MushroomsSquash, zucchini
BeetsCauliflowerTomatoes
Bell peppersIceberg lettuce
CeleryOnions
Green beansCucumbers
0.530.29
0.270.26
0.250.24
0.230.16
0.150.150.15
0.130.120.120.12
26How Much Do Americans Pay for Fruits and Vegetables / AIB-790
Economic Research Service/USDA
Table 5--Seven ways to eat 3 servings of fruit and 4 servings of vegetables per day for a dollar or less
Item Number of Serving size Dollarsservings
Total cost 1.00
Apple juice, frozen 1 3/4 cup 0.13Orange juice, frozen 1 3/4 cup 0.15Bananas, fresh 1/2 1/2 cup 0.09Cantaloupe, fresh 1/2 1/2 cup 0.11
Fruit 0.48
Radishes, fresh 1 1/2 cup 0.11Carrots, fresh 1 1/2 cup 0.10Green peas, canned 1 1/2 cup 0.18Mustard greens, fresh 1 1 cup 0.13
Vegetables 0.52
Item Number of Serving size Dollarsservings
Total cost 0.90
Apricots, fresh 1 1/2 cup 0.25Orange juice, frozen 1 3/4 cup 0.15Grapefruit, fresh 1/2 1/2 cup 0.09Apple, fresh 1/2 1/2 cup 0.06
Fruit 0.55
Cabbage, fresh 1 1/2 cup 0.04Sweetpotatoes, fresh 1 1/2 cup 0.18Potatoes, fresh 1 1/2 cup 0.06Broccoli, fresh fleurets 1 1/2 cup 0.07
Vegetables 0.35
Total cost 1.00
Apple juice, frozen 1 3/4 cup 0.13Raisins 1/2 1/4 cup 0.08Kiwi, fresh 1/2 1/2 cup 0.11Orange juice, frozen 1/2 3/4 cup 0.08
Fruit 0.40
Green beans, canned 1 1/2 cup 0.12Sweetpotatoes, fresh 1 1/2 cup 0.18Sweet corn, canned 1 1/2 cup 0.17Mustard greens, fresh 1 1 cup 0.13
Vegetables 0.60
Total cost 0.82
Watermelon, fresh 1 1/2 cup 0.11Peaches, fresh 1 1/2 cup 0.21Grapefruit juice, frozen 1/2 3/4 cup 0.07Raisins 1/2 1/4 cup 0.08
Fruit 0.47
Broccoli, fresh fleurets 1 1/2 cup 0.07Potatoes, fresh 1 1/2 cup 0.06Carrots, fresh 1 1/2 cup 0.10Green beans, canned 1 1/2 cup 0.12
Vegetables 0.35
Total cost 0.99
Banana, fresh 1 1/2 cup 0.17Apple juice, frozen 1 3/4 cup 0.13Cantaloupe, fresh 1/2 1/2 cup 0.11Grapefruit, fresh 1/2 1/2 cup 0.09
Fruit 0.50
Radishes, fresh 1 1/2 cup 0.11Carrots, fresh 1 1/2 cup 0.10Lettuce, Romaine 1 1 cup 0.15Celery, fresh 1 1/2 cup 0.13
Vegetables 0.49
Total cost .96
Orange juice, frozen 1 3/4 cup 0.15Watermelon, fresh 1 1/2 cup 0.11Pears, fresh 1/2 1/2 cup 0.11Pineapple, juice 1/2 3/4 cup 0.10
Fruit 0.47
Potatoes, fresh 1 1/2 cup 0.06Sweetpotatoes, fresh 1 1/2 cup 0.18Cucumbers, fresh 1 1/2 cup 0.12Mustard greens, fresh 1 1 cup 0.13
Vegetables 0.49
Total cost 0.64
Watermelon, fresh 1 1/2 cup 0.11Apple, fresh 1 1/2 cup 0.11Grapefruit juice, frozen 1/2 3/4 cup 0.07Raisins 1/2 1/4 cup 0.08
Fruit 0.37
Carrots, fresh 1 1/2 cup 0.10Broccoli, fresh fleurets 1 1/2 cup 0.07Potatoes, fresh 1 1/2 cup 0.06Cabbage, fresh 1 1/2 cup 0.04
Vegetables 0.27
Source: Nielsen Homescan Database, 1999.

Most and Least Expensive Ways To Buy
To determine whether fresh fruits and vegetables are more expensive thanprocessed, we compared prices for the 16 fruits and 20 vegetables for whichretail prices were available for both fresh and processed forms (canned,frozen, dried, and/or juice). Not all processed forms are available for allfruits and vegetables. Although green beans are available in fresh, canned,and frozen forms, broccoli is only available in fresh and frozen form. On theother hand, there may be more than one “type” for the forms available. Forexample, fresh carrots are available as whole and as baby carrots, whereascanned carrots are available whole or sliced. Some fruits and vegetables—such as melons, lettuce, and celery—were excluded from this analysisbecause they were only available in one form, typically fresh.
We also separated out the different types of juice (shelf-stable, refrigerated,frozen, and frozen concentrate) for this analysis. For each fruit andvegetable, we identified the forms with the highest and lowest price, bothper pound and per serving.
Most and Least Expensive Forms of Fruits
No one form stood out as being the most expensive way of buying fruit atretail. Four fruits were most expensive when purchased fresh, five whenpurchased frozen, four when purchased canned, and three as dried, whilejuice was never the most expensive (fig. 11a). By serving, canned fruitbecame the most expensive form for nearly half of the 19 fruits (fig. 11b).Frozen fruit was the most expensive way to eat 4 of the 16 fruits. Orangesand pineapple were most expensive when eaten fresh.
The cheapest way to buy fruit was fairly evenly distributed between fresh(5), juice (6), and canned (5) (fig. 12a). Frozen and dried fruit were neverthe cheapest way to buy fruit. When converted to servings, the cheapest wayto eat fruit was overwhelmingly fresh (fig. 12b). Two-thirds of all fruitswere cheapest when eaten fresh. Juice was the cheapest route to eat fruit for3 of the 16 fruits. Canned was never the cheapest way to eat fruit. Driedapricots and raisins were the most expensive way to buy those two fruits(apricots and grapes), but when converted to servings they were actually thecheapest way to eat them. This is because dried fruit has such a high per-serving yield and the serving size is smaller, ¼ cup instead of ½ cup forother forms of fruit.
Although there were price differences for different forms of fruits, thedollar-per-serving difference between the most and least expensive form ofthe same fruits was typically small (fig. 13). For example, the price perserving was 25 cents for fresh apricots, 37 cents for canned apricots, and 22cents for dried apricots, so the price spread was 15 cents per serving. Forhalf of the fruits in the sample, the price difference per serving between themost and least expensive forms was less than 25 cents, and for all but onefruit—peaches (canned vs. frozen)—it was under 50 cents.
27How Much Do Americans Pay for Fruits and Vegetables / AIB-790
Economic Research Service/USDA
When converted to
servings, the cheapest
way to eat fruit was
overwhelmingly fresh.

28How Much Do Americans Pay for Fruits and Vegetables / AIB-790
Economic Research Service/USDA
Most expensive way to buy fruitFigure 11a
Dollars per pound/pint
Source: Nielsen HomeScan data, 1999.
Fresh
Frozen1
Canned2
Dried
1Unsweetened. 2Packed in juice, except canned papaya. Includes all canned papaya.
Grapes (raisins)Apricots
Plums (prunes)
PearsOranges, mandarin
GrapefruitPapaya
MangoesStrawberries, sliced
PeachesBlueberries
Cherries, sweet
ApplesPineapple
RaspberriesBlackberries
2.012.53
4.00
0.951.25
1.962.12
1.411.87
1.992.73
2.97
0.831.43
3.87
3.94
Most expensive way to eat fruitFigure 11b
Dollar per serving
Source: Nielsen HomeScan data, 1999. Converted to servings using factors obtained from The Food Buying Guide for Child Nutrition Programs, U.S. Department of Agriculture, Food and Nutrition Service, revised November 2001.
Fresh
Frozen1
Canned
Juice
Dried
1Unsweetened/unflavored. 2Packed in juice. 3Shelf stable.
Plums (prunes)
Grape3
Apples1Pears2
Apricots2Grapefruit2
PapayasRaspberriesBlueberries
Blackberries
Strawberries, wholeMangoesPeaches
Cherries, sweet
OrangesPineapple
0.38
0.25
0.200.25
0.370.52
0.560.690.69
0.92
0.470.52
0.730.85
0.420.45

29How Much Do Americans Pay for Fruits and Vegetables / AIB-790
Economic Research Service/USDA
Least expensive way to buy fruitFigure 12a
Dollars per pound/pint
Source: Nielsen HomeScan data, 1999.
Fresh
Canned
Juice2
1Packed in juice. 2Unsweetened.
Prune, shelf stableGrape, frozen
Pineapple, shelf stableOrange, frozen
Grapefruit, frozenApple, frozen
BlackberriesRaspberries
Apricots1
StrawberriesPeaches, clingstone1
CherriesBlueberries
PearsMango
Papaya
0.620.55
0.520.39
0.380.36
2.712.69
1.34
1.260.93
1.701.52
0.880.77
0.75
Least expensive way to eat fruitFigure 12b
Dollar per serving
Source: Nielsen HomeScan data, 1999. Converted to servings using factors obtained from The Food Buying Guide for Child Nutrition Programs, U.S. Department of Agriculture, Food and Nutrition Service, revised November 2001.
Fresh
Frozen
Juice
1Fresh plums and shelf-stable prune juice were both the least expensive at 23 cents per serving. 2Fresh and unsweetened, frozen blackberries were both the least expensive at 66 cents per serving. 3Unsweetened.
Dried
ApricotsGrapes (raisins)
Pineapple, shelf stable3Orange, frz.3
Grapefruit, frz.3
Raspberries3
Blackberries2Cherries
StrawberriesCranberriesBlueberries
Plums1Pears
PeachesMangoesPapayas
Apples
0.22
0.16
0.190.15
0.14
0.54
0.660.40
0.280.26
0.250.23
0.210.210.20
0.170.11

Most and Least Expensive Forms of Vegetables
Consumers’ perceptions that fresh produce is often more expensive thanprocessed is bolstered by a comparison of the price per pound between freshand processed vegetables (fig. 14a). Vegetables in their fresh form drew thehighest price per pound for 11 of the 20 vegetables. For example, among thedifferent types of carrots (fresh whole and baby carrots, canned whole andsliced, frozen whole and sliced), fresh, baby carrots had the highest priceper pound. Frozen vegetables had the highest price per pound for 5 of the 20vegetables. Canned vegetables were the most expensive for only threevegetables. We included only one dehydrated vegetable in our study, pota-toes, and it drew the highest price per pound among potato forms.
However, per serving, the most expensive way of eating a particularvegetable becomes fairly evenly divided among canned vegetables (7 of the20 vegetables), frozen (7), and fresh (6) forms (fig. 14b). It may seemsurprising that for so many vegetables a serving was more expensive incanned form. The reason is that the weight of the canned vegetables
30How Much Do Americans Pay for Fruits and Vegetables / AIB-790
Economic Research Service/USDA
What is the price difference between the most and least expensive form of the same fruit?
Figure 13
Dollar per serving difference between most and least expensive form of same fruit
Source: Nielsen HomeScan data, 1999. Converted to servings using factors obtained from The Food Buying Guide for Child Nutrition Programs, U.S. Department of Agriculture, Food and Nutrition Service, revised November 2001.
Pears
Grapes/raisins
Apples
Prunes/plums
Raspberries
Apricots
Strawberries
Pineapple
Blackberries
Oranges
Mangoes
Papaya
Grapefruit
Blueberries
Cherries
Peaches
0.04
0.09
0.09
0.14
0.15
0.15
0.19
0.25
0.26
0.28
0.31
0.38
0.38
0.44
0.45
0.51

31How Much Do Americans Pay for Fruits and Vegetables / AIB-790
Economic Research Service/USDA
Most expensive way to eat vegetablesFigure 14b
Dollars per serving
Source: Nielsen HomeScan data, 1999. Converted to servings using factors obtained from The Food Buying Guide for Child Nutrition Programs, U.S. Department of Agriculture, Food and Nutrition Service, revised November 2001.
1Plain/regular versions.
Fresh
Canned1
Frozen1
KaleSauerkraut
Mustard greensCarrots, whole
OkraSummer squash
Mushrooms, whole
Broccoli, fleuretsSweetpotatoes
Cauliflower, fleuretsGreen beans, whole
PotatoesSpinach
Asparagus, spears
Brussels sproutsTomatoes, cherry/grape
Turnip greensSweet corn
Collard greensGreen peas
0.210.24
0.290.34
0.400.49
0.76
0.280.310.310.32
0.370.41
0.85
0.290.31
0.520.52
0.560.91
Most expensive way to buy vegetablesFigure 14a
Dollars per pound
Source: Nielsen HomeScan data, 1999.
1Plain/regular versions.
Fresh
Dried1
Canned1
Frozen1
Potatoes
SauerkrautBrussels sprouts
Mushrooms, whole
Sweet cornSweetpotatoes
Broccoli fleuretsGreen beans, whole
Asparagus spears
Carrots, babySpinach
Squash, zucchiniCauliflower, fleurets
KaleMustard greens
Turnip greensOkra
Green peasCherry tomatoes
Collard greens
1.88
0.651.38
4.41
1.031.421.53
1.704.57
1.281.351.421.481.51
1.631.681.69
1.831.87
2.92
includes the packing liquid, whereas the serving size reflects a drainedamount. As a result, most canned vegetables had fewer servings per poundthan their fresh or frozen counterparts, so their price per serving increased.
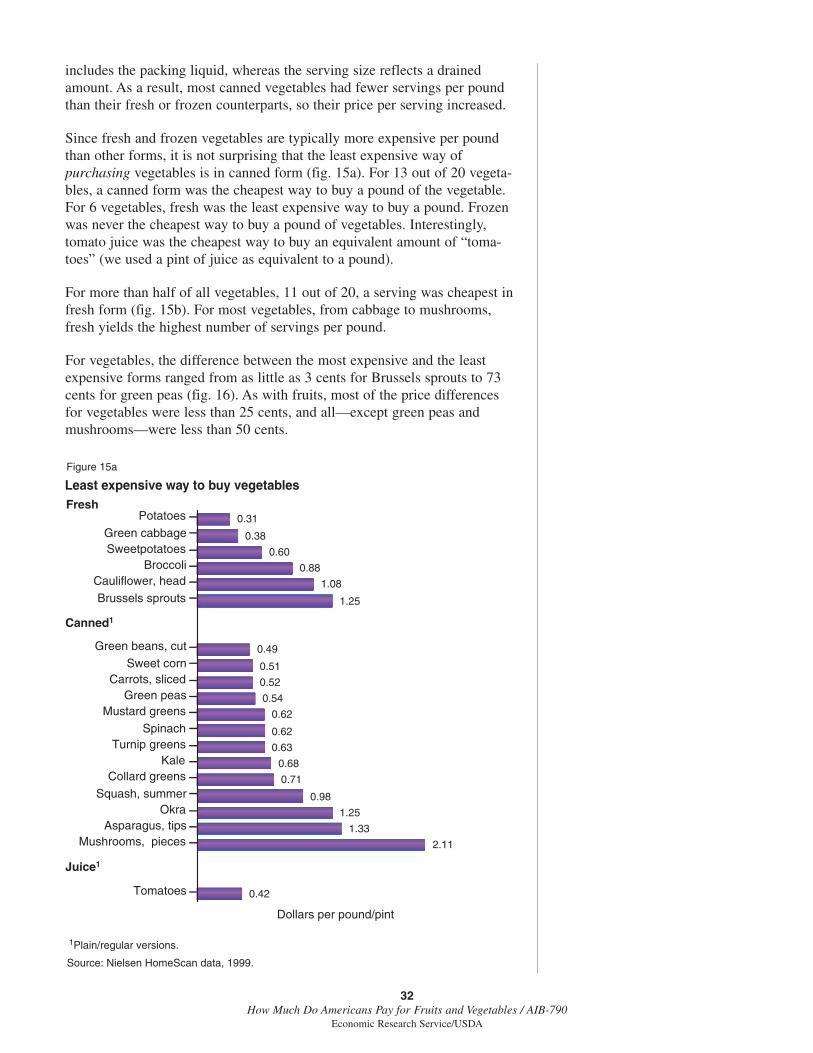
Since fresh and frozen vegetables are typically more expensive per poundthan other forms, it is not surprising that the least expensive way ofpurchasing vegetables is in canned form (fig. 15a). For 13 out of 20 vegeta-bles, a canned form was the cheapest way to buy a pound of the vegetable.For 6 vegetables, fresh was the least expensive way to buy a pound. Frozenwas never the cheapest way to buy a pound of vegetables. Interestingly,tomato juice was the cheapest way to buy an equivalent amount of “toma-toes” (we used a pint of juice as equivalent to a pound).
For more than half of all vegetables, 11 out of 20, a serving was cheapest infresh form (fig. 15b). For most vegetables, from cabbage to mushrooms,fresh yields the highest number of servings per pound.
For vegetables, the difference between the most expensive and the leastexpensive forms ranged from as little as 3 cents for Brussels sprouts to 73cents for green peas (fig. 16). As with fruits, most of the price differencesfor vegetables were less than 25 cents, and all—except green peas andmushrooms—were less than 50 cents.
32How Much Do Americans Pay for Fruits and Vegetables / AIB-790
Economic Research Service/USDA
Least expensive way to buy vegetablesFigure 15a
Dollars per pound/pint
Source: Nielsen HomeScan data, 1999.
Fresh
Juice1
Canned1
1Plain/regular versions.
Tomatoes
Mushrooms, piecesAsparagus, tips
OkraSquash, summer
Collard greensKale
Turnip greensSpinach
Mustard greensGreen peas
Carrots, slicedSweet corn
Green beans, cut
Brussels sproutsCauliflower, head
BroccoliSweetpotatoesGreen cabbage
Potatoes
0.42
2.11
1.33
1.25
0.98
0.71
0.68
0.63
0.62
0.62
0.54
0.52
0.51
0.49
1.25
1.08
0.88
0.60
0.38
0.31

33How Much Do Americans Pay for Fruits and Vegetables / AIB-790
Economic Research Service/USDA
Least expensive way to eat vegetablesFigure 15b
Dollar per serving
Source: Nielsen HomeScan data, 1999. Converted to servings using factors obtained from The Food Buying Guide for Child Nutrition Programs, U.S. Department of Agriculture, Food and Nutrition Service, revised November 2001.
Fresh
Frozen1
1Plain/regular versions. 2Canned tomatoes and tomato juice were both the least expensive at 16 cents per serving.
Canned1
Asparagus tipsBrussels sprouts
Green peasSweet cornTomatoes
Green beans, cut
OkraTurnip greens
Collard greens
Mushrooms, wholeSquash, zucchini
SpinachSweetpotatoes
KaleCauliflower fleurets
Mustard greensCarrots, whole
Broccoli, fleuretsPotatoes
Green cabbage
0.530.27
0.180.17
0.160.12
0.260.25
0.23
0.250.24
0.210.18
0.170.16
0.130.10
0.070.06
0.04
What is the price difference between the most and least expensive form of the same vegetable?
Figure 16
Dollar per serving difference between most and least expensive form of same vegetable
Source: Nielsen HomeScan data, 1999. Converted to servings using factors obtained from The Food Buying Guide for Child Nutrition Programs, U.S. Department of Agriculture, Food and Nutrition Service, revised November 2001.
Brussels sproutsKale
SweetpotatoesOkra
TomatoesCauliflower
Mustard greensSpinach
CabbageBeans, green
BroccoliCarrotsSquash
Turnip greensPotatoes
Collard greensAsparagus
Corn, sweetMushroomsPeas, green
0.03
0.040.12
0.140.15
0.150.16
0.20
0.200.200.21
0.240.25
0.270.30
0.330.33
0.35
0.510.73
Conclusion
Among the 69 forms of fruits and 85 forms of vegetables included in theanalysis, more than half were estimated to cost 25 cents or less per servingin 1999, and 86 percent of all vegetables and 78 percent of all fruit cost lessthan 50 cents a serving. That’s 127 different ways to eat a serving of fruitsand vegetables for less than the price of a 3-ounce candy bar. In fact,consumers can meet the FGP recommendations of three servings of fruitsand four servings of vegetables daily for as little as 64 cents. Consumerstrying to meet the 5-a-day challenge could do so for even less.
Are fresh fruit and vegetables more expensive to eat than processed?According to our findings, definitely not. After adjusting for waste andserving size, 63 percent of fruits and 57 percent of vegetables were cheapestin their fresh form. However, these data do not consider spoilage. Expecta-tions that fresh produce will go bad and be thrown out may be responsiblefor consumers’ perception that fresh produce is more expensive thanprocessed. Regardless, consumers need to be savvy and consider not only theprice per pound, but also the number of servings obtainable from a pound.
Even though fresh fruits and vegetables are generally cheaper to eat thanprocessed, for many fruits and vegetables the difference in price per servingbetween the cheapest and most expensive forms was often less than 25cents. For some, this price difference may be a small price to pay for theconveniences—such as longer shelf life, ease of preparation, and greateravailability—associated with processed forms. Although the prices for fruitsand vegetables in this study are national averages for the entire year and notthe prices that any household might face on a given day, they amply demon-strate that cost need not be a barrier to consumption of the recommendedamounts of fruits and vegetables.
Economic literature suggests that consumers do not respond strongly tochanges in prices of fruits and vegetables (Huang, 1993; Huang and Lin,2000). However, it is clear that consumers buy more of the lower priceditems. Among the 154 forms of fruits and vegetables included in the study,27 percent (41 forms) cost less than the weighted-average price per pound,yet they accounted for 60 percent of total sales volume and 41 percent oftotal expenditures.
34How Much Do Americans Pay for Fruits and Vegetables / AIB-790
Economic Research Service/USDA

References
Food Marketing Institute. “Trends in the United States—ConsumerAttitudes and the Supermarket.” Washington, DC, 2000.
Hogbin, Myrtle B., and Mary Abbot Hess. Public Confusion Over FoodPortions and Serving. J Am Diet Assoc, 1999, Vol. 99, pp. 1209-1211.
Huang, Kuo, A Complete System of U.S. Demand for Food, USDA, ERS,Technical Bulletin No. 1821, 1993.
Huang, K. and B. Lin, Estimation of Food Demand and Nutrient ElasticitiesFrom Household Survey Data, USDA, ERS, Technical Bulletin No. 1887,2000.
Kurtzweil, Paula. “Fruits and Vegetables: Eating Your Way to 5 A Day,”FDA Consumer Magazine, March 1997, updated June 2002.
Putnam, Judy, Jane Allshouse, and Linda Scott Kantor. “U.S. Per CapitaFood Supply Trends: More Calories, Refined Carbohydrates and Fats,”FoodReview, Vol. 25, Issue 3. Winter 2002.
Raynor, H.A., C.K. Kilanowski, I. Esterlis, et al., A cost-analysis of adoptinga healthful diet in a family-based obesity treatment program, J Am DietAssoc, 2002, Vol. 102, pp. 645-656
Shankar, Sharada, and Ann Klassen, “Influences on Fruit and VegetableProcurement and Consumption Among Urban African-American PublicHousing Residents, and Potential Strategies for Intervention,” FamilyEconomics and Nutrition Review, 2001, Vol. 13, pp. 34-46
Stewart, Hayden, Noel Blisard, and Dean Joliffe, “Do Income ConstraintsInhibit Spending on Fruits and Vegetables Among Low-IncomeHouseholds?” Journal of Agricultural and Resource Economics, 2003,Vol. 23, pp 465-480.
U.S. Department of Agriculture, Food and Nutrition Service, Food BuyingGuide for Child Nutrition Programs, revised November 2001.
35How Much Do Americans Pay for Fruits and Vegetables / AIB-790
Economic Research Service/USDA