Embed Size (px)
Citation preview

1
CS448G :: 28 Mar 2011
Interactive Data Analysis
Jeffrey Heer Stanford University
How much data (bytes) did we produce in 2010?
2010: 1,200 exabytes
Gantz et al, 2008, 2010
10x increase over 5 years
Records of Human Activity – The “Buzz” of the Crowd?

2
The ability to take data—to be able to understand it, to process it, to extract value from it, to visualize it, to communicate it—that’s going to be a hugely important skill in the next decades, … because now we really do have essentially free and ubiquitous data. So the complimentary scarce factor is the ability to understand that data and extract value from it.
Hal Varian, Google’s Chief EconomistThe McKinsey Quarterly, Jan 2009
Acquisition
Cleaning
Integration
Analysis
Visualization
Presentation
Dissemination
A Brief History What was the firstdata visualization?
0 BC

3
~6200 BC Town Map of Catal Hyük, Konya Plain, Turkey 0 BC 150 AD ~950 AD Position of Sun, Moon and Planets
Sunspots over time, Scheiner 1626 Longitudinal distance between Toledo and Rome, van Langren 1644

4
The Rate of Water Evaporation, Lambert 1765 The Rate of Water Evaporation, Lambert 1765
The Golden Age of Data Visualization
1786 1900 The Commercial and Political Atlas, William Playfair 1786

5
Statistical Breviary, William Playfair 1801 1786 1822 Price of Wheat and Wages of Labor, William Playfair
1786 1826(?) Illiteracy in France, Pierre Charles Dupin 1786 1856 “Coxcomb” of Crimean War Deaths, Florence Nightingale
“to affect thro’ the Eyes what we fail to convey to the public through their word-proof ears”
6
1786 1864 British Coal Exports, Charles Minard
1786 1884 Rail Passengers and Freight from Paris 1786 1890 Statistical Atlas of the Eleventh U.S. Census

7
The Rise of Statistics
1786 1900 1950
Rise of formal methods in statistics and social science — Fisher, Pearson, …
Little innovation in graphical methods
A period of application and popularization
Graphical methods enter textbooks, curricula, and mainstream use
1786 1900 1950
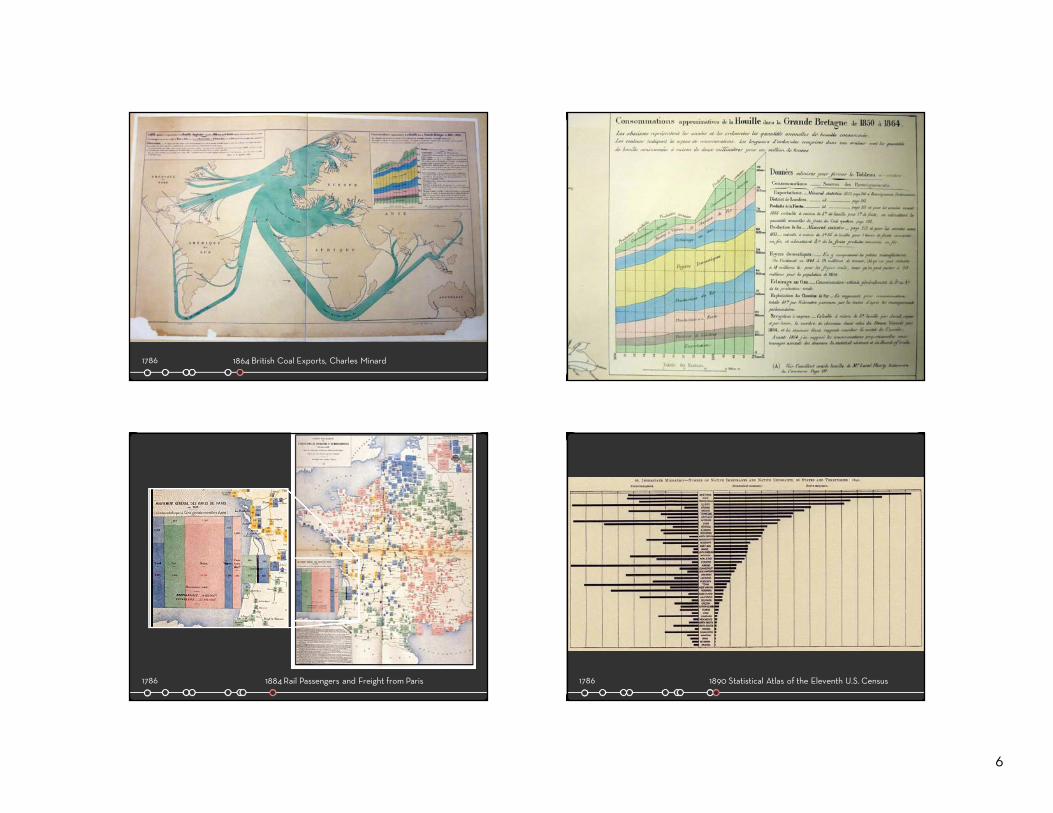
1786 The Future of Data Analysis, Tukey 1962
The last few decades have seen the rise of formal theories of statistics, "legitimizing" variation by confining it by assumption to random sampling, often assumed to involve tightly specified distributions, and restoring the appearance of security by emphasizing narrowly optimized techniques and claiming to make statements with "known" probabilities of error.
8
While some of the influences of statistical theory on data analysis have been helpful, others have not.
Exposure, the effective laying open of the data to display the unanticipated, is to us a major portion of data analysis. Formal statistics has given almost no guidance to exposure; indeed, it is not clear how the informality and flexibility appropriate to the exploratory character of exposure can be fitted into any of the structures of formal statistics so far proposed.
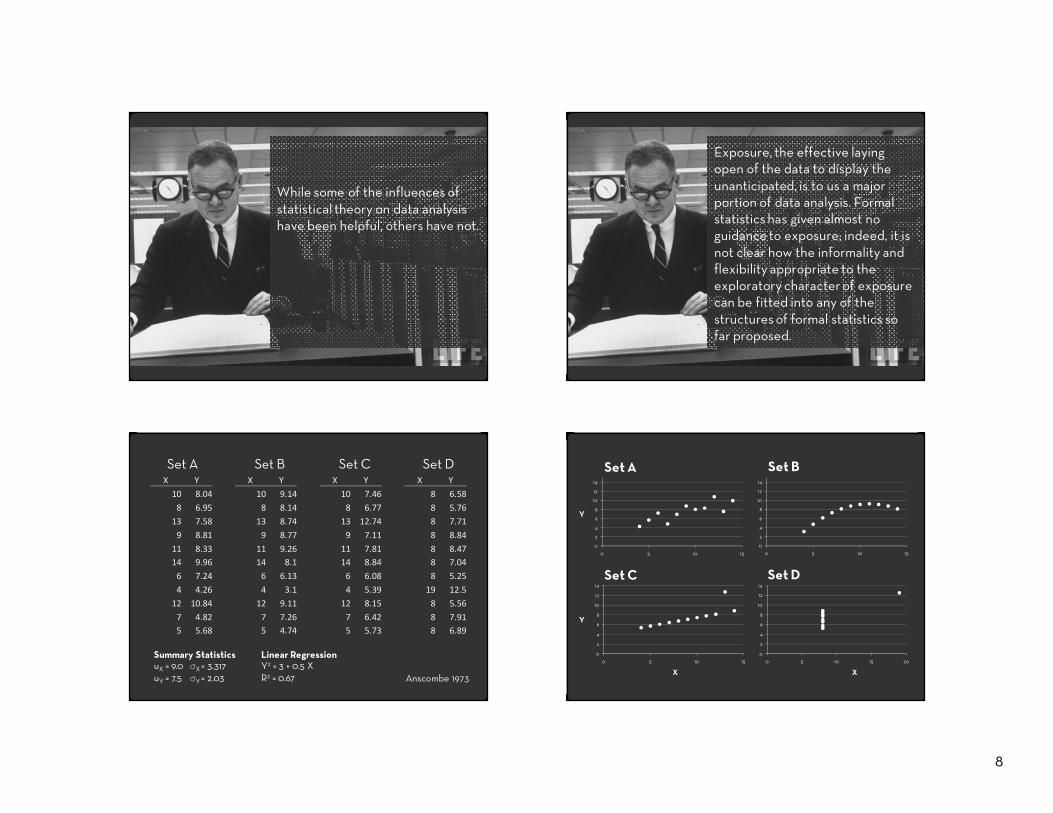
Set A Set B Set C Set DX Y X Y X Y X Y
10 8.04 10 9.14 10 7.46 8 6.58
8 6.95 8 8.14 8 6.77 8 5.76
13 7.58 13 8.74 13 12.74 8 7.71
9 8.81 9 8.77 9 7.11 8 8.84
11 8.33 11 9.26 11 7.81 8 8.4714 9.96 14 8.1 14 8.84 8 7.04
6 7.24 6 6.13 6 6.08 8 5.25
4 4.26 4 3.1 4 5.39 19 12.5
12 10.84 12 9.11 12 8.15 8 5.56
7 4.82 7 7.26 7 6.42 8 7.915 5.68 5 4.74 5 5.73 8 6.89
Anscombe 1973
Summary Statistics Linear RegressionuX = 9.0 σX = 3.317 Y2 = 3 + 0.5 XuY = 7.5 σY = 2.03 R2 = 0.67
0
2
4
6
8
10
12
14
0 5 10 15
0
2
4
6
8
10
12
14
0 5 10 15
0
2
4
6
8
10
12
14
0 5 10 15
0
2
4
6
8
10
12
14
0 5 10 15 20
Set A
Set C Set D
Set B
X X
Y
Y

9
Node-link Matrix
Matrix As a discipline, data analysis is a very difficult field. Data analysis must adapt itself to what people can and need to do with data. In the sense that biology is more complex than physics, and the behavioral sciences are more complex than either, it is likely that the general problems of data analysis are more complex than those of all three.

10
Acquisition
Cleaning
Integration
Analysis
Visualization
Presentation
Dissemination
Course Structure
Course Goals
To explore howa broad class of data analystscan more effectively analyze datausing novel interactive tools.
The class will be interdisciplinary in nature, with a goal of identifying and pursuing new research opportunities.
Course Topics
W1: Analytical ThinkingW2: Data CollectionW3: Data Cleaning & AssessmentW4: Data IntegrationW5: Visual Analysis

11
Course Topics
W6: Managing Big DataW7: Analysis PracticesW8: Social Network AnalysisW9: Text AnalysisW10: Dissemination / Collaboration
Course ExpectationsYou should expect to gain:An overview of the research landscape in interactive data analysis (HCI, Vis, DB).
Engaged discussions with leading researchers and practitioners in the area of “data science.”
Hands-on experience working with scalable data analysis frameworks.
Insights from a quarter-long research project prototyping a new interactive analysis tool.
Course Staff - cs448g@cs
InstructorJeffrey HeerAsst Professor, Computer ScienceOH Tu 1030a-12p, Gates 375
Course AssistantDiana MacLeanPhD Student, Computer ScienceOH W 1-3p, Gates 372

12
… and you!
DataWrangler
Sean Kandel, Philip Guo, Ravi Parikh
Diana MacLean Jason Chuang
TopicFlow

13
Obesity Map Vadim Ogievetsky Obesity Map Vadim Ogievetsky
Driving Shifts Into Reverse | Original by Hannah Fairfield, NY Times
Course Participation
Lecture attendance is mandatory.
We expect you to think critically before lectureCome prepared for discussion!
Each week has a set of required readingsStart the readings over the weekend

14
Reading Responses
You are responsible for a thoughtful written response (2-3 para) for each week’s readings.
Choose one of the readings:What did you find most insightful?Are there notable flaws or shortcomings?What questions remain unaddressed?Did the reading spark any new research ideas?
Responses are due by 8am before lecture, on days without a guest speaker, to cs448g@cs
Discussants
You are responsible for helping lead in-class discussion once during the quarter.
Prepare a short presentation on the readings (15 min maximum). Highlight the main results, implications, and research opportunities.
Moderate discussion of the topic. Use your own questions or input from reading responses to spur an engaged and sustained debate.
Guest Lecture Discussion
You must also help prepare questions for a guest lecture once during the quarter.
Formulate a set of 5 or more critical discussion questions prior to a guest lecture.
Not sure what to ask? Use the week’s readings; look at guests’ web pages, bios & publications.
Questions are due by 8am before the guest lecture, send them to cs448g@cs
Assignments
A0 Class Participation (30%) – quarter long
A1 A Failure of Analysis (5%) – due 4/4
A2 Analyzing Big Data (15%) – due 4/11, 4/18
FP Final Project – 4/18 until quarter’s end(1) Select a domain and data set(s)(2) Identify a research problem, write abstract(3) Iteratively develop a prototype system

15
Assignment 0: Scheduling
By 5pm on Wed 3/31, please send us:
Your preferred email address.
Your top 3 picks for discussant topics. There are 8 options: W2 through W9.
Your top 3 picks for guest lecture questions. There are 9 options: W2 through W10.
Extra credit: generate questions for Wed 3/30.
Week 1 Readings
The Psychology of Intelligence Analysis. Richard J. Heuer. Center for the Study of Intelligence. Central Intelligence Agency 1999. (Chapters 9-12)
Illuminating the Path: The Research and Development Agenda for Visual Analytics.(Chapter 2: The Science of Analytical Reasoning)
A1: A Failure of Analysis due Mon 4/4
Find and document a failure of analysis.
Write a short report (no more than 1 page) that describes the situation, the information serving as input to the analysis process, the nature of the failure, and its consequences.
If applicable, describe the failure in terms of cognitive biases. Suggest ways that improved analysis tools might have prevented the failure.
Questions?
hci.stanford.edu/courses/cs448g