Embed Size (px)
Citation preview

Portland State University Portland State University
PDXScholar PDXScholar
Engineering and Technology Management Student Projects Engineering and Technology Management
Spring 2018
How Managers can Create a Fair Compensation How Managers can Create a Fair Compensation
Procedure in the Engineering Sector Procedure in the Engineering Sector
Jose Banos Sanchez Portland State University
Follow this and additional works at: https://pdxscholar.library.pdx.edu/etm_studentprojects
Part of the Benefits and Compensation Commons, and the Technology and Innovation Commons
Let us know how access to this document benefits you.
Citation Details Citation Details Sanchez, Jose Banos, "How Managers can Create a Fair Compensation Procedure in the Engineering Sector" (2018). Engineering and Technology Management Student Projects. 2232. https://pdxscholar.library.pdx.edu/etm_studentprojects/2232
This Project is brought to you for free and open access. It has been accepted for inclusion in Engineering and Technology Management Student Projects by an authorized administrator of PDXScholar. Please contact us if we can make this document more accessible: [email protected].

Portland State University Maseeh College of Engineering and Computer
Science
Department of Engineering and Technology Management
How managers can create a fair compensation procedure
in the engineering sector
Course: DECISION MAKING - ETM 530/630
Year: Spring 2018
Author(s): JOSE BAÑOS SANCHEZ
Professor: Ph. D. Ramin Neshati

Jose Banos Sanchez
2 June 6, 2018
ABSTRACT
This research has analyzed the feedback from managers and technicians in high
tech companies when doing the individual evaluation of performance using a dual-
perspective approach. The research has established a list of categories and
subcategories that all managers should include in a fair performance evaluation
according to the feedback from different experts, avoiding potential bias described in
Messick & Bazerman, (1996) and clearly known in advance by all the employees
who will be evaluated. Finally, the paper concludes with an analysis of the potential
impact and contribution to the employee’s satisfaction of alternatives methods of
rewarding (using four options, money, stocks, time off and other benefits).
In order to accomplish this research, the HDM model has been used, but in a
different way than traditional HDM model. This research has used a multi-mode or
dual-method, combining a top-down approach with a bottom-up analysis. The first
HDM analysis has included a group of experts who have been in manager position
and second HDM analysis has assessed a group of technicians. The outcome will
show the preferred compensation for each group and if there is any, the gap on
preferences between both groups, together with an analysis of each criterion and
sub-criteria weights according to the respective group.
Future research might focus on a potential analysis about how to solve the
previous gap, prioritizing the generation of an automatic tool to conduct all the
evaluation process. Additional analysis with a wider geographical scope could be
also included.
PERFORMANCE
EVALUATION
FEEDBACKs EXTERNAL
DIRECT BOSS NGO
COLLABORATION
SUBJECTIVE
METRICS
QUALITY OF
WORK

Jose Banos Sanchez
3 June 6, 2018
Contents INTRODUCTION AND BACKGROUND ................................................................................ 4
COMPENSATION OPTIONS................................................................................................. 6
LITERATURE REVIEW ....................................................................................................... 11
DATA ANALYSIS ................................................................................................................ 13
Initial Model and Experts feedback................................................................................... 14
Final Model after Experts feedback .................................................................................. 16
TOP-DOWN ANALYSIS, THE MANAGERS ........................................................................ 24
Experts Feedback ............................................................................................................ 25
BOTTOM-UP ANALYSIS, THE TECHNICIANS ................................................................... 28
Experts Feedback ............................................................................................................ 28
COMBINED OUTCOME ...................................................................................................... 32
RESULTS ANALYSIS.......................................................................................................... 33
Gross Results .................................................................................................................. 33
First Level. Main Categories Analysis .............................................................................. 37
Second Level. Sub-categories Analysis. .......................................................................... 40
Indirect Analysis of the Results ........................................................................................ 46
FUTURE RESEARCH ......................................................................................................... 49
REFERENCES .................................................................................................................... 51
LIST of FIGURES ................................................................................................................ 54
INDIVIDUAL RESULTS ....................................................................................................... 55

Jose Banos Sanchez
4 June 6, 2018
INTRODUCTION AND BACKGROUND
Most companies have been using individual performance mechanism to evaluate
their employees, and as described by Shumpeter, (2016) they may continue using
them for a while even when there is no clear evidence about the effectiveness.
Incentive compensation programs are primarily used to promote efficiency and
productivity of the workforce, but they can also be used by organizations to enhance
employee recruitment, engagement, retention, and employer branding.
Looking into history, the usage of compensation programs and performance
evaluation has its origin in the middle age, and it was the Spanish founded religious
order, Jesuits, the ones that first documented its usage (Brazzolotto, 2012). But what
exactly is a performance evaluation? Lansbury, (1988) defined it as “the process of
identifying, evaluating and developing the work performance of the employee in the
organization, so that organizational goals and objectives are effectively achieved
while, at the same time, benefiting employees in terms of recognition, receiving
feedback, and offering career guidance”. There are three actions that should be
relevant for any research on this topic: “identifying”, because it is the first step to
figure out what are the skills, metrics, or abilities to be evaluated; “evaluating”, which
is the action that provides the performance results; and “developing”, after any
evaluation there should be a plan to improve the performance in case it was negative
or to reward a high performance to keep the employee producing at high rate.
Therefore, according to the definition, the outcome should produce a mutual benefit
for the company and the employee. For the company higher performance should

Jose Banos Sanchez
5 June 6, 2018
lead to more productivity, and for the employee higher performance should lead to
economic benefits and as well as career guidance and evolution.
However, the evaluation methodologies, the way that employees are “scored”,
and the reward compensation mechanisms have been long questioned because of
their efficiency. There are studies (Behn, 2003) which highlight that outcome of the
performance evaluation should be specifically directed to the improvement on
specific goal from managers respect to an employee. It means that performance
evaluation should be different for each employee based on what a manager is
expecting from him/her, and a specific set of objectives for each individual. But this
situation would lead to a very complicated and tedious mechanism where managers
would be more human resources oriented employees than managerial focused
employees.
In general, and complementing the previous ideas, individual performance
evaluation is also a tool to obtain the health status of the company through the
measure of the health status of each of the individuals that belong to the company.
Besides, it can also help to obtain and evaluate the happiness of the employee,
which is a direct factor in the overall company health. This information may help to
also find out projects underperforming based on individual feedback and prevent a
high employee turnover which involves an extra indirect cost for the company (Hinkin
& Tracey, 2000).
Companies cannot forget that individual talent is great, but it can’t turn company’s
high-performance employees into stars, Mankins says: “We could try everything we

Jose Banos Sanchez
6 June 6, 2018
want to emulate the habits of highly effective individuals, but it doesn’t matter what
we do individually if it runs counter to how an organization gets work done”, therefore
“Top-performing companies focus on collective instead of individual”. Hereby, the
performance evaluation is once again conceived as a different evaluation per
employee with a target beyond the individual evaluation but to make the evaluation
an inclusive measure to reduce the gaps between the highest best percentile and the
average.
Therefore, it is clear that evaluation performance is a critical activity within
companies and that an improvement on the current methodologies is required. This
research analyzes one of the most complicated “non-technical” situations where
decision making for managers is beyond their technical or managerial skills. The
perception of unfairness by employees, or the lack of happiness with work
compensation, can lead the employee to look for a new job, increasing the not
desired turnover. This phenomenon is especially high in IT and high-tech companies
(Purohit, 2016). Employees are aware that they are living in an unfair world, but they
expect to be treated fairly by their managers and the company where they spend
most of their week time (Tanner, 2018). This paper pursues to establish a baseline
for a mixed compensation method, with several metrics/inputs that should be
weighted differently based on individual pre-analysis.
COMPENSATION OPTIONS
Reinforcement theory states that a response followed by a reward is more likely
to recur in the future (Thorndike's Law of Effect). However, the scope of this paper is

Jose Banos Sanchez
7 June 6, 2018
to review several options of rewarding and avoid the tyranny of a single option like
money, which has been the traditional most adopted method. Previous research has
concluded that compensating a high-performance employee makes a later high
performance more likely. But there is also a potential negative consequence when
high performance is not followed by a reward (Gerhart, Minkoff & Olsen, 1995).
There is a trade-off to be considered when deciding to or not adopt a compensation
methodology in a company. The decision to introduce a mechanism to evaluate and
reward performance has to be analyzed as a long-term mechanism. Otherwise, a
compensation methodology established during a short period of time and later on
canceled may create more damages than benefits as explained by Gerhart, Minkoff
& Olsen (1995).
This research has selected four different types of compensations methods, after
talking with several experts and perform an intense literature review, concluding with
“Money”, “Stocks”, “Time” and “Others” as four final options. All they will be the
weighted by the different experts, paired with a set of criteria and sub-criteria
parameters confirmed by a group of experts that will be explained more in detail in
the Data Analysis section. These options are not mutually exclusive and a
combination of them is, in fact, an option and probably a more effective method than
a single compensation option. As part of a future research, might consider the
creation and evaluation of a software tool to design the most efficient weight
distribution to each of the criteria, sub-criteria and compensation methods. This tool

Jose Banos Sanchez
8 June 6, 2018
could be also personalized, and individualized in order to create a most accurate
evaluation for individual employees.
But let’s analyze each of the four possible compensation methods:
Money. This is the most traditional compensation mechanism. The majority of
the companies that carried out a performance evaluation of their employees have
been using this option for several years. There are plenty of reasons why it has been
the most widely used compensation mechanism, among them we can say that it is
easy and it shows a short-term effect on employees. Money is the core of the
modern society and money is a tangible asset. However, money per se is not a good
tool to increase employee’s performance and it is not even perceived as the main
reason why employees perform well at their jobs (Judge et al, 2010).
Stocks. This way to compensate the performance is backed by the argument
that exposing an employee’s wealth to the firm’s stock price will create incentives for
the employee to work harder, it is especially evident in companies and roles that
involve a certain degree of innovation (Chang, et al 2015). Even though it has been
especially used by startups, which have no capital to compensate their employees
with cash, big companies in IT sector have been also using this method for a long
time. If we analyze this method, comparing employees and company perspective,
the first conclusion is that stocks as compensation mechanism mean more
complexity for employees than for the company. Since there are different types of
stock options and not all employees have an investment background and financial
culture, this option may require an extra degree of communication and explanation

Jose Banos Sanchez
9 June 6, 2018
from company to the employees. The employees must be fully aware whether their
stocks are vested and will retain their full value even if they are no longer employed
with that company and what type of taxes implication they have. Employees must
consider the scenario when stocks are subject to tax withholding, which may lead to
a tax payment in cash, even if the employee was paid by equity compensation. It will
make the employee use its own cash to pay now for a future compensation that will
be materialized when the employee sells the stocks.
Time. Providing more paid time off can, paradoxically, increase employee
productivity (Heymann, 2014). Increasing job satisfaction, reducing stress levels, and
improving job focus are all possible positive effects of providing more paid time off.
However, in this case, unlike stocks, the complexity is transitioned to the company.
Planning activities with fewer employees require additional management and
increase of risk due to lack of resources.
Other. There are several alternatives or non-traditional methods that could be
adopted (Heymann, 2014). They include, among others:
a. Facilitating additional courses or training for employees pursuing
certifications. The benefit obtained is directly received by the employee but
there is an indirect benefit for the company having a more skilled employee.
b. The compensation may include partial or complete payment of the
certification or school program, flexible job schedule to attend the classes or
a combination of both.

Jose Banos Sanchez
10 June 6, 2018
c. Depending on each individual case, for employees with kids, pre-school fee
payments could be offered. This option was highly recommended by some of
the experts.
d. To promote the internal team building, company activities like group traveling
or social activities like dinners could be offered too.
To summarize, using the feedback from managers and technicians, this research
tries to figure out what is the best criteria, matching the different preferences from
each both group in order to select the compensation method. Additionally, this paper
highlight what are the main categories and subcategories that should be included in
the performance evaluation. The outcome of this research weighs the benefits
associated with each option (money, time, stocks and other) evaluated by both
groups (managers and technicians). This situation reflects a typical decision-making
scenario, where multiple inputs must be considered and evaluated before the
decision is taken. People facing this situation, generally managers, have to evaluate
the performance of their employees and sometimes the human bias mentality and
our lack of capacity take decision completely decontextualized may lead to not the
best decisions. Through the use of decision-making tools, like HDM, this paper
intends to minimize these bias effects introduced by the humanly limited capacity to
be completely abstracted from the environment. HDM is a structured method to
strongly support the outcome of the decision making (Clemen et al, 2014).

Jose Banos Sanchez
11 June 6, 2018
LITERATURE REVIEW
As a side effect of the main purpose of this research, an outcome of this
research could be a future research to analyze a possible correlation between a high
turnover and the compensation evaluation mechanism in these companies. The
analysis should focus on a combination of several sources as contributors to such
outcome. Among other reasons, there is an initial problem related to the wrong or not
proper individual hiring process. If the person hired is not the most accurate for the
vacancy, even when the compensation for his/her performance may also influence
on his/her satisfaction, the problem is already there and the compensation will not
solve it. In this scenarios, the compensation is just a short-term satisfaction. Or in
other words, it has no capacity to solve the problem in long-term, but it has the
potential influence to make it worse. Therefore, the method to hire the correct
employee should be optimized (Brigham et al, 2005).
There are several studies already done regarding the compensation and
performance evaluation criteria using AHP. An interesting approach was done by Liu
et al, (2005) to evaluate the performance of a small business unit. We could assume
that in a certain way, each individual in a company and within a department could be
considered a single business unit. In this case, using the parallelism from Liu et al
(2005) research, most of the metrics should be qualitative metrics to evaluate the
outcome. But adapting the method with slight modifications from the original one, a
company could create a new performance evaluation criteria for employees.

Jose Banos Sanchez
12 June 6, 2018
The compensation analysis is not a simple process, this should not be surprising:
pay for performance is a complex process that demands a large investment of time
and resources from companies who seek to use it. The effectiveness of a pay for
performance system can be undermined by flaws in the design, implementation, and
operational phases (Designing an effective pay for performance compensation
system: a report to the President and the Congress of the United States, 2006). An
ongoing analysis of each employee that includes the results of the previous
evaluation can help to ensure a more positive performance outcome in time.
A similar research focused on the evaluation of the performance instead of the
compensation method was done by Islam & Rasad, (2006). This research evaluates
employees performances based on six criteria: quantity/quality of the work,
planning/organization, initiative/commitment, teamwork/cooperation, communication
and external factors.
As in all model, the scope of an evaluation must be first identified and then, there
is a need to define the weight and evaluation method. This process involves an
identification of all the attributes which are perceived to be significant in evaluating
employees (or potential candidates to be hired). These will vary somewhat from one
hiring entity to the next, and from one rating individual to the next. Once the
attributes have been selected, they must be weighted (Taylor, Ketcham and
Hoffman, 1998). But the way to weigh each criterion, the importance of every pair-
wise comparison is where the complexity lies. For that reason, AHP is a tool that
helps to generate such weights automatically after processing the experts’ feedback.

Jose Banos Sanchez
13 June 6, 2018
A second problem associated with the categories and subcategories used, is that
some of the attributes are completely quantifiable, some are partially quantifiable,
and others are completely subjective (Taylor, Ketcham and Hoffman, 1998). It makes
that comparisons are not completely fair in some scenarios.
Much research has been done in the last 30 years analyzing compensation and
performance, looking for the positive or negative effect. However, compensation
methods have not changed much (Kohn, 1994). This paper tries to move forward on
this topic and trigger a new discussion about the tools to develop a fairer
methodology.
DATA ANALYSIS
The hierarchical decision model has been widely used for similar purposes than
this research, performance evaluation, as explained in the literature review. But none
of them has combined a top-down and bottom-up approach to figure out whether a
potential gap between managers and employees could affect their long-term
relationship with the companies. The HDM model was selected for its capacity to
create a quantitative outcome for a set of qualitative and quantitative inputs. These
qualitative and quantitative inputs are the result of several experts’ feedback,
literature review and the researcher own experience.
The initial model was the result of the previously mentioned literature review,
together with my experience during more than 12 years working in IT sector. I
worked more than seven years in a technical position not involving people

Jose Banos Sanchez
14 June 6, 2018
management and the last four years as a manager with several people reporting to
me. This first model included five main criteria and several others sub-criteria. This
initial model was shared with a set of experts who provided their feedback too.
Combining experts’ feedback with the initial model, the final model was developed
and shared with experts in managerial positions and engineers with no managerial
responsibilities.
Initial Model and Experts feedback
The initial model, obtained after a careful literature review, was shared with
experts and included the following criteria and sub-criteria.
Figure 1. Initial HDM structure proposed by the research
In order to not influence the experts and create a potential cognitive bias, like
“Confirmation bias” (Nickerson, 1998) or “Validity bias” during this phase, the experts
consulted to gather the initial feedback about the model were not the same as the
experts to complete the final HDM model. The participants have chosen to provide

Jose Banos Sanchez
15 June 6, 2018
feedback and help to improve the initial model were a wide variety of experts from
engineering sectors, Human resource departments, project management position,
and technical experts. Additionally, one Ph.D. in Psychology was also consulted in
order to include a behavioral approach to the model assessing.
Among their feedback, there are some interesting points that should be reflected
in the future model and are highlighted below:
“Extra Curriculum”. The name was updated to “Professional Development” to
provide a more accurate definition, and a new subcategory was added under it.
According to one of the technicians who provided feedback, there are certain
courses that do not provide any official certification but are related to the technology
sector, and are therefore important to consider.
“Feedback” was updated to “Performance Review”, because this category was
collecting qualitative input from different actors who work on a daily basis or at a
certain point with the individual during the evaluation period. Additionally, two new
subcategories were added. “Other Departments”, because according to a Project
Manager opinion, nowadays, an employee has to collaborate with multiple
departments during projects. These departments are independent and therefore their
members are different from the employee’s work team. Finally, a self-review input
was also recommended, in this case by a human resource expert. This option,
according to expert opinion, is useful also to measure the discrepancy between the
individual and the environment.

Jose Banos Sanchez
16 June 6, 2018
“Subjective Metrics” was updated with the addition of two new subcategories. For
this category, there were several proposals and sub-criteria proposed, but some of
them were too generic, like the initial sub criteria “quality of work”. The final decision
was to include “team building” and “conflict resolution" because of the direct
correlation between them and teams performance (Porter & Lilly, 1996). One point
increase in conflict, decreased 5.8 points in the performance, which makes these two
features clearly important to be considered regarding employees.
“External Activities” are not a high interest for most of the employees. A couple of
experts from the managerial group and one human resources expert consider them
important at a certain level and should be part of the model. The only change within
this category was the naming of “Sports Practice” to “Personal Fitness” to highlight
that it was related to the healthy habits of the employees. Much research has
analyzed the correlation between employees practicing sports and having healthy
habits with the reduction in absenteeism and medical leaves (Gebhardt & Crump,
1990).
Final Model after Experts feedback
After collecting and analyzing the feedback from different experts and performing
a wider literature research, the initial model was updated to include all the new
concepts. The result was a wider HDM model with a wider perspective, including
more than only economic and traditional criteria.

Jose Banos Sanchez
17 June 6, 2018
The final model built is shown in the following graph, and each criterion and sub-
criteria are explained in detail later on. Finally, the four potential outcomes are
described.

Jose Banos Sanchez
18 June 6, 2018
Figure 2. HD
M Final M
odel

Jose Banos Sanchez
19 June 6, 2018
Metrics (KPIs). Key Performance Indicators. It represents a direct and quantitative
way to evaluate the performance. A set of measurable and realistic objectives are
given to the employee, department, and company at the beginning of the period
when the performance will be evaluated. This criteria refers to the percentage of
accomplishment for these objectives and is probably one of the most widely adopted
(Ballard,2013). The idea of having several sub-criteria intend to compensate the
weights among three contributors. In a globalized world, the success of an individual
is usually related to its department’s success or vice versa, and likely the department
is with the company. Therefore, a distribution of weights between three factors will
compensate the potential outliers where one factor overcome the others two. The
three sub-criteria are:
• Individual. Specific KPIs to measure the individual contribution. This KPIs are
set at the beginning of the period to be measured and they are agreed
between the direct manager and the technician.
• Department. These KPIs are established for the whole department. They must
be also public and available for all the members of the department.
• Local/National. Following the same criteria as the previous sub-criteria, there
should be a performance evaluation for the company at the
local/national/global level.
Professional Development. In this criteria, the objective of evaluating the self-
motivation of the employees is the main target. In a super competitive world,
technological companies need to have employees up to date with the latest

Jose Banos Sanchez
20 June 6, 2018
technology trends and tendencies. It is especially important for this sector,
engineering, where all the technicians and managers work. Besides the technician
benefit, the company gets also benefits in several ways from the employee’s high
motivation for continuous learning. Furthermore, this motivation for a career
evolution is what makes this category so important to be included (Griesser, 1993)
• Certifications. Completion of courses outside of the company that provides
certifications in related areas. Certifications are obtained out of working hours,
and the final certification is issued by an official school, company, program,
etc.
• Internal Trainings. Company sponsored training related to the employees'
work.
• Other Courses (related to work). Courses or programs outside of the company
and working hours that do not include any final certification but are related to
the sector where the employee work.
• Other Courses (not related to work). Courses or programs done by the
employee outside of the company and working hours that do not include any
final certification and are not directly related to the sector where employee
developed his career. E.g. language courses,
Performance Review. Previously, the KPIs were included as a quantitative
feedback for individual performance. However, it is also important to include a
qualitative review from other employees or staff evaluating the individual contribution
to the company of the technician.
Jose Banos Sanchez
21 June 6, 2018
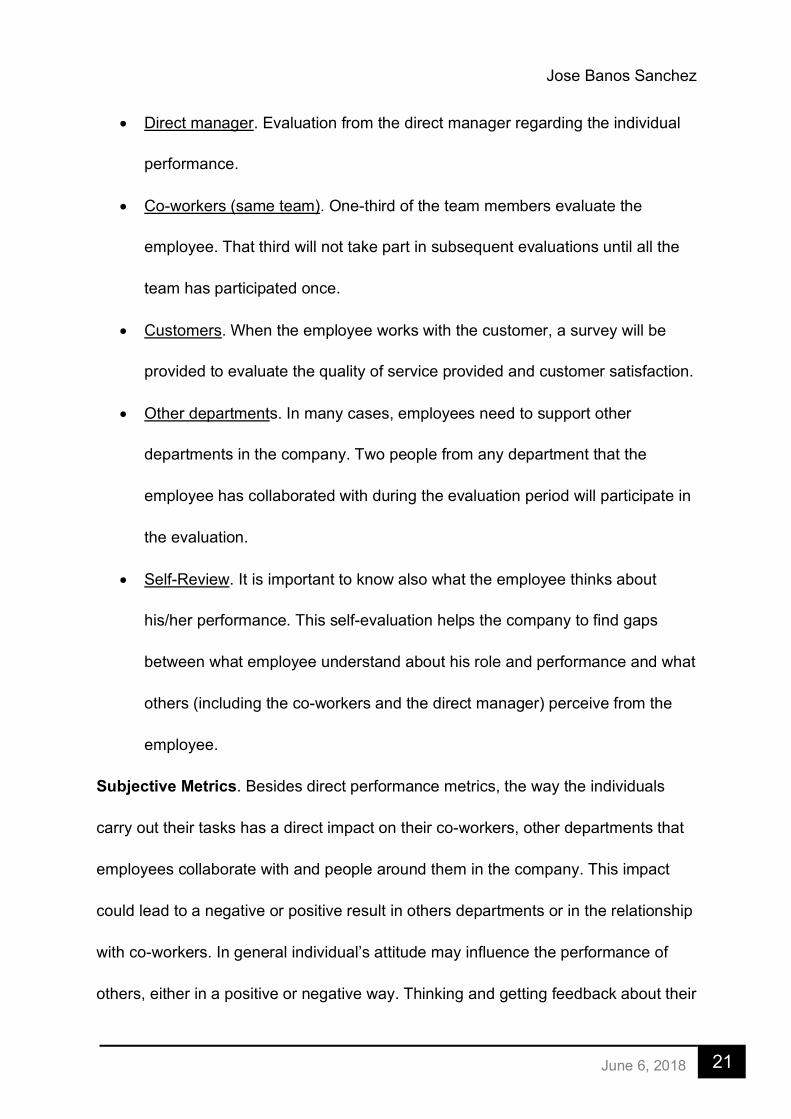
• Direct manager. Evaluation from the direct manager regarding the individual
performance.
• Co-workers (same team). One-third of the team members evaluate the
employee. That third will not take part in subsequent evaluations until all the
team has participated once.
• Customers. When the employee works with the customer, a survey will be
provided to evaluate the quality of service provided and customer satisfaction.
• Other departments. In many cases, employees need to support other
departments in the company. Two people from any department that the
employee has collaborated with during the evaluation period will participate in
the evaluation.
• Self-Review. It is important to know also what the employee thinks about
his/her performance. This self-evaluation helps the company to find gaps
between what employee understand about his role and performance and what
others (including the co-workers and the direct manager) perceive from the
employee.
Subjective Metrics. Besides direct performance metrics, the way the individuals
carry out their tasks has a direct impact on their co-workers, other departments that
employees collaborate with and people around them in the company. This impact
could lead to a negative or positive result in others departments or in the relationship
with co-workers. In general individual’s attitude may influence the performance of
others, either in a positive or negative way. Thinking and getting feedback about their

Jose Banos Sanchez
22 June 6, 2018
indirect impact on others may help to improve the quality of place to work on a
company. The sub-criteria used are:
• Conflict Resolution. Human relationship is complex and usually influenced by
our unconscious mistakes and limitations. The capacity to empathically
discuss, face and dismiss daily problems at work, the capacity to positively
deal with customers without conflict is a skill that should be rewarded by
companies.
• Time Management. Time management is one of the three approaches most
studied to improve operations performance, together with supply chain
management, and quality management. In this case, time means, "just on
time”, not before or later (Kannan, & Tan. 2005). The capacity of employees
to do things on time helps companies to work like a perfect engine avoiding
unsynchronized situations between employees or departments which can cost
money.
• Team Building. Healthy companies support and encourage employees with an
open-mindedness and team approach. Employees spend almost 1/3 of their
life at work, with co-workers. A productive relationship between members of a
team leads to higher department productivity.
• Company Core Values. All the companies use their core values as strategic
guidelines. When all parts of an engine work cohesively, the engine produces
its best performance. Similarly, when all employees follow the company’s
principles or values, the company is more likely to consistently succeed.

Jose Banos Sanchez
23 June 6, 2018
Therefore, it is important that employees are aware and committed to the
company strategic vision.
External Activities. Behavioral economics is becoming a strong factor in our
capitalist society. The introduction of new metrics to evaluate performance may not
be limited to evaluate direct activities or tasks performance related to the job, but
also external activities that can create an indirect impact in the way we perform or
accomplish our work (Baker et al, 1998). A healthy employee will be more productive
than someone who doesn’t care for his/her physical health, an employee with high
concerns about its society will be more willing to get involved in the resolution of
internal conflicts in the company than someone with less concern. After analyzing
different experts input, the set of sub-criteria are:
• NGO collaboration. Collaboration with a non-profit organization is a signal of
commitment to a better society and a response to the increasing Corporate
Social Responsibility movement. People who collaborate and participate in
non-profit organizations has proven to be more motivated at work (Rodell,
2013).
• Personal fitness. Healthier, happier employees tend to be high performers
and great team players, ultimately contributing to business goals. That’s why
employee wellness programs have become so popular in the workplace.
• Company Social activities. According to a recent survey, 58% of men and
74% of women would refuse a higher paying job if it meant not getting along
with coworkers. Social activities in company help to improve the relationship

Jose Banos Sanchez
24 June 6, 2018
between team members and lead to a healthier work environment (Fermin,
2015).
After review all the inputs, the outputs are the remaining criteria to be analyzed.
The potential outcomes, “Money”, “Stocks”, “Time” and “Others” were already
described in “Compensation Options” chapter so there is no need to review them
once again. For more information, the reader should go back to “Compensation
Options”.
TOP-DOWN ANALYSIS, THE MANAGERS
There is a gap between managers, human resources and employees about the
methodology, the evaluation criteria and finally, the compensation reward used. This
uncertainty can create stress and in certain cases an unfairness perception among
the employees which can easily turn into unhappiness and feelings of discrimination,
or in some cases even to lawsuits. It is clear that managers evaluate certain things,
certain criteria, like skills, KPIs or metrics from employees and employees perceive
these criteria differently or consider their importance differently from their managers.
Therefore, this is not only a problem about the performance evaluation but beyond
that, it is about the relationship between managers and employees in long term too
(Clausen et al, 2008).
On the other hand, companies can be too focus on economic rewards when there
are other alternatives that in certain situations are more attractive to employees.
Managers are comfortable following a traditional approach when deciding the

Jose Banos Sanchez
25 June 6, 2018
compensation methods and the performance evaluation, basically following the
guidelines from human resources department. There is a need to coordinate
managers, human resources and employees to create a methodology that takes into
consideration the interests from each of these three groups to create the best model
for the interest of the company.
Experts Feedback
Before looking for the experts' feedback, this research defined a minimum
criteria that all of them should have to be electable. The idea was to homogenize this
group as much as possible, avoiding potential out layers or inconsistency among
them. There were five criteria to be considered when selecting the experts from
managerial positions:
• Professional Career. Experts should have more than 10 years of total
experience.
• Managing people. Managers should have managed people for at least
during 5 years.
• Companies. They should be working in companies with more than 100
employees or Tier-1 companies.
• Geographical limitation. In order to avoid cultural differences, the research
is focused only in Spain.
• Engineering background. The managers belong to engineering
companies, IT, Telco, Big Data, Cloud, etc.

Jose Banos Sanchez
26 June 6, 2018
With all that information, the research used the feedback from ten experts. The list of
them, with their position and years of experience is listed below:
• I. O., Senior Project Manager in Vodafone Spain. +15 years experience
• J. S., Roaming Services Director in Telefonica Spain. + 20 years experience
• J. R., Executive & Senior Consultant, Blockchain Technology on International
Roaming in MNO. + 20 years experience
• J. R., Head of Sales Department in Ayscom Technologies. 12 years experience
• J.M.R., Senior Project Manager in Huawei Technologies. +15 years experience
• M. R., Senior Software Program Manager in Fagor Electronics. +15 years
experience
• N. C., CEO of Carteradeinversion.com and Manager in Mercadona S.L. 10 years
experience.
• V.D., Project Director in Huawei Technologies. 12 years experience.
• J. E., Technical Team Leader in MasMovil. 10 years experience.
• J. G. Senior Project Manager in Huawei Technologies. 13 years experience.
All these experts were requested to complete the HDM model considering what
would be their preferences in order to evaluate their employees. They were also
asked about the method they would prefer to use as a compensation after evaluating
their employees’ performance. The results obtained are shown below:

Jose Banos Sanchez
27 June 6, 2018
Figure 3. Managers HDM outcome
In this case, the disagreement level between experts is 0.061, which is high but
still far from the maximum to be considered as a non-reliable model. There is no a
clear clue to explain why the disagreement is high in this test. On the other hand,
looking at the table below with the “mean error square”, the value 0.045 tell us about
the quality of the model, and with a 4.5% the model is an acceptable one.
Figure 4. Managers HDM model significance
Finally, to conclude with the reliability of the analysis, the F-Value obtained by
the model is 6.77 which is higher than the standard F-Test value consider for the
accuracy of 95%, which in this case is 3.01. Going more in detail, the model created
and experts’ feedback has produced a statistical significant result even above 99%

Jose Banos Sanchez
28 June 6, 2018
of the cases (p-value 0.01) which highlights the quality of the response and the
model. In overall, the robustness of the research is guaranteed according to the
previous results.
BOTTOM-UP ANALYSIS, THE TECHNICIANS
As mentioned previously, the uncertainty about the evaluation method and the
way the employee is rewarded can create stress and unfairness perception among
the employees. In a customer-centric tendency for most if not all of the companies, if
not all, the idea that employees are first has been a revolution approach (Nayar,
2010). It turned the hierarchical pyramid upside down by making management
accountable to the employees, and not the other way around. HCTL is an example of
a successful company following this, and following a transformation that has made it
one of the fastest-growing and profitable global IT services companies and,
according to BusinessWeek, one of the twenty most influential companies in the
world. Therefore, if employees are becoming a central part of company’s strategies,
the same companies should listen to what their preferences are in term of
compensation and performance evaluation.
Experts Feedback
To collect the feedback from employees who are not involved in any
management position, this paper has also considered five criteria to select them as
part of the group of experts:
• Professional Career. Experts should have been in a technical position
which does not require people management for at least 5 years.

Jose Banos Sanchez
29 June 6, 2018
• Companies. They should have been working in companies with more than
100 employees, or Tier-1 companies. (like Telefonica, Vodafone, Huawei
..)
• Geographical limitation. In order to avoid cultural differences, the research
is focused only in Spain.
• Engineering background. The employees should work for an engineering
company, IT, Telco, Big Data, Cloud, etc.
With all that information, the set of experts who contributed to this research were:
• C. A., Senior Customer Engineer at CheckPoint. +10 years experience
• E. R., Core Software Product Expert at Huawei Technologies. +10 years
experience.
• E. G., Software Technical leader at Red Hat. + 15 years experience.
• F. E., BSS Senior Technical Leader at Huawei Technologies. 10 years
experience.
• J. M., ICT Technical Lead Business Transformation at Amdocs. +10 years
experience.
• J. M., Senior Analyst at Banco Santander (IT Department). +10 years experience.
• L. V., Senior Network Solution Specialist at HP Spain. +15 years experience.
• S. S., Senior Automation and Control Engineer in Acciona. +15 years experience.
• A. V., Senior Software Developer at Huawei Technologies. 8 years experience.
• A. G., Senior Customer Support at Huawei Technologies. 7 years experience.

Jose Banos Sanchez
30 June 6, 2018
• M. M. P., Customer Support and Project Deployment at SIA group. 5 years
experience.
Likely with managers, all the technicians' experts were requested to complete
the HDM model, but with a slight difference in the initial question respect to the
managers. They should weigh their preferred criteria in order to be evaluated and
what would be their preferred compensation method after their performance
valuation was completed. The results obtained are shown in the next graph:
Figure 5. Technicians HDM outcome
There is a disagreement of 0.062 which is slightly high but within the accepted
limits. It is interesting that disagreement is almost the same than the one obtained in
the Top-Down analysis. In this case, the differences in ages of experience among
the experts could have affected the outcome. However, we cannot conclude with a
proven correlation between ages of experience and this high disagreement, but later
one on this research this factor will be analyzed. Regarding the individual
inconsistency, there is only one case that could be considered as an outlier due to

Jose Banos Sanchez
31 June 6, 2018
the deviation from the mean 0.03, showing an inconsistency of 0.08 which is
however still below the safety limits.
Figure 6. Technicians HDM model significance
To conclude, looking into the table above, the "mean error square" is 0.067
which is higher than the same table for managers. This means that the previous
model is more consistent and feedback from managers is slightly more reliable, but
not significantly better. There may be several reasons, but one could probably be the
more homogeneous set of profiles used for managers than for technicians.
Regarding the F-Test value, for the technicians, the value obtained is 9.67 which
is also higher than the F-Test value expected for 95% accuracy, 2.92. Therefore, the
model and experts feedback could be considered also as statistically significant. In
this case, the ratio F-Test value obtained versus F-Test value expected is 3.31 times
compared with the managers experiment where it was 2.21, highlighting that
technicians result is statistically slightly more significant. In overall, the robustness of
the second group on this research is also guaranteed.

Jose Banos Sanchez
32 June 6, 2018
COMBINED OUTCOME
Before combining both results, from managers and technicians, we have to
analyze the potential influence of outliers in the results. In order to figure out whether
any outlier may affect the results of this research, this paper has introduced a
comparison between mean and median in the next graph. The Figure 7 shows that
there is no big difference between both metrics, and therefore the outliers were not
skewing the results.
Figure 7. Comparison between Mean and Median for Outcomes
The combined outcome intends to equally weigh the preferences from the
managers and the employees. It is not part of this HDM model, and there is no
evidence about the potential disagreement if all the experts’ feedback (managers
and technicians) were asked the same question and their feedbacks were processed
under the same HDM model. However, the purpose of this combination intends to
show a balanced model, diluting the difference between the 2 experts’ groups while
0.30
0.200.17
0.330.29
0.180.16
0.34
TIME STOCKS OTHER REWARDS MONEY
Mean vs Median
MEAN MEDIAN

Jose Banos Sanchez
33 June 6, 2018
combining them into a single one. The combined results are represented in gray
color in the next graph.
Figure 8. HDM models outcome for Managers, Technicians and Combined
The combined result reduces the weight for "Time", but still, it will be scored as
the second preferred option. We could say that combined result is closer to the
technicians' results than managers' result.
RESULTS ANALYSIS
Gross Results
Initial results could be divided into four groups according to each of the
alternative outcomes available. Additionally, the paper has included two different
expert’s groups to analyze their feedback, managers, and technicians. The following
graph is an intuitive way to see the result of the whole research in a quick look at it.
0.30
0.200.17
0.33
0.210.23
0.20
0.35
0.2590.2145
0.1835
0.343
TIME STOCKS OTHER REWARDS MONEY
TECHNICIANS & MANAGERS & COMBINED
TECHNICIANS MANAGERS COMBINED

Jose Banos Sanchez
34 June 6, 2018
Figure 9. Comparison of outcomes from Managers and Technicians
As a summary, Money is the clear winner as preferred compensation method for
both groups, and Other Rewards the less one. For all of the outcomes, a set of
particular differences between managers and employees are highlighted and
analyzed below. This paper has tried to understand what could be the reason behind
these differences, using the expertise direct feedback.
Money. It is the clear and highest preferred option for both groups. Even though
there is much research pointing out that money is a short-term motivator and not the
best mechanism to motivate employees, (Deci, Koestner & Ryan,1999). It is even
considered to introduce some negative impact in some scenarios. But the result of
this research, in a contradictory way to previously mentioned research, proves that
for both, managers (who must decide the compensation mechanism for its
employees, 35%) and technicians (who must receive the compensation after
individual evaluation, 33%) the money is the most important compensation option.
0.30
0.200.17
0.33
0.210.23
0.20
0.35
0.00
0.05
0.10
0.15
0.20
0.25
0.30
0.35
0.40
TIME STOCKS OTHER REWARDS MONEY
TECHNICIANS vs MANAGERS
TECHNICIANS MANAGERS

Jose Banos Sanchez
35 June 6, 2018
Stocks. It has a higher acceptance among managers (23%) as a compensation
mechanism than among technicians (20%) as a reward option. The HDM model did
not mention it, but according to direct feedback from experts (especially from
employees), stocks are still seen as a complicated tool by certain segments of the
population. The risk aversion theory (Tversky & Kahneman, 1991), and the
perception of lack of security which is still embedded in the stock market are two big
barriers for its acceptance. We could also found explanations looking into the human
“temporal discounting” and the preference for lower amount now instead of higher
value in the future, which involve hihger risk. This human behavior is especially
perceived with stock markets (Rieger, Wang, Thorsten, 2015). For all these reasons,
this compensation method is not much appreciated by technicians. However,
managers perceived it as a good compensation mechanism, probably because it
creates a link between the employee and the company. The benefit for managers
after the creation of this link is that the employee has to work harder because he
owns part of the company, through the stocks received.
According to one expert’ feedback, from the managers’ group, he suggested that
stocks should be also used as a retention policy and therefore linked to the time the
employee has been working for the company. I found it especially interesting and,
variable rewarding based on the employee fidelity to the company may be a part of a
separate research.
Time. This compensation method reveals the most interesting conclusion from this
paper. There is a big gap between managers and employees regarding their

Jose Banos Sanchez
36 June 6, 2018
preferences for this option, 21% vs 30%. For managers, time-off is scored as the
third option in preference, but for technicians, it is seen as the second most preferred
one. While having a direct conversation with some experts (managers and
employees), the conclusion obtained is that both groups perceive the benefits from
this option in a different way. For managers, money, stocks and other rewards are
tangible elements provided by the company and not affecting their daily managing
activities. The managers are not affected if an employee receives a higher or lower
amount of money in a bonus, or stocks or any other reward compensation. However,
employees’ time-off is a tangible element with a direct relationship to manager’s
work. Employees with more time-off, obtained as a reward, could potentially impact
the managers planning activities and could lead them to change their future
schedules when the employee claim for that time. The teams dimensioning could be
also affected because more people could be on vacation during a peak of workload,
impacting project plans and future activities. Therefore, this compensation method
has a direct impact on manager’s results and manager’s planning activities.
On the other hand, for employees, once the money is secured by the monthly salary,
the time is becoming a very important asset that cannot be bought. Using direct
feedback from technicians, and adding an important variable, most of them have
more than ten years of experience, the time with family or time for own leisure is
sometimes more important than extra money, stocks or other rewards. Once a
human has covered its basics needs, secondary needs become the priority.

Jose Banos Sanchez
37 June 6, 2018
Others Rewards. This category is, in general, the less preferred either by managers
(20%) or employees (17%). Among the possible reasons, the uncertainty of a non-
clearly defined or tangible option may have influenced the expert’s feedback.
This research proposes a mix among all four compensation method to motivate
desirable managerial behaviors according to previous outcomes preferences. The
usage of a tool specially designed for this purpose, would add transparency to the
entire process and could provide clear inputs and metrics to managers and
technicians. It will generate a fairer outcome and less unfairness feeling among
employees. This theory and empirical evidence provide significant insights into the
complex relationships among compensation schemes, managers' characteristics and
manager skills, firm performance, and technician’s behavior.
First Level. Main Categories Analysis
The first level in the HDM model represents the main categories to evaluate the
performance evaluation. They should be considered as the root nodes from where
subcategories append. The HDM model has defined five main categories or
perspectives, as explained in the Data Analysis. The following graph shows the

Jose Banos Sanchez
38 June 6, 2018
preferences for each of these main perspectives:
Figure 10. Performance Evaluation Main Categories
Let’s review one by one all these categories, being the Objective metrics the
clear preference for both groups.
Objective Metrics (KPI). It is the preferred method by both groups, managers
(35%) and technicians (32%). Besides, it has the biggest distance to the next option
compared with the rest of categories. This method offers a quantitative mechanism
to evaluate the individual performance. It seems that since all the experts are from
an engineering background, their perception of measuring specific skills or
quantifiable targets is fairer than using other qualitative mechanisms. This was also
studied by Rasmussen (1983) concluding that quantitative performance was more
adequate for skilled-based and highly trained people.
Professional Development. Refreshing the concept definition, the Professional
Development concept evaluates the employees' new learnings. There is a significant
difference between managers and technicians regarding this criteria. For managers,
0.35
0.22 0.210.16
0.07
0.32
0.180.23 0.20
0.11
OBJECTIVE METRICS (KPIS)
PROFESSIONAL DEVELOPMENT
PERFORMANCE REVIEW
SUBJECTIVE METRICS EXTERNAL ACTIVITIES
PERFORMANCE EVALUATION MAIN CATEGORIES
TECHNICIANS MANAGERS

Jose Banos Sanchez
39 June 6, 2018
this option is evaluated as the fourth one (18%). However, for technicians, this is the
second one (22%). Humans tend to appreciate more their own efforts than others do,
and they like to highlight their achievements looking for certain recognition. In this
case, Professional Development is directly related to the employee eagerness to
improve his/her career, dedicating an extra time and effort to get a goal. The
employee understands this effort as something worthy of a reward. Nevertheless, for
managers, this employees’ professional development is out of their control and not
visible as part of the daily activities. This is the conclusion obtained after talking with
experts and why this criterion is more important for technicians than for managers.
Performance Review. The evaluation from direct managers, co-workers and
other people who have interacted with the employee has a similar weight for both
groups, managers (23%) and technicians (21%).
Subjective Metrics. This third option shows the biggest difference in percentage
between managers and technicians. Before analyzing it, the word "subjective" may
add some bias in the experts' opinion, and therefore should be reviewed in a future
research. Technicians (16%) find this option much less important than managers
(20%). The idea of a subjective metric of the quality of the work translates
uncertainty to the technicians. Since human is risk-averse in general, this option is
not desired for people who have to be evaluated. However, for managers the quality
of works matters and probably because they have to evaluate these subcategories it
makes this group more in favor of a higher weight for this option.

Jose Banos Sanchez
40 June 6, 2018
External Activities. There is no special attraction for this option, technicians
(7%) and managers (11%), included after feedback from psychology experts. The
idea of recognition for external activities not related to work seems something
idealistic but not a real option nowadays. However, we know that social responsibility
is growing among companies and consumers. Maybe in a few years, this external
activities will be seen as something important with a direct impact on the daily job.
Second Level. Sub-categories Analysis.
The results for this level are depicted in the following graphs, firstly for Managers
and secondly for Technicians.
Figure 11. Sub categories Average Result from Managers
Level-2 OBJECTIVE METRICS (KPIs) PROFESSIONAL DEVELOPMENT PERFORMANCE REVIEW SUBJECTIVE METRICS EXTERNAL ACTIVITIESINDIVIDUAL 0.45DEPARTMENT 0.39LOCAL/NATIONAL 0.20CERTIFICATIONS 0.43OTHER COURSES 0.23INTERNAL TRAININGS 0.24OTHER COURSES NON RELATED 0.10DIRECT MANAGER 0.34OTHER DEPARTMENT 0.09CO-WORKERS 0.20CUSTOMER 0.25SELF-REVIEW 0.11TEAM BUILDING 0.28CONFLICT RESOLUTION 0.18COMPANY CORE VALUES 0.27TIME MANAGEMENT 0.27NGO COLLABORATION 0.23COMPANY SOCIAL ACTIVITIES 0.42PERSONAL FITNESS 0.34
AVER
AGE
MAN
AGER
S

Jose Banos Sanchez
41 June 6, 2018
Figure 12. Sub categories Average Result from Technicians
In order to understand the results for each set of subcategories appending to each
main category, this paper has drawn different charts for each group and described
the results in the following points.
Objective Metrics (KPI).
Figure 13. Sub categories under Objective Metrics
Level-2 OBJECTIVE METRICS (KPIs) PROFESSIONAL DEVELOPMENT PERFORMANCE REVIEW SUBJECTIVE METRICS EXTERNAL ACTIVITIESINDIVIDUAL 0.53DEPARTMENT 0.25LOCAL/NATIONAL 0.22CERTIFICATIONS 0.42OTHER COURSES 0.21INTERNAL TRAININGS 0.24OTHER COURSES NON RELATED 0.12DIRECT MANAGER 0.28OTHER DEPARTMENT 0.12CO-WORKERS 0.24CUSTOMER 0.24SELF-REVIEW 0.12TEAM BUILDING 0.29CONFLICT RESOLUTION 0.28COMPANY CORE VALUES 0.16TIME MANAGEMENT 0.27NGO COLLABORATION 0.34COMPANY SOCIAL ACTIVITIES 0.38PERSONAL FITNESS 0.28
AVER
AGE
TECH
NIC
IAN
S
INDIVIDUAL DEPARTMENT LOCAL/NATIONALMANAGERS 0.45 0.39 0.20TECHNICIANS 0.53 0.25 0.22
0.00
0.10
0.20
0.30
0.40
0.50
0.60
OBJECTIVE METRICS (KPIs)

Jose Banos Sanchez
42 June 6, 2018
In this case, the conclusion is clear and there is no difference between groups
regarding the order of preferences. Individual performance is above department and
local/national criteria, following that order. If any conclusion should be highlighted, for
technicians (53%) the individual percentage of contribution to the total metric (KPI) is
higher than for managers (45%). We as humans, in general, tend to overestimate
our capabilities and it may explain why technicians gave a higher weight to individual
performance over the department, while managers moderate this value respect the
other two options. It is also interesting to mention that Individual has obtained the
highest weight among all the subcategories. If we notice also that Objective Metrics
was the most important category, we can conclude that Individual performance
within Objective Metrics is the most important subcategory from this research.
Professional Development.
Figure 14. Sub categories under Professional Development
CERTIFICATIONS OTHER COURSES INTERNALTRAININGS
OTHER COURSESNON RELATED
MANAGERS 0.43 0.23 0.24 0.10TECHNICIANS 0.42 0.21 0.24 0.12
0.00
0.05
0.10
0.15
0.20
0.25
0.30
0.35
0.40
0.45
PROFESSIONAL DEVELOPMENT

Jose Banos Sanchez
43 June 6, 2018
For this subcategories, the conclusion is clear and both groups agree in the
order of preferences and even weights are pretty close to each other. Certifications
are the most important metric to be used under the Professional Development.
Technicians (42%) and Managers (43%) consider that knowledge should be
rewarded and the completion of an official certification is a quantitative way to
measure this knowledge. Unlike Other Courses Non-Related which is scored as the
last option because is not adding value to the current job.
Performance Review
Figure 15. Sub categories under Performance Review
For this set of subcategories, there is no clear conclusion based on the different
criteria between managers and technicians. Both groups show a preference for
Direct Manager as the highest sub-criteria to be weighed, but the managers (34%)
show it with a higher weight compared to the technicians (28%). It is reasonable
since this task is actually part of the manager’s job, the evaluation of their
employees. A second noteworthy observation is that Customer feedback is scored
DIRECTMANAGER
OTHERDEPARTMENT CO-WORKERS CUSTOMER SELF-REVIEW
MANAGERS 0.34 0.09 0.20 0.25 0.11TECHNICIANS 0.28 0.12 0.24 0.24 0.12
0.00
0.05
0.10
0.15
0.20
0.25
0.30
0.35
0.40
PERFORMANCE REVIEW

Jose Banos Sanchez
44 June 6, 2018
as second, which highlight the importance of customers and the fruits of the recent
company strategy to be more customer-centric.
Subjective Metrics.
Figure 16. Sub categories under Subjective Metrics
For Subjective Metrics, in Figure 16, there is a noteworthy difference for Conflict
Resolution and Company Core Values. Managers and technicians have concluded
with an inversely proportional weight for these two subcategories. For technicians,
Conflict Resolution got 28% of the total weight and Company Core Values 16% while
for managers is almost the exact same percentage but the other way around.
Company core values may sound like something abstract to the day to day work with
co-workers, other departments, customers, etc. and as a result of this daily
interaction with colleagues, a positive environment is more appreciated by
technicians. This is translated into a higher score to Conflict Resolution. However,
there is no clear understanding regarding the difference between managers and
TEAM BUILDING CONFLICTRESOLUTION
COMPANY COREVALUES
TIMEMANAGEMENT
MANAGERS 0.28 0.18 0.27 0.27TECHNICIANS 0.29 0.28 0.16 0.27
0.00
0.05
0.10
0.15
0.20
0.25
0.30
0.35
SUBJECTIVE METRICS

Jose Banos Sanchez
45 June 6, 2018
technicians and this paper could not obtain any interesting feedback from the experts
about it.
External Activities.
Figure 17. Sub categories under External Activities
External activities are not adding any relevant information based on their results.
Both groups prefer Company Social Activities as the first option. According to one of
our experts, this is a way to do team building and create a better environment in a
more relaxed environment out of the office. Following to the next subcategory, the
managers consider a healthier employee (34%) more important than an employee
with social responsibility commitments (23%). According to one of the managers, a
healthy employee will always be more productive than an employee with bad habits
and health issues. Furthermore, absenteeism will be lower in the first case compared
with the second.
NGO COLLABORATION COMPANY SOCIALACTIVITIES PERSONAL FITNESS
MANAGERS 0.23 0.42 0.34TECHNICIANS 0.34 0.38 0.28
0.00
0.05
0.10
0.15
0.20
0.25
0.30
0.35
0.40
0.45
EXTERNAL ACTIVITIES
Jose Banos Sanchez
46 June 6, 2018
Indirect Analysis of the Results
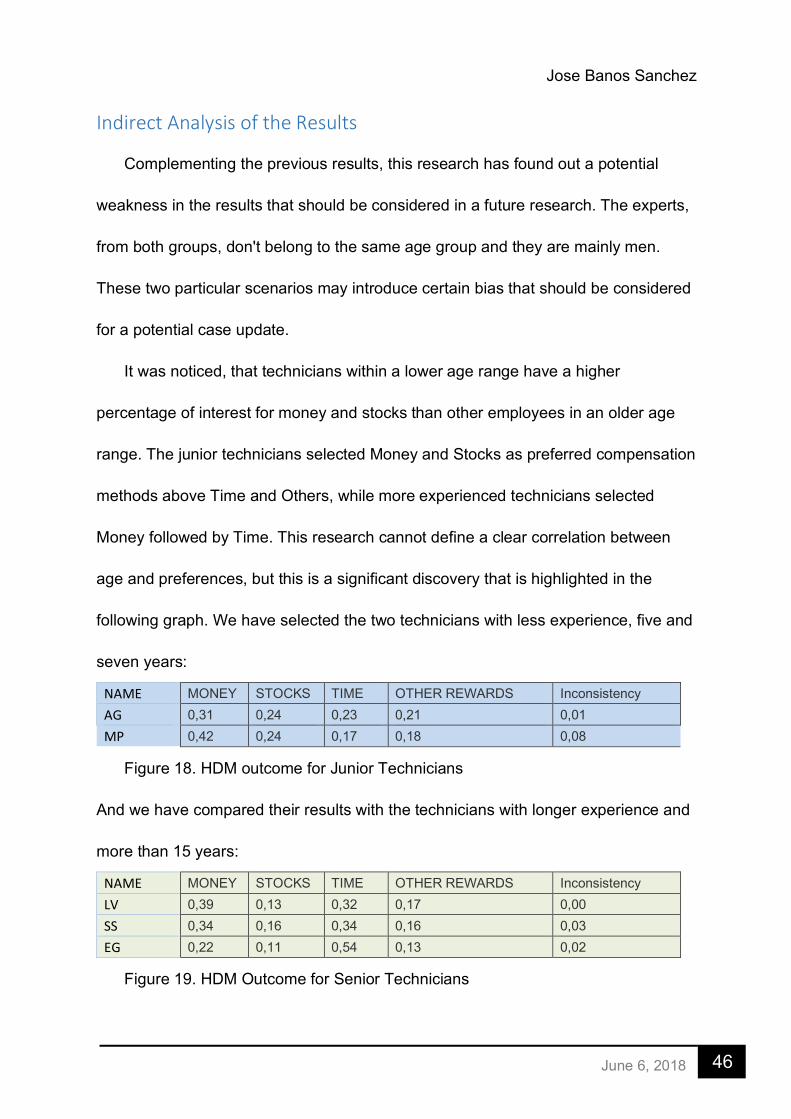
Complementing the previous results, this research has found out a potential
weakness in the results that should be considered in a future research. The experts,
from both groups, don't belong to the same age group and they are mainly men.
These two particular scenarios may introduce certain bias that should be considered
for a potential case update.
It was noticed, that technicians within a lower age range have a higher
percentage of interest for money and stocks than other employees in an older age
range. The junior technicians selected Money and Stocks as preferred compensation
methods above Time and Others, while more experienced technicians selected
Money followed by Time. This research cannot define a clear correlation between
age and preferences, but this is a significant discovery that is highlighted in the
following graph. We have selected the two technicians with less experience, five and
seven years:
NAME MONEY STOCKS TIME OTHER REWARDS Inconsistency AG 0,31 0,24 0,23 0,21 0,01 MP 0,42 0,24 0,17 0,18 0,08
Figure 18. HDM outcome for Junior Technicians
And we have compared their results with the technicians with longer experience and
more than 15 years:
NAME MONEY STOCKS TIME OTHER REWARDS Inconsistency LV 0,39 0,13 0,32 0,17 0,00 SS 0,34 0,16 0,34 0,16 0,03 EG 0,22 0,11 0,54 0,13 0,02
Figure 19. HDM Outcome for Senior Technicians

Jose Banos Sanchez
47 June 6, 2018
The result, expressed as the mean for the two groups is:
Figure 20. Junior vs Senior Technicians Preferences
The graph shows that senior technicians double the percentage of preference for
Time (40%) versus the junior technicians (20%). This enormous difference in the
preference for time could be understood as result of the different
perceptions/preferences between junior technicians and senior technicians. Looking
into some literature, and analyzing more in detail the gap showed by the Figure 20, a
potential explanation could be found looking into the following graph:
0.37
0.240.20 0.20
0.32
0.13
0.40
0.15
MONEY STOCKS TIME OTHER REWARDS
Junion vs Senior Technicians
JUNIOR SENIOR

Jose Banos Sanchez
48 June 6, 2018
Figure 21. Pyramid of needs
When talking about working and personal life, we could say that Physiological
and Safety needs (Basic needs) are covered by monthly salary. This situation is
more significant for senior technicians, who have been working for more years than
junior and have probably built the base of the pyramid. At this point, senior
technicians are looking more to accomplish their psychological needs like
Belongingness and love needs. Family, friends, etc. However, junior technicians are
still in the base of the level of the pyramid, and they have not yet built the security
required to jump into the next level. That is the reason why this group is still
prioritizing the Money and Stocks above the Time.

Jose Banos Sanchez
49 June 6, 2018
FUTURE RESEARCH
The paper has firstly focused in a very specific geographical area, Spain. All the
managers and technicians that have contributed as experts are working in Spain and
have developed most of their careers in this country (even when not all of them are
Spaniards). It means that certain cultural bias could be presented in the results of
this paper, which may be a topic for a different investigation project. Therefore, a
wider research could be done including multiple locations experts or a comparison
between geographical areas following the same concept as described here.
A second idea that remains open is the way that compensation should we
weighted. This paper had as one of the main targets the analysis of potential gaps
between managers and employees when performance compensation methods. But
according to the results for each compensation preference, shown as percentages, a
deeper analysis of the potential combination of the four options could be done. In
some cases like small companies, Stocks are not an option, and therefore a
combination of the other three options is the only alternative.
A third idea coming from the direct feedback from experts was about the
recognition. Many experts, especially technicians, consider that companies may
focus too much on rewards that not include a public recognition. For companies, this
should be a priority for many reasons, but mainly because recognition is free and it
can complement the rewarding and increase the positive effect pursued.
Looking beyond the results, after an individual analysis is done to each
employee in the company, a software tool, capable to adapt the percentages

Jose Banos Sanchez
50 June 6, 2018
assigned to each outcome likely to each subcategory could be designed. It will
create not only an individual performance analysis but a tool to track the results year
after year and show how the compensation help to improve the performance and
employees satisfaction. This personalization could create a feeling of “belonging” to
the company, helping the employees to feel more like part of it, instead of feeling that
they are just employees with a numeric ID.

Jose Banos Sanchez
51 June 6, 2018
REFERENCES [1] Tanner, R. (2018, April 16). Robert Tanner, MBA. Retrieved April 17, 2018, from https://managementisajourney.com/equity-theory-why-employee-perceptions-about-fairness-do-matter/ [2] Messick, David M. and Bazerman, Max H. (1996). Ethical leadership and the Psycology of Decision Making. Sloan Management Review. MIT. Winter 1996. Volume 37, Number2. [3] The Measure of a Man; Schumpeter. (2016, February 20). The Economist (US). Retrieved April 20, 2018 [4] Brazzolotto, Sofia. (2012) Aplicación De La Evaluación De Desempeño Por Competencias A Las Organizaciones. Universidad Nacional de Cuyo. [5] Behn, R. D. (2003). Why Measure Performance? Different Purposes Require Different Measures. Public Administration Review, 63(5), 586-606. doi:10.1111/1540-6210.00322 [6] Hinkin, T. R., & Tracey, J. B. (2000). The cost of turnover: Putting a price on the learning curve [Electronic version]. The Cornell Hotel and Restaurant Administration Quarterly, 41(3), 14-21. Retrieved May 2018, from Cornell University, School of Hospitality Administration site: http://scholarship.sha.cornell.edu/articles/445/ [7] Clemen, R.T., Reilly, T., Bodily, S.E., and Guyse, J. (2014), Making hard decisions with Decision Tools. Mason (OH): South-Western. [8] Purohit, Manisha (Apr. 2016). A Study on - Employee Turnover in IT Sector with Special Emphasis on Wipro and Infosys. IOSR Journal of Business and Management (IOSR-JBM) e-ISSN: 2278-487X, p-ISSN: 2319-7668. Volume 18, Issue 4 .Ver. I, PP 47-51 www.iosrjournals.org [9] Brigham, Hjouj, Kim, and Martin, (2005). "A Multi-criteria Phased Methodology for Personnel Selection". Engineering and Technology Management Student Projects. 1292. [10] Clausen, Thomas S., Jones, Keith T., and Rich, Jay S. (2008). "Appraising Employee Performance Evaluation Systems," CPA JOURNAL, vol. 78, p.64. [11] Liu, C., Hsu, H., Wang, S., & Lee, H. (2005). A Performance Evaluation Model Based On AHP And DEA. Journal of the Chinese Institute of Industrial Engineers,22(3), 243-251. [12] Lansbury, R. (1988). Performance management: A process approach. Human Resource Management, Australia, 46-55. [13] Baker, G. P., Jensen, M. C., & Murphy, K. J. (1998). Compensation and Incentives: Practice vs. Theory. SSRN Electronic Journal. doi:10.2139/ssrn.94029

Jose Banos Sanchez
52 June 6, 2018
[14] Designing an effective pay for performance compensation system: A report to the President and the Congress of the United States. (2006). Washington, DC (1615 M St., N.W., Washington 20419): U.S. Merit Systems Protection Board. [15] Judge, Timothy A., Piccolo, Ronald F., Podsakoff, Nathan P., Shaw, John C., Rich, Bruce L. (2010). The relationship between pay and job satisfaction: A meta-analysis of the literature. Journal of Vocational Behavior 77 (2010) 157–167. [16] Chang, X., Fu, K., Low, A., & Zhang, W. (2015). Non-executive employee stock options and corporate innovation. Journal of Financial Economics,115(1), 168-188. doi:10.1016/j.jfineco.2014.09.002. [17] Taylor, F., Ketcham, A. & Hoffman, D. (1998). Personnel evaluation with AHP. Management Decision, 36(10), pp.679-685. [18] Islam, R., & Rasad, S. M. (2006). Employee performance evaluation by the AHP: A case study. Asia Pacific Management Review, 11(3), 163–176. [19] Porter, T. W., & Lilly, B. S. (1996). The Effects Of Conflict, Trust, And Task Commitment On Project Team Performance. International Journal of Conflict Management, 7(4), 361-376. doi:10.1108/eb022787 [20] Gebhardt, D. L., & Crump, C. E. (1990). Employee fitness and wellness programs in the workplace. American Psychologist, 45(2), 262-272. http://dx.doi.org/10.1037/0003-066X.45.2.262 [21] Kannan, Vijay R. ; Tan, Keah Choon (2005). Just in time, total quality management, and supply chain management: understanding their linkages and impact on business performance. Omega, 2005, Vol.33(2), pp.153-162 [22] Fermin, Jeff. (2015). Why Having Friends At Work Is Important. Retrieved May 12, 2018, from https://www.officevibe.com/blog/infographic-friends-at-work [23] Rodell, J. B. (2013). Finding Meaning through Volunteering: Why Do Employees Volunteer and What Does It Mean for Their Jobs? Academy of Management Journal, 56(5), 1274-1294. doi:10.5465/amj.2012.0611 [24] Nayar, V. (2010). Employees first, customers second: Turning conventional management upside down. Boston, MA: Harvard Business Press. [25] Gerhart, B., Minkoff, H. B. & Olsen, R. N. (1995). Employee compensation: Theory, practice, and evidence (CAHRS Working Paper #95-04). Ithaca, NY: Cornell University, School of Industrial and Labor Relations, Center for Advanced Human Resource Studies. [26] Nickerson, R. S. (1998). Confirmation bias: A ubiquitous phenomenon in many guises. Review of General Psychology, 2(2), 175-220. doi:10.1037//1089-2680.2.2.175 [27] Kohn, A. (1994). A7 Punished by Rewards. Quality Management in Health Care, & NA, 4. doi:10.1097/00019514-199412000-00011 [28] Deci, E. L., Koestner, R., & Ryan, R. M. (1999). A meta-analytic review of experiments examining the effects of extrinsic rewards on intrinsic motivation. Psychological Bulletin, 125(6), 627-668. doi:10.1037//0033-2909.125.6.627

Jose Banos Sanchez
53 June 6, 2018
[29] Tversky, A. & Kahneman, D. (1991). "Loss Aversion in Riskless Choice: A Reference Dependent Model". Quarterly Journal of Economics 106 (4): 1039–1061 [30] Rasmussen, J. (1983). "Skills, rules, and knowledge; signals, signs, and symbols, and other distinctions in human performance models," in IEEE Transactions on Systems, Man, and Cybernetics, vol. SMC-13, no. 3, pp. 257-266, May-June 1983. doi: 10.1109/TSMC.1983.6313160 [30] Rieger, Marc Oliver, Wang, Mei and Hens, Thorsten, (2015). International Evidence on the Equity Premium Puzzle and Time Discounting (June 17, 2015). Multinational Finance Journal, Vol. 17, No. 3/4, p. 149-163, 2013. [31] Heymann, J. (2014). Profit at the Bottom of the Ladder Creating Value by Investing in Your Workforce. Boston: Harvard Business Review Press. [32] Ballard, Paul J. (2013). "Measuring Performance Excellence: Key Performance Indicators for Institutions Accepted into the Academic Quality Improvement Program (AQIP)". Dissertations. 196. [33] Griesser, J.W. (1993) Motivation and information systems professionals. Journal of Managerial Psychology, 8 (3) (1993), pp. 21-30.

Jose Banos Sanchez
54 June 6, 2018
LIST of FIGURES Figure 1. Initial HDM structure proposed by the research. Figure 2. HDM Final Model Figure 3. Managers HDM outcome Figure 4. Managers HDM model significance Figure 5. Technicians HDM outcome Figure 6. Technicians HDM model significance Figure 7. Comparison between Mean and Median for Outcomes Figure 8. HDM models outcome for Managers, Technicians and Combined Figure 9. Comparison of outcomes from Managers and Technicians Figure 10. Performance Evaluation Main Categories Figure 11. Sub categories Average Result from Managers Figure 12. Sub categories Average Result from Technicians Figure 13. Sub categories under Objective Metrics Figure 14. Sub categories under Professional Development Figure 15. Sub categories under Performance Review Figure 16. Sub categories under Subjective Metrics Figure 17. Sub categories under External Activities Figure 18. HDM outcome for Junior Technicians Figure 19. HDM Outcome for Senior Technicians Figure 20. Junior vs Senior Technicians Preferences Figure 21. Pyramid of needs

Jose Banos Sanchez
55 June 6, 2018
INDIVIDUAL RESULTS MANAGERS Expert1
Expert2

Jose Banos Sanchez
56 June 6, 2018
Expert3
Expert4

Jose Banos Sanchez
57 June 6, 2018
Expert5
Expert6

Jose Banos Sanchez
58 June 6, 2018
Expert7
Expert8
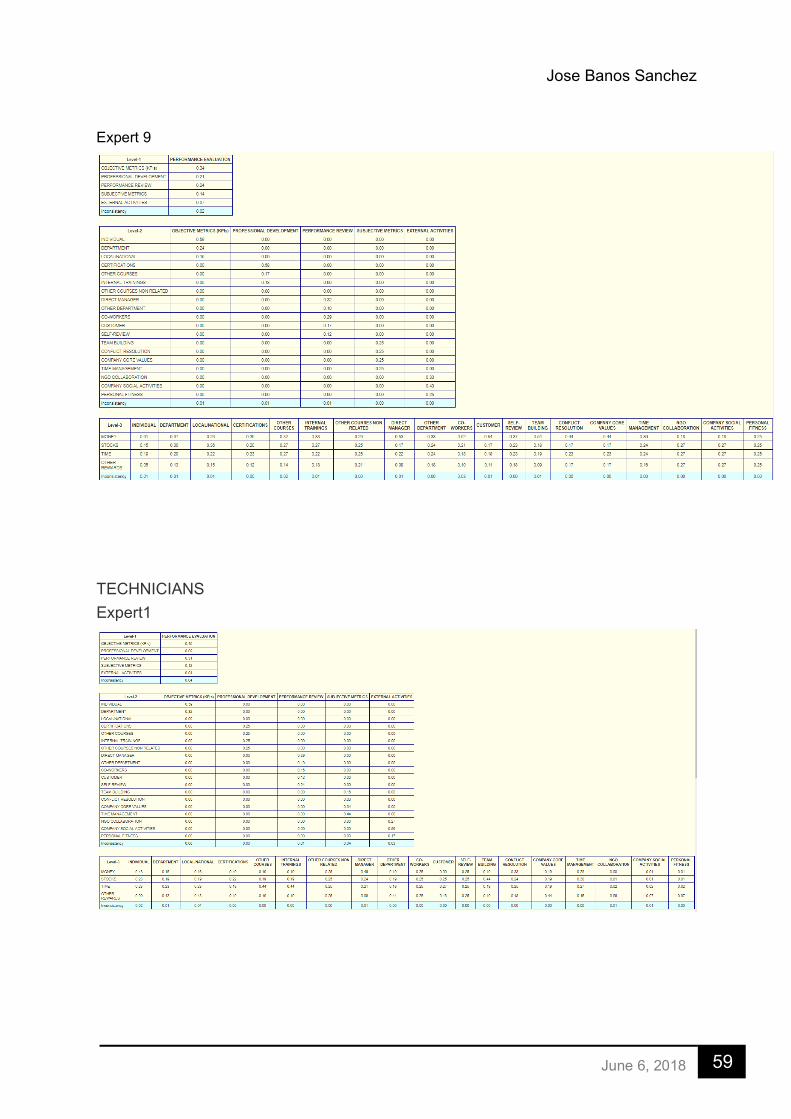
Jose Banos Sanchez
59 June 6, 2018
Expert 9
TECHNICIANS Expert1

Jose Banos Sanchez
60 June 6, 2018
Expert2
Expert3

Jose Banos Sanchez
61 June 6, 2018
Expert4
Expert5

Jose Banos Sanchez
62 June 6, 2018
Expert6
Expert7

Jose Banos Sanchez
63 June 6, 2018
Expert8
Expert9

Jose Banos Sanchez
64 June 6, 2018
Expert10
Expert11