Embed Size (px)
Citation preview
How is the Doctor Feeling?ICU Provider Sentiment is Associated with Diagnostic Imaging Utilization
Mohammad M. Ghassemi†, Tuka Alhanai†, Jesse D. Raffa,Roger G. Mark, Shamim Nemati and Falgun H. Chokshi
Abstract— The judgment of intensive care unit (ICU)providers is difficult to measure using conventional structuredelectronic medical record (EMR) data. However, providersentiment may be a proxy for such judgment. Utilizing 10years of EMR data, this study evaluates the association betweenprovider sentiment and diagnostic imaging utilization. Weextracted daily positive / negative sentiment scores of writtenprovider notes, and used a Poisson regression to estimatesentiment association with the total number of daily imagingreports. After adjusting for confounding factors, we found that(1) negative sentiment was associated with increased imagingutilization (p < 0.01), (2) sentiment’s association was mostpronounced at the beginning of the ICU stay (p < 0.01),and (3) the presence of any form of sentiment increaseddiagnostic imaging utilization up to a critical threshold (p< 0.01). Our results indicate that provider sentiment mayclarify currently unexplained variance in resource utilizationand clinical practice.
I. INTRODUCTION
As the United States (US) national healthcare expenditurecontinues to rise [1], the use of high-cost medical resourceshas come under increased scrutiny [2]. The US Health andHuman Services is already mandating more judicious use ofhigh cost medical resources, motivating investigation into thehistorical drivers of resource utilization, and the developmentof more specific criteria for justifying the utilization of high-cost resources [3]. One prominent example of a high costmedical resource is radiological diagnostic imaging, whichaccounts for nearly 10% of US health-care expenditures [4].Diagnostic imaging (hereafter, imaging) is frequently citedas a high-cost medical resource in need of better definedappropriateness criteria and this year, in an effort to curtailimaging costs, the US Protecting Access to Medicare Actwill mandate the use of clinical decision support tools [3].
†Both authors contributed equally to this work.M.M. Ghassemi is with Department of Electrical Engineering and Com-
puter Science, Massachusetts Institute of Technology,Boston, MA 02139USA. Phone: 617-599-6010. Email: [email protected]
T. Alhanai is with Department of Electrical Engineering and ComputerScience, Massachusetts Institute of Technology,Boston, MA 02139 USA.Email: [email protected]
J.D. Raffa is with the Institute of Medical Engineering and Science,Massachusetts Institute of Technology,Boston, MA 02139 USA. Email:[email protected]
Roger G. Mark is with the Institute of Medical Engineering and Science,Massachusetts Institute of Technology,Boston, MA 02139 USA. Email:[email protected]
S. Nemati is with the Department of Biomedical Infor-matics, Emory University, Atlanta, GA 30322 USA. Email:[email protected]
F.H. Chokshi is with the Department of Radiology and Imaging Services,Emory University School of Medicine, Atlanta, GA 30322 USA. Email:[email protected]
Several studies over the last decade have compared thediagnostic yield and cost-effectiveness of imaging utilizationacross a variety of cohort sizes (from small single centerstudies [5], [6], [7], [8], [9], to large Medicare claims-mining[10], [11]) and patient conditions (including ankle fractures[12], incidental lung nodules [13], altered mental status [5],and head injury [14]). Most of these utilization studies areperformed retrospectively, using structured data from theelectronic medical record (EMR) or administrative claimsdatabases (e.g. Medicare) to identify ordered examinations,diagnoses, and sociodemographic information that are asso-ciated with utilization rates. By relying exclusively on struc-tured data, many retrospective analyses fail to capture thecomplete clinical context considered by health-care providerswhen ordering imaging exams [15], [16].
At the bedside, provider judgment reflects observationsthat may or may not be entirely reflected in structured medi-cal data. It follows that an estimate of this judgment may helpexplain a previously unknown component of the variancein utilization patterns during treatment, and consequently,healthcare costs.
In this paper, we investigate the utility of the sentiment inelectronic provider notes as a proxy of this provider judgment[17]. Specifically, we investigate how provider sentiment is
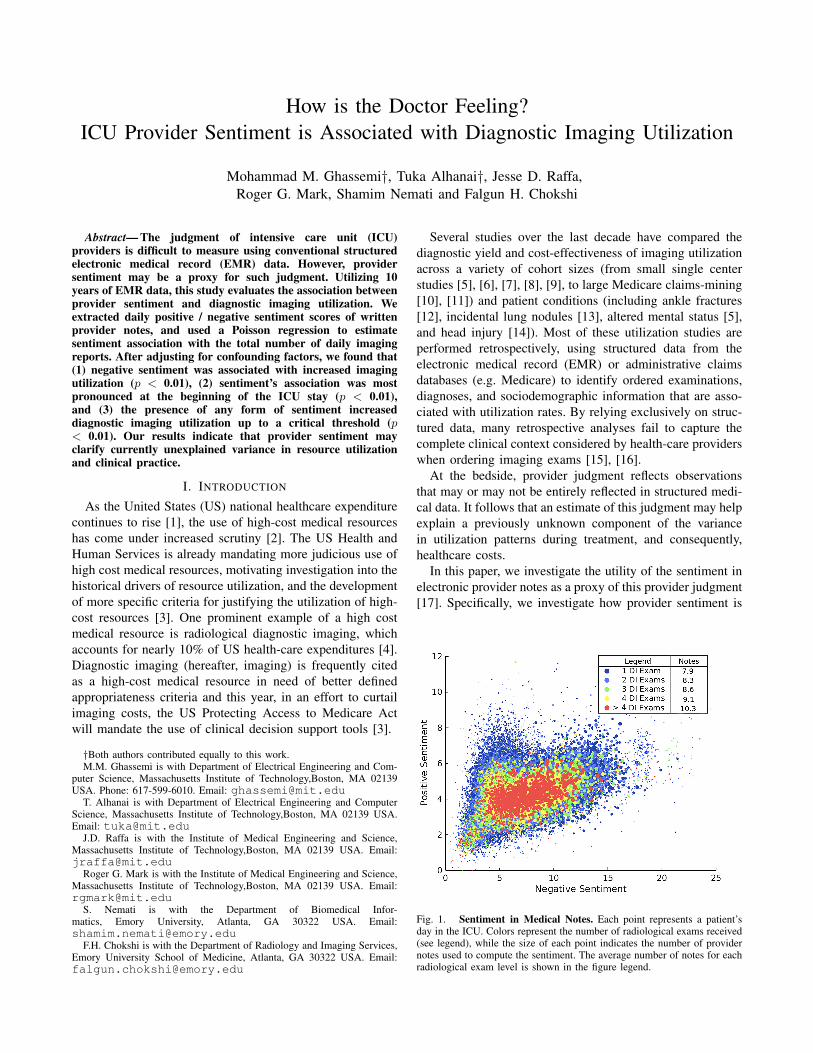
Fig. 1. Sentiment in Medical Notes. Each point represents a patient’sday in the ICU. Colors represent the number of radiological exams received(see legend), while the size of each point indicates the number of providernotes used to compute the sentiment. The average number of notes for eachradiological exam level is shown in the figure legend.

associated with diagnostic imaging utilization, after adjustingfor the effects of severity of illness, comorbidities, and otherfactors.
Sentiment analysis is a branch of natural language pro-cessing (NLP) that combines text analysis and computationallinguistics to assess the emotion or polarity of a piece of text(positive, negative, or neutral) [18]. Sentiment analysis hasbeen used widely in non-healthcare settings, such as socialmedia [19] and newspaper publications [20] to identify andextract text-based sentiment. In the last few years this ap-proach has also found application in the evaluation of health-related topics including health and happiness [21], healthcare satisfaction [22], and health care reform [23]. Evenmore recently, direct analysis of sentiment within medicalrecords has emerged as a topic of research. Applying wordembedding, Ghassemi et al. [17] explored the relationshipbetween provider sentiment, patient demographics, and mor-tality using sentiment analysis of structured and unstructuredEMR data of intensive care unit (ICU) patients. McCoy etal. employed a sentiment estimate to examine associationsbetween sentiment, readmission, and mortality risk usinghospital discharge notes alone [24]. However, no publicationswe are aware of have investigated the association betweenprovider sentiment and resource utilization patterns.
II. OBJECTIVE
This investigation aimed to answer the following two ques-tions: (1) what was the relationship between ICU providersentiment and diagnostic imaging utilization? (2) Was thisrelationship consistent over the course of ICU length of stay,or did it change over time?
III. METHODS
A. Data Sources and Settings
All data for this study were extracted from the pub-licly available Medical Information Mart for Intensive Care(MIMIC-III) database, which contains the structured andunstructured EMR data of over fifty thousand patients fromthe Beth Israel Deaconess Medical Center in Boston MA,from 2001 - 2012 [25]. We were interested in understandingthe association between the sentiment of provider free-textnotes in MIMIC-III, and the total number of daily diagnosticimaging examinations per patient.
B. Study Variables
The outcome of interest was the total number of dailyradiology reports for each ICU patient as a surrogate forthe total number of imaging exams. We extracted a setof continuous and categorical features that we suspected,based on clinical experience, might confound the relationshipbetween provider sentiment and the number of daily imagingexams. The features included: patient age, the SequentialOrgan Failure Assessment Score (SOFA), the Elixhausercomorbidity index [26] and the Oxford Acute Severity ofIllness Score (OASIS) [25], gender (with female being thereference group) and ethnicity (white, black, Hispanic andother, with white as the reference group). We also included
dichotomous indicators for the following conditions: obesity,human immunodeficiency virus infection (HIV), metastaticcancer diagnosis, diabetes and ICU type (with surgical codedas one).
C. Eligibility Criteria and Study Size
The MIMIC-III database contains notes of several distinctcategories. For this analysis we only considered providernotes from the first five days of patient ICU stay whichwere of the following types: Consult, General, Nursing,Nutrition, Pharmacy, Physician, Rehabilitation Services andRespiratory. We excluded the notes of all neonatal patientsand those missing any of the covariates described above.The exclusion criteria reduced the number of distinct notesfrom 697,718 to 283,950, the number of distinct ICU staysfrom 52,420 to 18,607 and the number of distinct days ofdata from 129,624 to 45,728. 76% of the excluded patientswere neonates, while 23% were excluded due to missingcovariates. Figure 2 illustrates the number of ICU stays andnotes removed from our dataset for each step of our exclusioncriteria.
Fig. 2. Study Population. The effects of our exclusion criteria on theinitial sample.
D. Sentiment Features
For every word w in every ICU provider document d,we extracted a corresponding measure of positive sentimentpd,w, and negative sentiment nd,w, according to the firstsense of the word as defined by SentiWordNet [27]. Sen-tiWordNet is an open-source tool that provides both thesentimental polarity (positive or negative) and sentimentalmagnitude (ranging from 0 to 1) of commonly used wordsin the English language. From these scores we estimateddocument level positive and negative sentiment, pd and ndas the average sentiment scores of all words in a givendocument:

pd =1
Md
Md∑w=1
pd,w ; nd =1
Md
Md∑w=1
nd,w
where Md represents the total number of SentiWordNetwords in a document. Finally, a daily patient sentiment scorewas computed as the average of all document-level scores ona given day. This score was multiplied by 100 to aid in itsinterpretation during later modeling. Hence, the word, anddocument sentiment scores are continuous and in the rangeof 0 to 1, while the daily sentiment scores used in all theanalysis of this work are continuous and in the range of 0to 100.
E. Statistical Methods
A multivariable Poisson regression was used to model therelationship between our features and the number of dailyimaging exams while adjusting for potential confounders.Generalized estimating equations (GEE) with a Markovcorrelation structure [28] were used to fit the models. GEE isuseful for our purposes as it accounts for the correlated natureof the observations within each patient, across multiple ICUdays and allows for patients to serve as their own controls.For patient j, on day t, we model our outcome as Yjt ∼Possion(µjt), with a log-linked mean µjt, which can becomputed as a function of our time-varying features xjt:
log(E[yjt|xjt]) = log(µjt) = xjtβ
Where we estimate the coefficients, β , using GEE. It canbe somewhat difficult to interpret a given coefficient (βk) ofa Poisson regression in its raw form:
βk = log(E[y|xk + 1, xk])− log(E[y|xk, xk])
Where xk represents the feature of interest, and xk rep-resents all other features in X. To aid in the interpretationof our model, we report a commonly used transformation ofthese coefficients which reflect the multiplicative effects ofa one unit change in the corresponding feature xk on theoutcome y:
E[y|xk + 1, xk]E[y|xk, xk]
= eβk
This can be interpreted as the ratio of the rates of theoutcome, y, estimated when changing one unit of xk, whilekeeping all other variables the same.
F. Study Design
The investigation began by creating descriptive summariesand visualizations of the population data in both tabular andgraphical formats (Presented in Table I and Figure 1). Visualinspection motivated three targeted analyses.
The first analysis treated sentiment as a continuous quan-tity and assumed a linear relationship between sentiment andthe log rate of diagnostic imaging utilization (Presented inTable II). The second analysis was nearly identical to the
first, but included quadratic terms for the sentiment featuresin the model (Presented in Appendix Table III).In the lastanalysis, we evaluated the modifying effect of the day ofICU stay on the sentiment features associations found in thefirst two parts of the analysis by including day x sentimentinteraction terms for each of the first five days (Presented inFigures 3, 4 and Appendix 5). This allowed us to considercases where the strength of the association between thesentiment variables and the rate of image utilization varies,as the patient stays longer in the ICU.
Statistical significance of the individual coefficients orgroups of coefficients was assessed using Wald tests. In ad-dition to assessing the statistical significance, the QICu [29]of the models were computed with and without the sentimentfeatures to further evaluate any evidence of improved modelfit facilitated by the sentiment variables in predicting therate of imaging utilization. QICu is similar to the AkaikeInformation Criteria, but modified for models fit with GEE.
IV. RESULTS
A. Descriptive Data of Participants and Outcomes
Table I shows summary statistics for the sample of ICUdays partitioned by the number of imaging exams. Figure 1(first page) presents a bubble plot that simultaneously repre-sents the sample’s daily sentiment, number of imaging examreports, and total number of written ICU provider notes. Thefigure reveals visually that the number of imaging exams(represented by color) decreases as positive sentiment (y-axis) increases. The plot also reveals a potential curvilinearrelationship between sentiment and imaging utilization. Thatis, increased negative sentiment (x-axis) is associated withan increased number of imaging exams (color), up until anegative sentiment value of approximately ten, after which
TABLE ISUMMARY STATISTICS. EXTRACTED FEATURES FOR THE PATIENT
POPULATION, PARTITIONED BY THE NUMBER OF DAILY IMAGING
EXAMS. OASIS: OXFORD ACUTE SEVERITY OF ILLNESS SCORE.SOFA: SEQUENTIAL ORGAN FAILURE ASSESSMENT.
EXAMS PER DAY 1 2 3 4Sample Size (Days) 25,455 11,867 4,829 3,548
CONTINOUS FEATURES (Mean [Standard Deviation])Age 65.1 (16) 64.1 (17) 63.2 (17) 61.6 (17.5)OASIS 30.6 (9) 30.9 (9) 31.5 (9) 32.2 (9)Elixhauser 4.0 (2) 3.9 (2) 3.9 (2.1) 3.9 (2.1)SOFA 3.7(3) 4.0 (3) 4.4 (3.2) 4.8 (3.2)
CATEGORICAL FEATURES (%)Diabetes 29.3 27.4 25.5 25.2HIV infection 1.2 1.3 1.1 1.1Ethnicity - Hispanic 3.6 3.7 3.15 4.2Ethnicity - Black 7.3 7.1 6.8 7.9Ethnicity - Other 15.6 15.9 16.2 14.2Gender (Male) 57.0 58.3 59.0 60.1Cancer 5.6 6.1 6.2 5.8Obesity 6.7 6.6 6.2 6.8ICU Type (Surgical) 17.2 19.8 22.5 22.1
SENTIMENT FEATURES (Mean [Standard Deviation])Negative 6.3 (2.6) 6.4 (2.4) 6.4 (2.3) 6.5 (2.2)Positive 4.4 (1.2) 4.3 (0.9) 4.3 (0.8) 4.2 (0.7)
additional negative sentiment is associated with fewer exams.This would suggest that the maximum rate of image utiliza-tion might occur at some intermediate levels of sentiment.
B. Main Results
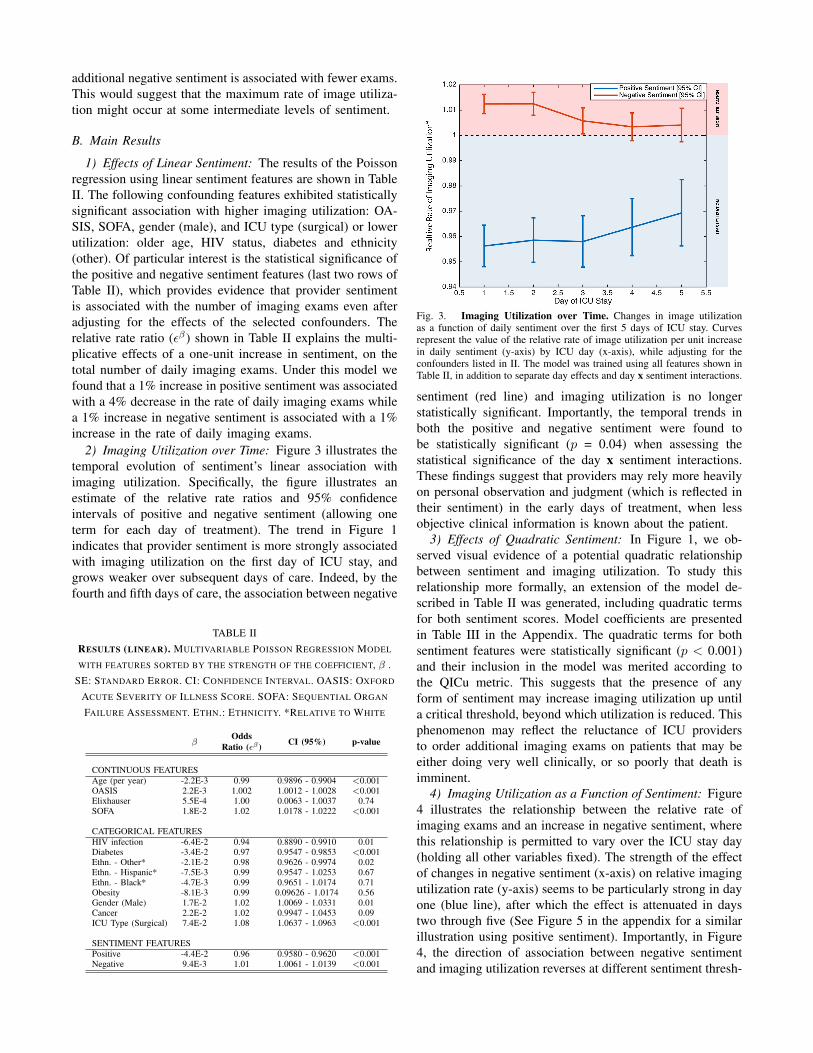
1) Effects of Linear Sentiment: The results of the Poissonregression using linear sentiment features are shown in TableII. The following confounding features exhibited statisticallysignificant association with higher imaging utilization: OA-SIS, SOFA, gender (male), and ICU type (surgical) or lowerutilization: older age, HIV status, diabetes and ethnicity(other). Of particular interest is the statistical significance ofthe positive and negative sentiment features (last two rows ofTable II), which provides evidence that provider sentimentis associated with the number of imaging exams even afteradjusting for the effects of the selected confounders. Therelative rate ratio (εβ) shown in Table II explains the multi-plicative effects of a one-unit increase in sentiment, on thetotal number of daily imaging exams. Under this model wefound that a 1% increase in positive sentiment was associatedwith a 4% decrease in the rate of daily imaging exams whilea 1% increase in negative sentiment is associated with a 1%increase in the rate of daily imaging exams.
2) Imaging Utilization over Time: Figure 3 illustrates thetemporal evolution of sentiment’s linear association withimaging utilization. Specifically, the figure illustrates anestimate of the relative rate ratios and 95% confidenceintervals of positive and negative sentiment (allowing oneterm for each day of treatment). The trend in Figure 1indicates that provider sentiment is more strongly associatedwith imaging utilization on the first day of ICU stay, andgrows weaker over subsequent days of care. Indeed, by thefourth and fifth days of care, the association between negative
TABLE IIRESULTS (LINEAR). MULTIVARIABLE POISSON REGRESSION MODEL
WITH FEATURES SORTED BY THE STRENGTH OF THE COEFFICIENT, β .SE: STANDARD ERROR. CI: CONFIDENCE INTERVAL. OASIS: OXFORD
ACUTE SEVERITY OF ILLNESS SCORE. SOFA: SEQUENTIAL ORGAN
FAILURE ASSESSMENT. ETHN.: ETHNICITY. *RELATIVE TO WHITE
βOdds
Ratio (εβ ) CI (95%) p-value
CONTINUOUS FEATURESAge (per year) -2.2E-3 0.99 0.9896 - 0.9904 <0.001OASIS 2.2E-3 1.002 1.0012 - 1.0028 <0.001Elixhauser 5.5E-4 1.00 0.0063 - 1.0037 0.74SOFA 1.8E-2 1.02 1.0178 - 1.0222 <0.001
CATEGORICAL FEATURESHIV infection -6.4E-2 0.94 0.8890 - 0.9910 0.01Diabetes -3.4E-2 0.97 0.9547 - 0.9853 <0.001Ethn. - Other* -2.1E-2 0.98 0.9626 - 0.9974 0.02Ethn. - Hispanic* -7.5E-3 0.99 0.9547 - 1.0253 0.67Ethn. - Black* -4.7E-3 0.99 0.9651 - 1.0174 0.71Obesity -8.1E-3 0.99 0.09626 - 1.0174 0.56Gender (Male) 1.7E-2 1.02 1.0069 - 1.0331 0.01Cancer 2.2E-2 1.02 0.9947 - 1.0453 0.09ICU Type (Surgical) 7.4E-2 1.08 1.0637 - 1.0963 <0.001
SENTIMENT FEATURESPositive -4.4E-2 0.96 0.9580 - 0.9620 <0.001Negative 9.4E-3 1.01 1.0061 - 1.0139 <0.001
Fig. 3. Imaging Utilization over Time. Changes in image utilizationas a function of daily sentiment over the first 5 days of ICU stay. Curvesrepresent the value of the relative rate of image utilization per unit increasein daily sentiment (y-axis) by ICU day (x-axis), while adjusting for theconfounders listed in II. The model was trained using all features shown inTable II, in addition to separate day effects and day x sentiment interactions.
sentiment (red line) and imaging utilization is no longerstatistically significant. Importantly, the temporal trends inboth the positive and negative sentiment were found tobe statistically significant (p = 0.04) when assessing thestatistical significance of the day x sentiment interactions.These findings suggest that providers may rely more heavilyon personal observation and judgment (which is reflected intheir sentiment) in the early days of treatment, when lessobjective clinical information is known about the patient.
3) Effects of Quadratic Sentiment: In Figure 1, we ob-served visual evidence of a potential quadratic relationshipbetween sentiment and imaging utilization. To study thisrelationship more formally, an extension of the model de-scribed in Table II was generated, including quadratic termsfor both sentiment scores. Model coefficients are presentedin Table III in the Appendix. The quadratic terms for bothsentiment features were statistically significant (p < 0.001)and their inclusion in the model was merited according tothe QICu metric. This suggests that the presence of anyform of sentiment may increase imaging utilization up untila critical threshold, beyond which utilization is reduced. Thisphenomenon may reflect the reluctance of ICU providersto order additional imaging exams on patients that may beeither doing very well clinically, or so poorly that death isimminent.
4) Imaging Utilization as a Function of Sentiment: Figure4 illustrates the relationship between the relative rate ofimaging exams and an increase in negative sentiment, wherethis relationship is permitted to vary over the ICU stay day(holding all other variables fixed). The strength of the effectof changes in negative sentiment (x-axis) on relative imagingutilization rate (y-axis) seems to be particularly strong in dayone (blue line), after which the effect is attenuated in daystwo through five (See Figure 5 in the appendix for a similarillustration using positive sentiment). Importantly, in Figure4, the direction of association between negative sentimentand imaging utilization reverses at different sentiment thresh-

Fig. 4. Imaging Utilization as a Function of Sentiment. The associationbetween negative sentiment (y-axis) and imaging utilization over time forthe model with linear and quadratic sentiment terms. Curves represent theestimated relative rate of image utilization per unit increase in negativesentiment, estimated separately for each ICU day. A value of one isinterpreted as no effect. The model was trained using all features shownin Table III (Appendix) in addition to separate day effects, as well as bothday x sentiment and day x sentiment2 interactions. See the last paragraphof the results section for an explanation of points A-F.
olds, on different days. On day one (blue line), the initialeffects of negative sentiment are associated with increasedimaging utilization (see point A, on blue line). The strengthof the association between negative sentiment and increasedimaging utilization continues to grow, up until a negativesentiment value of approximately ten (see point B, on blueline). While values of negative sentiment between ten andtwenty continue to be associated with increased imaging uti-lization, the strength of this association weakens, eventuallycausing negative sentiment to be associated with significantlyless imaging utilization (see point C, on blue line). Thereis a similar general relationship between negative sentimentand utilization on day three (orange line). However, thestrength of the association is significantly less pronounced,with a maximum imaging utilization effect of 1.1 on daythree, compared to 1.35 on day one. Furthermore, while anegative sentiment value of ten had a strong association withutilization on day one (see point B, on blue line), the samelevel of negative sentiment has no effect on day 3 (see pointD, on orange line), and had a negative association on dayfive (see point E, on green line). Indeed, by the fifth dayof treatment (green line), negative sentiment only serves todecrease utilization, and more rapidly reaches the point ofzero utilization (see point F, on green line) than any otherday. A Wald test for the statistical significance of the day xsentiment interactions was statistically significant (p = 0.04),and the QICu was the lowest of any model we fit.
V. DISCUSSION
A. Key Results
This study presented a novel investigation of the associa-tion between ICU provider sentiment and imaging utilization.While many studies have investigated imaging utilizationusing structured data, none to date have managed to isolatethe specific effects of provider judgment or observation
on imaging utilization as we have shown in this study.Furthermore, prospective study of clinical intent is, as yet,impractical because requiring clinicians to report their intentmay artificially alter their utilization behavior. The resultsof this paper may be summarized in the following fourpoints: (1) there was a statistically significant associationbetween ICU provider sentiment and imaging utilization;(2) in general, positive sentiment was associated with lessimaging exams performed, while negative sentiment wasassociated with more exams; (3) provider sentiment thatwas strongly positive, or strongly negative, was associatedwith decreased imaging utilization; and (4) the associationbetween sentiment and imaging utilization was strongest onthe first day of ICU stay and grew gradually weaker overtime.
B. Significance
This is the first study to investigate how provider sentimentis associated with diagnostic imaging utilization, after adjust-ing for the effects of severity of illness, age, comorbidities,and length of ICU stay. Although we focused on imagingutilization, the implications of this work extend well beyondimaging. As a proxy for decision-making judgment, senti-ment analysis has significant potential to assess utilizationof other resources, such as laboratory tests, use of ancillaryservices, and discharge/transfer decisions. It may also helpexplain variance in other areas of clinical practice, includingmedication dosing [30], and decisions to withdraw care [31].
C. Limitations
One potential limitation of this study is that the word-level sentiment scores provided by SentiWordNet were notdesigned to account for the complexities of provider notesor specialized medical language. SentiWordNet does not in-corporate established medical lexicon and ontology sources,such as the Unified Medical Language System (UMLS [32]),Systematized Nomenclature of Medicine Clinical Terms(SNOWMED CT [33]), and Disease Ontology [34]. Whilethis may be interpreted as a weakness of the presented ap-proach, it may also be interpreted as a strength: we were notinterested in the sentiment of the medical terms, but rather,the aggregate sentiment of the individual care providers, adimension that is orthogonal to the clinical and physiologicalfactors reflected in specialized clinical language of the notes.
D. Interpretation
Importantly, this work demonstrates that even the simplestestimates of ICU provider sentiment may have both statis-tically and clinically significant associations with imagingutilization. Provider sentiment showed independent effectson imaging utilization after controlling for patient sociode-mographic factors (i.e., age, gender, race), comorbidities,severity of illness, and time in the ICU. We conclude that ourmeasure of provider sentiment reflects something about theobservations and judgment of the care provider that is notcaptured by the structured medical data alone. This additionalclinical dimension has been missing in studies that have

evaluated imaging utilization in high-cost health care settings[10], [5], [6], [7], [8], [11], [9]. In the current healthcareenvironment of increased scrutiny of high cost resources, thenovel measure of provider judgment proposed in this studycould better help calibrate clinical decision support systemsto include the effects of clinical sentiment as a proxy ofjudgment.
Our results provide strong motivation for further inves-tigation of the association between provider sentiment andpatterns of resource use, namely imaging utilization. Indeed,our results may serve as a valuable baseline as more so-phisticated techniques are developed or deployed (e.g. deeplearning) [35]. With further development, investigators maybegin to take steps towards providing actionable adjustmentsto ordering practices on the basis of sentiment analysis. Itshould be possible to design a decision support tool thatprovides additional input for high-cost decisions where thereis a large difference between the expected and observedsentiment of the providers, or where multiple providers haveconflicting sentiment about the same patient.
ACKNOWLEDGEMENTS
M.M. Ghassemi would like to acknowledge the Salernofoundation, The NIH Neuroimaging Training Grant (NTP-T32 EB 001680), the Advanced Neuroimaging TrainingGrant (AMNTP T90 DA 22759). T. Alhanai acknowl-edges the Abu Dhabi Education Council for their support.F.H. Chokshi would like to acknowledge the Associationof University Radiologists (AUR) General Electric Radiol-ogy Research Academic Fellowship (GERRAF). S. Nematiwould like to acknowledge the support of the NIH earlycareer development award in biomedical big data science(K01ES025445). R.G. Mark, and J.D. Raffa would like toacknowledge the support of the NIH Critical Care Informat-ics Grant (R01-EB017205) and the NIH Research Resourcefor Complex Physiologic Signals Grant (R01-GM104987).
REFERENCES
[1] A. B. Martin, M. Hartman, J. Benson, A. Catlin, N. H. E. A. Teamet al., “National health spending in 2014: Faster growth driven bycoverage expansion and prescription drug spending,” Health Affairs,vol. 35, no. 1, pp. 150–160, 2016.
[2] B. Chang, J. Lorenzo, and A. Macario, “Examining health carecosts: Opportunities to provide value in the intensive care unit,”Anesthesiology clinics, vol. 33, no. 4, pp. 753–770, 2015.
[3] S. M. Burwell, “Setting value-based payment goalshhs efforts toimprove us health care,” N Engl J Med, vol. 372, no. 10, pp. 897–9,2015.
[4] W. Howell. (2014) Imaging utilization trends and reimbursement.[Online]. Available: www.diagnosticimaging.com/reimbursement/imaging-utilization-trends-and-reimbursement
[5] F. H. Chokshi, G. Sadigh, W. Carpenter, J. Kang, R. Duszak Jr, andF. Khosa, “Altered mental status in icu patients: Diagnostic yield ofnoncontrast head ct for abnormal and communicable findings,” CriticalCare Medicine, vol. 44, no. 12, pp. e1180–e1185, 2016.
[6] N. Desai, J. Kang, and F. Chokshi, “Screening ct angiography forpediatric blunt cerebrovascular injury with emphasis on the cervicalseatbelt sign,” American Journal of Neuroradiology, vol. 35, no. 9, pp.1836–1840, 2014.
[7] G. Moulin-Romsee, A. Maes, D. Silverman, L. Mortelmans, andK. Van Laere, “Cost-effectiveness of 18f-fluorodeoxyglucose positronemission tomography in the assessment of early dementia from abelgian and european perspective,” European journal of neurology,vol. 12, no. 4, pp. 254–263, 2005.
[8] D. M. Panczykowski, N. D. Tomycz, and D. O. Okonkwo, “Compara-tive effectiveness of using computed tomography alone to exclude cer-vical spine injuries in obtunded or intubated patients: meta-analysis of14,327 patients with blunt trauma: A review,” Journal of neurosurgery,vol. 115, no. 3, pp. 541–549, 2011.
[9] P. Sanelli, A. Pandya, A. Segal, A. Gupta, S. Hurtado-Rua, J. Ivanidze,K. Kesavabhotla, D. Mir, A. Mushlin, and M. Hunink, “Cost-effectiveness of ct angiography and perfusion imaging for delayedcerebral ischemia and vasospasm in aneurysmal subarachnoid hem-orrhage,” American Journal of Neuroradiology, vol. 35, no. 9, pp.1714–1720, 2014.
[10] F. H. Chokshi, D. R. Hughes, J. M. Wang, M. E. Mullins, C. M.Hawkins, and R. Duszak, “Diagnostic radiology resident and fel-low workloads: a 12-year longitudinal trend analysis using nationalmedicare aggregate claims data,” Journal of the American College ofRadiology, vol. 12, no. 7, pp. 664–669, 2015.
[11] A. M. Prabhakar, A. S. Misono, J. Hemingway, D. R. Hughes, andR. Duszak, “Medicare utilization of vascular ultrasound from 1998to 2013: Continued growth in both radiologist and nonradiologistimaging,” Journal of the American College of Radiology, 2015.
[12] P. C. Silveira, I. K. Ip, S. Sumption, A. S. Raja, S. Tajmir, andR. Khorasani, “Impact of a clinical decision support tool on adherenceto the ottawa ankle rules,” The American journal of emergencymedicine, 2015.
[13] M. T. Lu, D. A. Rosman, C. C. Wu, M. D. Gilman, H. B. Harvey, D. A.Gervais, T. K. Alkasab, J.-A. O. Shepard, G. W. Boland, and P. V.Pandharipande, “Radiologist point-of-care clinical decision supportand adherence to guidelines for incidental lung nodules,” Journal ofthe American College of Radiology, vol. 13, no. 2, pp. 156–162, 2016.
[14] E. R. Melnick, J. Keegan, and R. A. Taylor, “Redefining overuse toinclude costs: A decision analysis for computed tomography in minorhead injury,” The Joint Commission Journal on Quality and PatientSafety, vol. 41, no. 7, pp. 313–313, 2015.
[15] J. M. Madden, M. D. Lakoma, D. Rusinak, C. Y. Lu, and S. B.Soumerai, “Missing clinical and behavioral health data in a large elec-tronic health record (ehr) system,” Journal of the American MedicalInformatics Association, vol. 23, no. 6, pp. 1143–1149, 2016.
[16] M. S. Ridgely and M. D. Greenberg, “Too many alerts, too muchliability: sorting through the malpractice implications of drug-druginteraction clinical decision support,” . Louis UJ Health L. & Pol’y,vol. 5, p. 257, 2011.
[17] M. M. Ghassemi, R. G. Mark, and S. Nemati, “A visualization ofevolving clinical sentiment using vector representations of clinicalnotes,” in Computing in Cardiology Conference (CinC), 2015, Sept2015, pp. 629–632.
[18] B. Pang, L. Lee, and S. Vaithyanathan, “Thumbs up?: sentimentclassification using machine learning techniques,” in Proceedings ofthe ACL-02 conference on Empirical methods in natural languageprocessing-Volume 10. Association for Computational Linguistics,2002, pp. 79–86.
[19] G. Ranco, D. Aleksovski, G. Caldarelli, M. Grcar, and I. Mozetic,“The effects of twitter sentiment on stock price returns,” PloS one,vol. 10, no. 9, p. e0138441, 2015.
[20] Y. Lei, J. A. Pereira, S. Quach, J. A. Bettinger, J. C. Kwong, K. Corace,G. Garber, Y. Feinberg, M. Guay, P. H. A. of Canada/CanadianInstitutes of Health Research Influenza Research Network (PCIRN)Program Delivery, E. Group et al., “Examining perceptions aboutmandatory influenza vaccination of healthcare workers through onlinecomments on news stories,” PloS one, vol. 10, no. 6, p. e0129993,2015.
[21] F. Greaves, D. Ramirez-Cano, C. Millett, A. Darzi, and L. Donaldson,“Use of sentiment analysis for capturing patient experience from free-text comments posted online,” Journal of medical Internet research,vol. 15, no. 11, p. e239, 2013.
[22] L. Mitchell, M. R. Frank, K. D. Harris, P. S. Dodds, and C. M.Danforth, “The geography of happiness: Connecting twitter sentimentand expression, demographics, and objective characteristics of place,”PloS one, vol. 8, no. 5, p. e64417, 2013.
[23] D. King, D. Ramirez-Cano, F. Greaves, I. Vlaev, S. Beales, andA. Darzi, “Twitter and the health reforms in the english national healthservice,” Health policy, vol. 110, no. 2, pp. 291–297, 2013.
[24] T. H. McCoy, V. M. Castro, A. Cagan, A. M. Roberson, I. S. Kohane,and R. H. Perlis, “Sentiment measured in hospital discharge notes isassociated with readmission and mortality risk: An electronic healthrecord study,” PloS one, vol. 10, no. 8, p. e0136341, 2015.

[25] A. E. Johnson, A. A. Kramer, and G. D. Clifford, “A new severity ofillness scale using a subset of acute physiology and chronic healthevaluation data elements shows comparable predictive accuracy*,”Critical care medicine, vol. 41, no. 7, pp. 1711–1718, 2013.
[26] A. Elixhauser, C. Steiner, D. R. Harris, and R. M. Coffey, “Comorbid-ity measures for use with administrative data,” Medical care, vol. 36,no. 1, pp. 8–27, 1998.
[27] S. Baccianella, A. Esuli, and F. Sebastiani, “Sentiwordnet 3.0: Anenhanced lexical resource for sentiment analysis and opinion mining.”in LREC, vol. 10, 2010, pp. 2200–2204.
[28] J. Shults and S. J. Ratcliffe, “Geeqbox: A matlab toolbox for gen-eralized estimating equations and quasi-least squares,” Journal ofStatistical Software, vol. 25, no. 14, 2008.
[29] W. Pan, “Akaike’s information criterion in generalized estimatingequations,” Biometrics, vol. 57, no. 1, pp. 120–125, 2001.
[30] M. M. Ghassemi, S. E. Richter, I. M. Eche, T. W. Chen, J. Danziger,and L. A. Celi, “A data-driven approach to optimized medicationdosing: a focus on heparin,” Intensive care medicine, vol. 40, no. 9,pp. 1332–1339, 2014.
[31] R. Pirracchio, M. L. Petersen, M. Carone, M. R. Rigon, S. Chevret, andM. J. van der Laan, “Mortality prediction in intensive care units withthe super icu learner algorithm (sicula): a population-based study,” TheLancet Respiratory Medicine, vol. 3, no. 1, pp. 42–52, 2015.
[32] C. Lindberg, “The unified medical language system (umls) of thenational library of medicine.” Journal (American Medical RecordAssociation), vol. 61, no. 5, p. 40, 1990.
[33] M. Q. Stearns, C. Price, K. A. Spackman, and A. Y. Wang, “Snomedclinical terms: overview of the development process and projectstatus.” in Proceedings of the AMIA Symposium. American MedicalInformatics Association, 2001, p. 662.
[34] L. M. Schriml, C. Arze, S. Nadendla, Y.-W. W. Chang, M. Mazaitis,V. Felix, G. Feng, and W. A. Kibbe, “Disease ontology: a backbone fordisease semantic integration,” Nucleic acids research, vol. 40, no. D1,pp. D940–D946, 2012.
[35] K. S. Tai, R. Socher, and C. D. Manning, “Improved semantic rep-resentations from tree-structured long short-term memory networks,”arXiv preprint arXiv:1503.00075, 2015.
APPENDIX
TABLE IIIRESULTS (QUADRATIC). MULTIVARIABLE POISSON REGRESSION
MODEL WITH FEATURES SORTED BY THE STRENGTH OF THE
COEFFICIENT, β . SE: STANDARD ERROR. CI: CONFIDENCE INTERVAL.OASIS: OXFORD ACUTE SEVERITY OF ILLNESS SCORE. SOFA:
SEQUENTIAL ORGAN FAILURE ASSESSMENT. ETHN.: ETHNICITY.*RELATIVE TO WHITE
βOdds
Ratio (εβ ) CI (95%) p-value
CONTINUOUS FEATURESAge (per year) -2.1E-3 0.99 0.9896 - 0.9904 <0.001OASIS 2.2E-3 1.002 1.0012 - 1.0028 <0.001Elixhauser 1.8E-3 0.99 0.9863 - 0.9937 0.92SOFA 1.8E-2 1.02 1.0178 - 1.0222 <0.001
CATEGORICAL FEATURESHIV infection -6.5E-2 0.94 0.8890 - 0.9910 0.02Diabetes -3.4E-2 0.97 0.9547 - 0.9853 <0.001Ethn. Other* -1.1E-2 0.99 0.9728 - 1.0072 0.37Ethn. Hispanic* -8.7E-3 0.99 0.9547 - 10253 0.51Ethn. Black* -4.2E-3 0.99 0.9651 - 1.0149 0.46Obesity -6.1E-3 0.99 0.9626 - 1.0174 0.68Gender (Male) 1.7E-2 1.02 1.0069 - 1.0331 0.004Cancer 2.1E-2 1.02 0.9947 - 1.0453 0.27ICU Type (Surgical) 7.3E-2 1.08 1.0637 - 1.0963 <0001
SENTIMENT FEATURESPositive 0.37 1.45 1.4486 - 1.4514 <0.001Negative 0.045 1.05 1.0304 - 1.0696 <0.001(Positive)2 (unit2) -0.045 0.95 0.9441 - 0.9559 <0.001(Negative)2 (unit2) -0.002 0.99 0.9892 - 0.9908 <0.001
Fig. 5. Imaging Utilization as a Function of Positive Sentiment. Theeffect of positive sentiment (y-axis) on imaging utilization over time forthe model with linear and quadratic sentiment terms. Curves represent theestimated relative rate of image utilization per unit increase in positivesentiment, estimated separately for each ICU day. A value of one isinterpreted as no effect. The model was trained using all features shownin Appendix Table III in addition to separate day effects, as well as bothday x sentiment and day x sentiment2 interactions.