Embed Size (px)
Citation preview
Centre for Research in Social PolicyLoughborough University
How is public policy affecting people’s ability to make ends meet?
CRSP PresentationProfessor Donald Hirsch

Introduction • The Minimum Income Standard (MIS) represents what families need for
an acceptable standard of living, according to members of the public.
• Public policies setting minimum wages, tax rates and benefit rates affect the ability of households to reach this standard, and how far those on low incomes fall short.
• This analysis: – Compares the living standards of different household types to MIS in 2010, now and
2022, relative to the minimum required; – Breaks down the effect of different policies on household incomes in 2022; – Identifies three key trends in income adequacy.
• Specifically, it considers working age households, either out of work or
earning the National Minimum Wage for over-25s. Families with children are assumed to live in social rented house and people without children in a low cost privately rented house.

Change in shortfalls compared to MIS, 2010-2022
-£30
-£111
-£43
-£124
-£15
-£132 -£140
-£120
-£100
-£80
-£60
-£40
-£20
£0
Working full time on minimumwage
On out of work benefits
2010
2017
2022
Disposable income compared to MIS, £ per week, 2017 prices
A. Single person (over 25)
• Single people on the minimum wage are falling further short of what they need, but the National Living Wage will help them catch up.
• Out of work singles are falling ever further short of a minimum income.
• By 2022, out-of-work benefits are projected to provide only 31% of what a single needs, leaving them £132 per week short.
Figures based on Universal Credit system for 2022 only, and assume that benefits uprated by CPI after 2019/20

Change in shortfalls compared to MIS, 2010-2022
Disposable income compared to MIS, £ per week, 2017 prices
B. Lone parent, children aged 4 and 7
• Working lone parents on the Minimum Wage were able to get to around MIS in 2010, helped by tax credits. Now they fall well short.
• In the next five years, their overall incomes will remain broadly the same, but only assuming uprating with inflation is restored in 2020.
• Out of work lone parents will continue to get worse off under present policies. The family shown here will face a shortfall of £155 per week by 2022, or 42% of their required budget.
Figures based on Universal Credit system for 2022 only, and assume that benefits uprated by CPI after 2019/20.
-£155
-£87
-£64
-£146
-£78 -£71
-£109
-£13
-£5
-£180
-£160
-£140
-£120
-£100
-£80
-£60
-£40
-£20
£0
Out of workPart time, withchildcare
Full time, withchildcare
2022
2017
2010
Change in shortfalls compared to MIS, 2010-2022
Disposable income compared to MIS, £ per week, 2017 prices
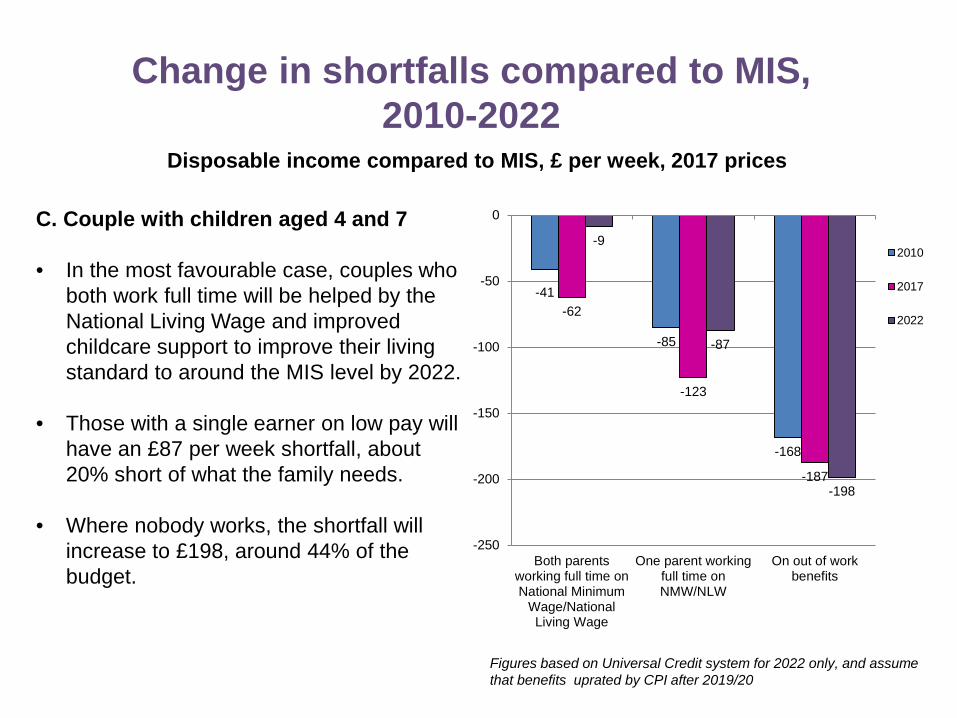
C. Couple with children aged 4 and 7
• In the most favourable case, couples who both work full time will be helped by the National Living Wage and improved childcare support to improve their living standard to around the MIS level by 2022.
• Those with a single earner on low pay will have an £87 per week shortfall, about 20% short of what the family needs.
• Where nobody works, the shortfall will
increase to £198, around 44% of the budget.
Figures based on Universal Credit system for 2022 only, and assume that benefits uprated by CPI after 2019/20
-41
-85
-168
-62
-123
-187
-9
-87
-198
-250
-200
-150
-100
-50
0
Both parentsworking full time onNational Minimum
Wage/NationalLiving Wage
One parent workingfull time onNMW/NLW
On out of workbenefits
2010
2017
2022

Policy effects Focusing on policies with widespread impact, the next five slides show how policies to raise pay, lower taxes and reduce welfare affect various working families receiving Universal Credit and starting a family after April 2017. Specifically, they project the effect of past and current policies on net weekly household incomes by the end of this Parliament (2022) of: • Raising Income Tax allowances faster than inflation, since 2010; • Raising the minimum wage for over-25s faster than average earnings, since 2010; • Abolishing the first-child premium in Universal Credit (equivalent to Family Element of
Child Tax Credit), for which all families getting tax credits have been eligible; • Reducing the Universal Credit Work Allowance in 2016, then freezing it (compared to
increasing it with average earnings, which would keep constant the percentage of earnings withdrawn through the taper, for someone with an average pay rise).
• Reducing the Universal Credit taper from 65% to 63% in 2017 • Uprating most benefits more slowly than inflation, since 2010. The following 2 slides then summarise policy impacts on out of work individuals and families. All figures are shown in 2017 prices.
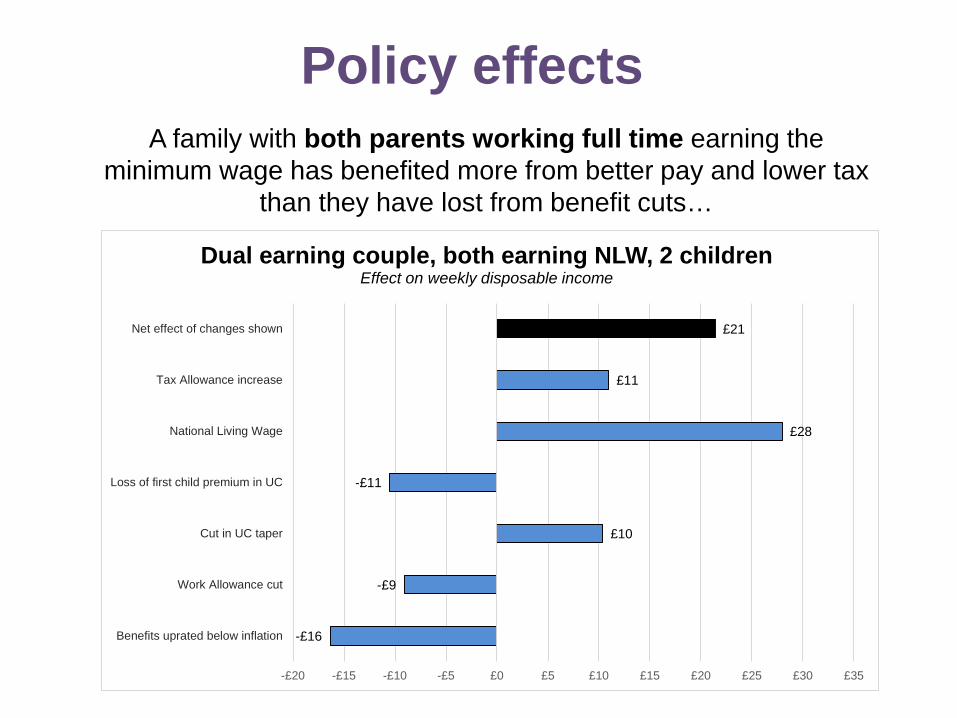
A family with both parents working full time earning the minimum wage has benefited more from better pay and lower tax
than they have lost from benefit cuts…
Policy effects
-£16
-£9
£10
-£11
£28
£11
£21
-£20 -£15 -£10 -£5 £0 £5 £10 £15 £20 £25 £30 £35
Benefits uprated below inflation
Work Allowance cut
Cut in UC taper
Loss of first child premium in UC
National Living Wage
Tax Allowance increase
Net effect of changes shown
Dual earning couple, both earning NLW, 2 children Effect on weekly disposable income

…but for a couple where one parent works part time and the other full time, the net gain is smaller…
Policy effects
-£16
-£9
£8
-£11
£24
£8
£8
-£20 -£15 -£10 -£5 £0 £5 £10 £15 £20 £25 £30
Benefits uprated below inflation
Work Allowance cut
Cut in UC taper
Loss of first child premium in UC
National Living Wage
Tax allowance increase*
Net effect of changes shown
Parents working full time + half time, both earning NLW, 2 children
Effect on weekly disposable income in 2022
*NB tax allowance gain includes Married Tax Allowance, worth £1.85 a week to this family

…and for a “single breadwinner” couple, with the other parent not working, smaller tax and wage gains create a net loss…
Policy effects
*NB tax allowance gain includes Married Tax Allowance, worth £1.85 a week to this family
-£16
-£9
£5
-£11
£14
£8
-£7
-£20 -£15 -£10 -£5 £0 £5 £10 £15 £20
Benefits uprated below inflation
Work Allowance cut
Cut in UC taper
Loss of first child premium in UC
National Living Wage
Tax allowance increase*
Net effect of changes shown
Couple with one full-time worker on NLW, 2 children
Effect on weekly disposable income in 2022
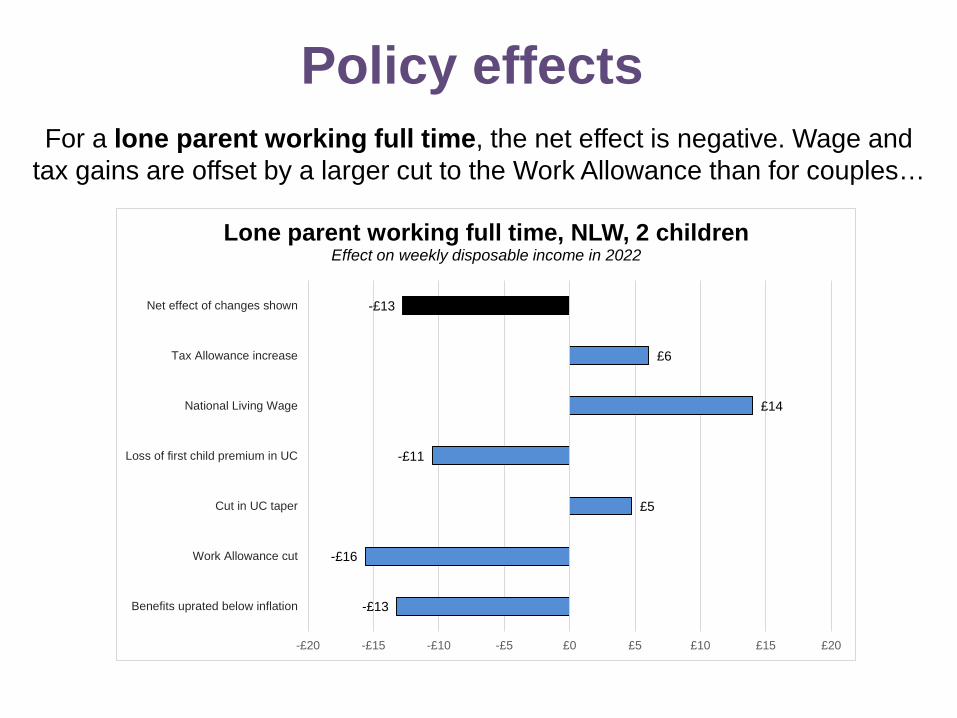
For a lone parent working full time, the net effect is negative. Wage and tax gains are offset by a larger cut to the Work Allowance than for couples…
Policy effects
-£13
-£16
£5
-£11
£14
£6
-£13
-£20 -£15 -£10 -£5 £0 £5 £10 £15 £20
Benefits uprated below inflation
Work Allowance cut
Cut in UC taper
Loss of first child premium in UC
National Living Wage
Tax Allowance increase
Net effect of changes shown
Lone parent working full time, NLW, 2 children Effect on weekly disposable income in 2022

…and for a lone parent working part time, the policy effects have been overwhelmingly negative.
Policy effects
-£13
-£16
£2
-£11
£10
£0
-£28
-£35 -£30 -£25 -£20 -£15 -£10 -£5 £0 £5 £10 £15
Benefits uprated below inflation
Work Allowance cut
Cut in UC taper
Loss of first child premium in UC
National Living Wage
Tax Allowance increase
Net effect of changes shown
Lone parent working half time, NLW, 2 children Effect on weekly disposable income in 2022

Overall for working families, things have improved only for those with two working parents, with at least one working full time. However, only one in three working families below a Minimum Income Standard is in that situation. The pattern of winners and losers shown above is most benign for those with less need for help. In-work support is particularly important for families with part-time or irregular work, and for lone parents. Many of these families have caring responsibilities. The following two slides show the effect on out-of-work households.
Policy effects – family work patterns matter
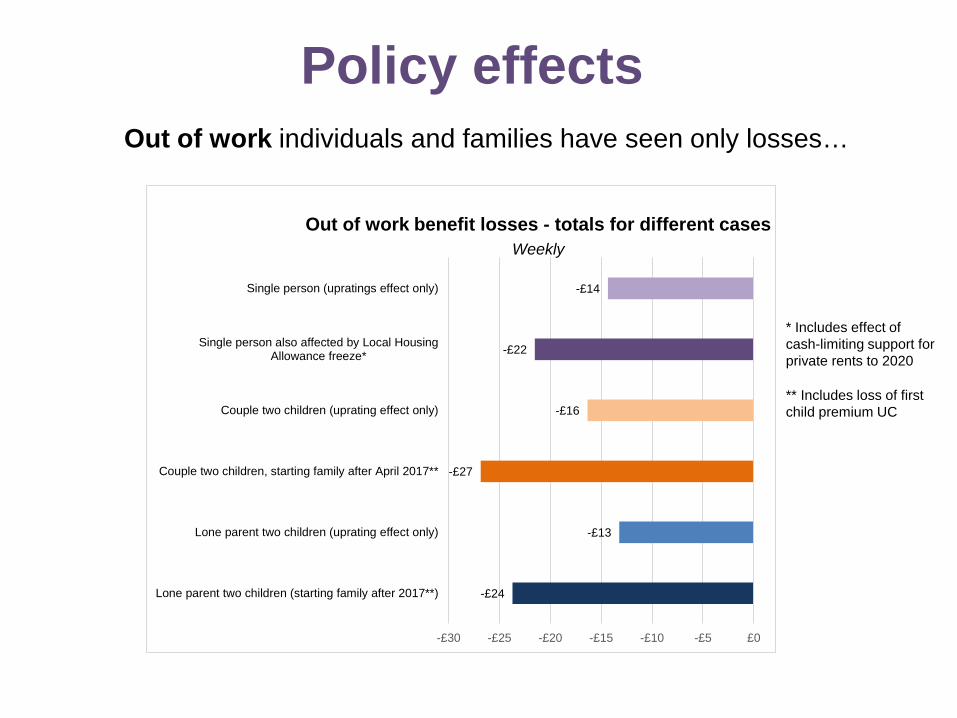
Out of work individuals and families have seen only losses…
Policy effects
* Includes effect of cash-limiting support for private rents to 2020
** Includes loss of first child premium UC
-£24
-£13
-£27
-£16
-£22
-£14
-£30 -£25 -£20 -£15 -£10 -£5 £0
Lone parent two children (starting family after 2017**)
Lone parent two children (uprating effect only)
Couple two children, starting family after April 2017**
Couple two children (uprating effect only)
Single person also affected by Local HousingAllowance freeze*
Single person (upratings effect only)
Out of work benefit losses - totals for different cases Weekly

…and some bigger cuts will add to the losses of selected out of work families
Policy effects
*Two-child limit applied to UC entitlement if third child born after 2017
-£104
-£62
-£67
-£28
-£16
-£120 -£100 -£80 -£60 -£40 -£20 £0
Couple three children: Benefits cap (private renting)
Couple three children benefits cap (social housing)
Couple three children: upratings effect plus "two child limit"
Couple two children: upratings effect plus "bedroom tax"
Baseline case: couple two children upratings effect only
Out of work benefit losses - totals for different cases Weekly

For working families, living standards are also highly dependent on how much, if anything, they spend on childcare. Changing policies have had important effects on the net cost to families. We compare two families: Family a) has children aged 4 and 7. Their childcare costs are contained by free provision (school and Early Years entitlement for 3 and 4 year olds), and improved childcare support brings net gains.
Additional policy effects: childcare
£7
£35
-£23
£19
-£30 -£20 -£10 £0 £10 £20 £30 £40
2017 - free childcare hours for 3 and 4 year olds increased from 15to 30 hours*
2016 - Universal Credit support raised to 85%
2011 - tax credit support reduced from 80% to 70%
Net effect of changes shown
Family a: Children aged 4 and 7 Weekly, based on 2017 childcare costs
*Net benefit of 15 extra free childcare hours based on family on Universal Credit, who was paying only 15% of this cost.

Family b) has children aged 1 and 3. With no free childcare for the 1 year old, high childcare expenses are increasingly likely to exceed the fixed cap on childcare support in Universal Credit, if it is not raised. The consequence will be high additional costs to families, outweighing other gains.
Additional policy effects: childcare
*Net benefit of 15 extra free childcare hours based on family on Universal Credit, who was paying only 15% of this cost. ** Cap on eligible childcare for support has remained at £175 for one and £300 for two children, since 2005. This family’s costs exceed £300.
-£56
£7
£55
-£37
-£30
-£80 -£60 -£40 -£20 £0 £20 £40 £60 £80
By 2022: effect of freeze on cap on support in UniversalCredit**
2017 - free childcare hours for 3 and 4 year olds increasedfrom 15 to 30 hours*
2016 - Universal Credit support raised to 85%
2011 - tax credit support reduced from 80% to 70%
Net effect of changes shown
Family b: Children aged 1 and 3 Weekly

Three key trends in income adequacy 1. The safety net is declining Out of work benefits are projected to have fallen from about two thirds to about half of what is needed for families, and to little over a quarter for singles without children
MIS LEVEL = 100%
41%
Single 31%
68% Lone parent + 2 children
58%
62%
Couple 2 children 56%
0%
10%
20%
30%
40%
50%
60%
70%
80%
90%
100%
2010 2017 2022
Dis
posa
ble
inco
me
as a
per
cent
age
of M
IS b
udge
t
Shortfall in disposable
income compared to MIS
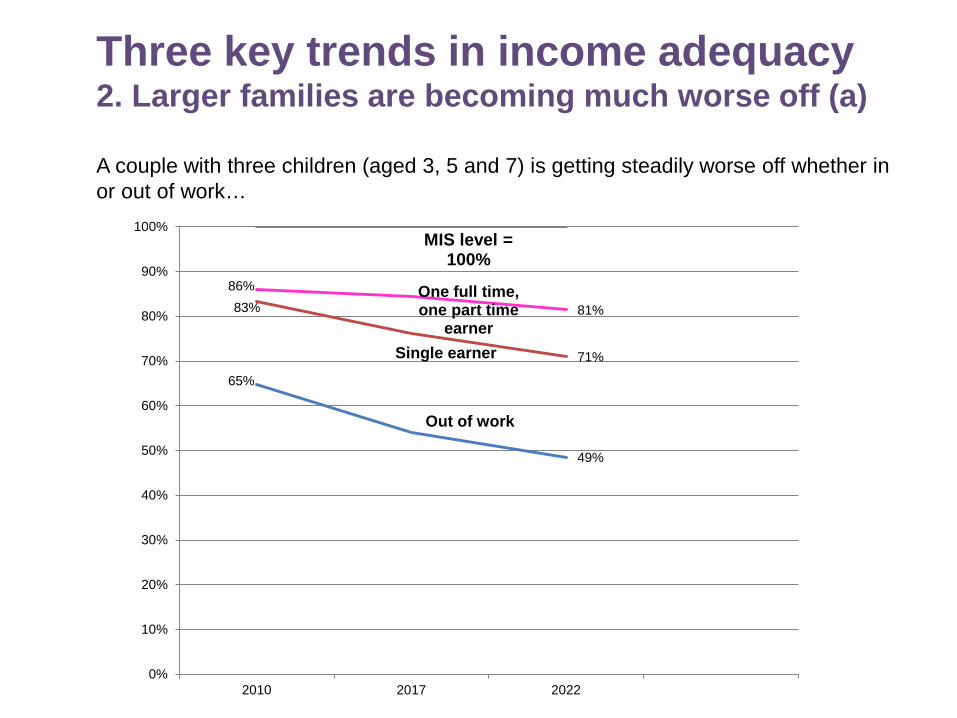
Three key trends in income adequacy 2. Larger families are becoming much worse off (a) A couple with three children (aged 3, 5 and 7) is getting steadily worse off whether in or out of work…
65%
Out of work
49%
83%
Single earner 71%
86% One full time, one part time
earner 81%
MIS level = 100%
0%
10%
20%
30%
40%
50%
60%
70%
80%
90%
100%
2010 2017 2022

Three key trends in income adequacy 2. Larger families are becoming much worse off (b) A lone parent with three children (aged 3, 5 and 7) could nearly reach MIS by working on the Minimum Wage in 2010. By 2022, a full-timer could fall further short than an out-of-work lone parent did in 2010.
MIS level = 100%
70% Out of work
52%
97%
Working full time
66%
0%
10%
20%
30%
40%
50%
60%
70%
80%
90%
100%
2010 2017 2022
MIS level = 100%
Out of work
Working full time

3. Overall, families with young children, particularly lone parents, are caught between worsening out of work benefits and the freeze in childcare support
Parents are not expected to work until their youngest child is 3, but an out of work lone parent faces declining living standards. In the past, part time work would bring an adequate living standard, but no longer does. By working full time this lone parent is barely better off than not working as the high cost of childcare means they exceed the cap for support.
Lone parent with children aged 1 and 3: disposable income as % of Minimum Income Standard
MIS level = 100%
72%
Out of work 58%
104%
Working part time
75% Working full time
61%
0%
20%
40%
60%
80%
100%
120%
2010 2017 2022

Summary of family winners and losers Change in income relative to MIS: percentage points, 2010-2022
Couple parents
One child Two children Three children
Baby Preschool Primary 2ndary 1 and 3 4 and 7 8 and 12 4, 7 and 9 Out of work -13% -13% -9% -11% -9% -6% -6% -16%
Single full-time earner -4% -4% -1% -4% -3% 0% -2% -13% One working full time, one part time, no childcare -4% -4% -3% -7% 0% +3% +1% -6%
One working full time, one part time, with childcare -7% -4% -3% 10% -9% +5% +1% -5% Both full time, no childcare +16% +16% +16% 0% 8% +8% +5% -2%
Both full time with childcare -23% -1% -1% 0% -15% +7% +2% -6%
Almost all lone parents, and couples where one or both parents do not work, are falling further behind. Some dual-earner couples, are making modest gains, but others with high childcare costs are losing out.
<-20 -11 to -20 -1 to -10 0 +1 to +10 >+10 Key: percentage point change
Lone parent
One child Two children Three children
Baby Preschool Primary 2ndary 1 and 3 4 and 7 8 and 12 4, 7 and 9 Out of work -17% -16% -12% -13% -14% -10% -10% -18%
Part time, no childcare -25% -24% -19% -21% -24% -19% -18% -27% Part time, with childcare -30% -25% -20% 0% -29% -20% -18% -28%
Full time, no childcare -19% -18% -13% -16% -15% -11% -11% -20% Full time, with childcare -45% -17% -13% 0% -42% -16% -12% -31%
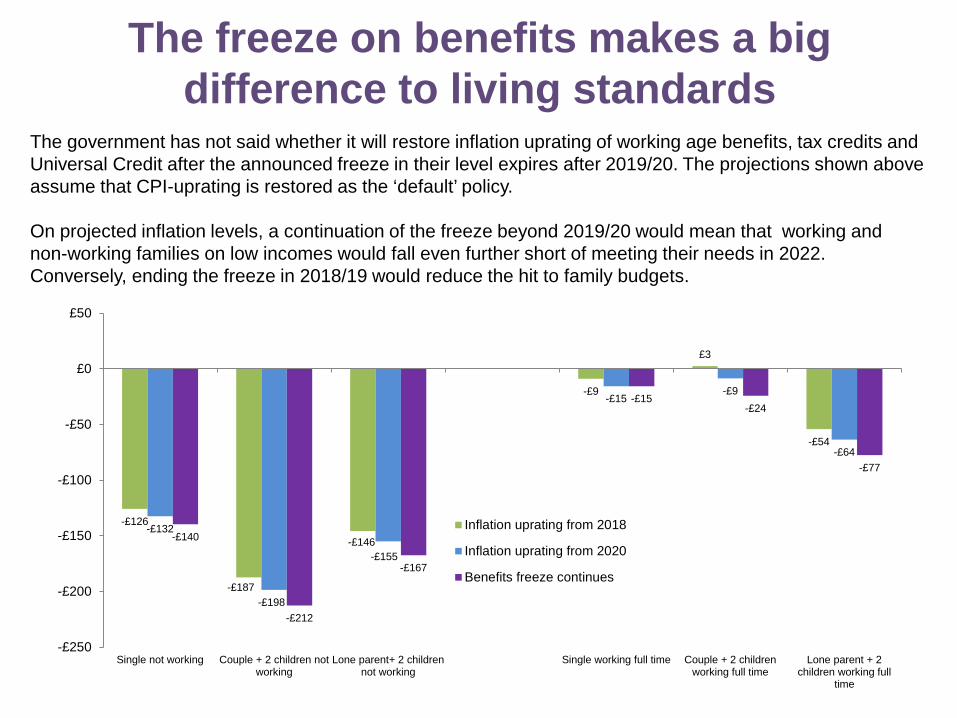
The freeze on benefits makes a big difference to living standards
The government has not said whether it will restore inflation uprating of working age benefits, tax credits and Universal Credit after the announced freeze in their level expires after 2019/20. The projections shown above assume that CPI-uprating is restored as the ‘default’ policy. On projected inflation levels, a continuation of the freeze beyond 2019/20 would mean that working and non-working families on low incomes would fall even further short of meeting their needs in 2022. Conversely, ending the freeze in 2018/19 would reduce the hit to family budgets.
-£126
-£187
-£146
-£9
£3
-£54
-£132
-£198
-£155
-£15 -£9
-£64
-£140
-£212
-£167
-£15 -£24
-£77
-£250
-£200
-£150
-£100
-£50
£0
£50
Single not working Couple + 2 children notworking
Lone parent+ 2 childrennot working
Single working full time Couple + 2 childrenworking full time
Lone parent + 2children working full
time
Inflation uprating from 2018
Inflation uprating from 2020
Benefits freeze continues
Conclusions • Most low income families have got worse off relative to their minimum
needs, and many will continue to do so. The main exceptions are dual earner parents without high childcare costs and childless people who work full time.
• Present policies give selective help alongside continuing cuts. The less work there is in the family, the more that the cuts hurt and the less that the help offsets them.
• The worst hit families are those with three or more children, lone parents and those with younger children who need to pay a lot for childcare in order to work.
• Failing to uprate incomes during a period of inflation is will soon mean families must live on half of what they need if they do not work, and working will only allow them to make up a limited proportion of the shortfall.

Centre for Research in Social PolicyLoughborough University
LeicestershireLE11 3TU